
Novel Gas Turbine Challenges to Support the Clean Energy Transition


Department of Industrial, Electronic and Mechanical Engineering, ROMA TRE University, via della Vasca Navale 79, 00146 Rome, Italy
*
Author to whom correspondence should be addressed.
Energies 2022, 15(15), 5474; https://doi.org/10.3390/en15155474
Submission received: 18 June 2022
/
Revised: 22 July 2022
/
Accepted: 25 July 2022
/
Published: 28 July 2022
(This article belongs to the Special Issue Developing the World in 2021 with Clean and Safe Energy)
Abstract
:The ongoing energy transformation, which is fueled by environmentally cautious policies, demands a full synergy with existing back-up gas turbines (GTs). Renewable energy sources (RESs), such as wind and solar, are intermittent by nature and present large variations across the span of the day, seasons, and geographies. The gas turbine is seen as an essential part of the energy transition because of its superior operational flexibility over other non-renewable counterparts, such as hydro and nuclear. Besides the technical aspects, the latter are less popular due to controversies associated with safety, ecological, and social aspects. GTs can produce when required and with acceptable reaction times and load ranges. This allows a balance between the energy supply and demand in the grid, mitigating the variations in RESs. The increased cycling due to operational flexibility has adverse effects on GT components and the unit efficiency. The latter dictates how well GTs make use of the burned fuel and influence the emissions per energy unit. This paper investigates these aspects. First, it presents the effects of increased penetration of renewable energy sources (RESs) into the grid. Second, it defines the new operation requirements including more dynamic load regimes, the provision for high occurrences of starts and stops, continuous and variant load cycling operations, extended partial loading or stand-by, and other conditions not foreseen under the classic baseload or cyclic operations. Finally, it proposes the overhauling of the present GT inspection and lifing criteria to meet the new role of GTs.
1. Introduction
The need to reform our energy sources, while continuing to power an increasing global population (and its modernization aspirations), is an extraordinary task.
The most obvious complication is the increasing gap between the energy supply and demand. Well-established traditional fossil-fueled plants, such as those driven by steam and gas turbines, produce large output power. They are continuous and can be turned on/off when needed and to the required output range (within the rated limits of the plant). These characteristics, not present in renewable energy sources, make the clean energy transition one of the most difficult challenges of the 21st century. This is particularly valid when adding cost and reliability to the discussion.
Transitioning to carbon free (or low carbon)-based energies is seen as the solution to limit the harmful emissions resulting from burning hydrocarbon fuels. As a result, environmentally friendly policies, although with different ambition levels, are on the rise. Factors such as affordable fuels, availability of required technologies, and so on, are important influential parameters.
Europe is a good example of environmentally driven energy policies, where the RESs used in power generation are forecasted to reach 50% by 2030 and 65% by 2050. While this is projected by the European Commission’s EUCO30 scenario, other projections are beyond 80% of the total energy sources [1].
During this phase, gas turbine-based plants, i.e., gas–steam combined plants, are positioned at the front and center. The popularity of such plants, considering the overall competitive electricity market, is summarized by Cerri et al. [2] as follows:
- Excellent operational flexibility and maintainability;
- Relatively low investment costs;
- High electrical efficiencies.
The operational flexibility refers to the GT’s ability to produce at different load levels by regulating the fuel rate and having good cycling properties, including start up and shut down, and ramp (up/down) rates. Higher GT flexibility, especially in terms of running at minimum power levels, enables larger RES penetration. These characteristics provide an energy buffer to mitigate the complex risks associated with the RES penetration, especially in terms of voltage stability of the electrical networks. It is estimated that the present conventional power plants can deliver flexibility up to a level corresponding to 50% RES shares (wind and solar), regardless of the technical cycling parameters [3]. Moreover, the operational flexibility of GT-based plants can be improved by the integration with energy storage systems. The latter are seen as underpinning technologies to meet the challenges associated with the clean energy transition and have seen notable rise in research to support higher RES penetration. Storage technologies are often classified based on the physical way they are stored [4]:
- Mechanical: Pumped Hydro (PHS), Compressed Air (CAES), and Flywheel (FES);
- Electromechanical: Secondary Battery Lead-acid/NaS/Li-ion and Flow Battery;
- Electrical: Capacitor/Supercapacitor and Superconducting Magnetic (SMES);
- Thermochemical: Solar fuels and Solar hydrogen;
- Chemical: Hydrogen and Fuel cell/Electrolyzer;
- Thermal: Sensible/latent heat storage.
Researchers such as in [5,6,7,8] have discussed different classes of storage technologies and some basis for comparing them. There are numerous parameters that define the technical and economical performance of a storage system. For this reason, a fare comparison ground would be in terms of their application. The storage sources’ role to provide reliable reserve for intermittent energy sources have been analyzed in [9,10,11,12,13,14,15,16,17,18,19,20,21,22]. This is with consideration to different energy scenarios and RES penetration levels. The most suitable methods in terms of energy flexibility are capable of handling utility-scale capacity 1–100 MW for quite long time, with charging/discharging periods (in the order of hours or days) [13].
Rydh and Sandén [15] presented a model to simulate the battery energy storage systems (BESS). This enables the evaluation of the BESS’ performance (efficiency, cycle and lifetime) as well as economic viability. Nyamdash et al [23] analyzed the economics of dedicated large-scale storage, supporting large wind penetration. They concluded that in the Irish case, where they focused their study, the storage efficiency must be at least 92% to break even. Judging on the whole of researched technologies referenced above, criteria such as maturity level, installed power, charge/discharge time periods, and cost have been partially/ fully utilized. In this respect, and based on the research survey, three technologies including PHS, BES and CAES are shown to be real contenders in the race against intermittency.
First, PHS is presently the most viable energy storage system for large-scale electricity. It represents the only mature solution with a wide range of grid management services, ranging from peak power production to ancillary services. Additionally, it offers charging/discharging period durations in the order of a few hours to a few days, a long operating life (up to 100 years), and high efficiency (70–80%) 5. PHS, however, is not expected to expand in the future. This is because candidate sites have been used or cannot be exploited due to environmental concerns.
Second, BES is available in the range of 1–30 MW. Large-scale BES installations are feasible by placing batteries in a parallel arrangement to achieve the requisite capacities. At present, three types of batteries are considered commercially viable solutions, including sodium–sulfur (Na–S), lead–acid (Pb–acid), and lithium-ion (Li-ion) batteries. Rydh and Sandén [15] compared their energies, charge/discharge efficiencies, and service lives. Their energy efficiencies are 0.75–0.83, 0.7–0.84, and 0.85–0.95, respectively. Li-ion showed the best service life. Assuming an 80% depth of discharge (DOD), their cycle lives are reported at 4.5–5.0 and 5.0–7.0 k-cycles for Na–S and Li-ion batteries, respectively. Batteries used as RES back-up are expected to cycle daily, in which case the cycle lives are the main determining factor for their usefulness in service. These ranges obviously decrease in the case of 100% DOD. Furthermore, BES’ mass production is expected to improve its production efficiency [15].
Third, CAES is based on compressing air into reservoirs, which may be natural caves or artificial. It is based on storing heat energy at periods of a surplus power supply (i.e., off-peak power) and reinjecting it at peak demand. The cycle is inverted, and the high pre-ssure is then used to drive turbines, as the air is slowly heated and released. In a conventional diabatic CAES, natural gas is burned in an expansion turbine, while adiabatic CAES stores the heat generated from compressed air and uses it to re-heat expanding air during the generation cycle [24]. At the present, only diabatic CAES is considered a mature technology with two plants so far installed globally. The first is the Huntorf power plant commissioned in 1978 in Germany, and the second application is the 110 MW McIntosh power station in the United States. The latter was commissioned in 1991. CAES research has gained momentum in the past ten years because apart from hydro pumps, it is the only high-capacity storage method (50–300 MW) considered available at this time [23]. Emerging technologies such as gas storage (hydrogen and methane) are under investigation for large-scale applications. Additionally, the stored energy (in the case of CAES) can be used for more than one year, and the start-up time is 9 and 12 min for emergency and normal conditions, respectively [24]. The downsides of CAES at the present is the low efficiency and high cost. These have triggered several proposed solutions, diverging from the presently installed plants, such as those presented in [25,26,27,28,29,30]. Igie et al. [30] investigated a CAES system that provided added energy flexibility: it is based on extracting compressed air from the gas turbine and storing the heat energy during periods of a surplus power supply to be reinjected during peak demand. The authors demonstrated a model based on extraction from behind the last compressor stage (10th), without risking a stall. Their investigation indicated a storage efficiency of up to 70% at the maximum injection. This is because greater power is produced as compared to the absorbed work (charging and fuel consumed). CAES and BES do not fare well from an economic perspective when compared against traditional storage methods such as PHS, but this is expected to improve with larger installed capacities and system improvements.
As energy storage solutions become economical, commercially viable, and technically suitable, gas turbines will continue to play a crucial role to support additional RES penetration. Besides the RES level, its type and geographic size are key influential factors that greatly affect the operation requirements of GTs.
In terms of the RES levels and types, there are different consequences on the power system stability and GT operations. A larger wind energy penetration, for instance, does not have the same effect in comparison to Photo Voltaic (PV) energy. These variations have been analyzed by several researchers [31,32,33,34,35,36,37]. In terms of wind penetration, Impram et al. [32] found that a 10% wind power penetration (an example taken from Scandinavian countries) increases the energy reserve requirement by 1.5–4%.
By the same token, Naser et al. [34] demonstrated the adverse implication of high wind penetration levels on system stability. Moreover, Meegahapola and Flynn [35] and Niu et al. [37] found that in the case of a fault, the ability of the system to restore its stable condition, i.e., “transient stability”, is adversely affected by closer proximity to regions with high wind penetration. On the other hand, the effects of PV on the power system were analyzed by [36,37,38,39]. Zhang et al. [36] indicated that overvoltage problems are inevitable due to the high share of PVs connected to the sub-transmission network. This is in addition to higher transient overvoltages associated with greater PV penetration. Eftekharnejad et al. [38] found that during transient events, larger voltage drops were found after a fault in the case of greater PV penetration. They also analyzed the effects of PV penetration on the steady-state stability and concluded that PV penetration mostly affects voltage magnitudes: overvoltages occurred in the transmission line busbars, especially at 20% and higher PV penetration levels. Alquthami et al. [39] addressed the same topic for different penetration levels, i.e., 5%, 10%, and 20%, while keeping synchronous generators (SGs) in the system. Simulations showed that the system frequency stability was adversely affected at the 20% penetration level.
Besides the RES level and type, its geographic size also heavily affects the impact of increased renewables penetration on flexibility requirements. Larger countries (such as the United States) or in lumped control regions (such as the aggregation of the European power system) can imply less severe operational flexibility on GTs. Eser et al. [40] analyzed different models developed for different types of power plants, using isolated subsystems, and found that the solar and wind generators’ energy production were overestimated by 9%.
The flexibility definition and requirements will continue to evolve with the energy transition. The solutions for providing flexibility are expected to increase in complexity [31]. Gas turbines, used as back-up sources, have different requirements in comparison to base and peak load units. “Backup” GTs remain online in “standby” mode, ready to dispatch energy in minutes, hence maintaining the delicate grid stability. The start-to-full power capabilities are 15 and 30 min for advanced simple and combined power plants, respectively. This is a major shift from the conventional GT operations: the gas turbine stayed at almost constant, high loading levels for long time intervals. The new “flexible” mode implies huge and fast load changes, more frequent peak and part load operation, and a higher number of start-ups and shut-downs. Feldmuller et al. [41] summarized these changes in five elements:
- Increase in starts;
- Fewer operating hours;
- More part load hours and load transients;
- Change for hot starts to cold starts;
- Shift to unpredictable and new load regimes.
Furthermore, the changing operational profiles represented by the cycling operations often lead to less and different MWh/day values as the power levels vary quickly and often between the base load and minimum load.
The downside of the gained flexibility presents numerous undesired effects. These were detailed in [32] and are summarized below:
- Lower efficiency due to the continuous start–stops and ramping;
- Cost increases;
- Shorter equipment life;
- Higher maintenance requirements.
A number of researchers have compared the emissions levels for different operating regimes [40,41,42,43,44]. Eser et al. [40] discussed the emission increase in the downside effects, stating that “An increase in load cycling has a detrimental effect on a conventional power plant’s life, results in poor financial performance, and leads to increased emissions from the power plant”. At part load and under transient operations, flame stability, heat rates and emissions compliance can be a problem: “Emission requirements often limit the ability of a Combined Cycle unit to load below 50% or even 75% for some designs” [40].
By the same token, Turconi et al. [43] stated that “Emissions from cycling (total of part-load operation and startup) accounted for 2.7–5.0% of life cycle CO2 emissions,” 2.9–6.4% for NOx and 2.2–3.6% for SO2 in the five scenarios considered. Emissions due to part-load operation were 2–6 times higher than those from start-up.
In addition to the emission increase, Arias [44] discussed the negative effect on CO2 capture and storage (CCS): “The main drawback to the flexible operation of any type of power plant is the obvious increase in the specific cost of electricity output owing to low capacity factors. This cost penalty is particularly detrimental in the case of power plants with CCS systems due to the large capital investment required to build this type of plant”.
In conclusion, it is shown that cycling emissions are not negligible, they should be considered when assessing the environmental performance of power systems with a high share of renewables, but in this case did not overcome the benefits of increasing wind penetration.
On the other hand, the degenerating effect of cycling on the GT components’ is difficult to isolate. This is because degradation mechanisms occur simultaneously and are influenced by components’ age amongst other factors. The most detrimental effect is the failure of the material to sustain re-occurring stresses, leading to the separation (partial/full) “cracking” of its stress-bearing wall. An example of the flexible operation’s impact is shown in Figure 1, depicting the strong relationship between the number of starts and total crack lengths in a first-stage expander nozzle set: the cracking length is doubled with the number of starts due to thermal transients. The extent of cracking (i.e., length, depth, etc.) is an important factor in the restoration of degraded components within the required properties and economic feasibility. Therefore, unaccounted thermal transients due to frequent starts and load changes promote excessive cracking and potentially premature end of service.
A second but no less important degradation mechanism that limit the lives of gas turbine components such as expander blades is Thermal Mechanical Fatigue (TMF) cracking. It is generally associated with transient thermal stresses, especially from fast ramp-ups and frequent load fluctuations. TMF is a typical mechanism in blades operating in the hot section, leading to their breakdown. Running at part load, on the other hand, results in lower than creep temperature and thus longer expected lives.
This article is an extension of [45], which identified the most critical gaps in the present inspection and lifing criteria under the flexible operation requirements. After a brief introduction of the criteria, it details the novel challenges involved with the operational flexibility, in particular pertaining to components stresses and lives. One of the key outcomes is that the start-based criterion is found to be less conservative. This is in comparison to the hour-based criterion, found to be very conservative.
2. Renewables and Flexibility Needs
The complexity of grid management increases with the rise of renewable energy sources. In addition to the reserve capacity requirements, there are variations within the RES uptime (or producing phase) that dictate the system flexibility needs. Impram [32] classified the latter into four types: flexibility for power, energy, transfer capacity, and voltage. First, the flexibility for power refers to the power supply–demand balance needed to maintain frequency stability for short-term periods (a second to an hour). It is dictated by the power supply variations linked to weather changes. Second, the flexibility for energy considers the supply–demand balance over medium- to long-term periods (hours to several years). This is due to a decrease in fuel storage-based energy supply in generation. Third, the flexibility for transfer capacity is established for overcoming bottlenecks over short- to medium-term periods (minutes to several hours). It is due to increased peak demands, increased peak supply, and increased usage levels. Finally, the flexibility for voltage: The bus voltages need to be kept within predefined limits over short-term periods (seconds to tens of minutes). It is due to increased distributed generation in distribution system resulting in bi-directional power flow and operation scenario variance.
These changes vary by energy choice, period of day, season, and location, amongst a multitude of other influential factors. This section focuses on the PV and wind behaviors pertaining to the increased flexibility needs.
The imbalance between peak demand and PV energy production is expressed by the duck chart, which originated from the California independent system operator (CAISO). The lines in Figure 2 represent the net load (the difference between the forecasted load and expected electricity produced by variable renewables) over the course of a typical day. The impact of the renewable penetration over the last eight years (2012–2020) is rising, provoking sharper ramp rates. In this case, three load lines for years 2012, 2014, and 2020 are displayed. The “duck tail”, representing the morning, shows a near to steady net load, making it more desirable for back-up gas turbines. As the solar energy ramps up, back-up energy does the contrary, until it reaches the lowest point on the curve “duck belly”. The 2020 line is based on 33% power from renewable resources, with a potential overgeneration. Finally, the “duck head”, representing the evening hours into the night, shows the least desired situation: back-up energy is required to fill an exponential rise in the net load. This is because the demand is peaking while the solar energy is fading. The maximum hourly ramp rates, which represent the steepest change in residual load between two consecutive hours over the course of the year, are on the rise across various countries such as Spain, Italy, France, Ireland, and United Kingdom. It is expected that each of these countries will feature maximum ramp rates of more than 10 GW by 2030. With higher inclusion of renewable energy, the “duck belly” sinks further, adding further strain on back-up gas turbines to ensure the energy supply–demand balance.
The wind penetration in comparison to PV requires more planning. This is mostly due to its unpredictable nature. The “flexibility graphs” presented in Figure 3, show a good visual for planning the wind penetration’s back-up sources for central Europe, in addition to three selected countries:
- Penetration levels (as a ratio of peak load) of gas turbine-combined gas cycle (CCGT);
- Combined heat and power (CHP);
- Pumped hydropower;
- Hydroelectric power plants (Hydro);
- Interconnections.
The wind power penetration is represented by the red polygon, connecting the five energy flexibility sources. This representation provides a good visual for balancing the energy supply–demand. Flexibility needs on the supply side of the power system can be met with partial load operation of the power plants connected to the system, load following, and fast start/stop times [32]. Countries with high RE penetration, such as Denmark and Germany, have high transfer capacities with neighboring systems. This benefits the overall region in two ways: First, the interconnections, previously limited to local use for maintaining the system’s reliability, began to be regarded as a flexibility source for the region. Second, the reserve capacity increases in the whole interconnected system, which help to mitigate the RE variability. As a result of the unique flexibility mechanisms of each power system, the region’s energy balance improves, as shown in the central Europe polygon.
Unless high-capacity energy storage becomes available, the need of higher power system flexibility is on the rise, proportionally to the increase in renewable energy shares. The flexible energy need can be classified into daily, weekly, and annually.
- Daily needs are primarily driven by Photo Voltaic (PV) generation;
- Weekly needs are triggered through wind power generation, rather than PV;
- Annual needs are determined by seasonal variation in demand across the year and are dependent on the share of RESs. The type of RES has a major impact on the imbalance of the residual load between the seasons. In this case, the difference in the case of PV and wind energies can be significant. The summer season with peak PV production correlates with low consumption. In comparison, the winter where wind energy peaks, correlates with high demands. Therefore, annual flexibility need is less impacted as a result of increased wind shares. As a rule, a mix of two (or more) renewable sources would be desired as demonstrated by [46]: “Combination of different renewable-based sources such as PV and wind is very helpful for the reliability of the system”.
Paired with the previous variations, the PV efficiencies are also affected by the amount of available unobstructed sunlight in the sky. Depending on the irradiance level and temperature, at any given time, PV cells operate at a fixed point, which changes as the ambient temperature and solar radiation levels vary [47,48].
These needs, paired with the flexibility characteristics and associated particularities, are not included in the present inspection and lifing criteria. They rather predefine an almost “rigid” scheme of operational mode with weighting factors based on hours of operations and/or number of starts.
3. Present GT Lifing Criteria
The results presented in this paper are largely based on field observations and first-hand experience in gas turbine components repairs, paired with the analysis of the most relevant publications on the topic. The investigation of the present criteria started with the industry practices. The global gas turbine manufacturers adopted their own formulae and weighting factors. Before dwelling any further into these, the key terminologies used in this article include:
- Fast start: depending on the gas turbine design, a fast start can typically be around 15 min from ignition to full load. General Electric (GE) specifies a peaking fast start, which for some units such as 7F.03 is less than 15 min and carries some maintenance factors due to increased thermal gradients in the rotor as reported by Beagle et al. [49].
- Peak load: the operation above base load, achieved by increasing the turbine inlet temperature (TIT).
- Hot, warm, and cold starts: these refer to the start-up, after a period of shutdown including less than 8, 8–48, and more than 48 h standstill (and cooling), respectively [50].
- Part load: is the operation below base load achieved by varying the fuel flow rate and the modulation of the inlet guide vane (IGV) in certain designs. The purpose of the air flow rate modulation is to enhance the heat recovery performance, thus increasing the combined cycle efficiency by maintaining a high turbine exhaust temperature [51].
- Flex start: during (faster) start-up and loading, specific modulations of the exhaust temperature and exhaust flows are allowed to limit the transient temperature effects imposed by the steam cycle (for combined cycle plants).
- Cycling: refers to the operation of electric-generating units at varying load levels, including on/off, load following, and minimum load operation, in response to changes in system load requirements.
The degradation of gas turbine components is the result of complex interplay between several mechanisms, acting simultaneously and with far-reaching effects. The quantification of these degrading forces and their effects on GT components is not available at the present. To overcome this gap, the industry has settled on a more direct approach to quantify the time needed for interventions. It takes into consideration the time required for damage to reach an unacceptable level, beyond which failure is more likely. The inspection and lifing criteria calculations assume the presence of two types of stresses: steady state and transient stresses. Knowing some operational information, intervals can be calculated in terms of hours and/or number of starts.
Criteria Overview
First, the inspection and lifing criterion can be established using the number of hours or starts independently, covering the continuous and cyclic duty applications, respectively. The criterion limit, which is first reached, determines the maintenance interval. Typical inspection intervals are 24,000 h or 900/1200 starts for hot gas path (HGP) inspection, and 48,000 h or 1800 starts for major inspection [49]. A combustion system inspection is typically performed at 8000 h or 900 starts. The exact intervals vary according to the GT technology and class. Influential factors are introduced, resulting in factored fired starts (FFS) and factored fired hours (FFH):
- Hour-Based Factors: fuel type, peak load, and diluent (water or steam injection).
- Start-Based Factors: start type (conventional or fast peaking), start load (max. load achieved during a start cycle, e.g., part, base, or peak load), and shutdown type (normal cooldown, rapid cooldown, or trip).
GE, for instance, uses the following equation (Equation (1)) for its factored starts criterion [49]:
where NA is the annual number of part load start/stop cycles (60% load), NB is the annual number of base load start/stop cycles, NP is the annual number of peak load start/stop cycles (100% load), Ps is the peaking-fast start factor, F is the annual number of peaking-fast starts, T is the annual number of trips, aT is the trip severity factor, n is the number of trip categories (i.e., full load, part load, etc.), L is the annual number of load steps ≥ 20%, aL = exp (0.0137 ×% load step), and k is the number of load step levels.
In Equation (1), the term () was recently introduced by GE in February 2021 to account for the load change’s effect. This, however, is applicable only for the hot gas path inspection and for load steps greater than 20%. Hours at load are not established, and a succession of step loads within the 20% limit can occur and not get accounted for under this criterion revision.
Second, the Equivalent Operation Hour (EOH)-based criterion combines the effects of hours and starts. Operation hours are evaluated by using formulae based on the weighting of influential factors such as the number of fast loadings, rapid temperature changes, operating hours, fuels, injection of steam or water in the combustion chamber, and so on. This was adopted from ISO 3977-9: 1999 and is used to capture the interactions of continuous duty and cyclic duty applications on the lifetime of the components. An example of the EOH calculation is shown in Equation (2) below:
where is the weighting factor for each start, is the number of fired starts, is the number of fast loadings, is the equivalent operation hours for rapid temperature changes (e.g., due to step load changes of load rejections), is the number of rapid temperature changes, and are the weighting factors for base and peak load duties, respectively, is the operating hours factor with output up to base-load rating, is the operating hours factor with output between the base and peak-load ratings, is the weighting factor for contaminated, out of specification or non-specifiable fuels and, finally, is the weighting factor for injected water or steam.
Typical EOH inspection intervals are as follows: 8000 h for the combustion system, 24,000/32,000 h for HGP, and 48,000/64,000 h for major inspection as reported by Beagle et al. [49]. Components’ lives are primarily limited by the effects of creep or fatigue or are based on economic considerations (repair versus the cost of new parts). Critical components such as expander blades are limited by three HGP inspection intervals (around 72,000 EOH), while rotors are limited to 100,000 to 150,000 EOH. The effects of fatigue or transient stresses are more severe. It is known that gas turbines running in cycling mode (i.e., higher transient loads) generally undergo shorter inspection intervals. A plant operating as base load may be required to undergo a 3, 6, 9 pattern of overhauls, i.e., minor (4 weeks) overhauls in years 3 and 6, and a major (8 weeks) overhaul in year 9. For units that are operating in a cycling regime, the frequency of overhauls may be increased to, for example, a 2, 4, 6 pattern [52].
4. Operational Flexibility Effects on GT Components
The effects of operational flexibility can be categorized into direct and indirect. The former refers to the immediate impact seen on the components, for example, excessive cracking, while the latter represents the long-term or cumulative effects, for example, a reduction in the GT efficiency and reliability. Researchers such as in [3,42,53]. have analyzed the GT efficiency losses from increased cycling, in addition to part load and other flexibility operation characteristics. Kumar et al. [53] attributed up to 50% of the long-term heat rate degradation to cycling operations. They showed that around 10% degradation over a 30-year period and an approximate 1–5% loss in efficiency were attributable to cycling. They added that a typical unit may increase 4% to 5% in the period between overhauls but regain all but 1% after a good major turbine overhaul. Most of this is due to cycling operations. The effects on reliability can be seen in the rise in equivalent forced outage rates (EFOR) due to cycling as depicted in Figure 4. The results represent the average number of annual start cycles and EFOR of ten units. A rise in cycling results in higher plant equivalent forced outage rates (EFOR). The latter is typically done to perform unplanned maintenance interventions.
In addition to the start and shutdown cycles, Kumar et al. [53] attributed the loss in reliability to fast cycling. The latter is caused by load following and can require transitions from one combustion mode to another to restore flame stability and combustion pressure dynamics.
GT components are designed to withstand steady state stresses and a limited number of transient loads; unaccounted cycling stresses can greatly influence their residual lives. As demonstrated by Reyhani et al. [54], the blade metal temperature distribution and temperature gradients are the most important parameters determining the expander blades’ lives among other critical components operating in the hot section. The GT lifing predictions are based on two primary factors: creep and fatigue, and it is the combination of mechanisms that ultimately takes place. Depending on the components, the compounding effect of oxidation, hot corrosion, and other degradation mechanisms can mean shorter lives.
4.1. Fatigue–Creep Interaction
A typical gas turbine’s life estimation procedure is summarized in Figure 5 and consists of two main parts: creep and fatigue calculation. While the creep and fatigue lives are major parts of the lifing procedure, other factors due the operating environments, such as corrosion, are in second order of importance. The Electric Power Research Institute (EPRI) reported on the state-of-the-art creep-fatigue interaction knowledge including the current methods for lifing and testing in this domain as reported by [55,56]. The simultaneous effect of creep and fatigue on some components affected by both, such as expander blades, is complicated, even under the standard regimes (i.e., base and some cyclic loads).
Under the flexible operation, the base load units perform nearly continuous cyclic operations, subjecting more components to the creep–fatigue conditions as demonstrated by [53]. The severity of these conditions is also greater due to increased cracking from thermal mechanical fatigue and low cycle fatigue (LCF). It is known that LCF is mainly caused by a higher number of starts, especially fast starts: during start-up, the exterior and internal surfaces of the hot gas path components are under compression and tension, respectively, while the opposite occurs during shut down cycles due to cooler compressor discharge air. Under flexible operations, combustor parts and rotating hot section components are particularly at risk from cyclic TMF and thermally driven LCF, causing shorter lives. This is depicted in Figure 6. Keatley et al. [52] presented a study performed to estimate the start-up costs for a model base load unit over its entire service life. The curve plotted on the primary y-axis shows the power trend line for the relationship between the units’ age and creep life consumption. The relationship between age in calendar years and fatigue life consumption, measured in cumulative lifetime starts, is plotted on the secondary y-axis. As with online hours, knowledge of the number of lifetime starts performed by competitors may be of commercial value to market participants, so individual data are not shown but are represented by a power trend line. It also shows that the number of annual online hours performed by base load units tends to decrease with age.
4.2. Thermal Mechanical Fatigue
The thermal mechanical fatigue’s effect on peaking machines, in comparison to the typical TMF (from base load), due to energy demand variation is reported by [57]. He argued that the present TMF methodologies used for flexible operation units produce non-conservative life predictions. This is because the existing TMF lifing methodologies are extrapolated from a generation of more simplistic isothermal data, obtained from high-temperature fatigue or creep tests. Such data represent a linear damage accumulation approach, which fails to fully capture the complex interactions between the different damage mechanisms. The impact of higher temperature, even a few degrees, can be significant for materials operating in the creep range. Figure 7 below shows the typical daily flexible operation of a Siemens 8000H heavy duty gas turbine. The larger peaks represent the number of starts (once daily), and the smaller peaks represent the loading variation in between, with larger variation taking place in the afternoon. Under the present start-based criterion from GE, the smaller peaks (less than 20% variation) are not accounted for. In this case, the combined cycle plant is rated at 500 MW, and the implications of a small load change on the temperature profile when running at full load can be substantial. This, combined with faster start and stop procedures, adversely affects the combined cycle plants, which are not intended by design to operate under such heavy thermal cyclic loading.
Eser et al. [41] presented the case of three scenarios for ramps: Scenario A represents the most probable increase in wind and solar capacities. Scenario B is an optimistic case with more additions of wind and solar than in Scenario A, as well as an increase in gas plants to provide more flexible power generation. Scenario C has a very high penetration of wind energy. The average number of starts of thermal power plants was shown to increase by 4–23% as renewable penetration increased in the CWE and CEE regions. Simultaneously, the number of ramps was found to increase by 63–181%. Even in Scenario A, which is the most probable scenario in the German National Energy Action Plan, the number of ramps increased by 63% for 2020 in comparison to seven years earlier, emphasizing the importance for both OEMs and utilities to account for power plant cycling in future markets. Scenarios B and C include increases of 143% and 181%, respectively.
4.3. Partial Load Operations
Reyhani et al. [54] reported on the effects of partial loads, particularly pertaining to the metal temperature’s effect on the first-stage expander blade’s life. The authors showed that 300 h operation at 70% load can be equal to one hour operation at base load. This was established through the correlation of the load and metal temperature and is applicable in the case where the load changes are due to variations in the turbine inlet temperature alone. In fact, many GT units operating under partial load for mechanical drives experience longer lives, for example, the GE frame 5 machines.
Under growing flexible operations, the risks for components’ lives increase due to a number of issues:
- Degradation of materials and coatings from cyclic-based loading and sustained transients such as increasing amounts of fatigue damage due to more frequent starts, load fluctuations, and faster loading ramp-ups;
- Inadequate inspection intervals primarily for combustion, expander parts, seals, and bearings;
- Lack of reliable lifing criteria for the most critical components such as the rotor and expander blades;
- Reduced reliability of high-temperature metallic and ceramic protective coatings.
5. New Limits
Over the years, there have been many attempts to overhaul the inspection and lifing criteria using a form of condition-based maintenance, as opposed to the classical schedule-based maintenance. This, however, has remained largely excluded from actual industrial practices. Today, there is an eminent need to update the criteria, accounting for the flexibility requirements. It needs to define the characteristics of the system (e.g., ramping requirements, minimum load levels, resource mix, etc.) to maintain reliability with increased variable generation [53]. Linkenheil et al. [59] discuss five areas of crucial parameters for flexibility sources:
- Star–stop cycles;
- Reaction time;
- Low fixed and variable cost;
- Start-up capability;
- Operation range.
Similarly, the internal renewable energy agency “IRENA” [60] defines four objectives of flexibility of power plants, including the following:
- Shorter start-up time and lower start-up costs: This is since shorter start-up times enable the plant to quickly reach full load and significantly improves the operational flexibility. The costs associated with the start-ups include more frequent maintenance and additional fuel consumption.
- Lower minimum load and improved part-load efficiency: Operating thermal plants at lower loads increases the bandwidth of their operation, increasing flexibility. Most thermal power plants experience a drastic reduction in their fuel efficiency at low loads, and therefore improving this is an important element of increasing flexibility.
- Higher ramp rate: The rate at which a plant can change its net power during operation is defined as the ramp rate. With higher ramp rates, the plant can quickly alter its production in line with system needs.
- Shorter minimum uptime and runtime: Reducing the minimum time that the plant must be kept running after start-up or remain closed after shutdown allows a plant to react more rapidly.
6. Discussion
The inspection and lifing criteria, largely used in the gas turbine maintenance industry, present two important gaps with consideration to the flexibility requirements.
First, in case of the start-based criterion, the new thermal characteristics associated with the novel operational modes are not fully captured, for example, the time interval at a specific load. This is responsible for excessive cracking. Studies on the interaction of thermal mechanical fatigue (TMF) due to energy demand variation reveal major weaknesses in accounting for actual stresses. This is because the existing TMF lifing methodologies are extrapolated from a generation of more simplistic isothermal data, obtained from high-temperature fatigue or creep tests. Such data represent a linear damage accumulation approach, which fails to fully capture the complex interactions between the different damage mechanisms [52].
Second, the hour-based criterion (or creep driven) is found to be conservative, especially with the rise in part load regimes. The effects of partial loads, particularly pertaining to the metal temperature’s impact on the first-stage expander blade’s life is reported by [54]. He showed that 300 h operation at 70% load can be equal to one hour operation at base load. This is established through correlation of the load and metal temperature and is applicable in the case the load changes are due to variation in the turbine inlet temperature alone (not via the inlet variable guide vane–IGV).
Therefore, it is necessary to define new inspection and lifing criteria to reflect the impact of the new and novel degradation mechanisms associated with the flexible operations, with consideration of their interactive and cumulative nature. Typical factors affecting the life criterion under flexible operation include fatigue creep interaction, thermal mechanical fatigue, and partial loads. Here, it is proposed to introduce improvements in the current lifing criterion specific to flexible operation applications. In addition to the presently continuous, peaking, and cyclic modes, there is a need to define the terms for the flexible mode based on the hours at peak, partial, and full loads, accounting for sustained transient or flex loading. Several key factors shall be considered, including:
- Fast startup and loading;
- Daily or weekly start/stop cycles;
- Variable peak loads and part loads while maintaining emissions compliance;
- Flexible start and loading strategies (temperature and flow) for steam cycle optimization;
- Fuel flexibility (natural gas and hydrogen mixtures and syngas);
- Standby and peak shaving units;
- Others, such as extended cold standby periods followed by fast starts.
7. Conclusions
The clean energy transition is in progress and will continue to bring new challenges. Back-up energy sources, in particular gas turbines, play crucial roles in its success. This is by ensuring grid stability in the middle of high number of variations linked to the intermittent energy sources. The most important gaps and challenges are identified in the present lifing criteria and are summarized. First, the present inspection and lifing criteria do not reflect the novel mode and requirements associated with flexible operations. In the case of the start-based criterion, the new thermal characteristics are not fully captured, leading to excessive cracking. On the contrary, the hour-based criterion (or creep driven) is found to be conservative. This is increasingly important due to the rise in the partial load regimes. In the case of the equivalent operating hours criterion, the individual effects from starts and load levels are diffused into the equation, adding another layer of complication.
Based on these findings, the authors propose revising both criteria (hour/start-based and equivalent operating hours) to adapt them to the new requirements associated with the flexible mode operation characterized by frequent starts, continuous load changes, and partial and peak loads, accounting for sustained transient or flex loading.
Author Contributions
Writing—original draft preparation, H.F.; writing—review and editing, C.S. All authors have read and agreed to the published version of the manuscript.
Funding
This research received no external funding.
Institutional Review Board Statement
The study did not required ethical approval.
Informed Consent Statement
Not applicable.
Data Availability Statement
Not applicable.
Acknowledgments
The Authors would like to thank ROMA TRE University for the support.
Conflicts of Interest
There is no conflict of interest.
References
- Bossman, T.; Barberi, P.; Fournié, L. Effect of High Shares of Renewables on Power Systems; Metis Studies, European Commission: Brussels, Belgium, 2018. [Google Scholar]
- Cerri, G.; Gazzino, M.; Botta, F.; Salvini, C. Production planning with hot section life prediction for optimum gas turbine management. Int. J. Gas. Turbine Propuls. Power Syst. 2008, 2, 9–16. [Google Scholar] [CrossRef]
- Van den Bergh, K.; Delarue, K. Cycling of conventional power plants: Technical limits and actual costs. Energy Convers. Manag. 2015, 97, 70–77. [Google Scholar] [CrossRef]
- Michalski, J. The Role of Energy Storage Technologies for the Integration of Renewable Electricity into the German Energy System. Doctoral’s Dissertation, Technische Universität München, Munich, Germany, 2016. [Google Scholar]
- Guittet, M.; Capezzali, M.; Gaudard, L.; Romerio, F.; Vuille, F.; Avellan, F. Study of the drivers and asset management of pumped-storage power plants historical and geographical perspective. Energy 2016, 111, 560–579. [Google Scholar] [CrossRef]
- Lund, P.O.; Lindgren, J.; Mikkola, J.; Salpakari, J. Review of energy system flexibility measures to enable high levels of variable renewable electricity. Renew. Sustain. Energy Rev. 2015, 45, 785–807. [Google Scholar] [CrossRef] [Green Version]
- Sauer, D.U. Chapter 2-Classification of Storage Systems. In Electrochemical Energy Storage for Renewable Sources and Grid Balancing; Elsevier: Amsterdam, The Netherlands, 2015; pp. 13–21. [Google Scholar]
- Maton, J.P.; Zhao, L.; Brouwer, J. Dynamic modeling of compressed gas energy storage to complement renewable wind power intermittency. Int. J. Hydrogen Energy 2013, 38, 7867–7880. [Google Scholar] [CrossRef] [Green Version]
- Hadjipaschalis, I.; Poullikkas, A.; Efthimiou, V. Overview of current and future energy storage technologies for electric power applications. Renew. Sustain. Energy Rev. 2009, 13, 1513–1522. [Google Scholar] [CrossRef]
- Toledo, O.M.; Filho, D.O.; Diniz, A.S. Distributed photovoltaic generation and energy storage systems: A review. Renew. Sustain. Energy Rev. 2010, 14, 506–511. [Google Scholar] [CrossRef]
- Kazempour, S.J.; Moghaddam, M.P.; Haghifam, M.R.; Yousefi, G.R. Electric energy storage systems in a market-based economy: Comparison of emerging and traditional technologies. Renew. Energy 2009, 34, 2630–2639. [Google Scholar] [CrossRef]
- Luo, X.; Wang, J.; Dooner, M.; Clarke, J. Overview of current development in electrical energy storage technologies and the application potential in power system operation. Appl. Energy 2015, 137, 511–536. [Google Scholar] [CrossRef] [Green Version]
- Rossi, A.; Stabile, M.; Puglisi, C.; Fabretti, D.; Merlo, M. Evaluation of the energy storage system Impact on the Italian ancillary market. Sustain. Energy 2019, 18, 100178. [Google Scholar] [CrossRef]
- Kondoh, J.; Ishii, I.; Yamaguchi, H.; Murata, A.; Otani, K.; Sakuta, K.; Higuchi, N.; Sekine, S.; Kamimoto, M. Electrical energy storage systems for energy networks. Energy Convers. Manag. 2000, 41, 1863–1874. [Google Scholar] [CrossRef]
- Rydh, C.J.; Sandén, B.A. Energy analysis of batteries in photovoltaic systems. Part I: Performance and energy requirements. Energy Convers. Manag. 2005, 46, 1957–1979. [Google Scholar] [CrossRef]
- Dell, R.M.; Rand, D.A.J. Energy storage—a key technology for global energy sustainability. J. Power Sources 2001, 100, 2–17. [Google Scholar] [CrossRef]
- Hall, P.J.; Bain, E.J. Energy-storage technologies and electricity generation. Energy Policy 2008, 36, 4352–4355. [Google Scholar] [CrossRef] [Green Version]
- Sundararagavan, S.; Baker, E. Evaluating energy storage technologies for wind power integration. Sol. Energy 2012, 86, 2707–2717. [Google Scholar] [CrossRef]
- Denholm, P.; Margolis, R.M. Evaluating the limits of solar photovoltaics (PV) in electric power systems utilizing energy storage and other enabling technologies. Energy Policy 2007, 35, 4424–4433. [Google Scholar] [CrossRef]
- Kaldellis, J.K.; Zafirakis, D. Optimum energy storage techniques for the improvement of renewable energy sources-based electricity generation economic efficiency. Energy 2007, 32, 2295–2305. [Google Scholar] [CrossRef]
- González, A.; McKeogh, E.; Gallachóir, B.Ó. The role of hydrogen in high wind energy penetration electricity systems: The Irish case. Renew. Energy 2004, 29, 471–489. [Google Scholar] [CrossRef]
- Drury, E.; Denholm, P.; Sioshansi, R. The value of compressed air energy storage in energy and reserve markets. Energy 2011, 36, 4959–4973. [Google Scholar] [CrossRef]
- Nyamdash, B.; Denny, E.; O’Malley, M. The viability of balancing wind generation with large scale energy storage. Energy Policy 2010, 38, 7200–7208. [Google Scholar] [CrossRef]
- Nakhamkin, M.; Chirivolu, M.; Patel, M.; Byrd, S. Second generation of CAES technology–Performance, economics, renewable load management, green energy. In Proceedings of the Power-Gen International, Las Vegas, NV, USA, 8–10 December 2009. [Google Scholar]
- Salvini, C. Performance analysis of small size compressed air energy storage systems for power augmentation: Air injection and air injection/expander schemes. Heat Transf. Eng. 2018, 19, 304–315. [Google Scholar] [CrossRef]
- Razmi, A.R.; Afshar, H.H.; Pourahmadiyam, A.; Torabi, M. Investigation on a combined heat and power (CHP) system based on biomass and compressed air energy storage (CAES). Sustain. Energy Technol. Assess. 2021, 46, 101253. [Google Scholar] [CrossRef]
- Salvini, C. Performance assessment of CAES system integrated into a gas-steam combined plant. Energy Procedia 2017, 136, 264–269. [Google Scholar] [CrossRef]
- Ferreira, H.L.; Garde, R.; Fulli, G.; Kling, W.; Lopes, J.P. Characterisation of electrical energy storage technologies. Energy 2013, 53, 288–298. [Google Scholar] [CrossRef] [Green Version]
- Lund, H.; Salgi, G. The role of compressed air energy storage (CAES) in future sustainable energy systems. Energy Convers. Manag. 2009, 50, 1172–1179. [Google Scholar] [CrossRef]
- Igie, U.; Abbondanza, M.; Szymanski, A.; Nikolaidis, T. Impact of compressed air energy storage demands on gas turbine performance. J. Power Energy 2021, 235, 850–865. [Google Scholar] [CrossRef] [Green Version]
- Welch, M. Improving the flexibility and efficiency of gas turbine-based distributed power plant. In Proceedings of the Future of Gas. Turbine Technology 8th international Gas. Turbine Conference, 08-IGTC16, Brussels, Belgium, 12–13 October 2016. [Google Scholar]
- Impram, S.; Nese, S.V.; Oral, B. Challenges of renewable energy penetration on power system flexibility: A survey. Energy Strategy Rev. 2020, 31, 100539. [Google Scholar] [CrossRef]
- Yasuda, Y.; Ardal, A.R.; Carlini, E.M.; Estanqueiro, A.; Flynn, D.; Gomez-Lázaro, E.; Holttinen, H.; Kiviluoma, J.; van Hulle, F.; Kondoh, J.; et al. Flexibility chart: Evaluation on diversity of flexibility in various areas. In Proceedings of the 12th International Workshop on Large-Scale Integration of Wind Power into Power Systems as well as on Transmission Networks for Offshore Wind Power Plants, Book of Proceedings, London, UK, 22–24 October 2013. [Google Scholar]
- Naser, I.S.; Garba, A.; Anaya-Lara, O.; Lo, K.L. Voltage stability of transmission network with different penetration levels of wind generation. In Proceedings of the 45th International Universities Power Engineering Conference (UPEC2010), Cardiff, UK, 31 August–3 September 2010; pp. 1–5. [Google Scholar]
- Meegahapola, L.; Flynn, D. Impact on transient and frequency stability for a power system at very high wind penetration. In Proceedings of the IEEE PES General Meeting, Minneapolis, MN, USA, 25–29 July 2010; pp. 1–8. [Google Scholar]
- Zhang, Y.; Zhu, S.; Sparks, R.; Green, I. Impacts of solar PV generators on power system stability and voltage performance. In Proceedings of the 2012 IEEE Power and Energy Society General Meeting, San Diego, CA, USA, 22–26 July 2012; pp. 1–7. [Google Scholar]
- Niu, S.; Zhang, Z.; Ke, X.; Zhang, G.; Huo, C.; Qin, B. Impact of renewable energy penetration rate on power system transient voltage stability. Energy Rep. 2022, 8, 487–492. [Google Scholar] [CrossRef]
- Eftekharnejad, S.; Vittal, V.; Heydt, G.T.; Keel, B.; Loehr, J. Impact of increased penetration of photovoltaic generation on power systems. IEEE Trans. Power Syst. 2013, 28, 893–901. [Google Scholar] [CrossRef]
- Alquthami, T.; Ravindra, H.; Faruque, M.O.; Steurer, M.; Baldwin, T. Study of photovoltaic integration impact on system stability using custom model of PV arrays integrated with PSS/E. N. Am. Power Symp. 2010, 2010, 1–8. [Google Scholar]
- Eser, P.; Singh, A.; Chokani, N.; Abhari, R.S. Effect of increased renewables generation on operation of thermal power plants. Appl. Energy 2016, 164, 723–732. [Google Scholar] [CrossRef]
- Feldmuller, A.; Zimmerer, T.; Roehr, F. From Base to Cycling Operation. Siemens energy. In Proceedings of the Power-Gen Europe 2015, Amsterdam, The Netherlands, 9–11 June 2015. [Google Scholar]
- Lukowicz, H.; Rusin, A. The impact of the control method of cyclic operation on the power unit efficiency and life. Energy 2018, 150, 565–574. [Google Scholar] [CrossRef]
- Turconi, R.; O’Dwyer, C.; Flynn, D.; Astrup, T. Emissions from cycling of thermal power plants in electricity systems with high penetration of wind power: Life cycle assessment for Ireland. Appl. Energy 2014, 131, 1–8. [Google Scholar] [CrossRef] [Green Version]
- Arias, B. An analysis of the operation of a flexible oxy-fired CFB power plant integrated with a thermal energy storage system. Int. J. Greenh. Gas. Control. 2016, 45, 172–180. [Google Scholar] [CrossRef]
- Farhat, H.; Salvini, C. New lifing criterion for land-based gas turbines in flexible operation mode. Energy Rep. 2020, 8, 379–385. [Google Scholar] [CrossRef]
- Rakhshani, E.; Rouzbehi, K.; Sánchez, A.J.; Tobar, A.C.; Pouresmaeil, E. Integration of Large Scale PV-Based Generation into Power Systems: A Survey. Energies 2019, 12, 1425. [Google Scholar] [CrossRef] [Green Version]
- Obi, M.; Bass, R. Trends and challenges of grid-connected photovoltaic systems—A review. Renew. Sustain. Energy Rev. 2016, 58, 1082–1094. [Google Scholar] [CrossRef]
- Dounis, A.I.; Kofinas, P.; Alafodimos, C.; Tseles, D. Adaptive fuzzy gain scheduling PID controller for maximum power point tracking of photovoltaic system. Renew. Energy 2013, 60, 202–214. [Google Scholar] [CrossRef]
- Beagle, D.; Moran, B.; McDufford, M.; Merine, M. Heavy-Duty Gas Turbine Operating and Maintenance Considerations; GER-3620P; GE Power: Atlanta, GA, USA, 2021. [Google Scholar]
- Angerer, M.; Kahlert, S.; Spliethoff, H. Transient simulation and fatigue evaluation of fast gas turbine startups and shutdowns in a combined cycle plant with an innovative thermal buffer storage. Energy 2017, 130, 246–257. [Google Scholar] [CrossRef]
- Cerri, G.; Mazzoni, S.; Salvini, C. Steam Cycle simulator for CHP plants. In Proceedings of the ASME Turbo Expo, ASME Turbo Expo 203: Turbine Technical Conference and Exposition, San Antonio, TX, USA, 3–7 June 2013; Volume 2. [Google Scholar]
- Keatley, P.; Shibli, A.; Hewitt, N.J. Estimating power plant start costs in cyclic operation. Appl. Energy 2013, 111, 550–557. [Google Scholar] [CrossRef]
- Kumar, N.; Besuner, S.; Lefton, S.; Agan, D.; Hilleman, D. Power Plant Cycling Costs; Intertek APTECH Sunnyvale: Sunnyvale, CA, USA, 2012. [Google Scholar]
- Reyhani, M.; Alizadeh, M.; Fathi, A.; Khaledi, H. Turbine blade temperature calculation and life estimation—A sensitivity analysis. Propuls. Power Res. 2013, 2, 148–161. [Google Scholar] [CrossRef] [Green Version]
- Dogan, B. Plant Component Assessment for Creep-Fatigue Damage: Component Assessment Methodologies; EPRI: Palo Alto, CA, USA, 2009. [Google Scholar]
- Gandy, D. Program on Technology Innovation: The State-of-Knowledge Report on Creep-Fatigue Interaction; EPRI: Palo Alto, CA, USA, 2008; p. 101 6489.
- Jones, J. Thermo-Mechanical Fatigue-In the Gas Turbine Engine; Elsevier: Amsterdam, The Netherlands, 2021. [Google Scholar] [CrossRef]
- Are Simple Cycles or Combined Cycles Better for Renewable Power Integration? Power Magazine. 2015. Available online: https://www.powermag.com/are-simple-cycles-or-combined-cycles-better-for-renewable-power-integration/ (accessed on 29 June 2021).
- Linkenheil, C.P.; Küchle, I.; Kurth, T.; Huneke, F. Flexibility Needs and Options for Europe’s Future Electricity System; EUGINE-European Engine Power Plants Association: Berlin, Germany, 2017. [Google Scholar]
- Anisie, A.; Fransisco, B. Innovation Landscape Brief: Flexibility in Conventional Power Plants; International Renewable Energy Agency (IRENA): Abu Dhabi, United Arab Emirates, 2019. [Google Scholar]
Figure 1.
Impact of cycling on components’ cracking. Adapted from Ref. [45].
Figure 1.
Impact of cycling on components’ cracking. Adapted from Ref. [45].
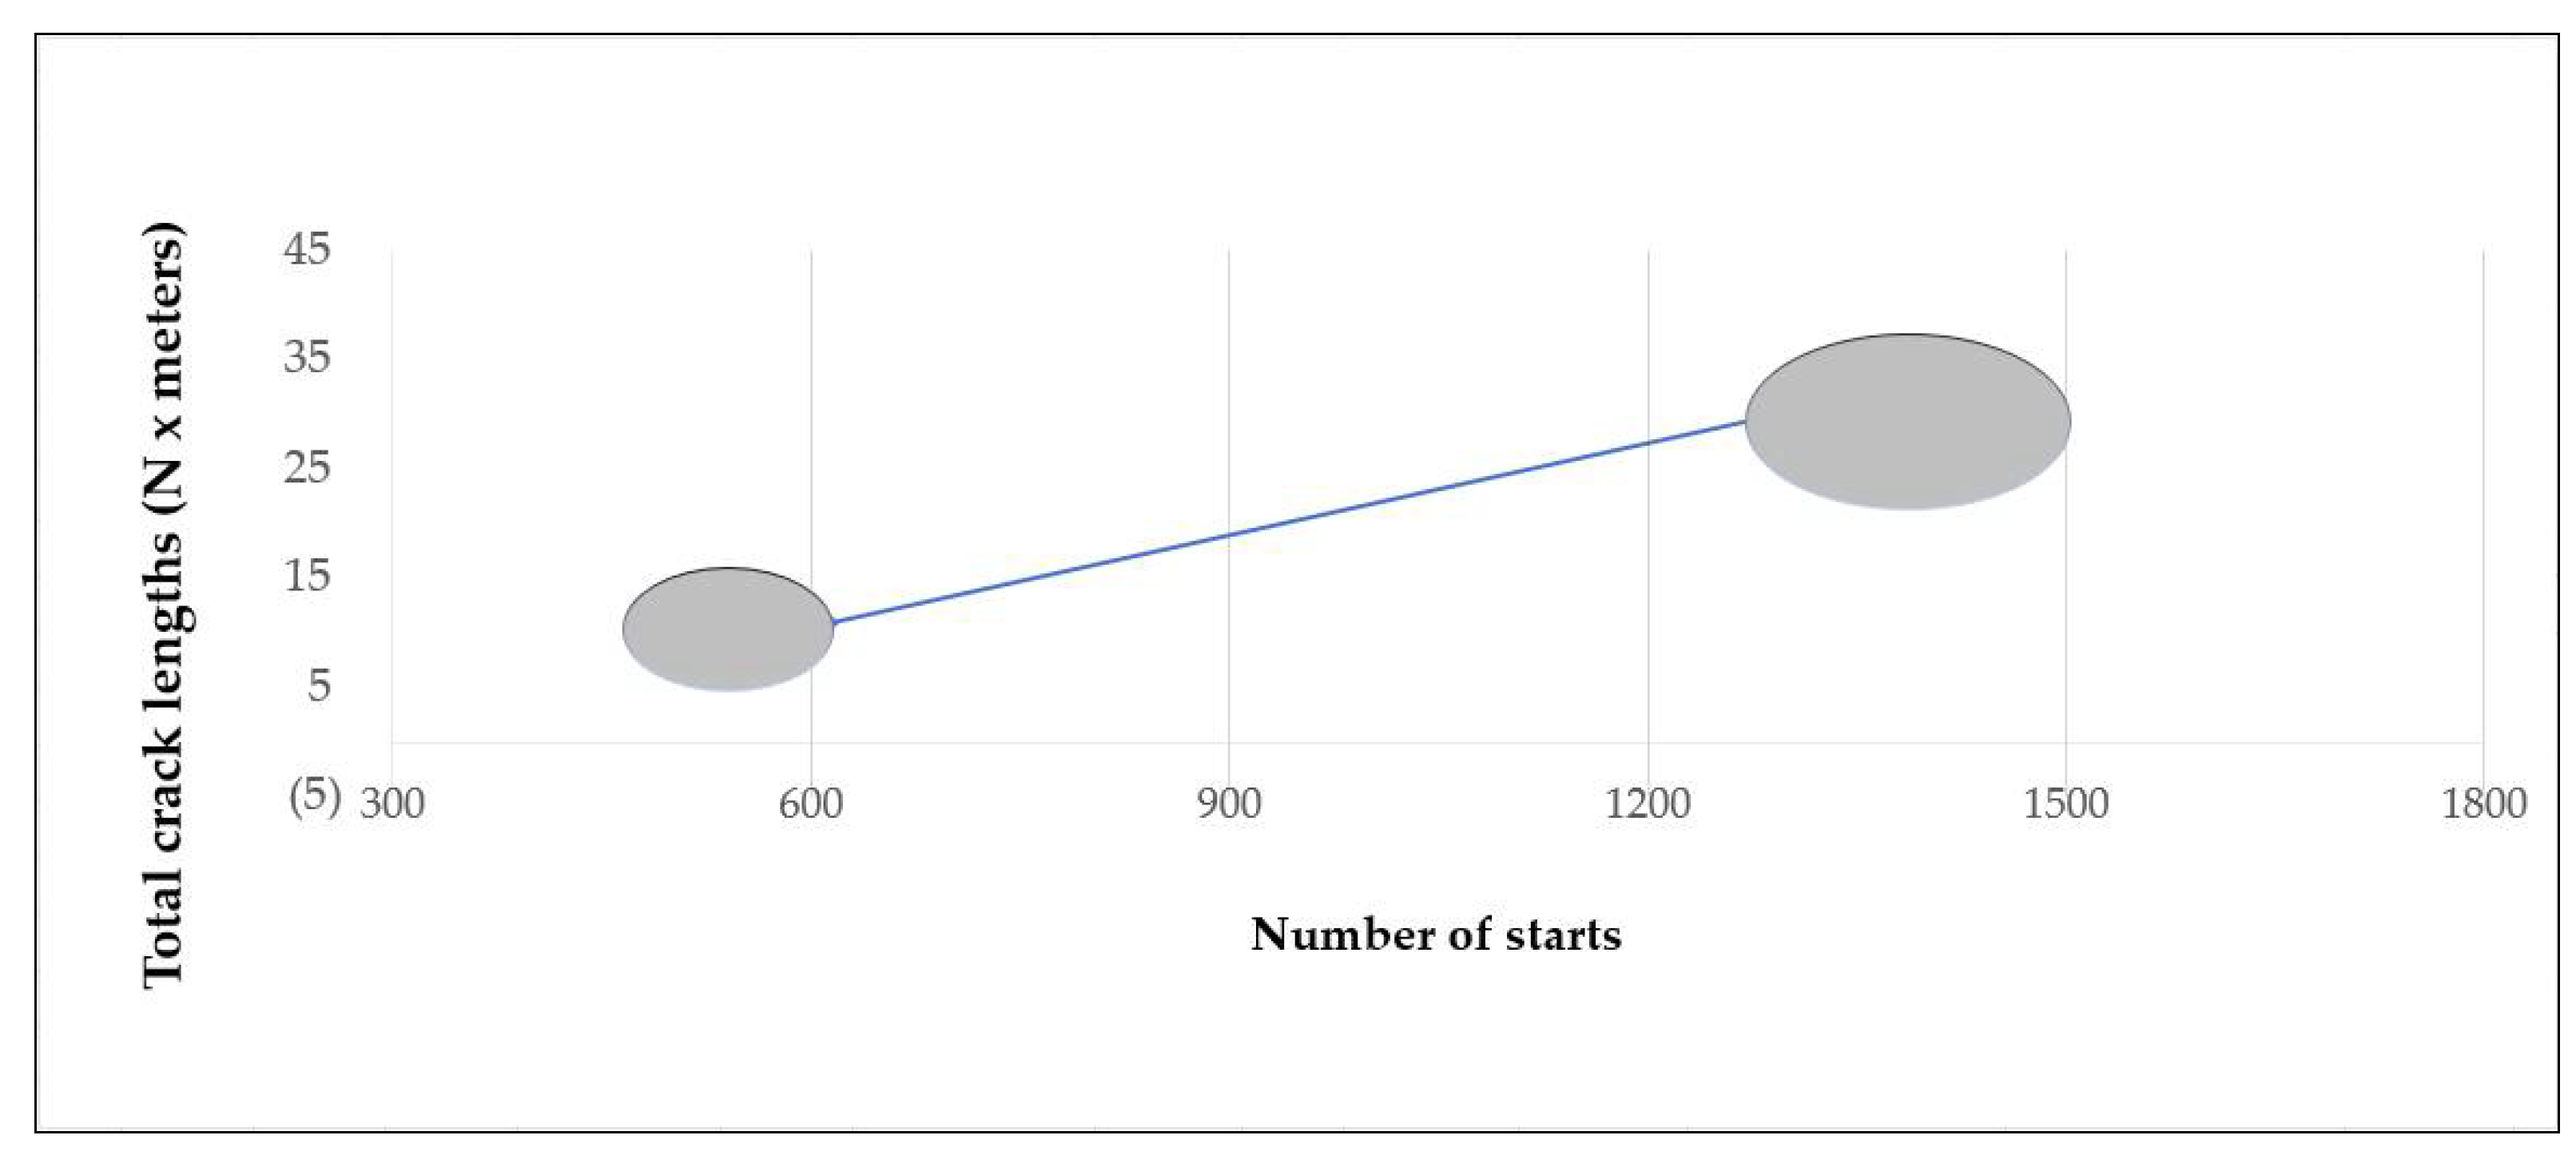
Figure 2.
Adapted from the California CAISO ‘Duck Curve’ illustrating the impact of intermittent renewable power generation. Adapted from Ref. [31].
Figure 2.
Adapted from the California CAISO ‘Duck Curve’ illustrating the impact of intermittent renewable power generation. Adapted from Ref. [31].

Figure 3.
Flexibility graphs of the Central Europe region and three selected countries with wind penetration levels. Adapted from Ref. [33].
Figure 3.
Flexibility graphs of the Central Europe region and three selected countries with wind penetration levels. Adapted from Ref. [33].

Figure 4.
Cycling effects on the equivalent forced outage rates. Reprinted from Ref. [53].
Figure 4.
Cycling effects on the equivalent forced outage rates. Reprinted from Ref. [53].

Figure 5.
Flow chart of a typical estimation procedure. Adapted from Ref. [54].
Figure 5.
Flow chart of a typical estimation procedure. Adapted from Ref. [54].

Figure 6.
Power trend lines for creep life consumption. Adapted with permission from Ref. [52]. Copyright 2013 Applied Energy.
Figure 6.
Power trend lines for creep life consumption. Adapted with permission from Ref. [52]. Copyright 2013 Applied Energy.

Figure 7.
Example of a combined cycle power plant flexible operation. Adapted from Ref. [58].
Figure 7.
Example of a combined cycle power plant flexible operation. Adapted from Ref. [58].

Publisher’s Note: MDPI stays neutral with regard to jurisdictional claims in published maps and institutional affiliations. |
© 2022 by the authors. Licensee MDPI, Basel, Switzerland. This article is an open access article distributed under the terms and conditions of the Creative Commons Attribution (CC BY) license (https://creativecommons.org/licenses/by/4.0/).
Share and Cite
MDPI and ACS Style
Farhat, H.; Salvini, C. Novel Gas Turbine Challenges to Support the Clean Energy Transition. Energies 2022, 15, 5474. https://doi.org/10.3390/en15155474
AMA Style
Farhat H, Salvini C. Novel Gas Turbine Challenges to Support the Clean Energy Transition. Energies. 2022; 15(15):5474. https://doi.org/10.3390/en15155474
Chicago/Turabian StyleFarhat, Hiyam, and Coriolano Salvini. 2022. "Novel Gas Turbine Challenges to Support the Clean Energy Transition" Energies 15, no. 15: 5474. https://doi.org/10.3390/en15155474
Note that from the first issue of 2016, this journal uses article numbers instead of page numbers. See further details here.