1. Introduction
It is well known that one of the main problems in the HV and PD tests of high-voltage equipment is the applied testing voltage, which is higher than the transformer rating voltage [
1,
2]. If such a voltage level with a rating frequency of 50 or 60 Hz is utilized in the tests for some iron-core devices, such as transformers and reactors, core saturation of the devices under test will occur, resulting in the distortion of the applied testing voltage. Furthermore, testing with such voltages also consumes a high current. To avoid the aforementioned conditions, the international standard defines the quality of the testing voltage by the different voltage (the root-mean-square value and peak value divided by the square root of two) and total harmonic distortion, which are not higher than 5%. Under the test conditions, the applied voltage in such tests is no more than two times the rating voltage of the transformer, so the applied voltage should have a frequency higher than two times the rating frequency. For safety purposes, the frequency used in the test should be in the range of 100 Hz to 400 Hz. Generally, it is found that the frequency of 200 Hz is sufficient in all tests of iron-core devices. Therefore, the frequency range from 50 Hz to 200 Hz was utilized in all considered simulations and experiments. In the past, the motor and generator test set was applied in the test; however, the test set has a high cost, and requires a large space for installation.
The high-voltage (HV) test is essential for confirming the HV equipment’s performance during design and construction procedures. Such tests comprise partial discharge measurement, power loss measurement, dielectric loss measurement, and insulation voltage withstand tests.
The PD measurement is the most crucial test for assessing the performance and lifetime of insulation. Partial discharges (PDs) are regional electrical discharges that only partially bridge the insulation between electrodes. They result from localized electrical stresses in the insulation or on its surface. Such discharges often manifest as pulses with a duration shorter than 1 µs. There are three main categories for PDs: Corona discharges, the first type of PD, can happen in places with sharp edges and intense electric field stress. The second type is caused by voids and bubbles in the interior insulation material. If there is sufficient electrical field stress and these faults have lower insulation levels than the main insulation material, a PD can arise. The final type of PD, known as surface discharge, takes place at the boundary of two materials.
The simplest technique [
1] to produce HV for HV testing is using an HV testing transformer connected with a voltage regulator. The power supply of the regulator can be a generator or a low-voltage grid.
However, the nonlinear characteristics of iron-core and switching devices lead occasionally to issues with power quality, such as voltage distortion and interferences affecting the background noise in PD and HV tests. IEC 60060-1 [
2] specifies that the testing voltage must have a nearly pure sinusoidal waveform, where the difference in voltage (DV; peak voltage divided by √2 and RMS voltage) and the total harmonic distortion voltage (THD
v), given by Equation (1), must not be greater than 5%.
where
Vp1 and
Vpi denote the peak voltages of the fundamental frequency and of the
ith harmonic frequency, respectively.
For better understanding, a test case should be considered. A testing voltage of about 40 kV (much higher than the rating voltage of 24 kV) was applied to an iron-core device, and the PD characteristic is shown in
Figure 1. It was found that the testing voltage deviated from the sinusoidal waveform due to the core saturation. The DV and THD
v were higher than 5%. In addition, the background noise level was higher than 2.5 pC (i.e., the acceptable background noise for the HV and PD tests of the power cable and the voltage transformers) [
3,
4,
5]. To avoid the voltage distortion and the background noise level, and to satisfy the standard requirements, an additional measure—such as a voltage filter—must be applied to the system.
To confirm the insulation performance of the HV equipment in HV tests, the testing voltage must be increased to a level greater than the rating voltage. The power frequency (50 Hz or 60 Hz) of the testing voltage can be used in the HV test for capacitance loads such as insulators, bushings, cables, etc. For example, in the HV and PD testing of a power cable [
4] (
U0 = 12 kV) for the pre-stress condition, a voltage of 2
U0 (24 kV) is applied to the cable, and then the testing voltage is reduced to the level of 1.73
U0 (20.8 kV) to record the PD activity.
Figure 2a shows the procedure of applying voltage in the PD test for the cable.
However, in the case of iron-core test objects such as voltage transformers (VTs), reactors, etc., to prevent the core saturation and distortion of the applied voltage, the applied testing voltage must have a frequency that is higher than the power frequency. In the HV and partial discharge test [
5] of a VT (with a rating voltage (
Ur) of 24 kV), 80% of the withstand voltage (
Ut = 50 kV) is applied to the VT for the pre-stress condition, and then the testing voltage is reduced to 1.2
Ur (28.8 kV) to record the PD activity.
Figure 2b shows the procedure of applying voltage in the PD test. Since the testing voltage in the PD test is higher than the rating voltage, the saturation of the iron core can occur. Therefore, to avoid such saturation, a voltage with a frequency is higher than the rated frequency of the VT is employed in the test. The saturation effect of the VT influences the applied voltage distortion, as shown in
Figure 1, leading to DV and THD
v of more than 5% if a voltage with a power frequency of 50 Hz is applied to the HV side of the VT. Aside from the nonlinear voltage, the core saturation can cause thermal runaway and the explosion of the PT. In order to prevent the core saturation effect, a test voltage of twice the rating voltage must have at least twice the rating frequency to prevent the magnetic flux in the iron core from exceeding the rating magnetic flux. For most iron-core devices with ratings of 50 and 60 Hz frequencies, a frequency of 200 Hz is an appropriate candidate.
Power electronics technology is now widely used in practical industries, such as home appliances, traction and transportation vehicles, renewable energy sources, and HV transmission and distribution systems. The power electronics converter is also a powerful and reliable tool for AC/DC, DC/AC, and AC/AC power conversion for HV generation in testing. Nonetheless, the interference signal caused by the fast switching of power electronic devices is the main issue with the implementation of the power converter in the PD test. Such an interference signal causes the background noise in the PD detection system to be far greater than is acceptable. For instance, the allowable PD level in VTs insulated with oil and power cables is just 5 pC [
4,
5]. Moreover, the acceptable background noise in the testing system for the PD tests [
3] should be less than 50% of the allowable PD level (2.5 pC). However, most commercial power converters with an extra filter can remove undesirable harmonic voltage and produce a voltage waveform that is close to a pure sinusoidal wave, but the background noise in the PD test is still higher than the acceptable level in the HV and PD tests.
Lately, there have been attempts to develop the HV and PD tests of HV equipment. In [
6,
7,
8,
9], a power frequency converter based on pulse-width modulation (PWM) techniques was developed as a low-voltage source for the HV testing transformer for the HV and PD tests. It was found that the commercial and self-developed frequency converters with a voltage filter can generate an almost-pure sinusoidal voltage waveform, but the PWM switching generates a high noise level, which is higher than the acceptable level (2.5 pC) of the PD test. Therefore, an additional filter or voltage filter must be redesigned with consideration of the noise generated by the converter switching. In [
10,
11], the analysis of the effect of the additional filter to reduce the background noise in the HV and PD tests was presented. In [
12], the analysis of a PWM converter with an additional filter was presented, and the best switching frequency in terms of the quality of the generated voltage and background noise level was investigated. The achievement of the developed system in terms of the generated voltage quality and background noise was determined. The voltage generated had a nearly pure sinusoidal waveform, the DV and THDv were less than 5%, and the background noise level was less than 2.5 pC. Nevertheless, it was found that the developed system in [
12] required an additional filter with fairly large capacitance and high power consumption. In [
13], a system based on a resonant power converter was introduced for HV and PD tests on voltage transformers. Instead of the PWM voltage waveform, a square wave was utilized as the input voltage of the HV testing transformer. The developed system provided promising performance in terms of the output voltage waveform quality and low background noise level. The DV, THDv, and background noise levels were lower than 2%, 3%, and 1.5 pC, respectively. The tuning and filter circuit must be implemented with the system for the achievement of the required resonant frequency. To design the proper tuning and filter circuit, the circuit parameters of the system, along with the parasitic and stray inductance and capacitance, are required. However, some parameters cannot be measured accurately in real practice. In the design process of [
14], the parameters in the simulation were adjusted to obtain results that were consistent with the experimental ones. It would be advantageous for the system design if the circuit parameters could be determined accurately.
In this paper, using the preliminary experimental results, an improved Prony method [
15] was applied to determine the crucial equivalent circuit parameters of the testing system. The trial-and-error approach for the determination of the unknown circuit parameters in the previous approach was not necessary. Using the proposed method, the unknown circuit parameters were determined precisely, and the appropriate resonant tuning and filter circuit was designed effectively. The transfer functions of the input and output testing voltages, along with the transfer impedance of the input voltage and signal voltage of the PD measuring port, were analyzed. The system design was verified by experiments of the HV and PD tests on a voltage transformer and a power cable. The gain of the transfer impedance was over 3 at the frequency of 200 Hz for testing the VT, and over 10 at the frequency of 50 Hz for testing the cable. The output voltage waveform was almost a pure sinusoidal function, and a background noise level of below 1 pC was achieved as per the design and the standard requirements [
1,
2,
3,
4,
5]. The validity of the proposed method was confirmed by the experimental results, and the system design of the resonant converter and the approach for the equivalent circuit determination are very useful for the HV and PD tests of voltage transformers in real practice. This paper is organized into four parts: The first section is an introduction, and the second is a review of the developed system for HV and PD testing systems. In the third section, the determination of the circuit parameters of the testing system is presented. Then, the determined parameters are used for the selection of the circuit parameters to obtain the desired output testing voltage and background noise level in the HV and PD tests on the HV apparatuses. Finally, conclusions are presented in the last section.
4. Experiments
As shown in the experimental setup in
Figure 18, some tests were carried out to see how well the designed system performed in the HV and PD tests in terms of the output voltage quality and background noise. The testing system is composed of a test object (i.e., a VT or a power cable), an HV testing transformer, a PD detection system, an additional capacitor, an adjustable inductor, and the developed converter. The performance of the developed system was investigated in terms of the different voltage, the total harmonic distortion of the output voltage, and the background noise level.
A commercial EO/OE converter (Omicron) [
21] with fiber-optic cables was used with the developed system to transmit the measured PD signal and prevent interference signals from electromagnetic coupling in the HV testing area of the HV laboratory, which was shielded from external electromagnetic fields by metallic fences and ground plane. In the calibration process of the PD test, a standard PD current with a charge of 5 pC was employed. Without the operation of the converter, the background noise was approximately 0.8 pC.
For presenting the problem of interference generated by the typical power frequency converter with the pulse-width modulation topology, the PWM converter was applied to the testing system. As shown in
Figure 19, and at a testing voltage of about 14.4 kV, the noise level of 162.4 pC was very high—much higher than the acceptable level of 2.5 pC.
To represent the performance of the developed system using the selected parameters, a resonant converter with additional inductance of 17.2 mH (LV side) was set to obtain the resonant frequency of 200 Hz. The experiments without a test object were performed to investigate the voltage quality and background noise level. The standard PD pulse with a charge of 5 pC was used for calibration in the PD test. When the additional and adjustable inductor was connected to the LV side of the HV transformer but there was no additional capacitor connected to the system, at only the testing voltage of about 5 kV, the background noise reached the acceptable level (2.5 pC), as shown in
Figure 20a. When the additional capacitor was connected to the system, the background noise level was reduced significantly. At the pre-stress testing voltage of 40 kV
rms, the noise level was only 0.77 pC, as shown in
Figure 20b. At the output voltage of 40 kV
rms, the DC input voltage supplied to the converter was about 83 V, corresponding to a voltage gain of 4.5. This is consistent with the simulation results. The different voltage and THD
v were 0.61% and 0.35%, respectively.
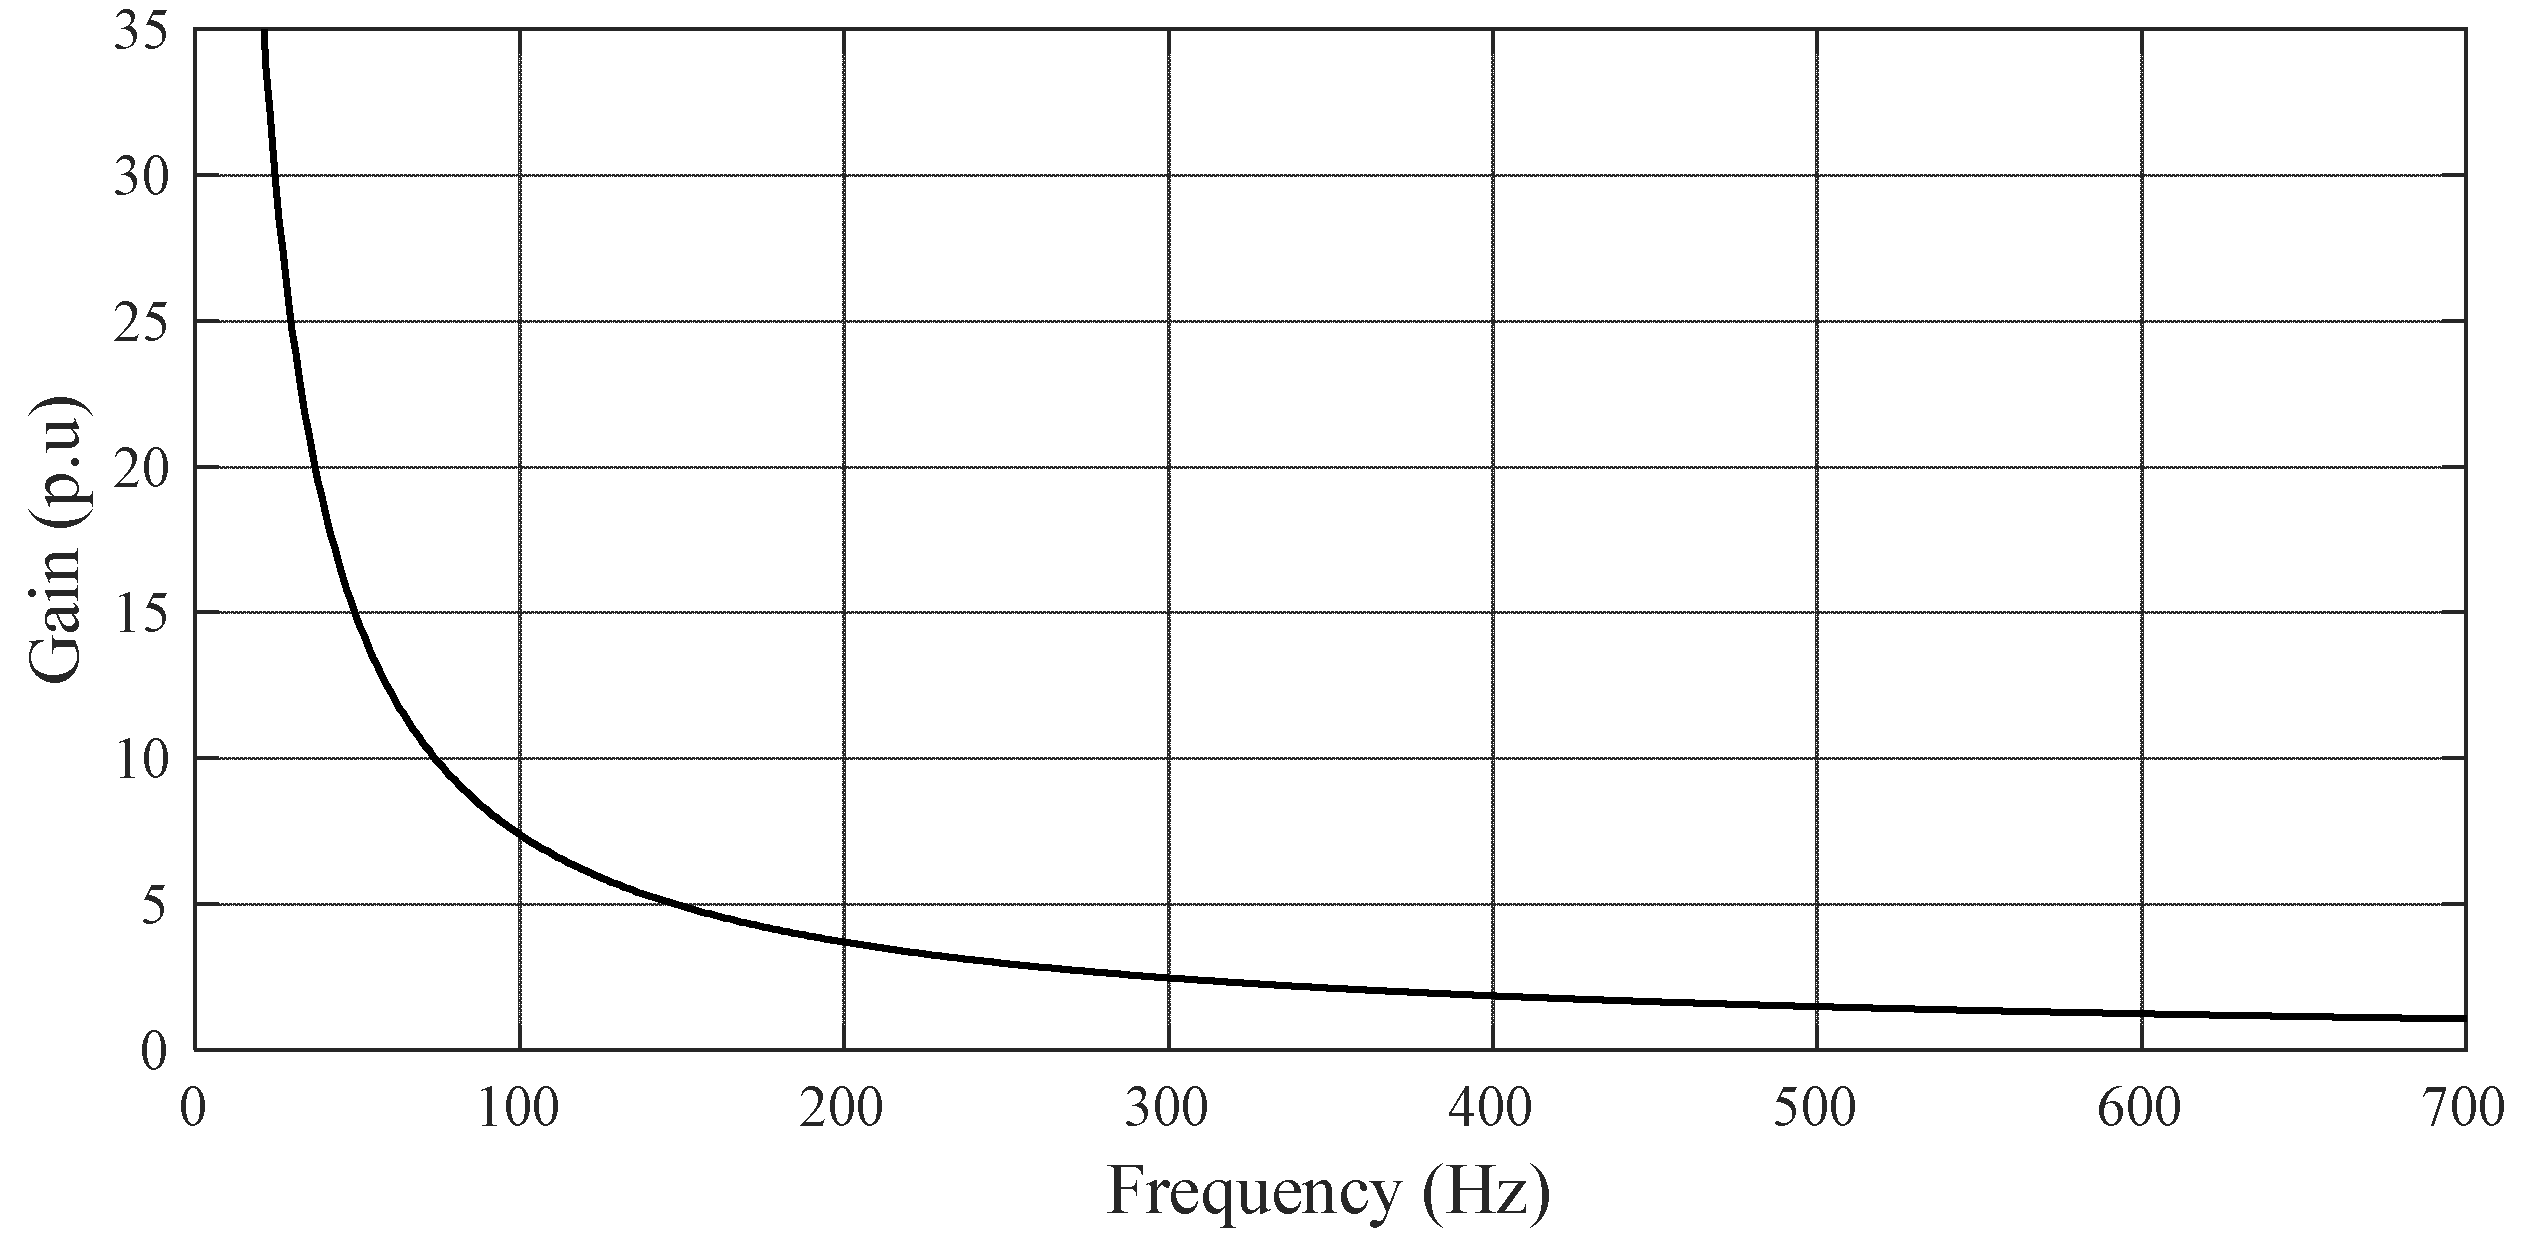
In the second experiment, a voltage transformer was tested. The frequency of the input voltage was 200 Hz for examining the voltage gain (V
out/V
in), the quality of the testing waveform, and the background noise level. The voltage was raised to 40 kV
rms for the pre-stress condition, and decreased to 28.8 kV
rms for recording PD activity. In the calibration process for the PD test, the standard PD pulse of a 5 pC charge was employed. The experimental testing voltage of about 30 kV
rms is shown in
Figure 21. The voltage gains at 30 kV
rms and 40 kV
rms were almost the same value of 3.8, which is consistent with the simulation results in
Figure 13 and
Figure 14. The difference voltage (peak voltage/√2 = 28.98 kV and RMS voltage 28.79 kV) was 0.65%, the THD
v was 0.35%, and the background noise was 0.871 pC.
In the final experiment, a power cable was tested. The frequency of the input voltage was 50 Hz for examining the voltage gain (V
out/V
in), the quality of the testing waveform, and the background noise level. The voltage was raised to 24 kV
rms for the pre-stress condition, and decreased to 20.8 kV
rms for recording PD activity. A 5 pC PD pulse was also employed in the calibration process. The experimental testing voltage of about 21 kV
rms is shown in
Figure 22. The voltage gains at 21 kV
rms and 24 kV
rms were almost the same value of 12.8, which is fairly consistent with the simulation results in
Figure 13 and
Figure 14. The difference voltage (peak voltage/√2 = 20.92 kV and RMS voltage 20.85 kV) was 0.56%, the THD
v was 0.32%, and the background noise was 0.688 pC.


