Abstract
The article presents the susceptibility coefficients active power kp and reactive power kq, as proposed by the author. These coefficients reflect the reaction of arc furnaces (change of the furnace operating point) to supply voltage fluctuations. The considerations were based on the model of the arc device in which the electric arc was replaced with a voltage source with an amplitude dependent on the length of the arc. In the case of voltage fluctuations, such a model gives an assessment of the arc device’s behavior closer to reality than the model used, based on replacing the arc with resistance. An example of the application of the kp and kq coefficients in a practical solution is presented.
1. Introduction
The article proposes power susceptibility factors: active power kp and reactive power kq, determined on the basis of quasi-static power–voltage characteristics. These coefficients were determined by replacing the arc of an electric arc furnace with a voltage with a value that depends on the length of the electric arc. In analytical research, many models of arc devices can be distinguished. These include classic models based on nonlinear differential equations using the Mayra and Cassie equations [1,2], models using a voltage source varying in time defined as a dependent nonlinear function on the length of the electric arc [3,4,5], models based on a series-connected resistor and inductance [6,7], and models using current–voltage characteristics [8,9,10].
In the work on arc devices, simulation studies are also using computer programs based, among others, on neural networks [11,12,13,14,15,16,17,18,19,20]. However, this requires the use of complex electric arc models and advanced simulation programs. This greatly limits the practical application of these algorithms. The article proposed a certain compromise resulting from the advancement of the model, the accuracy of the obtained results, and its practical application.
In the publication [21] to date, the assessment of the interaction of arc loads was based on the adoption of generally used static power–voltage characteristics marked in the article with the superscript (*):
For small changes in the supply voltage, the characteristics are, in the vicinity of the rated voltage Un, approximately linear dependencies, determined by the slope coefficients of the static characteristics. These factors are also referred to as the receiver power susceptibility factors for active power and reactive power [21]:
where Pn and Qn mean active and reactive power consumed by the load under rated conditions (for an arc device, it means operation at rated voltage and current).
For practical considerations, the use of the active power susceptibility coefficients—kp and reactive power—kq allows for a direct assessment of the relative change in power consumed by the receiver with a relative voltage change. The exact values of the coefficients are obtained experimentally by determining the power–voltage static characteristics of active and reactive power. Carrying out the appropriate measurements requires a lot of work and is not always possible for technical reasons.
In the case of an arc device, for the most commonly used electrode control system, based on keeping the arc resistance constant (more precisely on maintaining a constant arc voltage to arc current ratio [22]), the entire circuit of the arc device has a constant impedance character. As a result, for slight voltage changes, one can take:
The difficulties in determining the kp and kq coefficients are evidenced by the data presented in the publication [21], where, based on Canadian research, the values kp = 2.3 and kq = 4.6 were given for the electric arc furnace. Especially the last, unexpectedly high value raises reservations as to the correctness of assuming the constant arc resistance. The arc model adopted in the article makes it possible to explain this discrepancy.
2. Assumptions Adopted for the Calculation of Power–Voltage Characteristics
The electric arc supply system is presented by means of a simplified single-phase diagram of a substitute arc device together with the supply network. The circuit diagram is shown in Figure 1.
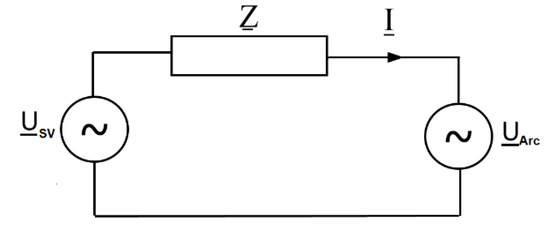
Figure 1.
Simplified single-phase equivalent diagram of the arc device.
The phase voltage of the supply network (equivalent voltage supplying the arc) was taken as a reference value and marked as: = 100% (it corresponds to the no-load voltage—with an interrupted arc). The index (′) at the top of the symbols means operation with a supply voltage equal to 100%, (similarly marked—I′, , Q′). The index (″) used in the following text means operation at a voltage different from the rated ≠ 100% (marked as—I″, , Q″). The equivalent impedance of the arc supply network includes the parameters (resistances and reactances) of such elements as: a steelworks supply network with a power transformer, furnace transformer (with a choke), and high-current circuit consisting of a flexible part, bus bars, and electrodes: Z = R + jX (it corresponds to the impedance of the arc supply circuit when the electrodes are short-circuited with the charge). The reactance value was assumed for the calculations in the amount of X = 50%, in the amount given, e.g., in [21] for furnaces with a capacity of 50–200 Mg with transformers 21–80 MVA. The values of the assumed reactance and supply voltage correspond to the theoretical value of the operational short-circuit current (with the resistance determined from the omitted formula):
The electric arc was mapped using an ideal source of sinusoidal voltage with the amplitude value depending on the arc length. It is the fundamental harmonic of the square wave of the arc voltage. The proposed model derives from the most frequently proposed one in the literature, a nonlinear arc model in which the arc is represented by a voltage source with the value UArc, depending on the arc length lArc:
where
- a, b—denote constants,
- lArc—arc length,
- and with polarity according to the polarity of the arc current:
As a result, a rectangular arc voltage waveform is obtained in each half of the period. The adopted arc model refers to the multi-voltage model presented by the author in the publication [23], consisting of mapping the arc with a system of series-connected voltage sources of higher harmonics:
which, in relation to the amplitude of the fundamental harmonic of the arc voltage, and for b = 1, we obtain a sinusoidal waveform, adopted in the model proposed in the article:
For the assumed constant arc length (which may change, for example, as a result of electrode movement related to the operation of the electrode position regulator, sliding of the melted scrap, movement of the arc along the electrode and charge surface, etc.), the effective value of the arc voltage is determined depending on: voltage power supply—USV, resistance—R, and reactance—X of the arc supply circuit, and arc current I from the formula:
The relationship UArc = f (I) is graphically illustrated in Figure 2, presenting the waveforms determined for X = 50% and two values of the resistance of the arc-supplying circuit in the amount of R = 5% and R = 10%, as a function of the current consumed by the arc device expressed as a percentage of the rated current.
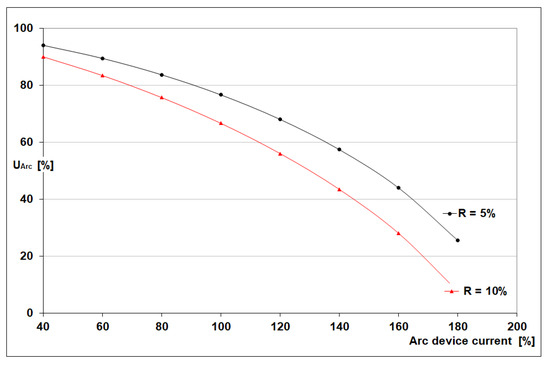
Figure 2.
Changes in the arc voltage as a function of the arc device current for two different resistance values of the arc-supplying circuit.
3. Power–Voltage Characteristics of the Arc Device Taking into Account the Resistance of the Circuit Supplying the Arc
Figure 3 shows a diagram of the arc supply system, taking into account the resistance in the supply circuit.
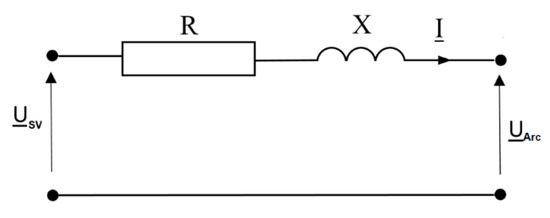
Figure 3.
Single-phase equivalent diagram of the arc furnace taking into account the resistance of the arc-supplying circuit.
The resistance value was adopted as 0.1 and 0.2 of the supply reactance value, i.e., R = 5% and R = 10%. For the resistances and reactances specified in this way, X = 50% (with
= 100%), and the service short-circuit current ISC is:
The arc voltage at the supply voltage = 100%, and current I (depending on the operating point of the arc device) is determined from the Formula (9).
For the rated current = 100% (at rated voltage), it was determined:
- -
- arc voltage :
- -
- arc resistance :
- -
- arc power :
- -
- active power drawn from the source :
- -
- reactive power :
- -
- apparent power :
The determined values will be helpful in determining the slope coefficients of the power–voltage characteristics of the active power and reactive power. Assuming that the value of the arc voltage depends only on its length, when changing the supply voltage from = 100% to ≠ 100%, the value of the current consumed by the arc device will change from I′ to I″: Formula (18):
was determined from the formula:
Similarly, for the voltage ≠ 100%, the following were determined:
- -
- arc power :
- -
- active power losses ∆P″:
- -
- active power supplied to the electric arc-supplying circuit P″:
- -
- reactive power supplied to the electric arc-supplying circuit Q″
As a result of changes in the current of the arc furnace, the supply voltage of the furnace changes. Figure 4 shows the dependence of changes in the supply voltage of the steel mill as a function of changes in the current of the arc furnace. Two exemplary levels of voltage changes between Point (H) and Point (L) are marked. The presented data was recorded in the power supply network of the steel plant. In the further part of the article, changes in the kp and kq coefficients resulting from changes in the supply voltage ∆U = USVH − USVL are considered. In Figure 4, blue is the color of the measured values of the supply voltage for a given value of the arc furnace current. The red color represents the trend line.
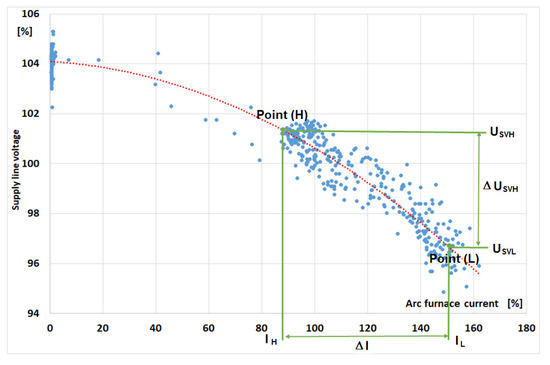
Figure 4.
Voltage changes as a function of furnace current changes.
With changes in the supply voltage USV resulting from voltage fluctuations caused by arc devices—from:
to
the inclination coefficients of the power–voltage characteristics are as follows:
and
where —active power difference, —reactive power difference.
The following part of the article presents an example of determining the kp and kq coefficients for the furnace current IM = 120% (which corresponds to the charge-melting current IM = 1.2 In), reactance X = 50%. and main resistance R = 10%.
For the rated voltage = 100%, the following will be determined:
- -
- arc voltage :
- -
- electric arc power :
- -
- active power P′:
- -
- reactive power Q′:
Assuming a constant value of the arc voltage with changes in the supply voltage (as a result of its fluctuations caused, for example, by a restless working receiver), Formulas (24) and (25), the current consumed by the arc device will change. For the assumed voltage fluctuations in the amount of: ∆U = 1%, = 100 + 0.5%, and ∆U = 10% = 100 + 5% (two ranges of voltage changes were introduced to analyze the influence of the fluctuations on the value of the kp and kq coefficients), the current will change, for ∆U = 1%—from:
to
The arc force values at these currents are:
In addition, the changes in active power are:
hence:
Moreover, the changes in reactive power are:
hence:
The kp and kq coefficients corresponding to the above changes amount to:
Correspondingly, for voltage fluctuations, ∆U2 = 10% of the current value will be: I−5 = 106.552% and I+5 = 132.916%; arc power: P−5Arc = 72.455% and P+5Arc = 90.383%; while changes in active power are ∆P+5 = P+5 − P−5 = 24.241%; and for reactive power are ∆Q+5 = Q+5 − Q−5 = 31.566%, while the resulting slope coefficients of the power–voltage characteristics are kp+5 = 2.525 and kq+5 = 4.384. The obtained values of the kp and kq coefficients are similar to the different ranges of voltage changes (∆U1 = 1% and ∆U2 = 10%) for a given average current (e.g., IM = 120%In) consumed by the arc device—Table 1.

Table 1.
Summary of the inclination coefficients of the power–voltage characteristics for two different ranges of voltage fluctuations.
Figure 5 summarizes the obtained values of the kp and kq coefficients as a function of the current consumed by the arc device.
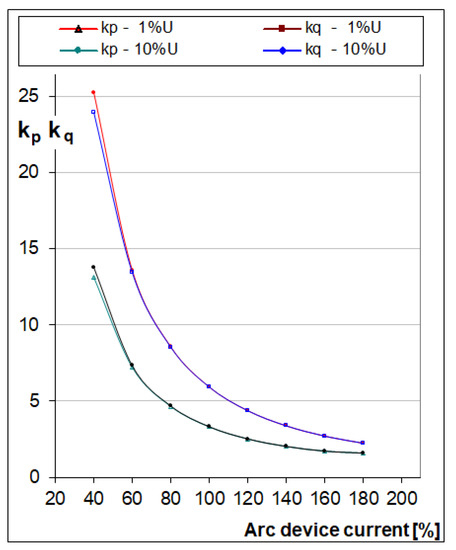
Figure 5.
Changes in the coefficients of power–voltage characteristics as a function of the current consumed by the arc device.
In the manner described above, the kp and kq coefficients were calculated for different resistances of the arc-supplying circuit. Table 2 and Figure 6 show the obtained results for the resistance R = 10%, which corresponds to the ratio R/X = 0.2 (at X = 50%) and, additionally, R = 20%, which corresponds to the ratio R/X = 0.4 with 1% changes in the supply voltage ∆U1 = 1%. Table 2 and Figure 6 and Figure 7 show the changes of kp and kq as a function of the current consumed by the arc furnace for R = 0 (resistance omitted—red).
Table 2.
Summary of the inclination coefficients of the power–voltage characteristics for various resistances of the circuit supplying the arc.
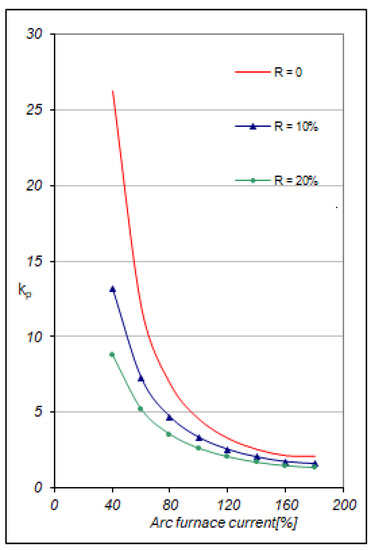
Figure 6.
Changes in the kp factor of the power–voltage characteristics for various arc supply resistances, as a function of the current consumed by the arc device.
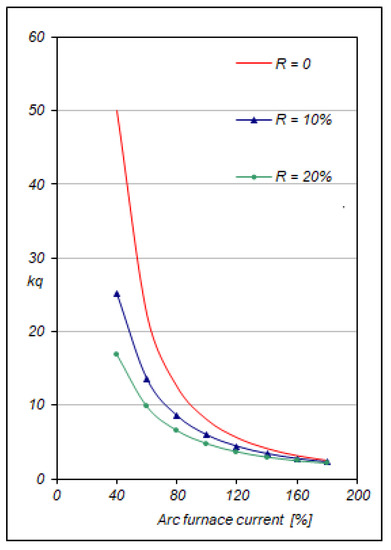
Figure 7.
Changes in the kq factor of the power–voltage characteristics for different arc supply resistances, as a function of the current consumed by the arc device.
4. Power–Voltage Characteristics of the Arc Device, Omitting the Resistance of the Circuit Supplying the Electric Arc of the Arc Furnace
In the following part, considerations are presented without the electric arc supply-circuit resistance. These assumptions correspond to the single-phase equivalent diagram of the arc device (furnace including mains) shown in Figure 8.
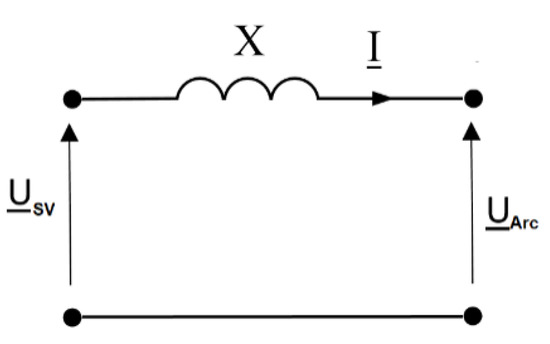
Figure 8.
Simplified single-phase equivalent diagram of the arc device, omitting the resistance in the electric arc supply line.
The value of the current in the circuit during operation—at a certain value of UArc, is determined from the formula:
the theoretical operational short-circuit current (electrode short-circuit with the charge) is determined by the relationship:
Active power, disregarding the losses in the supply circuit (R = 0), will be the power released in the arc.
and reactive power:
The value of the current at the operational short circuit of the electrodes with the charge is:
The rated current of the furnace transformer In = 100% and the melting current IM = 120%In were assumed as the values of currents significant for determining the conditions of the rational operation of the arc furnace. Additionally, the value of the maximum efficiency current IM, ensuring the maximization of the power released in the arcs and the maximum reduction in the time required for melting the scrap—even at the cost of overloading the arc device. W, this value, disregarding losses in the supply circuit R = 0, is determined by the relationship (for calculations, IM = 140%In was assumed)—Table 3:
Table 3.
Changes in the value of the arc voltage—UArc, reactive power consumed by the arc-supplying circuit—Q, arc power—PArc, for different values of the current consumed by the arc device.
The assumptions are made for the value of the arc voltage when working with rated current is:
power released in the arc:
and the reactive power of the supply circuit:
Figure 9 shows the operating characteristics of the arc voltage as well as active and reactive power (for the supply voltage = 100%).
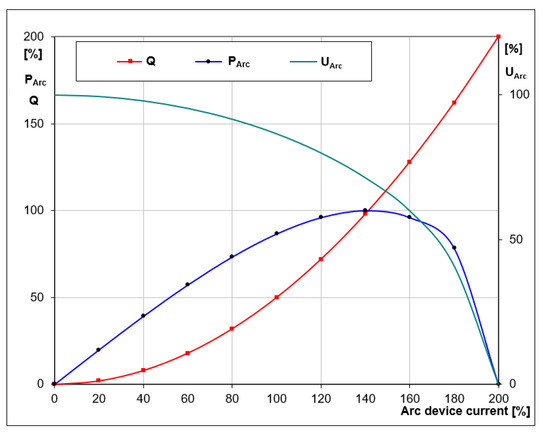
Figure 9.
Operating characteristics of an ideal arc device: ( = 100%, X = 50%, R = 0).
In the event of changes in the supply voltage (from the value of to the value of ), but while maintaining constant arc voltage, the arc current as well as the active and reactive power change.
The arc current is determined by the relationship:
which at a constant value of the arc voltage Uarc = const, and a constant value of the circuit reactance X = const leads to the formulas determining the values of the currents: I′ at rated voltage and I″ at a voltage different from the rated :
hence:
we have:
we obtain:
For reactive powers we have:
The changed values are:
Figure 10 shows the power changes P″ and Q″ as a function of the AC supply voltage within = 80% … 110%, for selected operating points defined by the arc voltages: UArcn = 86.603%, UArcM = 80%, UArcH = 70.71%, and UArcSC = 0 (electrodes short circuit with the charge).
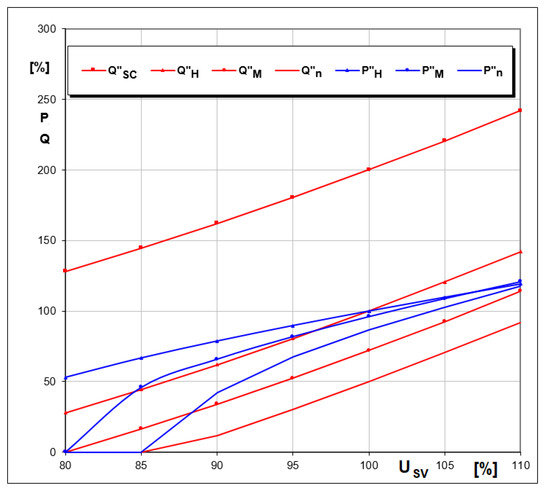
Figure 10.
Changes of reactive and active power as a function of supply voltage—operation at a constant arc voltage value (UArc = const).
Table 4 shows the values (expressed as a percentage) of the power corresponding to the characteristics in Figure 11.
Table 4.
Changes of reactive and active power of the arc device for different values of the supply voltage.
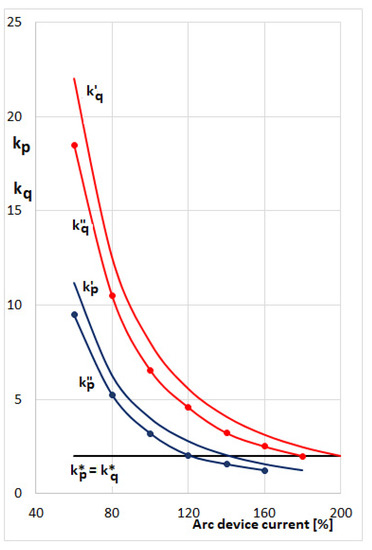
Figure 11.
Changes of the kp and kq coefficients as a function of the arc device current (for the supply voltage = 100% and ≠ 100%).
Figure 11 shows changes in kp and kq as a function of current. Attention should be paid to large values of these coefficients at lower currents, decreasing gradually with increasing current.
For the assessment of the interaction between the furnaces, it is important to estimate the influence of voltage changes on the reactive power consumption. Therefore, it is important to analyze the variability of the reactive power susceptibility coefficient kq, which is determined for the voltage changing around the voltage from the value to the value , with dependence:
which allows to determine the changes of the reactive power ∆Q″, depending on the changes of the supply voltage . Figure 12 shows the pie chart of the electric arc furnace. In Figure 12, the blue color shows the measured values of active power at a given value of the reactive power of the electric arc furnace. Black represents the trend line. Changes in the ∆U supply voltage cause changes in the ∆P active power and changes in the reactive power ∆Q. The effect of voltage changes on power changes is defined by the coefficients kp and kq.
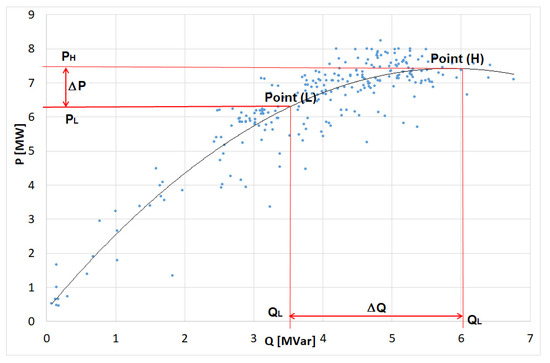
Figure 12.
Dependence of changes in reactive power and active power of the arc furnace.
Formula (61) results from the definition of the kq coefficient:
For the given range of current variation, adequately for the melting process carried out, when supplied with a voltage of a constant value (USV = const), the following dependence was found:
For the supply voltage = 100%, circuit reactance X = 50%, and currents I = 100–120–140–200%, we obtain:
- -
- arc voltage: UArc = 86.6–80–71.41–0%
- -
- reactive power value: Q′ = 50.0–72.0–98.0–200.0%
When the supply voltage changes from the upper level = 105% to the lower = 95%, i.e., when voltage fluctuations ∆U = 10%, they correspond to the reactive power values: QH = 70.5–92.5–118.5–220.5%
and: QL = 30.5–52.5–78.5–180.5%
As a result, the reactive power changes are: ∆Q = 40–40–40–40%,
For a constant value of voltage changes ∆U = 10%, it gives the value of the coefficient: = 8−5.55−4.08−2
and: ∆Q = 40–40–40–40%
So, it was obtained for different values of the current, different values of the coefficient of the slope of the reactive power characteristics (the arc mapped by a sinusoidal voltage with a constant RMS value depending on the arc length), and different values of the average reactive power Q′ (for the supply voltage, USV = 100%), while the ratio (71) remains constant.
For the furnace operation at the service short-circuit current = 2, it allows to determine the relationship, which is also important for other operating currents ( = 2—applies to an arc device with an arc represented by a resistance with a constant value, depending on the arc length):
The above property of the arc (mapped with the voltage UArc) also results from the relationship:
Similar dependencies can be given for the supply voltage U″ ≠ U′ (then, an additional factor should be entered: (U″/U′)2).
Formula (72) for the operational short-circuit state (UArc = 0) changes into the relationship
Formula (76) is of great importance for solving the problem of interactions between furnaces, because it enables the determination of the fluctuations in reactive power consumption, resulting from voltage fluctuations on the bus bars of the steel mill, using the coefficient = 2 and the short-circuit power of the furnace. This is a great simplification compared to the need to determine the coefficient and power Q″, depending on the operating point (this conclusion is correct, when the condition R/X = 0 is met).
5. Discussion
The proposed power susceptibility factors of active power—kp and reactive power—kq are applicable in practice. They were used to determine the increase in voltage fluctuations (and flicker of light) arising during the operation of several arc furnaces in relation to the fluctuations arising during the operation of a single furnace. The increase in fluctuations is determined by the KN coefficient. The method of determining the increase in light flicker proposed by UIE takes into account only the melting phases in arc furnaces.
For the assessment of superposition of voltage fluctuations, the substitute parameter Pst obtained with the use of the light flicker meter is assumed, which is determined from the relationship [24].
where for arc furnaces, the following values of the m coefficient are adopted:
m = 4—used only for the summation of voltage changes, due to arc furnaces specifically run to avoid coincident melts;
m = 2—used where coincident stochastic noise is likely to occur, e.g., coincident melts on arc furnaces.
Analyzing the waveforms of fast-changing voltage fluctuations recorded in the networks supplying arc devices, with a different number of arc furnaces operating in parallel, it was found that the mutual influence of the furnaces should be taken into account. Switching on successive arc furnaces causes an increase in the amplitude of voltage fluctuations, as well as a decrease in the average value of the supply voltage to the furnaces—Figure 13. The developed factors kp and kq allow for this phenomenon to be taken into account.
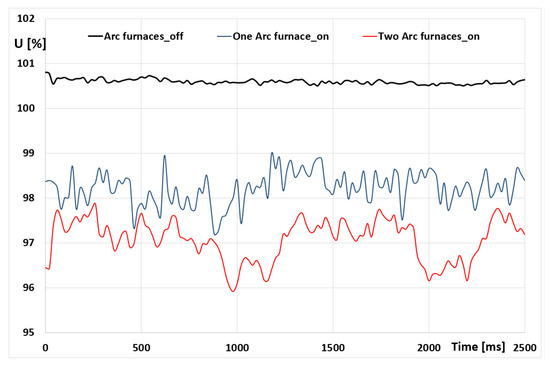
Figure 13.
RMS value changes recorded in the steel network supplying the steelworks with different numbers of arc furnaces.
Taking into account the decrease in the average voltage value resulting from the connected successive furnaces, the short-circuit power of the supply network, the number of arc furnaces operating in parallel, and the power of transformers of arc devices, the formulas allow for determining the KN coefficient
For the same arc devices in the scrap-melting phase, KN is determined from the formula:
and for arc devices with different powers of their furnace transformers, from the dependence:
where:
—slope coefficients of the power–voltage characteristic calculated at a constant arc voltage;
—the mean reactive power drawn by j-th furnace;
—the short-circuit power on the bus-bars of the steelwork (in PCC furnaces);
—the nominal power drawn by i-th furnace.
—voltage on the rails of the steel plant in the operation of N furnaces and in the operation of a single furnace (furnace with the highest power is the reference furnace).
The issues of voltage fluctuations and flickering caused by arc furnaces in detail have been discussed, among others, in publications [25,26].
In a steady state, both arc models lead to the same solution. The differences in the response of both models to voltage fluctuations are presented below. If the arc device works in a steady state at the rated current (In = 100%) and constant voltage (USV = 100%), when we only take into account the reactance of the supply network (X = 50%) for individual arcs models, we obtain:
RArc (electric arc replaced by resistance), UArc (electric arc replaced by a voltage source):
which proves that the models are equivalent to each other.
In case of voltage fluctuations: USV = 100 ± 5% for, e.g., two-state voltage changes, will change between the low state L: USVL = 95% and the high state H: USVH = 105%. Figure 14 shows a vector diagram showing the changes in voltage fluctuation between USVH and USVH.
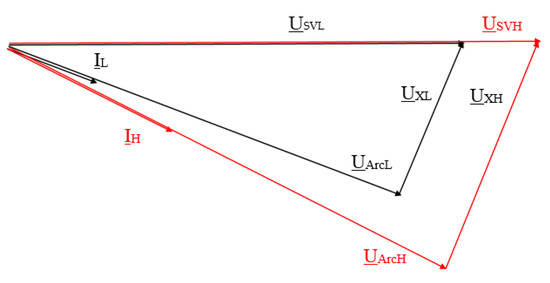
Figure 14.
Vector diagram of the currents and voltages of the arc furnace.
For high level (H) USVH = 105%, it can be written:
RArc (electric arc replaced by resistance), UArc (electric arc replaced by a voltage source):
and low level (L): USVL = 95%
For the compared models of arches, the coefficients kp and kq are, respectively:
RArc (electric arc replaced by resistance), UArc (electric arc replaced by a voltage source):
The presented calculations confirm that the reaction of the circuit to rapidly changing voltage fluctuations, using the constant resistance arc model, is different than the reaction to the same fluctuations when replacing the arc with a voltage source.
Using the kp and kq coefficients, it is possible to estimate the degree of suppression of disturbances generated by the arc devices. Figure 15 shows the changes in the kp and kq coefficients as a function of the ratio of the circuit resistance to the constant reactance (X = 50%) for the rated current I = 100% and the USV supply voltage changes = 1%. The damping effect of voltage fluctuations also depends on the power–voltage characteristics of low-voltage loads (e.g., devices for non-metallurgical processing of steels operating in a quiet manner—compared to scrap-metal arc furnaces or furnaces in the production phase).
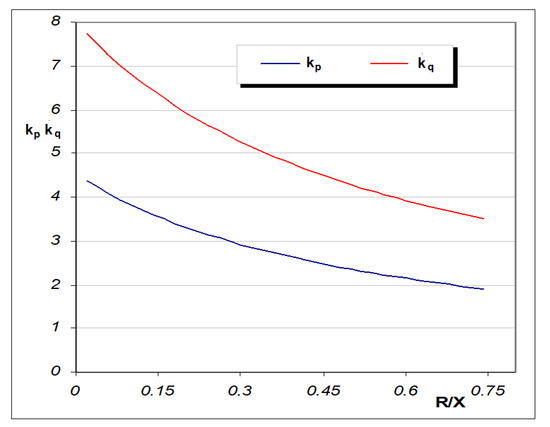
Figure 15.
Changes in the inclination coefficients of the power–voltage characteristics as a function of the ratio of resistance to reactance supplying the arc device (operation at rated current).
Figure 15 confirms the known fact that voltage fluctuations are more absorbed in LV and MV grids, where the resistance to reactance ratio is greater than in the case of HV and VHV grids. The absorbing effect of voltage fluctuations also depends on the power–voltage characteristics of low-voltage loads (e.g., devices for non-metallurgical processing of steels operating in a quiet manner—compared to scrap-metal arc furnaces or furnaces in the production phase). In the event of difficulties in determining these dynamic characteristics, practical approximate calculations can use the knowledge of the static power–voltage characteristics.
6. Summary
In the case of slow changes in the voltage supplying arc devices, it is recommended to use static power–voltage characteristics. Then, the power susceptibility factors = 2 and = 2 should be used. In the case of fast-changing voltage fluctuations, one should use the power–voltage characteristics determined for the condition UArc = const and assume the power susceptibility coefficients for active power or and reactive power or with a value depending on the operating point of the arc device. Then, the mutual influence of the arc devices on the supply conditions (changes in the supply voltage) is taken into account. For the characteristics using the developed kp and kq factors, the name of quasi-static power–voltage characteristics of arc devices is proposed.
Funding
This research received no external funding.
Institutional Review Board Statement
Not applicable.
Informed Consent Statement
Not applicable.
Conflicts of Interest
The author declares no conflict of interest.
Abbreviations
The following nomenclatures are used in this manuscript:
| USV | supply voltage |
| rated supply voltage ( = 100%) | |
| supply voltage different from the rated voltage ( ≠ 100%) | |
| the highest value of the supply voltage | |
| the smallest value of the supply voltage | |
| U* | arc voltage when the arc is replaced by resistance |
| UArc | electric arc voltage of the arc furnace |
| arc voltage at rated supply voltage ( = 100%) | |
| arc voltage at a supply voltage different from the rated voltage ( ≠ 100%) | |
| I | arc furnace current |
| IM | arc furnace melting current |
| In | nominal arc furnace current |
| ISC | arc furnace current when the electrodes are short-circuited with the charge |
| PArc | active power of the electric arc |
| P′ | active power at rated supply voltage ( = 100%) |
| Q′ | reactive power at rated supply voltage ( = 100%) |
| P″ | active power at a voltage different from the rated supply voltage ( ≠ 100%) |
| P* | active power when the arc is replaced with resistance |
| Q″ | reactive power at a voltage different from the rated supply voltage ( ≠ 100%) |
| Q* | reactive power when the arc is replaced with resistance |
| QSC | reactive power at the short-circuit of the electrodes with the charge |
| , | slope coefficients of the power–voltage characteristic calculated at a constant arc voltage and a constant arc resistance respectively |
| , | slope coefficients of power–voltage characteristics determined at constant arc voltage at rated supply voltage ( = 100%) |
| , | slope coefficients of power–voltage characteristics determined at constant arc voltage and supply voltage different from the rated one ( ≠ 100%) |
| Z | impedance of the circuit supplying the electric arc |
| R | resistance of the circuit supplying the electric arc |
| X | reactance of the circuit supplying the electric arc |
| Pst | short-term flicker severity |
| KN | coefficient determining the increase in flicker of light depending on the number of parallel operating arc furnaces in steel plant |
| PstN | value of the short-term light flicker indicator recorded during the operation N of arc furnaces |
| Pst1 | value of the short-term light flicker indicator recorded during the operation of a single arc furnace |
| N | number of parallel operating arc furnaces in steel plant |
| Sscf | short-circuit power capacity when shorting the electrodes with the scrap |
| Ssc | short-circuit power capacity of the network |
| Qj | mean reactive power drawn by j-th furnace |
| USN | voltage on the bus-bars of the steelwork at the work of N furnaces |
| USN1 | voltage on the bus-bars of the steelwork at the work of a one arc furnace |
References
- Tseng, K.J.; Wang, Y.; Vilathgamuwa, D.M. An experimentally verified hybrid Cassie–Mayr electric arc model for power electronics simulations. IEEE Trans. Power Electron. 1997, 12, 429–436. [Google Scholar] [CrossRef]
- Samet, H.; Farjah, E.; Zahra Sharifi, Z. A dynamic, nonlinear and time-varying model for electric arc furnace. Int. Trans. Electr. Energy Syst. 2015, 25, 2165–2180. [Google Scholar] [CrossRef]
- Pauna, H.; Willms, T.; Aula, M.; Echterhof, T.; Huttula, M.; Fabritius, T. Electric Arc Length-Voltage and Conductivity Characteristics in a Pilot-Scale AC Electric Arc Furnace. Metall. Mater. Trans. 2020, 51, 1646. [Google Scholar] [CrossRef]
- Horton, R.; Haskew, T.A.; Burch, R.F. A time-domain ac electric arc furnace model for flicker planning studies. IEEE Trans. Power Deliv. 2009, 24, 1450–1457. [Google Scholar] [CrossRef]
- Tang, L.; Kolluri, S.; McGranaghan, M.F. Voltage flicker prediction for two simultaneously operated AC arc furnaces. IEEE Trans. Power Deliv. 1997, 12, 985–992. [Google Scholar] [CrossRef][Green Version]
- Sadeghian, A.; Lavers, J.D. Dynamic reconstruction of nonlinear v–i characteristic in electric arc furnaces using adaptive neuro-fuzzy rule-based networks. Appl. Soft Comput. 2011, 11, 1448. [Google Scholar] [CrossRef]
- Alonso, M.A.P.; Donsion, M.P. An improved time domain arc furnace model for harmonic analysis. IEEE Trans. Power Deliv. 2004, 19, 367–373. [Google Scholar] [CrossRef]
- Cano Plata, E.A.; Tacca, H.E. Arc Furnace Modeling in ATP-EMTP. In Proceedings of the 6th International Conference on Power Systems Transients, Montreal, QC, Canada, 20–23 June 2005; pp. 19–23. [Google Scholar]
- Odenthal, H.J.; Kemminger, A.; Krause, F.; Sankowski, L.; Uebber, N.; Vogl, N. Review on Modeling and Simulation of the Electric Arc Furnace (EAF). Steel Res. Int. 2018, 89, 1700098. [Google Scholar] [CrossRef]
- Terzija, V.; Stanojevic, V. Power quality indicators estimation using robust Newton-typealgorithm. IEE Proc. Gener. Transm. Distrib. 2004, 151, 477–485. [Google Scholar] [CrossRef]
- Acha, E.; Madrigal, M. Power Systems Harmonics: Computer Modeling and Analysis; John Wiley & Sons: Hoboken, NJ, USA, 2001. [Google Scholar]
- Lee, C.; Kim, H.; Lee, E.J.; Baek, S.T.; Jae Woong Shim, J.W. Measurement-Based Electric Arc Furnace Model Using Ellipse Formula. IEEE Access 2021, 9, 155609–155621. [Google Scholar] [CrossRef]
- Marulanda-Durango, J.; Escobar-Mejía, A.; Alzate-Gómez, A.; Álvarez-López, M. A Support Vector machine-Based method for parameter estimation of an electric arc furnace model. Electr. Power Syst. Res. 2021, 196, 107228. [Google Scholar] [CrossRef]
- Lozynskyi, O.Y.; Paranchuk, Y.S.; Paranchuk, R.Y.; Matico, F.D. Development of methods and means of computer simulation for studying arc furnace electric modes. Electr. Eng. Electromech. 2018, 28–36. [Google Scholar] [CrossRef]
- Bhonsle, D.C.; Kelkar, R.B. Simulation of Electric Arc Furnace Characteristics for Voltage Flicker study using MATLAB, International Conference on Recent Advancements in Electrical. In Proceedings of the 2011 International Conference on Recent Advancements in Electrical, Electronics and Control Engineering, Sivakasi, India, 15–17 December 2011; pp. 174–181. [Google Scholar]
- Ghiormez, L.; Prostean, O.; Panoiu, M.; Panoiu, C. GUI for studying the parameters influence of the electric arc model for a three-phase electric arc furnace. IOP Conf. Ser. Mater. Sci. Eng. 2017, 163, 012026. [Google Scholar] [CrossRef]
- Mokhtari, H.; Hejri, M. A new three phase time-domain model for electric arc furnace using MATLAB. In Proceedings of the IEEE Asia-Pacific Transmission and Distribution Conference and Exhibition, Yokohama, Japan, 6–10 October 2002; Volume 3, pp. 2078–2083. [Google Scholar]
- Gajic, D.; Savic-Gajic, I.; Savic, I.; Georgieva, O.; Di Gennaro, S. Modelling of electrical energy consumption in an electric arc furnace using artificial neural networks. Energy 2016, 108, 132–139. [Google Scholar] [CrossRef]
- Lei, W.; Wang, Y.; Wang, L.; Cao, H. A Fundamental Wave Amplitude Prediction Algorithm Based on Fuzzy Neural Network for Harmonic Elimination of Electric Arc Furnace Current. Math. Probl. Eng. 2015, 2015, 268470. [Google Scholar] [CrossRef]
- Kowalski, Z. Unbalance in Electrical Power Systems; PWN (Polish Scientific Publishers): Warsaw, Poland, 1987. [Google Scholar]
- Kowalski, Z. Voltage Fluctuations in Power Systems; WNT: Warsaw, Poland, 1985. (In Polish) [Google Scholar]
- Kurbiel, A. Electrothermal Arc Devices; WNT: Warszawa, Poland, 1988. (In Polish) [Google Scholar]
- Olczykowski, Z. Arc Voltage Distortion as a Source of Higher Harmonics Generated by Electric Arc Furnaces. Energies 2022, 15, 3628. [Google Scholar] [CrossRef]
- UIE. Guide to Quality of Electical Supply for Industrial Installations. Part 5. Flicker and Voltage Fluctuations; Power Quality, Working Group WG 2; UIE: North Andover, MA, USA, 1999. [Google Scholar]
- Olczykowski, Z. Modeling of Voltage Fluctuations Generated by Arc Furnaces. Appl. Sci. 2021, 11, 3056. [Google Scholar] [CrossRef]
- Olczykowski, Z.; Łukasik, Z. Evaluation of Flicker of Light Generated by Arc Furnaces. Energies 2021, 14, 3901. [Google Scholar] [CrossRef]


Publisher’s Note: MDPI stays neutral with regard to jurisdictional claims in published maps and institutional affiliations. |
© 2022 by the author. Licensee MDPI, Basel, Switzerland. This article is an open access article distributed under the terms and conditions of the Creative Commons Attribution (CC BY) license (https://creativecommons.org/licenses/by/4.0/).