Abstract
Electrified vehicles (EV) and marine vessels represent promising clean transportation solutions to reduce or eliminate petroleum fuel use, greenhouse gas emissions and air pollutants. The presently commonly used electric energy storage system (ESS) is based on lithium-ion batteries. These batteries are the electrified or hybridized powertrain’s most expensive component and show noticeable performance degradations under different use patterns. Therefore, battery life prediction models play a key role in realizing globally optimized EV design and energy control strategies. This research studies the data-driven modelling and prediction methods for Li-ion batteries’ performance degradation behaviour and the state of health (SOH) estimation. The research takes advantage of the increasingly available battery test and data to reduce prediction errors of the widely used semi-empirical modelling methods. Several data-driven modelling techniques have been applied, improved, and compared to identify their advantages and limitations. The data-driven approach and Kalman Filter (KF) algorithm are used to estimate and predict the degradation of the battery during operation. The combined algorithm of Gaussian Process Regression (GPR) and Extended Kalman Filter (EKF) showed higher accuracy than other algorithms.
1. Introduction
Today, the transportation sector contributes to about 30 percent of greenhouse gas (GHG) emissions and a significant amount of harmful air pollutants [1]. The vehicle electrification and hybridization rely on the electric energy storage system (ESS), based on lithium-ion (Li-ion) batteries, to serve as the sole source of propulsion energy for a battery electric vehicle (BEV) or an energy reservoir of a hybrid electric vehicle (HEV) to improve the operation condition and energy efficiency of the internal combustion engine (ICE). Li-ion batteries are thus critical for cleaning and decarbonizing transportation applications. The battery ESS contributes to about 1/3 to 1/2 the cost of a BEV [2]. Reduction in the costs of the battery ESS is the key to the commercial success and wide adoption of the zero pump-to-wheel (PTW) emission BEVs. An efficient means for reducing their lifecycle cost (LCC) is to extend their operating life by avoiding performance degrading and life-shortening operations.
The main reason for the performance degradation of Li-ion batteries is that the electrodes are deformed and fractured due to the stress generated during the intercalation/extraction of Li-ions, causing short circuits and making the active electrode materials unable to store Li-ions. In general, the main consequences of battery performance degradation include the capacity decay and impedance increment. The capacity decay is mostly due to the solid-electrolyte layer (SEI) formation on the anode and side reactions on the cathode, while the battery impedance can be affected by the material disordering and decomposition as well as the formation of SEI. Specifically, the main reasons for carbon-based anode deterioration are SEI formation and growth, corrosion of active carbons, lithium metal plating at low temperatures or high rate currents, etc. As for lithium metal oxide cathodes, wearing of active materials, compound structure changings, and electrolyte dissolving are relevant to the performance decay. The authors of [3] gave modelling examples related to mass transport in electrolytes and/or intercalated electrodes; ref. [4] developed a model of stress generated during lithiation of lithium-ion battery electrodes, showing that the mechanical properties of electrode materials change during lithiation/delithiation and affect diffusion-induced stress. In [5], an electro-chemical-mechanical coupling model was established, considering the effect of elastic hardening on the diffusion of graphite anode materials. It was concluded that the internal stress field strongly depends on the lithium-ion concentration field and is positively correlated. As the state of health of Li-ion batteries is difficult to measure and susceptible to interference, a high-precision SOH estimation and prediction is a core technical challenge that needs to be solved urgently. Accurately estimating the SOH of Li-ion batteries is very important for energy management, and it has become a research hotspot for many scholars in recent years. The latest research on Li-ion battery prediction and health monitoring was reviewed in [6] and focused on summarizing technologies, algorithms, and remaining useful life (RUL) predictions for the state of charge (SOC) estimation, current/voltage estimation, capacity estimation, and remaining power. The monitoring methods of battery charge status, capacity, impedance parameters, available power, health status, and remaining service life were reviewed in [7]. Their advantages and disadvantages were compared when used online.
The data-driven method uses the available battery testing data to predict the battery performance and degradation, avoiding mathematically modelling complex electrochemical reactions inside Li-ion batteries. The relationship between feature parameters and health status is established by extracting the feature values of directly or indirectly measured parameters, combined with data mining algorithms. The equivalent circuit and electrochemical models were combined to form an improved battery model [8]. An enhanced battery SOH estimation method based on the unscented Kalman filter (UKF) algorithm was proposed, which considered the different values of battery internal resistance under other working conditions. A new hybrid adaptive observer and extended Kalman filter (EKF) method were proposed in [9] to jointly estimate the SOC, internal resistance and SOH of Li-ion batteries. This method provided robust performance against model uncertainty and showed good parameter convergence characteristics. The battery SOH prediction was solved in [10] based on the deep learning technology of the cyclic neural network with memory. For different temperature values, the estimation results were accurate. An online SOH estimation method was proposed in [11] based on support vector machines, which used the flexible partial charging section under constant current charging to estimate the battery capacity. Many studies have used multiple algorithms to superimpose methods to establish a hybrid model to assess and predict the SOH of Li-ion batteries, improving the accuracy and making up for the lack of experimental data. A battery SOH state-space model was established in [12] based on support vector regression to simulate the battery aging mechanism, and particle filters were studied to estimate impedance degradation parameters. A hybrid forecasting scheme was proposed in [13] that combined a particle filter and relevance vector machine with uncertainty evaluation capability. A Li-ion battery health assessment method was proposed in [14] based on incremental capacity analysis and a weighted Kalman filter algorithm.
The primary purpose of this paper is to build a Li-ion battery degradation model to estimate and predict the battery’s energy decay during usage. First, using the characteristics of current and voltage changes during the process of multiple charging and discharging, the GPR and backpropagation (BP) neural network methods are applied to estimate the health of the battery. Then, the two KF algorithms are used to predict the battery’s lifetime. Finally, the comparison is given, and the method with higher accuracy and more practical application is selected.
2. Sources of Li-Ion Battery Performance Degradation Data
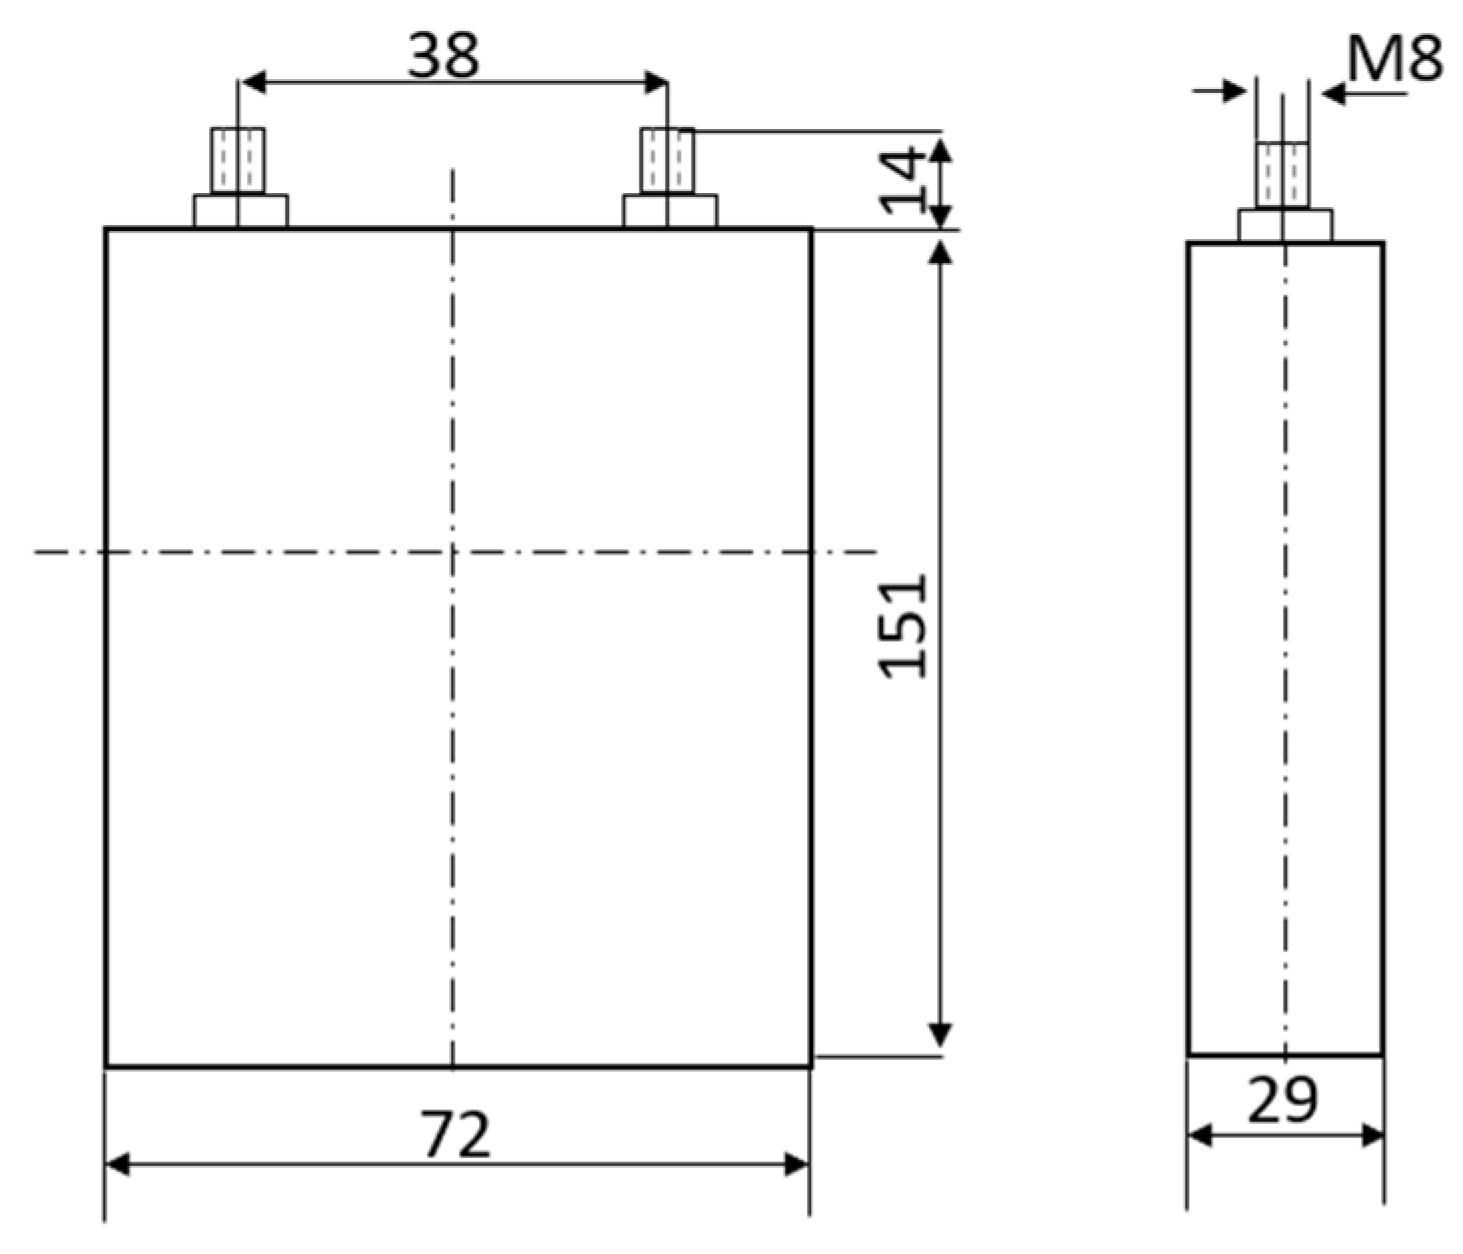
The LiFePO4 (LFP) battery performance degradation data used in this work were provided by the State Electric Vehicle Power Battery Testing Center in Beijing, China. The tested battery is an LFP/C-type battery, which has an LFP cathode, graphite anode, and electrolyte comprised of organic solvent with Li salt (ethylene carbonate (EC), dimethyl carbonate (DMC), and LIPF6) and various additives. The technical parameters of the battery are shown in Figure 1 and Table 1.
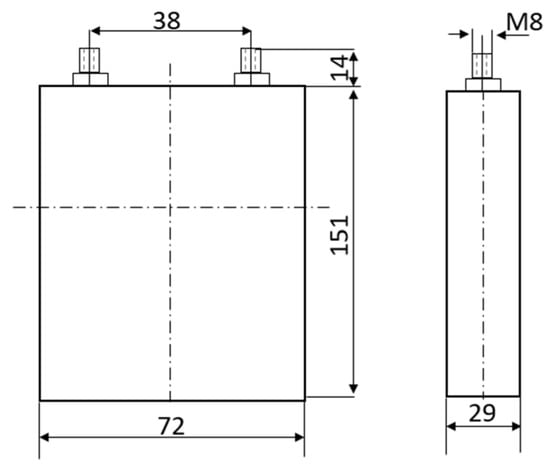
Figure 1.
Product appearance and schematic diagram of battery size.

Table 1.
Technical data sheet of Li-ion battery.
The battery is subjected to repeated charge–discharge cycles in an environmental chamber at a controlled temperature of 25 °C to measure the battery’s capacity degradation through cycling curves. The battery was first charged at a constant current, and when the voltage reached 3.6 V, it was charged at a constant voltage until the current reached 0. After a 20 min rest, the battery was discharged at a constant current until it reached the cutoff voltage of 2.5 V and rested for 20 min, which constituted a cycle.
Cycling tests are performed at 1C charge and 2C discharge current rates, with a capacity test of 1/3C charge and 1/3C discharge approximately every 26 cycles, where 1C means the battery is fully discharged in 1 h. The battery capacity shows a decreasing trend in about 2000 cycles, as shown in Figure 2.
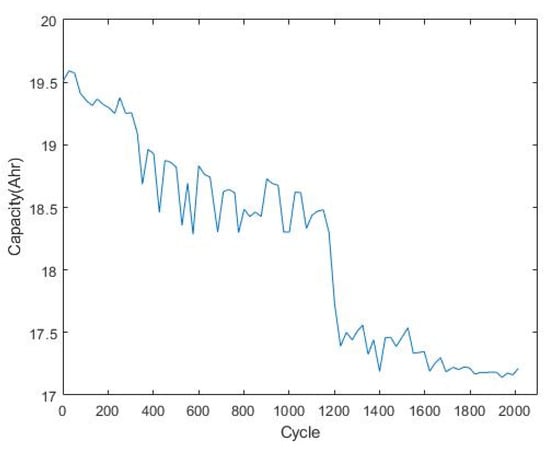
Figure 2.
Battery capacity changes in test cycles.
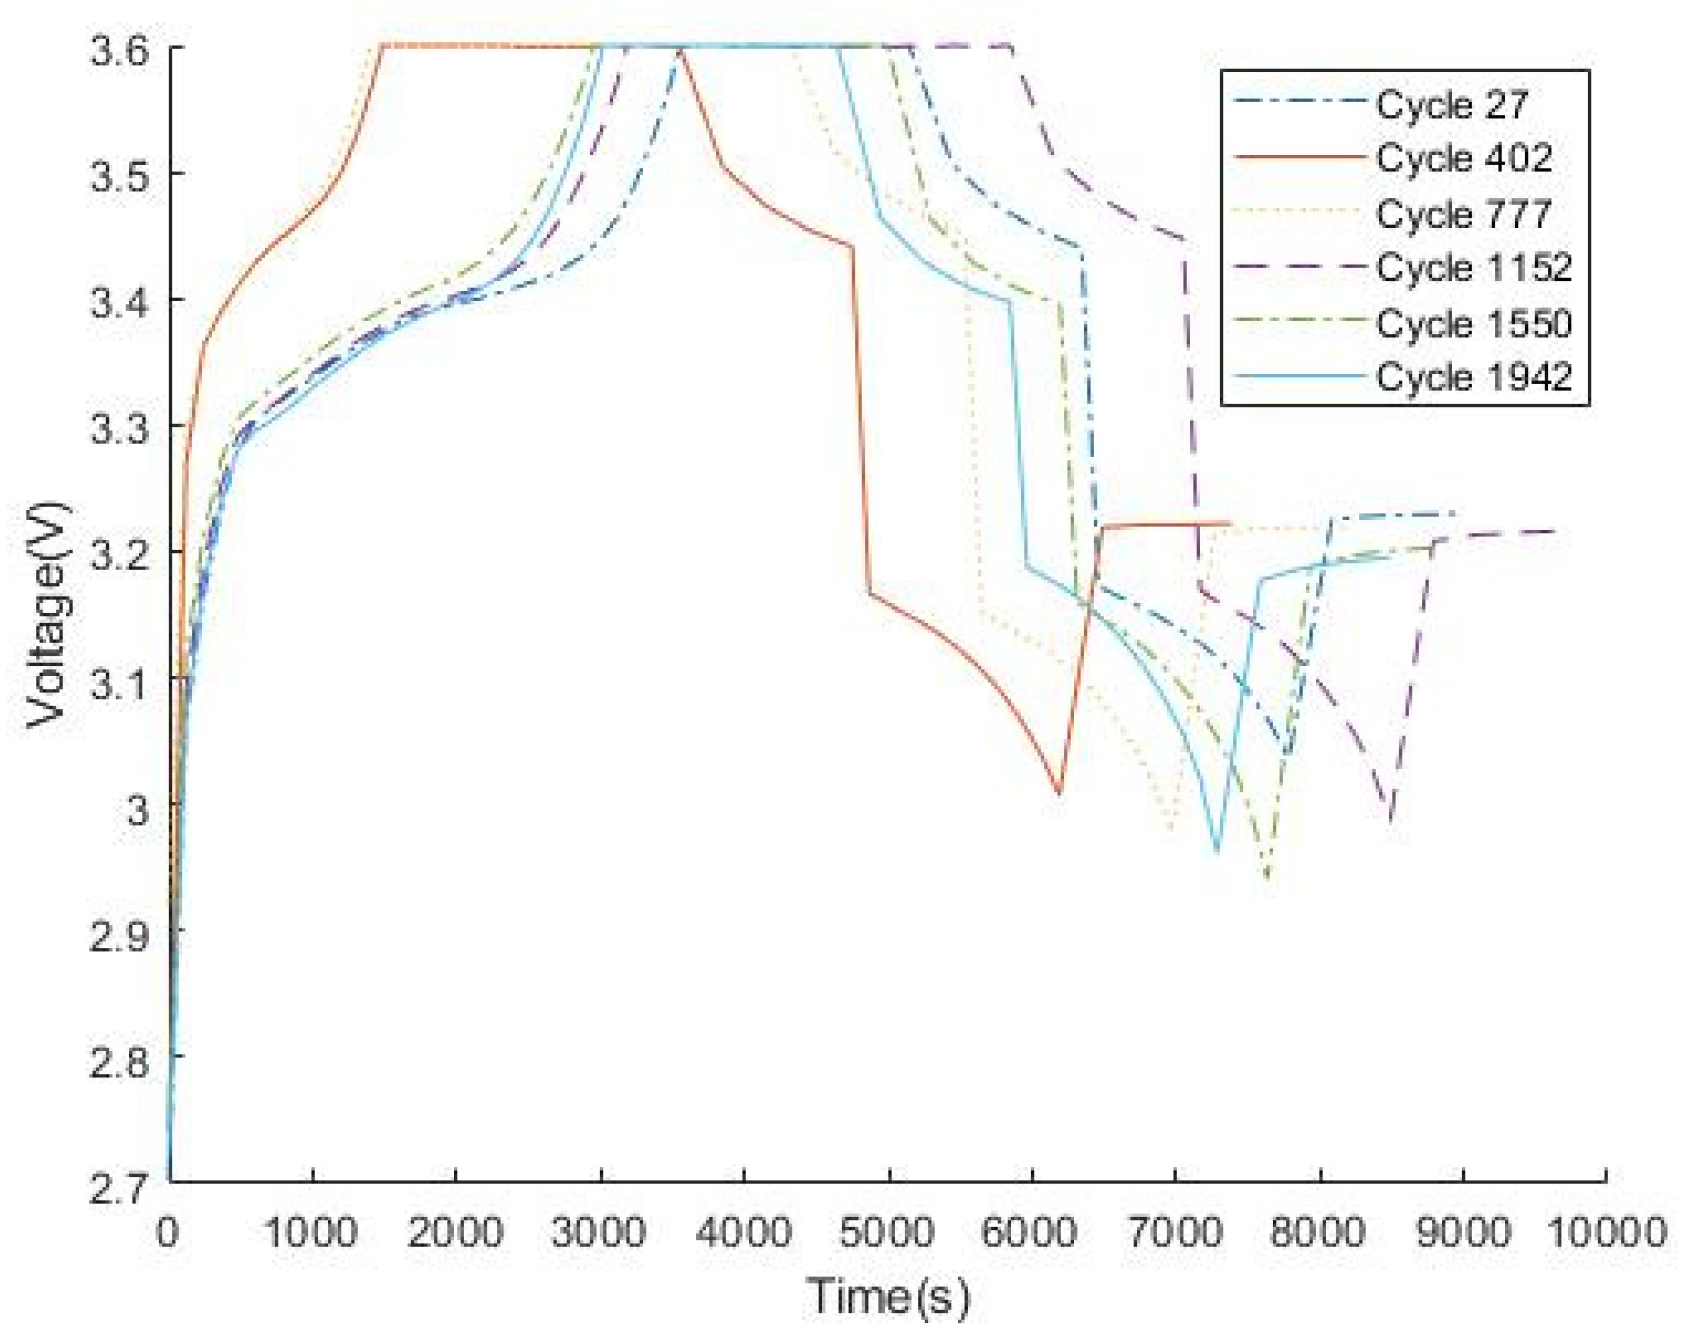
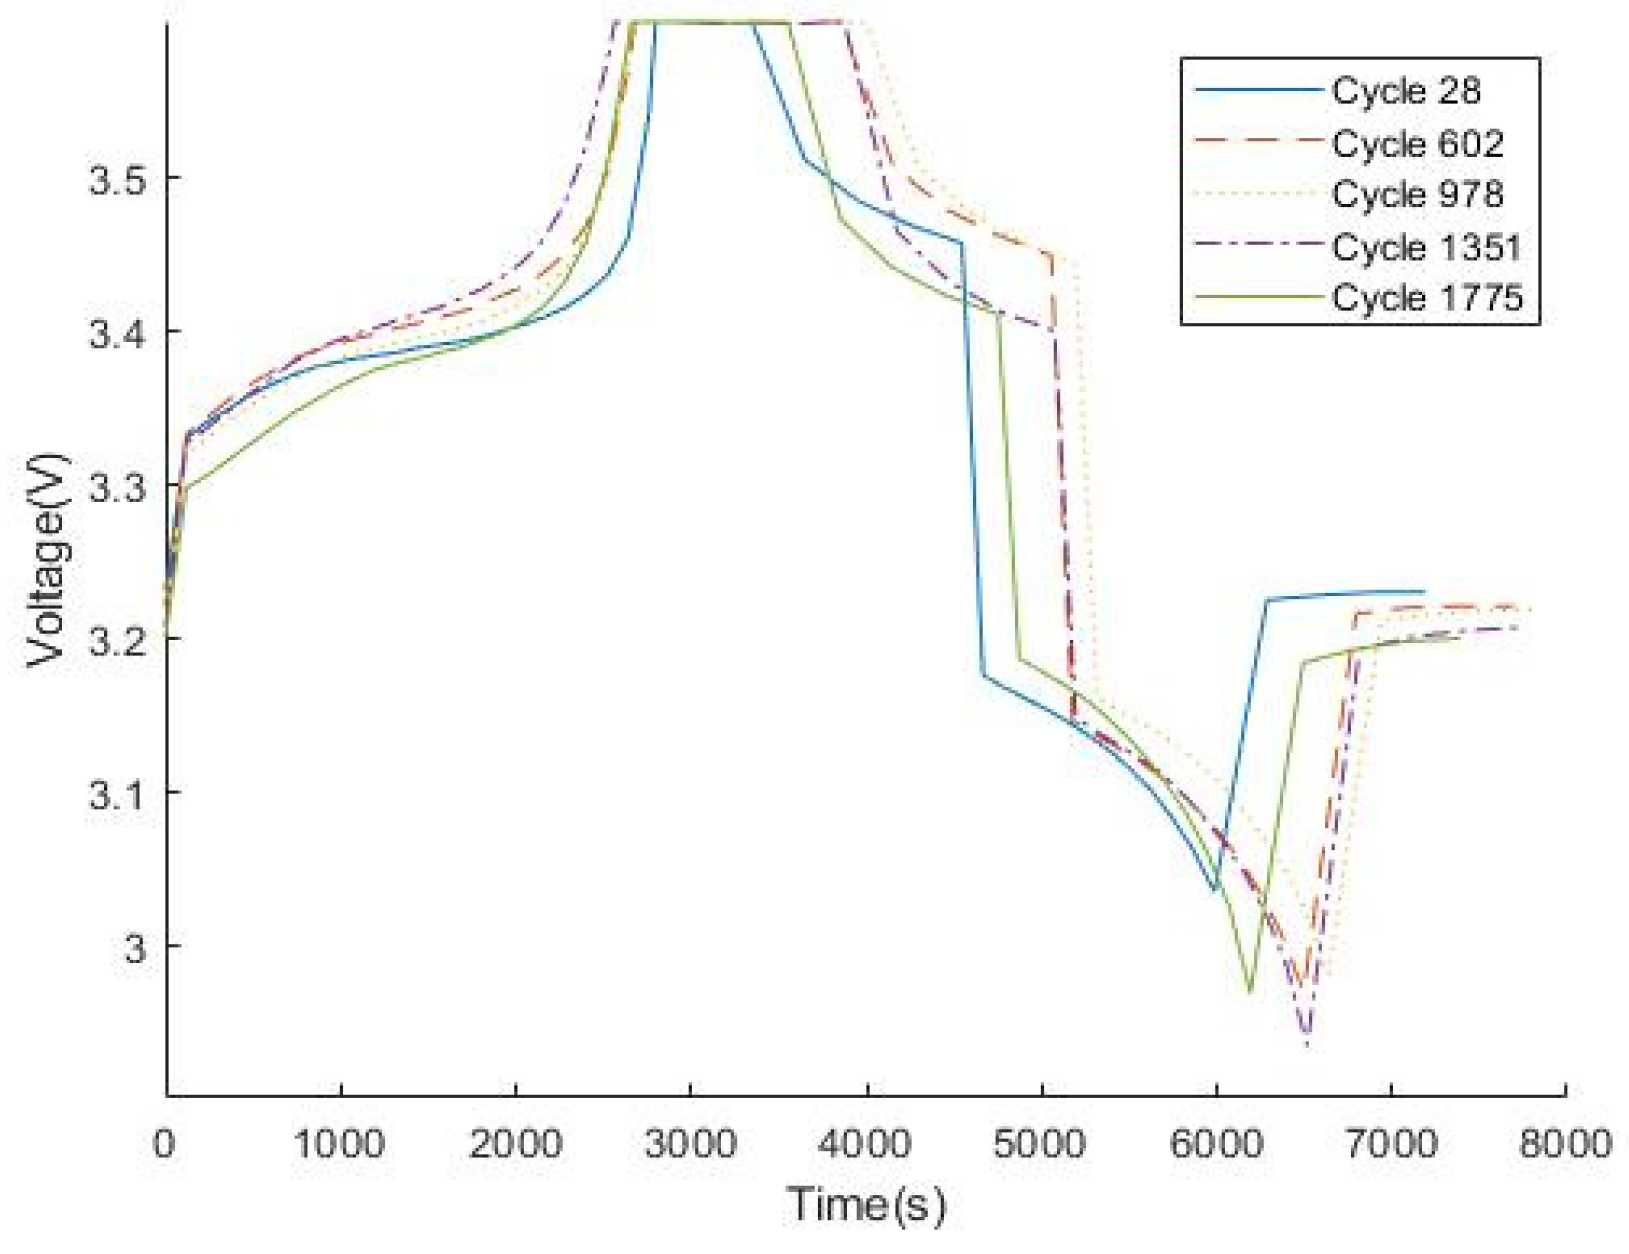
Several typical capacity cycle test data under capacity test cycles are shown in Figure 3. With the increase of the number of cycles, the charging and discharging time tends to shorten, so it can be concluded that the capacity of the battery to store energy is gradually decreasing, and the maximum capacity is decreasing.
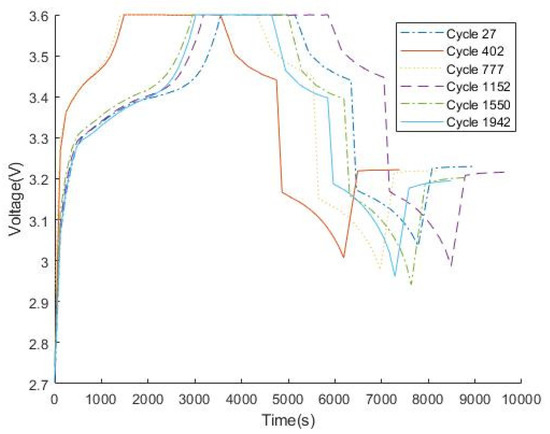
Figure 3.
Voltage variation during different capacity test cycles.
3. Battery Performance Degradation and Life Prediction Model
Predicting the impact on the remaining useful life of the battery under various working conditions, including the current, depth of discharge (DOD), and frequency of charges and discharges, is critical to the optimal sizing of the battery ESS and the optimal power control/energy management of the battery ESS for electrified vehicles, marine vessels and all mechatronic systems using a battery ESS. These impacts are application-specific, and custom optimal design and energy management strategies are needed to reduce the system’s lifecycle cost.
The data-driven modelling and prediction method directly uses historical data to predict the battery’s aging trend without understanding the complex and less predictable aging mechanism and expansion law. Furthermore, this method does not build a specific physical model, but rather a statistical or machine learning model using experimental data. Because the data-driven method avoids the complex form identification and parameter fitting processes in theoretical and semi-empirical modelling, the approach is more flexible and easier to use. As a result, it has attracted widespread attention from researchers worldwide.
Typical data-driven modelling techniques for predicting remaining battery life are regression and artificial neural network (ANN), filter-based methods, including extended Kalman filter (EKF) and unscented Kalman filter (UKF).
3.1. Capacity Fading Rate
In the past few years, plenty of research has put great effort into developing models to predict the capacity fading of Li-ion batteries. The experimental results in [15] show that the capacity loss is greatly affected by time and temperature, and the capacity loss has a power–law relationship with time or charge throughput. Thus, ref. [15] considered the current–time measure, Ah throughput, charge–discharge speed, C rate, and temperature, T to build a generalized battery life model.
The battery capacity is modelled in the following way:
where is the current rate, is the ideal gas constant, is the temperature, is the amount of charge delivered by the battery during cycling, expressed as , is the maximum capacity of the battery, is the depth of discharge, is the cycling number, and are the model parameters.
This work uses this existing semi-empirical battery capacity degradation model to guide the machining process. However, this model has a minor influence on the outcome of the machining process, as shown later in Section 4.2.
Based on regression analysis of experimental data, ref. [16] found that the exponential model of the following form can well describe the capacity fading trend of many batteries.
Reference [17] used second-order polynomials to model and estimate battery capacity.
The state-space equations can be written as follows:
3.2. Data-Driven Modeling
GPR is a valuable tool in machine learning. Regression aims to find a function that describes a given set of data points as closely as possible. A Gaussian process assigns each such role a probability value for this purpose. The mean of this probability distribution represents the most likely representation of the data. The basic idea of Gaussian Process Regression is that points are known, and the original n ys are regarded as obeying Gaussian distribution. For the new , the still follow a joint normal distribution.
ANN is a nonlinear, adaptive information processing system composed of many interconnected processing units. It consists of a large number of interconnected nodes. Each node represents an activation function. Each connection between two nodes represents a weighted value for the signal passing through that connection. The network’s output varies according to the connection method of the network, the weight value and the excitation function.
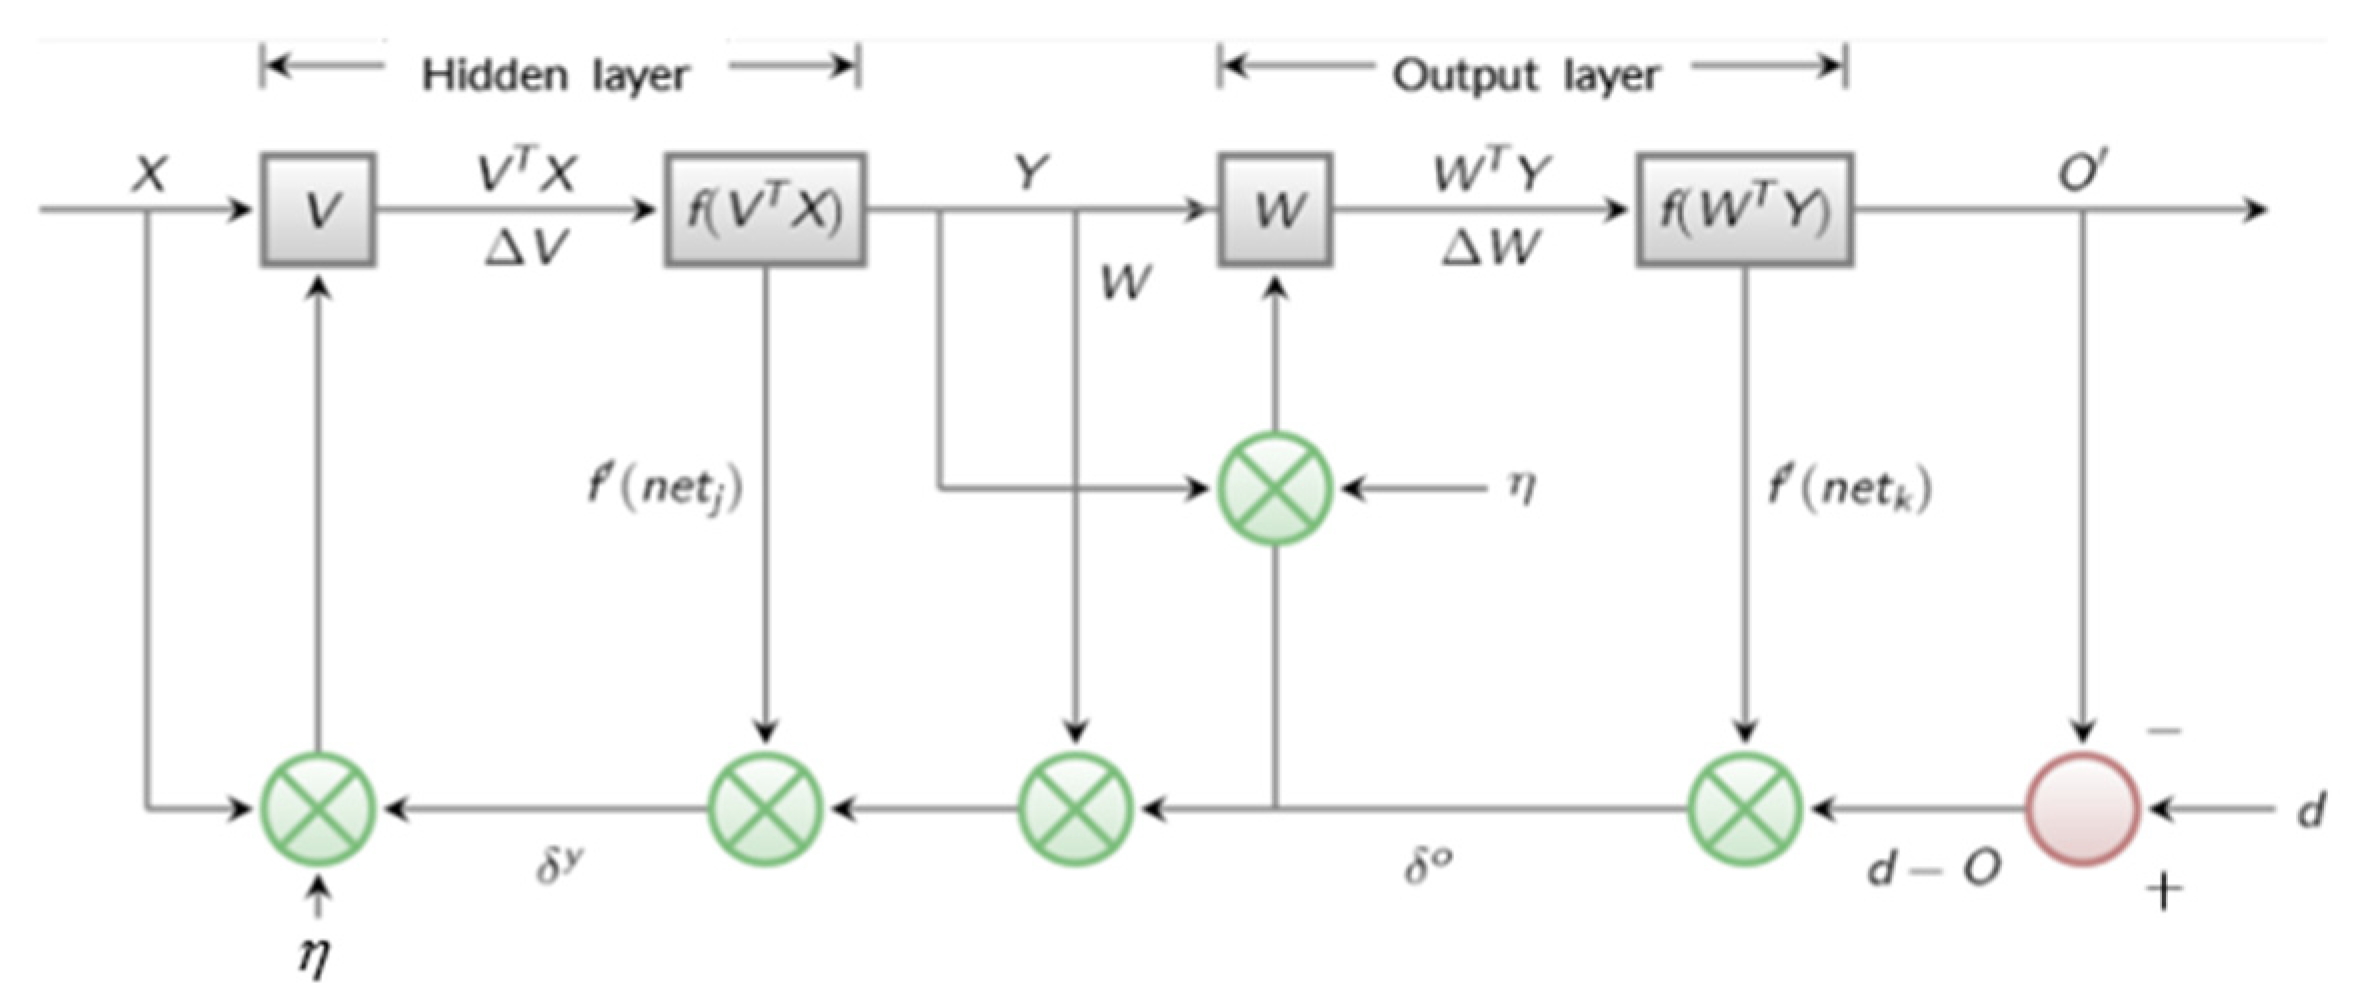
BP neural network is a multilayer feedforward network trained by an error backpropagation algorithm, is shown in Figure 4. and it is one of the most widely used neural network models. The BP network can learn and store a large number of input–output pattern mapping relationships without revealing the mathematical equations describing this mapping relationship in advance. Its learning rule is to use the steepest descent method to continuously adjust the weights and thresholds of the network through backpropagation to minimize the sum of squared errors of the network.
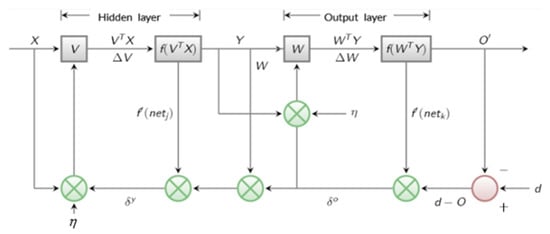
Figure 4.
Signal flow diagram of BP algorithm [18].
In this paper, since the voltage shows regular changes in different cycles, the voltage values at different time points are used to estimate and predict the battery’s capacity.
3.3. Prediction Techniques
Kalman filtering is an algorithm that uses linear system state equations to optimally estimate system states through system input and output observation data. Since the observation data include noise and interference in the system, the optimal estimation can also be considered a filtering process. KF is an optimal recursive data processing algorithm, the most efficient and valuable method. It is widely used in various fields, including robotics, navigation, control, etc. KF estimates the state of a linear random system. However, in practice, many systems are nonlinear. When dealing with these systems, there are two common methods. EKF applies Taylor series expansion to linearize a nonlinear system, while UFK uses probability distribution to approximate nonlinearity.
The state equation and observation equation of EKF are
Expand (5) with Taylor’s expansion at the last estimate and state prediction , respectively.
where and denote the Jacobian matrices of functions and at and , respectively.
UKF is a combination of Unscented Transform (UT) and standard KF. Through UT, the nonlinear system equation is suitable for the traditional Kalman system under the linear assumption. UT uses a fixed number of parameters to approximate a Gaussian distribution. The approach takes some points in the original distribution according to a specific rule. The mean of these points is the mean and covariance of the covariance state distribution and the initial state distribution. It then substitutes these points into the nonlinear function. The corresponding nonlinear function value point set is obtained, and the mean value and covariance of the transformation are obtained through these point sets.
3.4. Evaluation Indictor
To evaluate the prediction performance of the proposed ensemble method, we use the root mean square error , the mean absolute error and the coefficient as the evaluation indicator.
where , and represent the predicted, actual and average battery capacity. For the indicators and , when their value is close to 0, the estimation accuracy is higher. The estimation accuracy is higher for the indicator when its value is close to 1.
4. Battery SOH Estimation and Prediction
The model testing set is uniformly sampled using ¼ of the total battery experimental data. The remaining ¾ of the experimental data is used as the model training data set, considering the characteristics of the voltage curve sampled at different time points as input. In GPR, the distribution of possible functions is updated by probabilistic inference and data points, while in ANN, a function is approximated by updating parameters. After the training set is trained based on different algorithms, the battery’s capacity in the test set is estimated. Then, based on the generalized model of the battery, KF is used to predict the SOH in the future cycles of the battery. Finally, the results of different combinations of algorithms are compared in terms of accuracy and being time-consuming.
4.1. Performance Degradation Prediction Based on Capacity Degradation Data
The capacity degradation of the battery, modelled using the battery testing data, is shown in Figure 5. According to the results in Table 2, the results based on GPR operation have higher accuracy when using capacity test data. For the prediction algorithm, UKF and EKF have similar effects. The accuracy of EKF is slightly higher in this experiment.
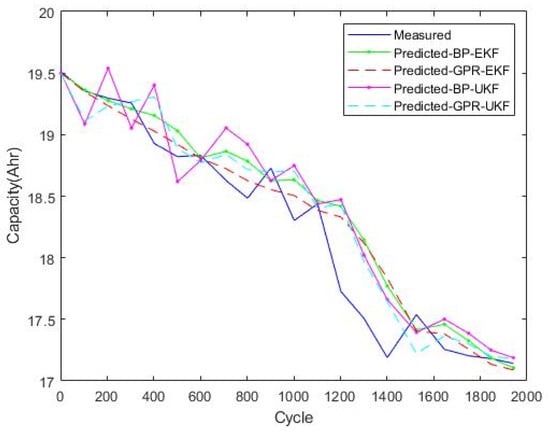
Figure 5.
Prediction for battery based on capacity test cycles.
Table 2.
Comparison of different algorithms based on capacity test cycles.
4.2. Comparison of KF Results Based on Different Degradation Models
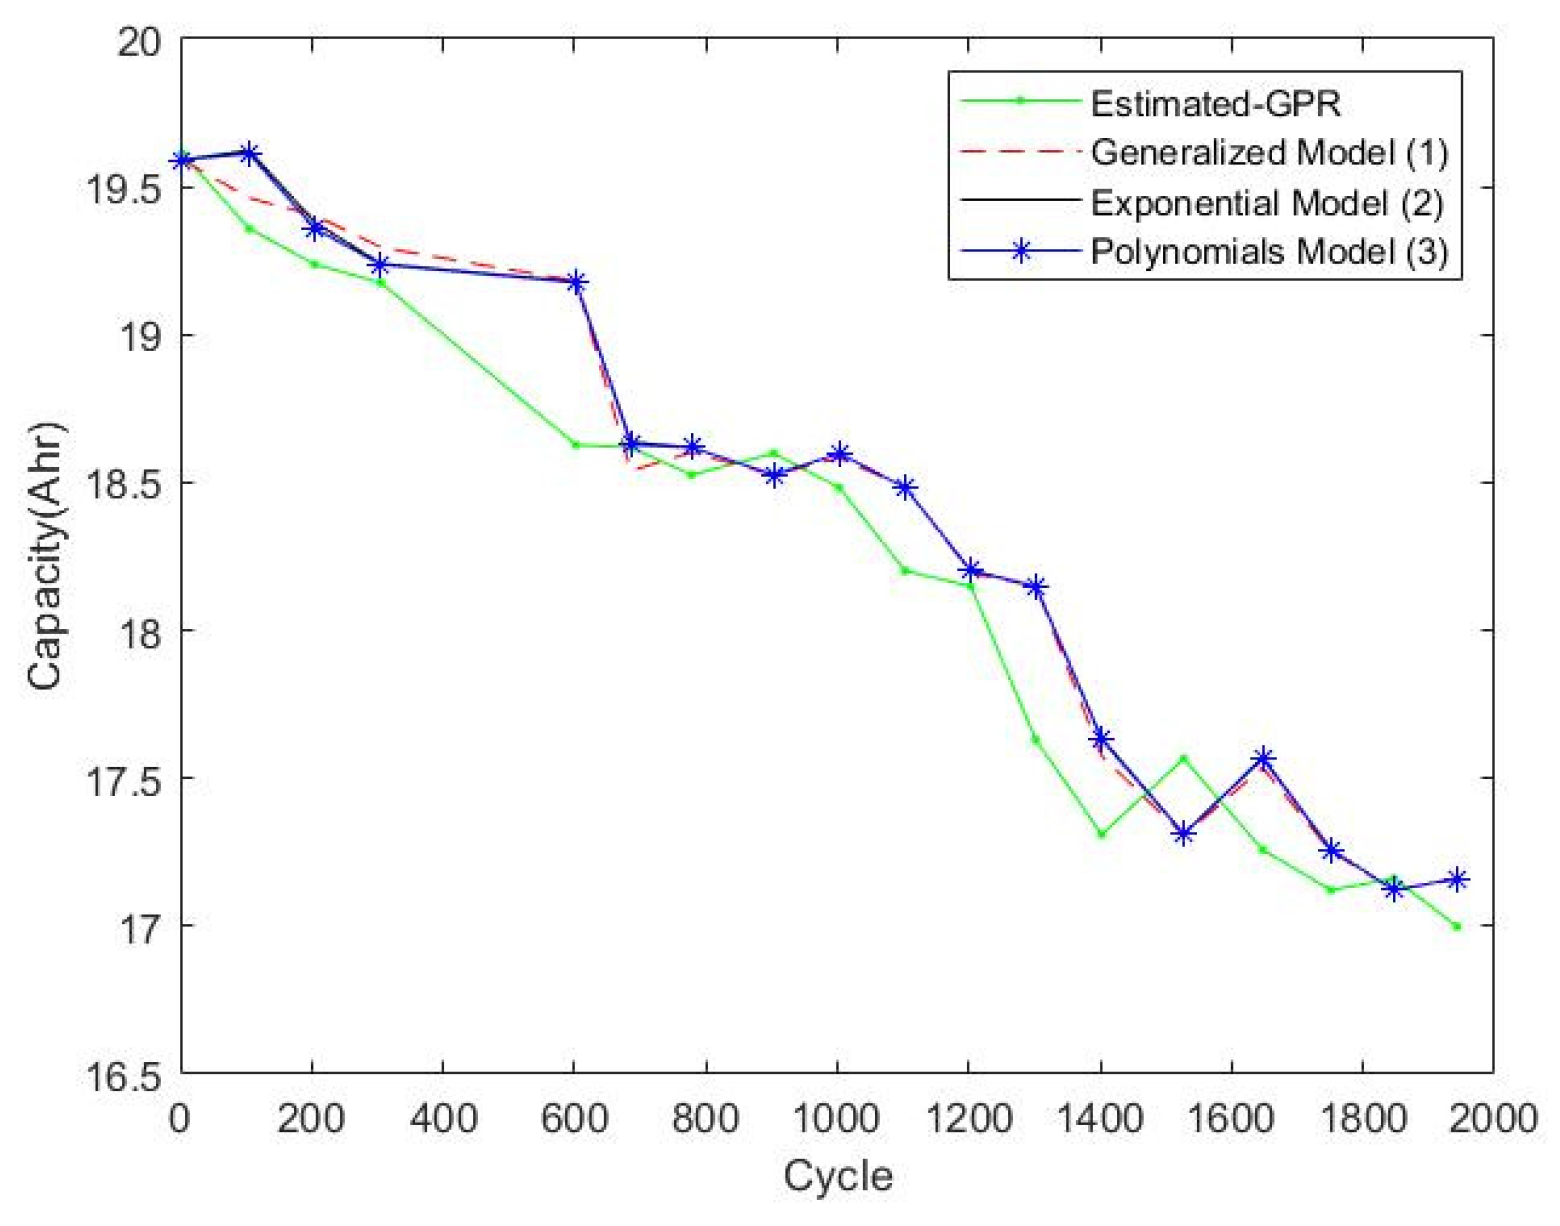
Determining the form of the battery performance degradation model is challenging due to the complex battery deterioration mechanism. Results from the data-driven GPR method are largely independent of the original model form and determined by the test data, as confirmed in this work. Three commonly used battery life decay models predicted by EKF used the generalized, exponential and polynomials models and were tested, producing the results shown in Figure 6.
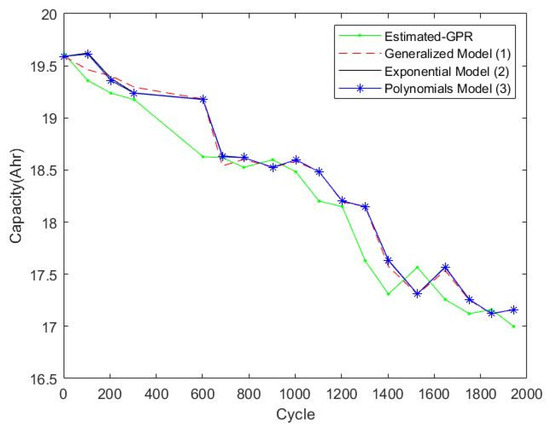
Figure 6.
Prediction by EKF based on three models.
The three performance decay models present almost the same results based on EKF. Therefore, the KF method can adjust and predict the trend of battery decay according to the state of the system at each moment, and the specific form of the model has a negligible influence on the prediction results.
4.3. Battery Life Prediction and Comparison
Many “use” operations of battery ESS in an EV accumulate to form a full charge and discharge cycle, accounted for by the rain flow algorithm. A battery cycling test is shown in Figure 7 to simulate representative battery use, and many of these test cycles are repeated to observe the deterioration of the battery SOH. Data from several selected cycles are shown. The battery’s capacity slowly reaches the end for an EV (80%) after about 2000 cycles. The battery ESS “use” operations can be optimized in ESS design, EV power control and energy management to balance the gain in vehicle/vessel propulsion energy efficiency and the loss due to the life-shortening of the battery ESS. As the SOH of the battery decreases, the charging and discharging times of the battery gradually decrease.
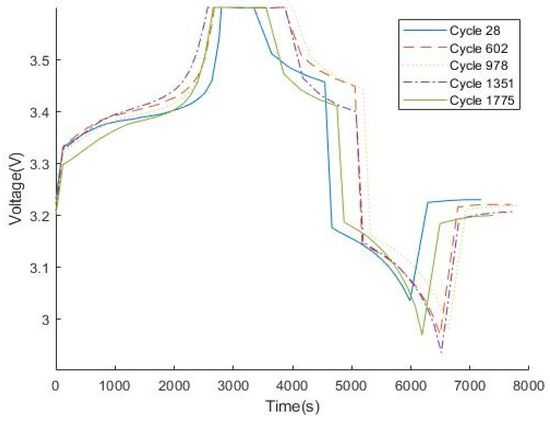
Figure 7.
Voltage curves in different cycling test cycles.
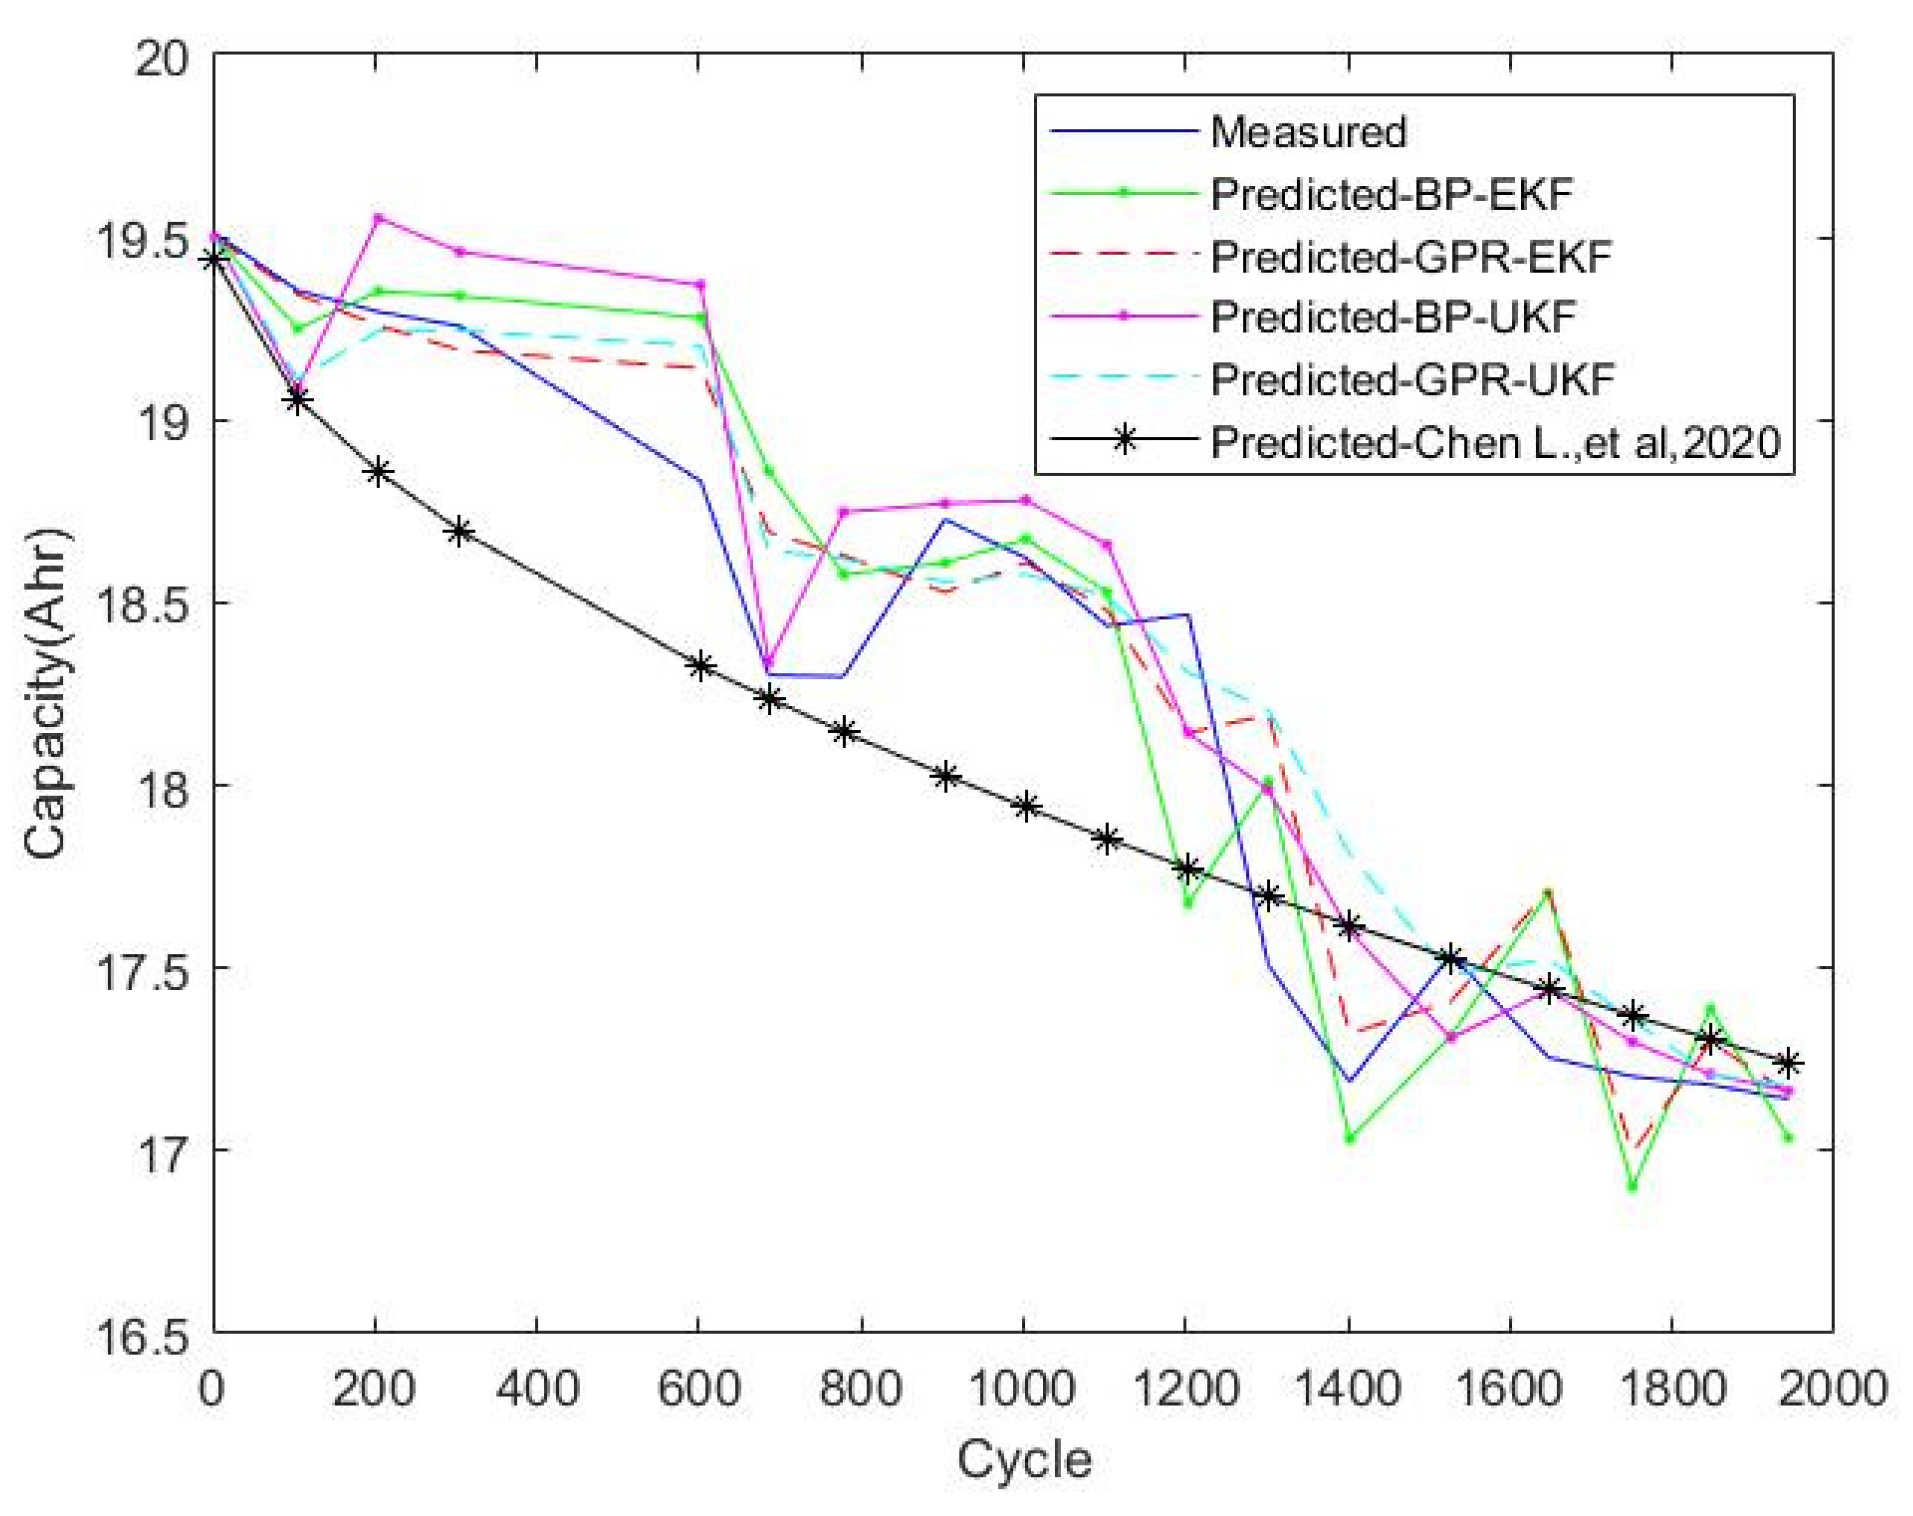
The data-driven methods and the KFs are used to predict the SOH of the battery based on the cycling test data and the generalized model.
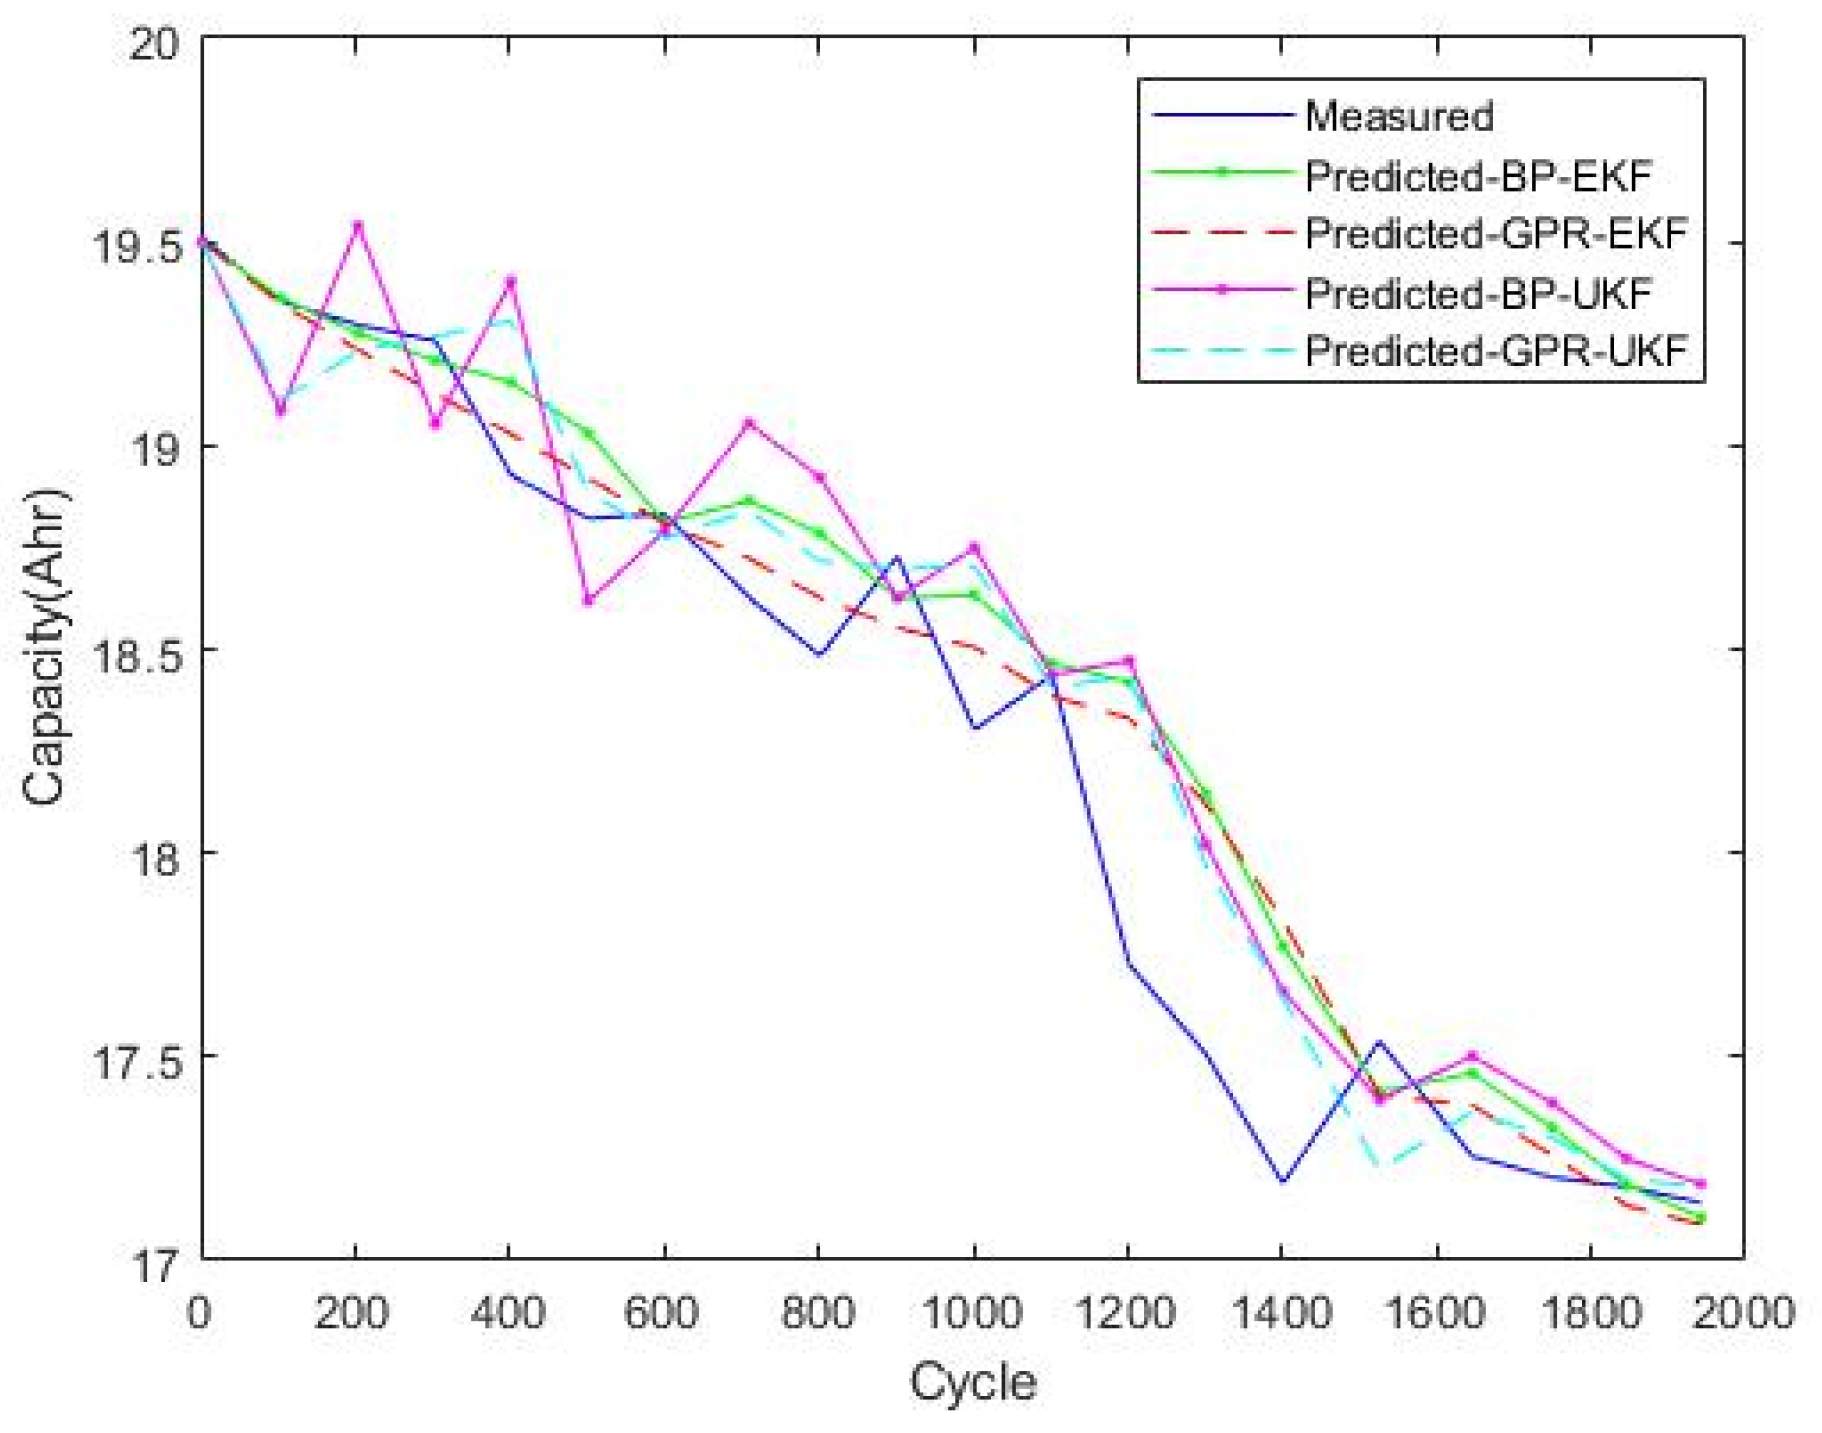
The modelling error is between 1.1% and 1.5%, slightly lower than capacity test data and superior to the generalized semi-empirical model [19] with a modelling error of 1.9%, as shown in Figure 8 and Table 3.
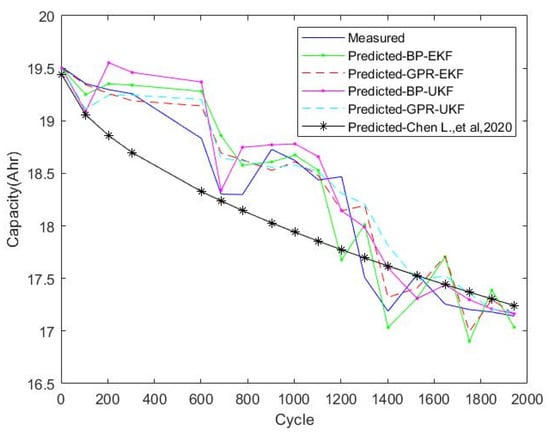
Figure 8.
Prediction for battery based on cycling test cycles [19].
Table 3.
Comparison of different algorithms based on cycling test cycles.
GPR and ANN are two different supervised learning algorithms. GPR performs inference based on a stochastic process for function regression, while ANN approximates a function by parametric methods. GPR needs to learn fewer parameters and therefore requires fewer data and does not require an expensive training phase. Still, the computational complexity increases squarely with the number of data points. The data set is relatively small in this work, and GPR is faster and more accurate than ANN.
Both EKF and UKF perform state estimation or parameter estimation for nonlinear systems. EKF linearizes nonlinear systems by omitting high-order terms through Taylor expansion, while UKF solves non-linear problems based on unscented transformation. This linearization process of discarding above the second order may cause higher errors for a highly nonlinear system. Compared with the EKF, the unscented transform can describe the nonlinear system better, but the calculation speed is slightly slower. However, in this manuscript, the model is not highly nonlinear, EKF can approximate the original system very accurately, so the accuracy and calculation speed of EKF is better than UKF.
The battery test data contain about 2000 charge–discharge cycles, each represented by many performance data points. Using all performance degradation cycling data to determine the model parameters of the semi-empirical model requires a considerable amount of computation to form the simple model. Furthermore, using all these data to train one large ANN without any explicit model requires even more computation through its BP training. Therefore, we use a combination of the data-driven method and the prediction technique to obtain an accurate result with a more manageable amount of calculation. The GPR and EKF approach uses a small amount of cycle data in each forecasting step, reducing the computation burden. The process better reflects the progressing variation of the data with reduced capability to duplicate the global trend. Li-ion batteries usually show nonlinear capacity decline with an initial drop, then decline at a far more moderate pace and a significant drop towards the end of their life. Therefore, the more locally focused GPR and EKF approach presents an advantage.
5. Conclusions
Based on data from more than 2000 battery charge–discharge test cycles, this work compares the prediction results of different battery performance degradation models, including generalized, exponential, and polynomial forms. Since the results from the models of these three forms using the same prediction algorithm are similar, it can be concluded that the choice of the model form has little effect on the predicted results. Then, a combination of two data-driven methods and two KF algorithms were used to estimate the battery performance degradation and predict the SOH of the battery during their operation, respectively. Due to the small amount of experimental data and the low degree of model nonlinearity, the combination of GPR and EKF has higher prediction accuracy and manageable computational complexity, showing a good advantage over the present semi-experimental model and pure ANN model.
Author Contributions
Conceptualization, B.P. and Z.D.; Data curation, L.C.; Formal analysis, B.P.; Funding acquisition, Z.D.; Methodology, B.P. and Z.D.; Resources, L.C.; Supervision, Z.D.; Validation, B.P.; Visualization, L.C.; Writing—original draft, B.P. and Z.D. All authors have read and agreed to the published version of the manuscript.
Funding
This research received no external funding.
Acknowledgments
Financial support from the Dennis & Phyllis Washington Foundation and Natural Sciences and Engineering Research Council of Canada (NSERC), and technical assistance and LFP battery test data from Yuqi Tong of the Beijing State Electric Vehicle Power Battery Testing Center are gratefully acknowledged.
Conflicts of Interest
The authors declare no conflict of interest.
Abbreviations
| ANN | Artificial Neural Network |
| BEV | Battery Electric Vehicle |
| BP | Back Propagation |
| DOD | Depth of Discharge |
| EKF | Extended Kalman Filter |
| ESS | Energy Storage System |
| EV | Electrified Vehicles |
| GHG | Greenhouse Gas |
| GPR | Gaussian Process Regression |
| HEV | Hybrid Electric Vehicle |
| ICE | Internal Combustion Engine |
| KF | Kalman Filter |
| LCC | Lifecycle Cost |
| LFP | Lifepo4 |
| Li-ion | Lithium-Ion |
| PTW | Pump-to-Wheel |
| RUL | Remaining Useful Life |
| SEI | Solid-Electrolyte Layer |
| SOC | State of Charge |
| SOH | State of Health |
| UKF | Unscented Kalman Filter |
| UT | Unscented Transform |
References
- Shaheen, S.A.; Lipman, T.E. Reducing greenhouse emissions and fuel consumption: Sustainable approaches for surface transportation. IATSS Res. 2007, 31, 6–20. [Google Scholar] [CrossRef] [Green Version]
- Wieczorek, M.; Lewandowski, M.; Jefimowski, W. Cost comparison of different configurations of a hybrid energy storage system with battery-only and supercapacitor-only storage in an electric city bus. Bull. Pol. Acad. Sci. Tech. Sci. 2019, 67, 1095–1106. [Google Scholar]
- Newman, J.; Thomas, K.E.; Hafezi, H.; Wheeler, D.R. Modeling of lithium-ion batteries. J. Power Sources 2003, 119, 838–843. [Google Scholar] [CrossRef]
- Zhou, W. Effects of external mechanical loading on stress generation during lithiation in Li-ion battery electrodes. Electrochim. Acta 2015, 185, 28–33. [Google Scholar] [CrossRef] [Green Version]
- Zhou, W.; Hao, F.; Fang, D. The effects of elastic stiffening on the evolution of the stress field within a spherical electrode particle of lithium-ion batteries. Int. J. Appl. Mech. 2013, 5, 1350040. [Google Scholar] [CrossRef]
- Zhang, J.; Lee, J. A review on prognostics and health monitoring of Li-ion battery. J. Power Sources 2011, 196, 6007–6014. [Google Scholar] [CrossRef]
- Waag, W.; Fleischer, C.; Sauer, D.U. Critical review of the methods for monitoring of lithium-ion batteries in electric and hybrid vehicles. J. Power Sources 2014, 258, 321–339. [Google Scholar] [CrossRef]
- Chen, Z.P.; Wang, Q.T. The application of UKF algorithm for 18650-type lithium battery SOH estimation. Appl. Mech. Mater. 2014, 519, 1079–1084. [Google Scholar] [CrossRef]
- Gholizadeh, M.; Yazdizadeh, A. Systematic mixed adaptive observer and EKF approach to estimate SOC and SOH of lithium-ion battery. IET Electr. Syst. Transp. 2020, 10, 135–143. [Google Scholar] [CrossRef]
- Ungurean, L.; Micea, M.V.; Carstoiu, G. Online SOH prediction method for lithium-ion batteries, based on gated recurrent unit neural networks. Int. J. Energy Res. 2020, 44, 6767–6777. [Google Scholar] [CrossRef]
- Feng, X.; Weng, C.; He, X.; Han, X.; Lu, L.; Ren, D.; Ouyang, M. Online state-of-health estimation for Li-ion battery using partial charging segment based on support vector machine. IEEE Trans. Veh. Technol. 2019, 68, 8583–8592. [Google Scholar] [CrossRef]
- Wei, J.; Dong, G.; Chen, Z. Remaining useful life prediction and SOH diagnosis for lithium-ion batteries using particle filter and support vector regression. IEEE Trans. Ind. Electron. 2017, 65, 5634–5643. [Google Scholar] [CrossRef]
- Chang, Y.; Fang, H. A hybrid prognostic method for system degradation based on particle filter and relevance vector machine. Reliab. Eng. Syst. Saf. 2019, 186, 51–63. [Google Scholar] [CrossRef]
- Hong, S.; Yue, T.; Liu, H. Vehicle energy system active defense: A health assessment of lithium-ion batteries. Int. J. Intell. Syst. 2020. [Google Scholar] [CrossRef]
- Wang, J.; Liu, P.; Hicks-Garner, J.; Sherman, E.; Soukiazian, S.; Verbrugge, M.; Tataria, H.; Musser, J.; Finamore, P. Cycle-life model for graphite-LiFePO4 cells. J. Power Sources 2011, 196, 3942–3948. [Google Scholar] [CrossRef]
- He, W.; Williard, N.; Osterman, M.; Pecht, M. Prognostics of lithium-ion batteries based on Dempster–Shafer Theory and the Bayesian Monte Carlo Method. J. Power Sources 2011, 196, 10314–10321. [Google Scholar] [CrossRef]
- Micea, M.V.; Ungurean, L.; Carstoiu, G.N.; Groza, V. Online state-of-health assessment for battery management systems. IEEE Trans. Instrum. Meas. 2011, 60, 1997–2006. [Google Scholar] [CrossRef]
- Zhao, Z.; Xin, H.; Ren, Y.; Guo, X. Application and comparison of BP neural network algorithm in MATLAB. In Proceedings of the 2010 International Conference on Measuring Technology and Mechatronics Automation, Changsha, China, 13–14 March 2010; IEEE: Piscataway, NJ, USA, 2010; Volume 1, pp. 590–593. [Google Scholar]
- Chen, L.; Tong, Y.; Dong, Z. Li-ion battery performance degradation modeling for the optimal design and energy management of electrified propulsion systems. Energies 2020, 13, 1629. [Google Scholar] [CrossRef] [Green Version]

Publisher’s Note: MDPI stays neutral with regard to jurisdictional claims in published maps and institutional affiliations. |
© 2022 by the authors. Licensee MDPI, Basel, Switzerland. This article is an open access article distributed under the terms and conditions of the Creative Commons Attribution (CC BY) license (https://creativecommons.org/licenses/by/4.0/).