Article

Hierarchical Clustering-Based Framework for Interconnected Power System Contingency Analysis

by
Bassam A. Hemad
1,*,
Nader M. A. Ibrahim
1,
Shereen A. Fayad
1 and
Hossam E. A. Talaat
2
1
Electrical Power System and Machines Dept., Suez University, Egypt
2
Electrical Engineering Dept., Future University in Egypt (FUE), Egypt
*
Author to whom correspondence should be addressed.
Energies 2022, 15(15), 5631; https://doi.org/10.3390/en15155631
Submission received: 28 June 2022 / Revised: 22 July 2022 / Accepted: 29 July 2022 / Published: 3 August 2022
(This article belongs to the Special Issue Condition Monitoring of Power System Components)

Abstract

:
This paper investigates a conceptual, theoretical framework for power system contingency analysis based on agglomerative hierarchical clustering. The security and integrity of modern power system networks have received considerable critical attention, and contingency analysis plays a vital role in assessing the adverse effects of losing a single element or more on the integrity of the power system network. However, the number of possible scenarios that should be investigated would be enormous, even for a small network. On the other hand, artificial intelligence (AI) techniques are well known for their remarkable ability to deal with massive data. Rapid developments in AI have led to a renewed interest in its applications in many power system studies over the last decades. Hence, this paper addresses the application of the hierarchical clustering algorithm supported by principal component analysis (PCA) for power system contingency screening and ranking. The study investigates the hierarchy clustering under different clustering numbers and similarity measures. The performance of the developed framework has been evaluated using the IEEE 24-bus test system. The simulation results show the effectiveness of the proposed framework for contingency analysis.

1. Introduction

Interconnected power system networks are heavily loaded for economic purposes, which could, in turn, violate some security boundaries [1]. These challenging operations scenarios require continuous monitoring and investigating of any disturbance that, if not handled, could lead to the loss of loads or even the loss of synchronism [2]. Therefore, there is always an urgent need to address the security problems caused by unplanned outages of critical elements. Critical elements refer to elements whose outage would threaten the secure operation of the entire electrical network.
Observing the operation of the power system network within predefined constraints is assigned to power system security. Power system security investigates all scenarios whose occurrence could threaten the security and reliability of the power system, determines to what extent the system can handle disturbances without the loss of synchronism, and finds a new equilibrium point [3]. Typically, power system security can be divided into three sub-functions: (1) power system monitoring, (2) contingency analysis, and (3) security-constraints optimal power flow (OPF) [4].
Nowadays, phasor measurement units (PMUs) play a vital role in the development of modern power system monitoring. The vast expansion of PMU installation worldwide has dramatically increased the available data. In addition, to monitor power system status perfectly in real time, these data can be used to support different power system studies. They offer an exciting opportunity to advance operator awareness of power system dynamics simultaneously through the whole electrical network, whether from a control station or substations [5,6].
Typically, the synchrophasor measurements have been used intensively in offline and online activities, resulting in understanding power system issues and maintaining the power system reliability [7]. In addition, synchronized measurements have played an essential role in numerous promising new concepts such as system integrity protection schemes (SIPS), remedial action schemes (RASs), and wide-area monitoring (WAM) [8]. Modern power systems have many applications for WAM devices, such as real-time control and monitoring, transmission line protection and congestion management, power system restoration, and operation control [9]. Consequently, this work assumes data availability from different installed PMUs through the power network. The PMUs’ historical data will also be used in the clustering algorithm’s training stage.
Another significant aspect of power system security is contingency analysis. Contingency analysis uses data from the network to estimate the severity of unplanned outages to power system security and reliability. Estimating each possible event is not a simple task, even for a small network. The task becomes more challenging when the number of simultaneously investigated apparatus outages goes beyond N k . N is the number of generation units and transmission lines, and k is the number of simultaneously lost apparatus, k   2 [10,11]. The brute approach of contingency analysis involves investigating each contingency, but not all contingencies have the same probability of occurrence or severity. Therefore, screening and ranking algorithms of contingencies become mandatory for a more efficient network security analysis. The efficient analysis requires picking up all critical contingencies for further detailed analysis. Unlike other contingencies, critical contingency poses a real threat to the security and integrity of the electrical network and should be treated with extreme caution. The consequences of untreated threats can materialize in different forms, such as voltage dips, frequency fluctuation, or even stability problems, which could finally result in a cascading blackout [12]. A cascading blackout refers to unplanned outages starting when a critical event occurs. When this event, called the initial event, occurs, it starts a series of unstoppable successive outages of different power system components, resulting in a total blackout. A blackout’s severity and consequences typically depend on the criticality of the tripped elements, operating conditions, and network topology [13]. Typically, identifying the worst scenarios involves recognizing the initiating events, cascading chains, and the shortest path for the blackout.
Once the havoc of the event has been estimated, the security-constrained OPF will be applied. Security-constrained OPF, as the name suggests, seeks a new operating point where security constraints are no longer violated [14].
Different methods were presented in [15,16,17,18,19,20] to identify the worst scenarios; those methods used rigid boundaries to distinguish catastrophic cases. These boundaries are defined based on a good understanding of the power system network characteristics and are only specified under specific conditions. On the other hand, the artificial intelligence algorithms were perfectly exploited in [21,22,23,24,25,26], specifically unsupervised algorithms. On the other hand, fuzzy logic was exploited in [1] for security assessment. In [27], the energy management issue of interconnected microgrids was addressed. Moreover, to achieve accurate power models for both photovoltaic panels and loads, the paper introduced a novel hybrid modeling method combining recurrent neural networks and the Ornstein–Uhlenbeck process simultaneously. The energy management for microgrids was also introduced in [28]. The author used two different artificial intelligence techniques to split the microgrids into clusters based on the maximum load demand and operating reserve of dispatchable energy sources. On the other hand, the bottom-up energy internet architecture design combined with a data-driven dynamical control strategy was presented in [29]. The simulation results show that the proposed method reduced the overall generation cost by 7.1% compared to the proportional integral algorithm and by 37% compared to the optimal power flow method. A proposed control scheme for frequency management was presented in [11]. The illustrated controller showed the ability to support frequency regulation under contingencies. However, most previous studies of power system security have failed to consider the potential impact of multiple contingencies, where k > 2 . In addition, most previous works only consider the outage of transmission lines, and a few consider generation units outage [30]. This lack of investigation could be attributed to the computation burden associated with such studies. In addition, most of the published work was based on a performance index initially proposed in [31] and modified versions [32,33,34,35]. This index has suffered terribly from the masking effect problem [34].
The importance of power system steady-state security assessment and synchrophasor measurements was discussed previously. This work intensely investigated a power system contingency analysis framework based on the agglomerative hierarchical clustering algorithm. The presented framework comprises different artificial intelligence algorithms combined to allow the machine to take all necessary actions required to maintain the security of the modern power system. Therefore, the developed method presented in this paper uses PCA to eliminate the dimensionality curse associated with any data-driven problem by extracting the dominant features. The number of clusters the data should have was evaluated using two different methods (silhouette coefficient analysis and dendrogram). The output of the silhouette coefficient analysis step combined with PCA results was used to feed the hierarchical clustering algorithm. In contrast to all other unsupervised techniques, the hierarchical model was found to be convenient for power system security studies, and this could be attributed to the nature of power system contingencies themselves. The overall structure of this paper takes the form of six sections, including this introductory section. Section two reviews the composite insecurity index. The third section is concerned with principal component analysis, followed by hierarchical clustering in section four. The fifth section presents the simulation results and reports the findings of this study. The last section covers the conclusions.

2. Insecurity Indices

The number of possible contingencies in the electrical power network is overwhelming and depends on various factors. These factors include the level of contingency ( N k , where k = 1 ,   2 ,   3 ,   4 ), the size of the network, and the network topology. The number of cases expected for the N elements network that lost k elements can be expressed as follows:
C ( N K ) = N ! K ! ( N K )
where N is the network’s total number of generation units and transmission lines, and k is the number of simultaneously lost apparatus. In this study, k will be considered up to 4. Equation (1) shows how the number of expected contingencies will exponentially increase as k increases. The number of contingencies that cause havoc on the power system network is much less than that number. Furthermore, investigating all contingencies is not a practical solution since not all cases have destructive effects on the network and some can be absolutely ignored. The composite insecurity index proposed in [30,36,37] was used in this work. The insecurity is mainly intended for ranking purposes where the screening will be based on the adopted artificial intelligence algorithm. The developed composite index in [30,36,37] quantifies four electrical quantities in the power system network. These quantities are the MW flow of each transmission line, the bus voltage, and the total active and reactive power generated. The composite index can be formulated as follows:
C I S I = W l i = 1 I I S I L i n e s ( i ) × P ( i ) P ( i ) + W v j = 1 J I S I V o l t a g e ( j ) × V S c h ( j ) V S c h ( j ) + W A P l = 1 L I S I A , P o w e r ( l ) × P g ( l ) P g ( l ) + W R P l = 1 L I S I R , P o w e r ( l ) × Q g ( l ) Q g ( l )
where C I S I is the composite insecurity index and W L   ,   W V ,   W A P , and W R P are the weighting factor for the line insecurity index, voltage insecurity index, total active power insecurity index, and total reactive power insecurity index, respectively. ISILines(i) is the MW flow of the transmission line (i), P(i) is the MW of the line (i), ISIVoltage(j) is the voltage index of the bus (j), VSch(j) is the scheduled voltage at the bus (j), ISIA, Power(l) is the active power index of the generator (l), Pg(l) is the active power limit of the generator (l) in MW, ISIR, Power(l) is the reactive power index of the generator (l), and Qg(l) is the reactive power of the generator (l) in MVAR.
The C I S I will be used to quantify the severity of each contingency. The contingencies with the highest score should come first, followed by less severe contingencies. The value of C I S I ranges from 0 (no harm) to 4 (system collapse), which becomes more helpful in interpreting and comparing the status of the power system network after being subjected to disturbance. Furthermore, the normalized structure of the adopted index makes it more suitable for artificial intelligence algorithms.

3. Principal Component Analysis
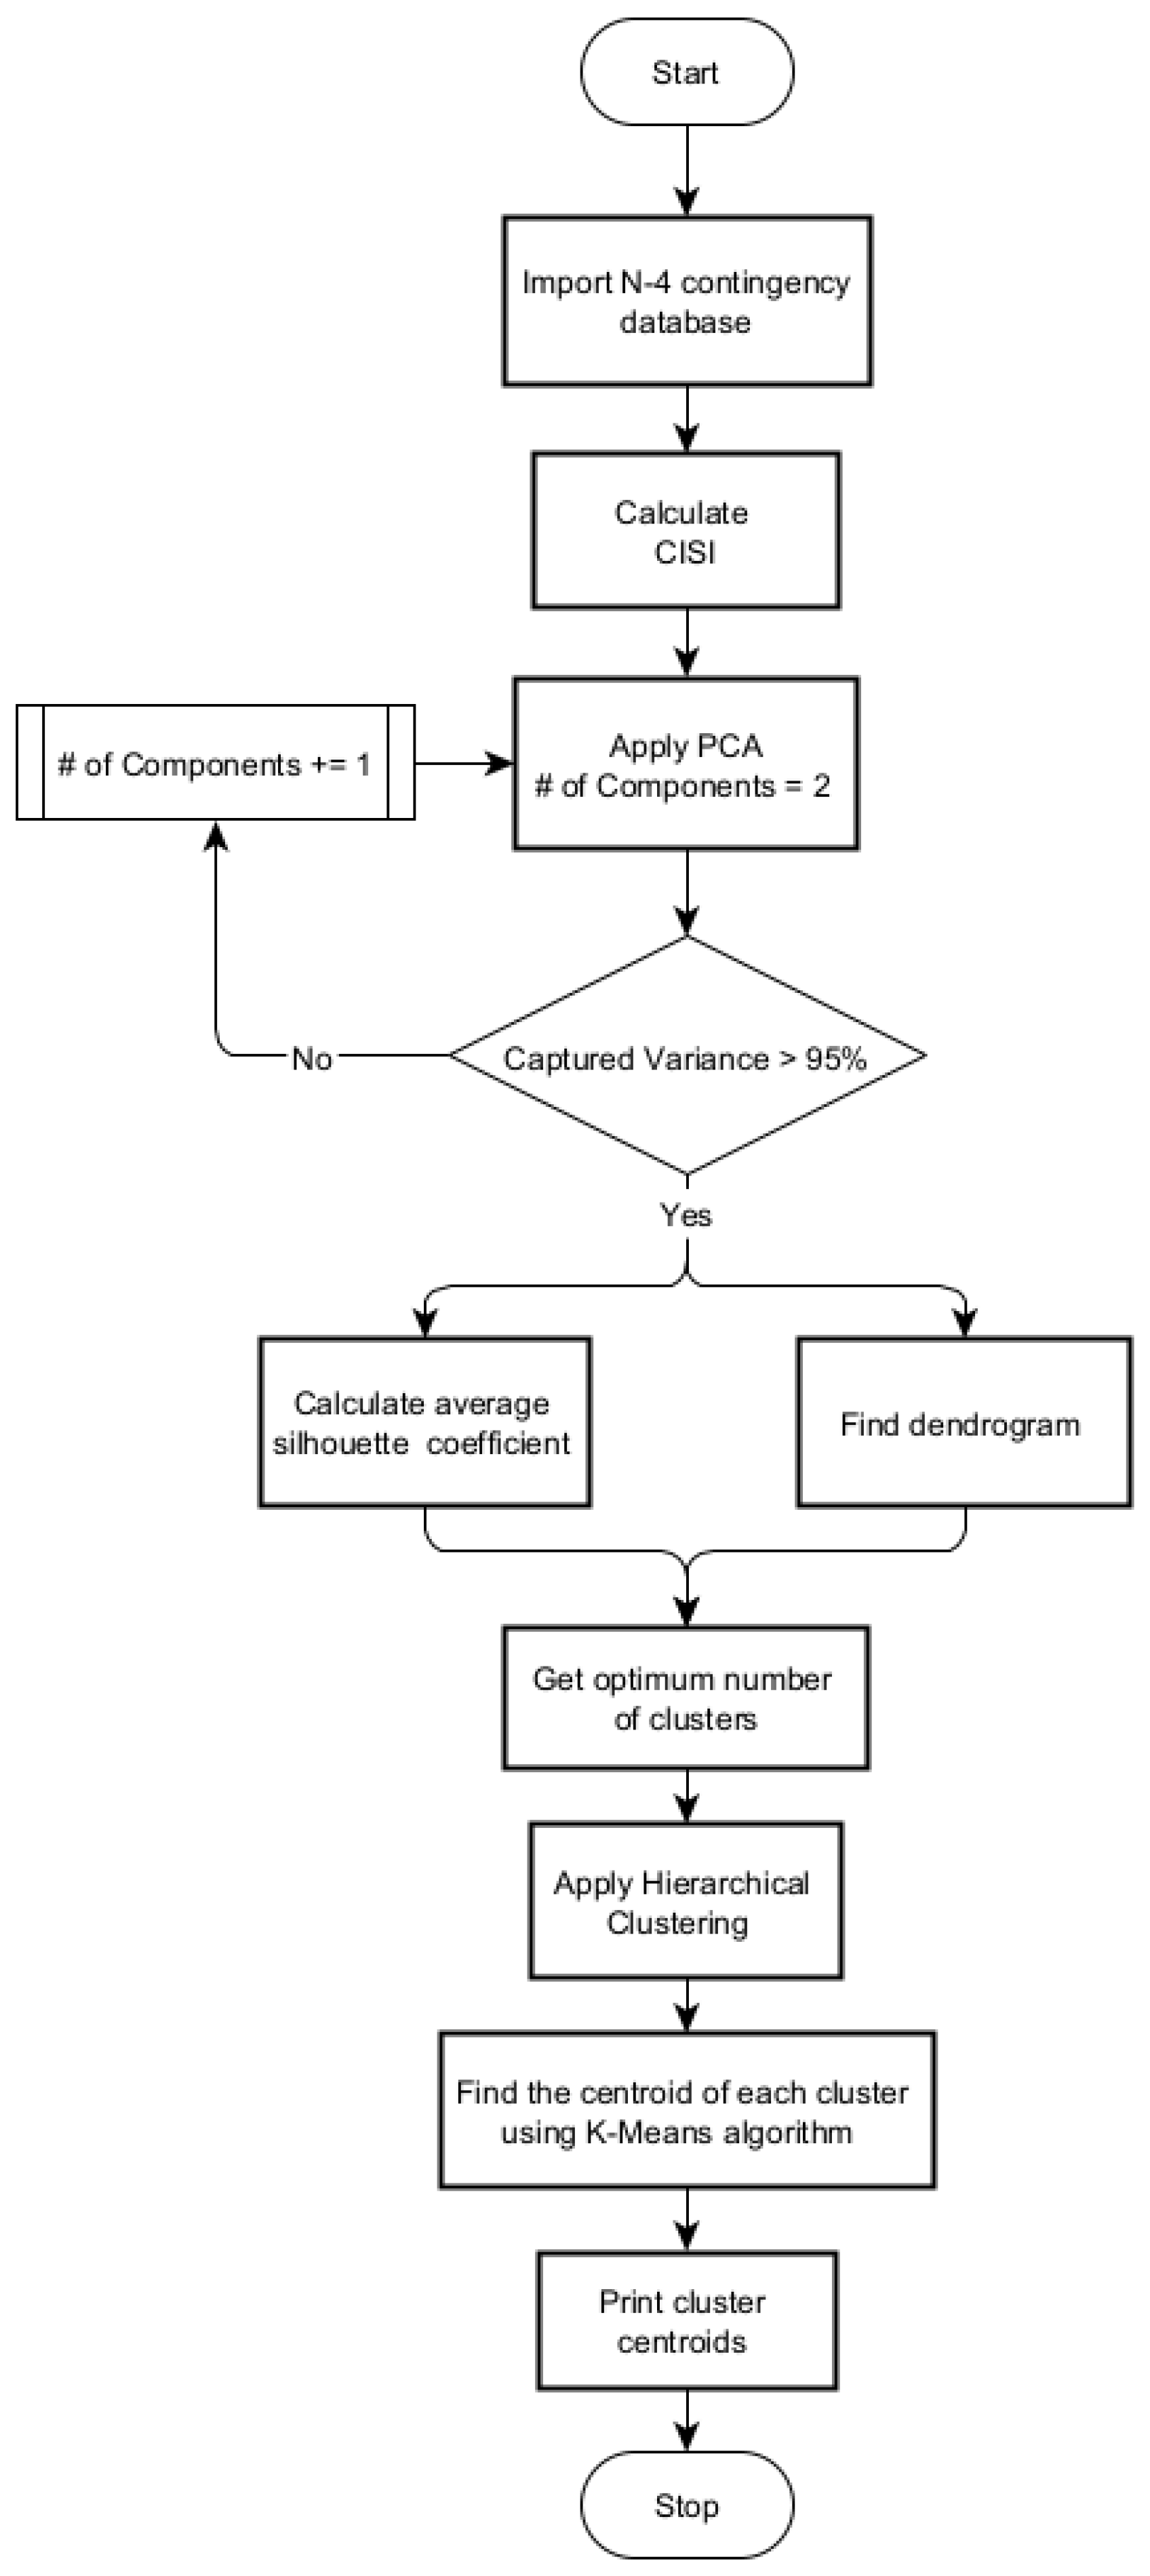
Principal component analysis (PCA) is one of the most advanced and effective dimensionality reduction techniques, and it has been widely used in computer vision and pattern recognition applications [38,39]. In [40], PCA was used for computer network analysis and in [41] it was applied for network security analysis. On the other hand, in [42,43], PCA was adopted for voltage security assessment in the electrical power network. What is similar in all these works is that PCA is applied to capture the variance in the dataset by searching for the direction where the data varies the most. Once the direction is identified, the PCA algorithm searches for the next direction that should be perpendicular to the first direction. According to the PCA terminology, the first direction the PCA found is the first component, whereas the second direction is the second component [41].
Typically, the number of components should be first specified to apply the PCA. Once the number of components is specified, the PCA starts searching for the first component by following specific steps as follows (Algorithm 1):
Algorithm 1: PCA
  • Find the center of the dataset.
  • Calculate the square covariance matrix (c) in N × N.
  • Calculate the eigenvector and eigenvalues of the covariance matrix.
  • Identity the first component by picking the largest eigenvector from the matrix c.
  • Identify the second component by picking the next largest eigenvector from the matrix c.
  • Create a new N × M matrix in the feature domain, where M is the specified number of components.
However, two important notes should be considered when dealing with PCA. Firstly, the second component of PCA should be orthogonal to the first component. PCA does not alter the number of samples; however, it can change the samples’ value to emphasize the variance among datasets.

4. Hierarchical Clustering

The main idea behind any clustering technique is to split datasets into homogeneous clusters. Each cluster should share some common characteristics between all points belonging to this cluster to be said to be homogeneous. What these characteristics are and how much they are spread within the cluster is based on the clustering algorithm and the similarity measure they used. Therefore, it is common for clustering algorithms to perform well with a specific dataset and badly with others [44]. However, the clustering algorithm could be classified into two main categories: hierarchical and non-hierarchical. In non-hierarchical clustering, the relationship between clusters is undetermined. This method aims to find a grouping of data which maximizes or minimizes some evaluating criterion; the k-means clustering algorithm is an example for this category. The hierarchical clustering algorithm may also be divided into two subcategories: agglomerative and division. The agglomerative hierarchical algorithm is aimed at creating clusters from the bottom up. At the outset, the agglomerative hierarchical clustering algorithm considers each point in the dataset as a single cluster of its own [45]. The second step involves merging clusters that share the most significant cluster similarity. The algorithm keeps repeating till all points split into the desired number of clusters [46]. On the other hand, the division hierarchical clustering algorithm begins from the top down. It starts with a single cluster containing all points and then splits into smaller clusters until termination criteria are achieved.
There are different similarity measures for the agglomerative hierarchical clustering. These measures are as follows [45]:
  • Single linkage: Uses the slight dissimilarity between observations of the two clusters.
  • Complete linkage: Uses the considerable dissimilarity between observations of the two clusters.
  • Ward method: Aims to minimize the variance between merged clusters.
  • Average method: Uses the average dissimilarity between observations of two merged clusters.
In this work, agglomerative hierarchical clustering was adopted. The four different similarity measures listed above were examined. In addition, the advantage of the dendrogram to evaluate the optimum number of clusters was also investigated. The dendrogram results are compared with the results obtained from silhouette analysis. Silhouette is an intelligent algorithm for determining the optimum number of clusters. Silhouette is mainly used with other well-known clustering methods such as K-means.

5. Results Discussions

In order to verify the correctness of the proposed method, the IEEE 24-bus power network was used. Having 11 generators, 38 transmission lines, and base loads of 2138, the IEEE 24-bus can be considered a reasonable choice. The simulation cases covered the outage of single generation units and multiple outages of transmission lines up to N 4 . The use of N 4 contingencies was intended to simulate the worst scenarios and cover most operating conditions. Furthermore, the list of contingences was extended more by changing the base load from 20 to 120%. The minimum and maximum constraints for voltage were 0.95 and 1.05, respectively. The thermal limit constraints for all transmission lines were 140% of the maximum allowable thermal limit. At the same time, the insecurity constraints for the active and reactive indices of the generation units were taken as 100% of the generation capacity.
The procedure followed in this paper for power system contingency screening and ranking is summarized in Figure 1. The analysis started with the generating of different contingencies using MATLAB m-files. The m-files written in this work utilize fast decoupled power flow (FDPF) algorithms to calculate the voltages at each bus and the loading of each line. Since evaluating the proposed method’s robustness requires diverse cases, the m-files were written to simulate different contingencies. The insecurity indices were used to quantify the severity of each contingency. The advantage of using the insecurity indices is that only four parameters had to be used to describe the state of the network instead of using all electrical quantities such as the voltage at each bus and the loading of each line.
Once the dataset was created, the PCA was applied. As a powerful dimensionality reduction technique, the PCA did a great job of reducing the number of features from four to three and highlighting the dominated features by capturing the vector where data varied the most, as shown in Figure 2. In Figure 2, the bar represents the explained variance per component. As can be clearly seen, the first component of PCA only captured 68.2% of the information included in the dataset. The second component of PCA captured 25.4%, and the three components combined captured 98.88% of the variance, explained as denoted by the solid line in Figure 2. The solid line in Figure 2 represents the cumulative explained variance of the three components. The PCA transformation results are reported in Figure 3. It is also worth noting that using insecurity indices eliminates the need for normalization. Therefore, the calculated indices were directly fed to the PCA algorithm.
Typically, the ground truth labels are not defined if the clustering problem is considered. Therefore, the need for an evaluation method becomes essential. In reference to Figure 1, two different approaches were used to examine the performance of the developed algorithm. One of those methods is the dendrogram, which is a powerful tool if adequately combined with hierarchical clustering. The second one used in this study is the silhouette coefficient. The silhouette coefficient score gives a higher score to the model with better-defined clusters. Both methods offer a good illustration of how many clusters the dataset should have.
The hierarchical clustering dendrogram of the IEEE-24 bus is shown in Figure 4 whereas the silhouette coefficient score for different clustering numbers is shown in Figure 5.
The dendrogram results, shown in Figure 4, clearly revealed the hidden structure of the IEEE-24 bus dataset. It can be seen from the data in Figure 4 that the dataset can be split perfectly into five clusters. This result is in accordance with the findings of the silhouette analysis reported in Figure 5, in which the five-cluster model has a higher score than other models.
Once the optimum number of clusters is identified, the different similarity measures for hierarchical clustering can be examined to determine suitability for the screening problem. Hence, four linkage measures were inspected and reported in Figure 6. The silhouette average score was also used to evaluate the performance of the different linkage criteria, and the results are reported in Table 1.
Table 1 compares the results obtained from the silhouette analysis for various similarity measures. As can be clearly seen from the table, the ward and average methods resulted in the highest score. The ward score was 0.75 at five clusters, and the average score was 0.73 at the same number of clusters. On the other hand, the single linkage was the worst among the tested measures, whereas the complete linkage performed better than the single linkage but was less than the ward and average methods. Therefore, the ward method was adopted for further investigation.
The results obtained so far have been concluded in Figure 7. Figure 7 shows the result of the agglomerative hierarchical clustering algorithm using the ward method with five clusters. Once the cluster boundary had been extracted using the hierarchical clustering, the K-means algorithm was used to identify the centroid of each cluster. These centroids are shown in Figure 7 by circles containing cluster numbers. Figure 7 shows the splitting of the dataset in the feature domain into five clusters based on the clustering results of the agglomerative clustering algorithm. However, what characterizes each sample, or contingency, in each cluster is not apparent since these data do not directly represent the insecurity indices anymore. Even though the PCA does a great job of reducing the number of features and capturing the dominant features, the interpretation of the result in the feature domain represents a challenge. Since the application of the PCA algorithm involves transforming the data from the samples domain, where units and values have a meaning, to the domain of the feature, it is infeasible to interpret clustering results, and many studies did not cover this point. However, to correctly interpret the hierarchical clustering algorithm results, all results will be converted from the feature domain to the insecurity indices domain.
Alternatively, the results of applying the K-means algorithm to identify the clusters centroids help us gain a better understanding of the characteristics of each cluster. This step is rarely covered in other works. Using the centroids of inverted clusters, the characteristics of each cluster can be discussed, as shown in Table 2. Table 2 shows the K-means centroids after reverting to the insecurity indices domain. Cluster No. 0, as shown in the table, contains contingencies that have an issue on average with the total active power generated. Some buses suffer from voltage issues associated with insufficient reactive power support.
Referring to Figure 7, as contingencies move from cluster No. 0 toward cluster No. 2, the problem with total active power becomes critical, and reactive power support is wholly lost. In addition, data in Table 2 show that untreated contingencies in cluster No. 0 moving toward cluster No. 2 will result in transmission line loading and a problem with bus voltages. If kept developing in the same direction, these contingencies will end up in cluster No. 3, where total collapse becomes inevitable. On the other hand, contingencies in cluster No. 1 suffer badly from bus voltages with a shortage of reactive power support. Unlike cluster No. 0, cluster No. 4 does not have critical issues with bus voltages. However, the bus voltages problem is noticeable. Contingencies in cluster No. 4 are similar to the contingencies in cluster No. 1, but they are less severe. Cluster No. 3 has all critical contingencies where power flow does not converge.

6. Conclusions

This paper addresses the performance of combining the principal component analysis (PCA) and agglomerative hierarchical clustering algorithm for power system contingency analysis. The optimum number of clusters was calculated using two different methodologies: a dendrogram and the silhouette average coefficient. The results of both methods show consistency in determining the number of clusters. The investigation also covered various similarity measures of the agglomerative hierarchical clustering algorithm. The developed framework was applied to the IEEE-24 bus test system, and the results are reported. The numerical results show that the adopted feature extraction algorithm significantly reduced the dimension of the input feature matrix and perfectly extracted the dominant features by transferring the datasets from the indices domain to the features domain. Furthermore, the numerical results indicate the excellence and efficiency of the agglomerative hierarchical clustering-based framework for interconnected power system contingency screening and ranking.
The most prominent finding to emerge from this study is that merging different intelligent algorithms to solve each challenge separately and then combining these solutions can result in a solid model. This model in our research split contingencies very well based on the severity and characteristics that those contingencies share with each other. However, further work is required to establish the viability of the developed framework by experimentally evaluating its performance under different scenarios. Therefore, our main direction for future work will be devoted to building a power system network prototype to investigate the ability to create a self-automated intelligent network based on the rapid development in the artificial intelligence field to fulfill future requirements.

Author Contributions

Data curation, N.M.A.I.; Visualization, S.A.F.; Writing—original draft, B.A.H.; Writing—review & editing, H.E.A.T. All authors have read and agreed to the published version of the manuscript.

Funding

This research received no external funding.

Institutional Review Board Statement

Not applicable.

Informed Consent Statement

Not applicable.

Data Availability Statement

Not applicable.

Conflicts of Interest

The authors declare no conflict of interest.

References

  1. Panda, S.B.; Mohanty, S. Assessment of Power System Security for Different Bus Systems through FVSI/RFVSI and Fuzzy Logic Approaches. IETE Tech. Rev. 2022, 1–16. [Google Scholar] [CrossRef]
  2. Hassan, R.U.; Yan, J.; Liu, Y. Security risk assessment of wind integrated power system using Parzen window density estimation. Electr. Eng. 2022, 104, 1–12. [Google Scholar] [CrossRef]
  3. Wood, A.J.; Wollenberg, B.F.; Sheblé, G.B. Power Generation, Operation, and Control; John Wiley & Sons, Inc.: Hoboken, NJ, USA, 2013. [Google Scholar]
  4. Wood, A.J.; Wollenberg, B.F. Power System Generation, Operation and Control; John Wiley: New York, NY, USA, 1984. [Google Scholar]
  5. Martin, K.; Benmouyal, G.; Adamiak, M.; Begovic, M.; Burnett, R.; Carr, K.; Cobb, A.; Kusters, J.; Horowitz, S.; Jensen, G.; et al. IEEE standard for synchrophasors for power systems. IEEE Trans. Power Deliv. 1998, 13, 73–77. [Google Scholar] [CrossRef]
  6. Phadke, A. Phasor Measurement Units (PMU s). In Wiley Encyclopedia of Electrical and Electronics Engineering; John Wiley & Sons, Inc.: Hoboken, NJ, USA, 2001; pp. 1–3. [Google Scholar]
  7. Martin, K.E. Synchrophasor Standards Development-IEEE C37. 118 & IEC 61850. In Proceedings of the 2011 44th Hawaii International Conference on System Sciences, Kauai, HI, USA, 4–7 January 2011; pp. 1–8. [Google Scholar]
  8. Ali, I.; Aftab, M.A.; Hussain, S.M.S. Performance comparison of IEC 61850-90-5 and IEEE C37. 118.2 based wide area PMU communication networks. J. Mod. Power Syst. Clean Energy 2016, 4, 487–495. [Google Scholar] [CrossRef] [Green Version]
  9. Puhan, S.S.; Sharma, R.; Lenka, S.R. Optimal PMU Placement Using Fuzzy Logic and WAMS Based PMU Measurement for Faulted Zone Identification. In Proceedings of the 2021 1st Odisha International Conference on Electrical Power Engineering, Communication and Computing Technology (ODICON), Bhubaneswar, India, 8–9 January 2021; pp. 1–6. [Google Scholar]
  10. Amarendra, A.; Srinivas, L.R.; Rao, R.S. Contingency Analysis in Power System- Using UPFC and DVR Devices with RDOA. Technol. Econ. Smart Grids Sustain. Energy 2022, 7, 17. [Google Scholar] [CrossRef]
  11. Sabhahit, J.N.; Solanke, S.S.; Jadoun, V.K.; Malik, H.; Márquez, F.P.G.; Pinar-Pérez, J.M. Contingency Analysis of a Grid Connected EV’s for Primary Frequency Control of an Industrial Microgrid Using Efficient Control Scheme. Energies 2022, 15, 3102. [Google Scholar] [CrossRef]
  12. Veda, S.S. WAMS-Based Intelligent Load Shedding Scheme for Preventing Cascading Blackouts. Ph.D. Thesis, Virginia Polytechnic Institute and State University, Blacksburg, VA, USA, 2012; p. 3585949. [Google Scholar]
  13. Gazafroudi, A.S.; Neumann, F.; Brown, T. Topology-based approximations for N−1 contingency constraints in power transmission networks. Int. J. Electr. Power Energy Syst. 2022, 137, 107702. [Google Scholar] [CrossRef]
  14. Anwer, A.; Almosawi, A.H. A Dynamic Optimal Power Flow of a Power System Based on Genetic Algorithm. Eng. Technol. J. 2022, 40, 290–300. [Google Scholar] [CrossRef]
  15. Niebur, D.; Germond, A. Power system static security assessment using the Kohonen neural network classifier. IEEE Trans. Power Syst. 1992, 7, 865–872. [Google Scholar] [CrossRef]
  16. Kim, H.; Singh, C. Steady State and Dynamic Security Assessment in Composite Power Systems. In Proceedings of the 2003 International Symposium on Circuits and Systems, ISCAS’03, Bangkok, Thailand, 25–28 May 2003; Volume 3. [Google Scholar] [CrossRef]
  17. Pandit, M.; Srivastava, L.; Sharma, J. Fast voltage contingency selection using fuzzy parallel self-organizing hierarchical neural network. IEEE Trans. Power Syst. 2003, 18, 657–664. [Google Scholar] [CrossRef]
  18. Pandit, M.; Srivastava, L.; Sharma, J. Cascade fuzzy neural network based voltage contingency screening and ranking. Electr. Power Syst. Res. 2003, 67, 143–152. [Google Scholar] [CrossRef]
  19. Agreira, C.I.F.; Ferreira, C.M.M.; Pinto, J.A.D.; Barbosa, F.P.M. The Performance Indices to Contingencies Screening. In Proceedings of the 2006 International Conference on Probabilistic Methods Applied to Power Systems, Stockholm, Sweden, 11–15 June 2006; pp. 1–8. [Google Scholar]
  20. Li, L.; Zhu, Z.-H. On-line Static Security Assessment of Power System Based on a New Half-Against-Half Multi-Class Support Vector Machine. In Proceedings of the 2011 3rd International Workshop on Intelligent Systems and Applications, Wuhan, China, 28–29 May 2011; pp. 1–5. [Google Scholar]
  21. Hassan, S.; Rastgoufard, P. Detection of power system operation violations via fuzzy set theory. Electr. Power Syst. Res. 1996, 38, 83–90. [Google Scholar] [CrossRef]
  22. Matos, M.; Hatziargriou, N.; Lopes, J.A.P. Multicontingency steady state security evaluation using fuzzy clustering techniques. IEEE Trans. Power Syst. 2000, 15, 177–183. [Google Scholar] [CrossRef]
  23. Kalyani, S.; Swarup, K.S. Supervised fuzzy C-means clustering technique for security assessment and classification in power systems. Int. J. Eng. Sci. Technol. 2010, 2, 175–185. [Google Scholar] [CrossRef]
  24. Kalyani, S.; Swarup, K. Particle swarm optimization based K-means clustering approach for security assessment in power systems. Expert Syst. Appl. 2011, 38, 10839–10846. [Google Scholar] [CrossRef]
  25. Javan, D.S.; Mashhadi, H.R.; Rouhani, M. A fast static security assessment method based on radial basis function neural networks using enhanced clustering. Int. J. Electr. Power Energy Syst. 2013, 44, 988–996. [Google Scholar] [CrossRef]
  26. Talaat, H. Predictive out-of-step relaying using fuzzy rule-based classification. Electr. Power Syst. Res. 1999, 48, 143–149. [Google Scholar] [CrossRef]
  27. Hua, H.; Qin, Y.; Hao, C.; Cao, J. Stochastic optimal control for energy Internet: A bottom-up energy management approach. IEEE Trans. Ind. Inform. 2018, 15, 1788–1797. [Google Scholar] [CrossRef]
  28. Salehi, N.; Martínez-García, H.; Velasco-Quesada, G. Networked Microgrid Energy Management Based on Supervised and Unsupervised Learning Clustering. Energies 2022, 15, 4915. [Google Scholar] [CrossRef]
  29. Hua, H.; Qin, Z.; Dong, N.; Qin, Y.; Ye, M.; Wang, Z.; Chen, X.; Cao, J. Data-driven dynamical control for bottom-up energy Internet system. IEEE Trans. Sustain. Energy 2021, 13, 315–327. [Google Scholar] [CrossRef]
  30. Ibrahim, H.A.; Hemade, B.A.; Talaat, H.E.A. Generated Power-Based Composite Security Index for Evaluation of Cascading Outages. In Proceedings of the 2017 Nineteenth International Middle East Power Systems Conference (MEPCON), Cairo, Egypt, 19–21 December 2017; pp. 735–740. [Google Scholar]
  31. Ejebe, G.C.; Wollenberg, B.F. Automatic contingency selection. IEEE Trans. Power Appar. Syst. 1979, PAS-98, 97–109. [Google Scholar] [CrossRef]
  32. Halilčević, S.S.; Gubina, F.; Gubina, A.F. The uniform fuzzy index of power system security. Eur. Trans. Electr. Power 2010, 20, 785–799. [Google Scholar] [CrossRef]
  33. Baghaee, H.; Abedi, M. Calculation of weighting factors of static security indices used in contingency ranking of power systems based on fuzzy logic and analytical hierarchy process. Int. J. Electr. Power Energy Syst. 2011, 33, 855–860. [Google Scholar] [CrossRef]
  34. Krishnakumar, B.; Soundarajan, S.K.; Gnanadass, R. Fuzzy Based Contingency Assessment Using Performance Indices with Masking Effect. In Proceedings of the 2012 IEEE Students’ Conference on Electrical, Electronics and Computer Science, Bhopal, India, 1–2 March 2012; pp. 1–5. [Google Scholar]
  35. Dhandhia, A.; Pandya, V. Contingency ranking in static security assessment using teaching learning based optimization enhanced support vector regression. Mater. Today Proc. 2022, 62, 7174–7178. [Google Scholar] [CrossRef]
  36. Talaat, H.E.A.; Ibrahim, H.A.; Hemade, B.A. Synchrophasor Measurements-Based on-Line Power System Steady-State Security Indices—Part I: Methodology. In Proceedings of the 2016 Eighteenth International Middle East Power Systems Conference (MEPCON), Cairo, Egypt, 27–29 December 2016; pp. 699–704. [Google Scholar]
  37. Hemade, B.A.; Ibrahim, H.A.; Talaat, H.E.A. Steady-state Security Assessment Based on K-Means Clustering Algorithm and Phasor Measurement Units. Recent Adv. Electr. Electron. Eng. 2020, 13, 559–570. [Google Scholar] [CrossRef]
  38. Zhang, J.; Yan, Y.; Lades, M. Face Recognition: Eigenface, Elastic Matching, and Neural Nets. Proc. IEEE 1997, 85, 1423–1435. [Google Scholar] [CrossRef]
  39. Thompson, M. Digital Image Processing by Rafael C. Gonzalez and Paul Wintz. Leonardo 1981, 14, 256–257. [Google Scholar] [CrossRef]
  40. Lakhina, A.; Crovella, M.; Diot, C. Diagnosing network-wide traffic anomalies. ACM SIGCOMM Comput. Commun. Rev. 2004, 34, 219–230. [Google Scholar] [CrossRef] [Green Version]
  41. Paffenroth, R.; Kay, K.; Servi, L. Robust pca for anomaly detection in cyber networks. arXiv 2018, arXiv:1801.01571. [Google Scholar]
  42. Mohammadi, H.; Dehghani, M. PMU based voltage security assessment of power systems exploiting principal component analysis and decision trees. International J. Electr. Power Energy Syst. 2015, 64, 655–663. [Google Scholar] [CrossRef]
  43. Javan, D.S.; Mashhadi, H.R.; Toussi, S.A.; Rouhani, M. On-line Voltage and Power Flow Contingencies Ranking Using Enhanced Radial Basis Function Neural Network and Kernel Principal Component Analysis. Electr. Power Compon. Syst. 2012, 40, 534–555. [Google Scholar] [CrossRef]
  44. Park, S.; Park, Y.B. Photovoltaic Power Data Analysis Using Hierarchical Clustering. In Proceedings of the 2018 International Conference on Information Networking (ICOIN), Chiang Mai, Thailand, 10–12 January 2018; pp. 727–731. [Google Scholar] [CrossRef]
  45. Jasinski, M.; Sikorski, T.; Leonowicz, Z.; Kaczorowska, D.; Suresh, V.; Szymanda, J.; Jasinska, E. Different Working Conditions Identification of a PV Power Plant Using Hierarchical Clustering. In Proceedings of the 2020 12th International Conference on Electronics, Computers and Artificial Intelligence (ECAI), Bucharest, Romania, 25–27 June 2020; pp. 1–8. [Google Scholar] [CrossRef]
  46. Yeung, K.Y.; Ruzzo, W.L. Details of the adjusted rand index and clustering algorithms, supplement to the paper an empirical study on principal component analysis for clustering gene expression data. Bioinformatics 2001, 17, 763–774. [Google Scholar] [CrossRef] [PubMed]
Figure 1. The procedure followed for power system contingency screening and ranking.
Energies 15 05631 g001
Figure 2. Total captured explained variance by each component.
Energies 15 05631 g002
Figure 3. PCA transformation results.
Energies 15 05631 g003
Figure 4. Hierarchical clustering dendrogram for IEEE-24 bus dataset.
Energies 15 05631 g004
Figure 5. Silhouette coefficient score of IEEE-24 bus dataset.
Energies 15 05631 g005
Figure 6. Hierarchical clustering results of the four linkage measures. (a) Ward method. (b) Complete method. (c) Average linkage. (d) Single linkage.
Energies 15 05631 g006
Figure 7. Hierarchical clustering results of the IEEE-24 bus contingencies in the feature domain using ward linkage.
Energies 15 05631 g007
Table 1. Silhouette average score for different linkage criteria.
Linkage CriteriaSilhouette Average
Ward0.75
Complete0.61
Average0.73
Single0.21
Table 2. Cluster centroids using K-means.
Cluster I S I L i n e s I S I V o l t a g e I S I A ,   P o w e r I S I R ,     P o w e r
00.0 0.07 0.24 0.03
10.05 0.83 0.02 0.1
20.030.09 0.51 1.0
30.99 1.011.01 0.99
40.03 0.41 0.05 0.02
Publisher’s Note: MDPI stays neutral with regard to jurisdictional claims in published maps and institutional affiliations.

