Article

Controlled Islanding under Complete and Partial False Data Injection Attack Uncertainties against Phasor Measurement Units

1
Department of Computer Science and Electrical Engineering, West Virginia University, Morgantown, WV 26506, USA
2
Department of Electrical Engineering and Computer Science, Syracuse University, Syracuse, NY 13210, USA
*
Author to whom correspondence should be addressed.
Energies 2022, 15(15), 5723; https://doi.org/10.3390/en15155723
Submission received: 30 June 2022 / Revised: 1 August 2022 / Accepted: 2 August 2022 / Published: 6 August 2022
(This article belongs to the Special Issue Wide Area Monitoring, Protection and Control of Modern Power Systems)

Abstract

:
The widespread application of phasor measurement units has improved grid operational reliability. However, this has increased the risk of cyber threats such as false data injection attack that mislead time-critical measurements, which may lead to incorrect operator actions. While a single incorrect operator action might not result in a cascading failure, a series of actions impacting critical lines and transformers, combined with pre-existing faults or scheduled maintenance, might lead to widespread outages. To prevent cascading failures, controlled islanding strategies are traditionally implemented. However, islanding is effective only when the received data are trustworthy. This paper investigates two multi-objective controlled islanding strategies to accommodate data uncertainties under scenarios of lack of or partial knowledge of false data injection attacks. When attack information is not available, the optimization problem maximizes island observability using a minimum number of phasor measurement units for a more accurate state estimation. When partial attack information is available, vulnerable phasor measurement units are isolated to a smaller island to minimize the impacts of attacks. Additional objectives ensure steady-state and transient-state stability of the islands. Simulations are performed on 200-bus, 500-bus, and 2000-bus systems.

1. Introduction

Controlled islanding, as a last resort solution, prevents cascading failures by isolating the faulty regions from the rest of the grid and creating smaller partitions that rapidly restore [1,2]. Islanding aims to: (1) minimize the total line power flow disconnection to enhance the system transient stability [3,4,5,6], and (2) minimize the imbalance of load generation in each island to enhance the steady-state stability [7,8,9].
Controlled islanding is particularly effective assuming that the received information about the system is trustworthy, an assumption that does not hold under unobservable cyber attacks. Undetected cyber attacks, such as data injection, falsify the measurements of the phasor measurement units (PMUs) in load injection buses [10,11,12,13]. Such attacks may result in incorrect estimation of bus voltages and angles, affecting island re-synchronization and system recovery. The problem is compounded in large power grids when monitoring the enormous volume of activity inside the network becomes extremely difficult, let alone the discovery of threats.
This paper considers how measurement uncertainties, under the lack of or partial information on compromised measurements, affect the outcome of controlled islanding. Specifically, false data attacks changing steady-state conditions are considered. The main scope of the study is to strengthen the existing islanding process by considering uncertainties in the PMU measurement in the islanding formulation and enabling a prompt response and recovery. To our knowledge, this is the first paper to accommodate PMU measurement uncertainties in traditional controlled islanding.
Figure 1 illustrates the overall process developed in the paper. With no prior knowledge of false measurements, designing a recovery approach is inherently complex. Suppose that the vulnerable PMUs that provide synchronized measurements are unknown. In that case, the attack impacts are minimized by creating islands that require minimal PMU measurements for maximum observability in state estimation. To the best of our knowledge, the problem of creating maximally observable islands with minimum PMUs has not been addressed before. In contrast, if the operators can further identify the potential attack location by analyzing PMU measurements [14], the mentioned mitigation approach isolates vulnerable PMUs to only a small part of the system while creating stable and observable islands. The dynamics of the system during islanding is incorporated by considering the coherency of generators [2].
The main contributions of this paper over the existing methods are summarized as follows.
  • Incorporating measurement uncertainties: Two new strategies are developed for controlled islanding without or with partial knowledge of false measurements. Controlled islanding is formulated as a multi-objective optimization problem that yields stable and observable islands while ensuring that wrong PMU measurements impact a minimal number of partitions.
  • Minimizing the loss of observability: A new method is developed to minimize the loss of observability during the partition process. This approach is efficient when reliable state estimation solutions are sought for the newly-formed islands with minimum PMUs in each island.
  • Comprehensive islanding solutions: Trade-offs between different objectives such as island size, observability, load-generation imbalance, and power flow disconnection are investigated using various optimization methods while taking into account the number of islands, generator coherency, and dynamic stability of the system.
The rest of this paper is organized as follows: Section 2 briefly outlines the background and motivation of the problem addressed in this paper. Section 3 and Section 4 develop controlled islanding strategies considering uncertainties without the knowledge or partial attack information, respectively. Section 5 presents additional objectives for steady-state and transient stability and outlines constraints related to the partition and structural connectivity of the islands. Section 6 formulates the islanding problem as a multi-objective optimization. The simulation results and the discussion are given in Section 7, followed by the concluding statements in Section 8.

2. Background and Motivation

PMUs significantly enhance situational awareness of the grids by providing accurate real-time measurements. These measurements improve network observability and result in precise state estimation solutions. However, PMUs are considered vulnerable to sophisticated cyberattacks [10,11,12,15]. Attacks can inject false data in voltage and current measurements to alter the estimated states [10,11] or modify time stamps to change phase angle measurements [12]. The worst case attacks could be unobservable [11] and result in incorrect power flow estimation, generator dispatch, and line overload [16,17]. False measurements may result in a series of incorrect operator actions impacting critical lines and transformers, resulting in load shedding and unintentional islanding [18,19]. In combination with prior system faults, wrong actions have been responsible for major cascading blackouts in the past [20].
Cascading blackouts can be prevented at the regional level by installing event-based and parameter-based remedial action schemes (RAS). However, improper coordination, erroneous RAS interactions [21], or targeted attacks against RAS [22] can cause additional outages. Controlled islanding is the last resort RAS that prevents widespread outages by partitioning the system into several independent and stable islands. However, any islanding decision to stabilize the power system is only effective when the received measurements are trustworthy.
Sophisticated false data injections may prevent system operators from identifying what part of the network is compromised. Although most research explores preventive schemes using model-based and data-driven techniques described in the comprehensive survey in [14], there is considerably less focus on recovery strategies. In [23], reclosing strategic lines that limits inrush currents and power swings is suggested as recovery when attacks result in multiple line trips. Another solution proposed in [24] is to resupply the lost loads with autonomous battery backup systems independent of a central controller. This paper focuses on developing controlled islanding strategies that are robust against false data injections on measurements under two distinct scenarios:
  • Scenario 1 under complete uncertainty: maximize the island observability with a minimum number of PMUs; and
  • Scenario 2 under partial uncertainty: isolate vulnerable PMUs to a small island.
In Scenario 1, it is assumed that attacks, such as coordinated data and RAS attacks [22], have already resulted in the evolution of subsequent physical failures. With no knowledge of the cause of failures, the operators doubt the fidelity of the received data. In Scenario 2, it is assumed that partial information on potentially vulnerable PMUs is available using methods such as those presented in [14].

3. Islanding under Complete Uncertainty

In this section, a controlled islanding strategy with two competing objectives will be developed to (1) maximize the observability of islands and (2) minimize the number of PMU measurements utilized. The most notable advantage is that more resources can be deployed to secure a small subset of PMUs for maximal observability, leading to more reliable state estimation and improving the island re-synchronization process. The minimum number of retained PMUs for observability also depends on the additional steady-state and transient stability objectives described in Section 5.3. Note that this paper only considers steady state observability for the purpose of state estimation of bus voltage and angles, and not dynamic observability of generator state variables such as rotor speeds and rotor angles.
To formulate the problem of islanding under complete uncertainty, the power network is represented as a graph G ( N , Z ) , where N is the set of buses and Z is the set of lines [3]. A small number of PMUs are placed on critical elements (defined as large generators and lines with large power flows). The limited PMUs on critical elements are assumed secure by prior cyber security design [25]. All other PMUs are assumed to be vulnerable to attacks. The set of lines with secure and non-secure PMU measurements are denoted by Z S and Z S , respectively.

3.1. Objective 1: Maximize Island Observability

A non-PMU bus is observable when it is incident to a line with a current phasor measurement from a neighboring PMU [26]. The loss of observability occurs when lines with measurements are disconnected during islanding [26]. This paper explores a new scenario that leads to a further loss of observability.
Consider the situation when the system is impacted by sophisticated false data attacks that may remain undetected for a long time [13]. While a single operator action might not result in a cascading outage, a series of incorrect actions impacting critical lines and transformers, combined with pre-existing faults or scheduled maintenance, may result in a widespread blackout. Prompt controlled islanding decisions are imperative for stability. In the absence of any information on the trustworthiness of the measurements, the approach introduced here aims to use only a fraction of non-secure PMUs rather than all for maximal island observability. This problem has two competing objectives. Hence, depending upon the number of non-secure PMU measurements retained, some buses may not remain observable.
Overall, the loss of observability is considered under two situations—(1) when lines with measurements are disconnected during islanding, and (2) when possibly compromised non-secure PMU measurements are discarded. Two binary variables are defined to take into account both the situations. The variable z i , j , ( i , j ) Z denotes a line status as,
z i , j = 0 if line ( i , j ) is disconnected 1 if line ( i , j ) is in service
and d i , j , ( i , j ) Z S denotes the measurement status as,
d i , j = 1 if line measurement ( i , j ) is retained 0 if line measurement ( i , j ) is discarded
Note that lines with secure measurements can be disconnected during islanding. However, their measurements are never intentionally discarded. Non-secure lines can be disconnected, and their measurements discarded, which is accounted for by the product of the two binary variables, d i , j z i , j .
Remark 1.
The product of the two binary variables d i , j z i , j is denoted by another binary variable v i , j and the following set of linear constraints,
v i , j d i , j
v i , j z i , j
v i , j d i , j + z i , j 1
The constraints (3) and (4) imply v i , j = 0 when d i , j = 0 or z i , j = 0 , and (5) implies v i , j = 1 only when both variables are one.
An observability decision matrix Z R m × m is defined as,
Z = Z S 0 0 Z \ S = . z j , k 0 . . 0 v i , j .
where sub-matrices Z S and Z S correspond to secure lines ( j , k ) Z S and non-secure lines ( i , j ) Z S , respectively.
Next, a matrix H is constructed that represents the topological observability at the bus/branch level using the line current measurements. The elements of H corresponding to states V i and V j are set to one when there exists a line current measurement between nodes i and j, and zero otherwise [27],
Energies 15 05723 i001
The sub-matrices H S , H S correspond to the secure and non-secure lines, respectively. The system is fully observable when the gain matrix G = H T H has a full rank [27]. To incorporate the measurement uncertainties during controlled islanding, a new gain matrix is constructed as,
G = ( ZH ) T ( ZH ) = H T Z T ZH = H T ZH
Here, Z is a binary diagonal matrix and, hence, Z T Z = Z . When diagonal elements of Z become zero during controlled islanding, it drives an entire column of G to zero. In this scenario, a node becomes unobservable if it is not observed directly or indirectly by another PMU.
The overall objective is to maximize the observability of the system for a more reliable state estimation of the islands. The objective function for observability is defined as,
F ˜ 1 = rank ( H T ZH )
The rank ( H T ZH ) = rank ( G ) is the number of the corresponding non-zero eigenvalues. As G is positive semi-definite, rank ( G ) is quasiconcave and NP-hard to maximize. Instead, rank ( G ) is replaced by trace ( G ) , which serves as a convex proxy [28]. Hence, (9) becomes convex as,
F 1 = trace ( H T ZH )
Remark 2.
The convex proxy or convex hull of a function is the largest convex under-estimator of the function. If ϕ ( G ) = rank ( G ) , then ϕ h u l l ( G ) = | | G | | * = i = 1 m σ i ( G ) , where | | G | | * is the nuclear norm and σ i is the i t h singular value. As G is symmetric and positive semi-definite, the singular values are equal to the eigenvalues. Thus, | | G | | * = trace ( G ) , which is a convex function.
Remark 3.
The expression trace ( H T ZH ) in (10) creates matrices that hold binary variables (instead of floating-point numbers), which becomes computationally expensive for large power systems. Instead, using the properties of the trace of matrix products, the term in (10) is conveniently written as,
trace ( H T ZH ) = trace ( ZHH T ) = Z i , i j = 1 n H i j 2

3.2. Objective 2: Minimize the Number of Retained PMUs

In the previous section, objective 1 was formulated for maximum observability for a reliable state estimation. The challenging problem now is to utilize only a minimum number of non-secure PMU measurements for the same. This approach minimizes the resources needed during the post-attack recovery by securing only a small subset of PMUs. With d i , j in (2) indicating whether a measurement is retained or not, the objective function for retaining a minimum number of additional non-secure PMUs is written as,
F 2 = ( i , j ) Z S β i d i , j
where β i is a weight which defines the measure of vulnerability for PMU i. One way to calculate β i is to measure how frequently PMU i appears in all possible attack scenarios. Such attack scenarios, based on the locations of load injection buses, can be simulated using the algorithm in [13].
While retaining (discarding) a noncritical PMU, all line current measurements associated with that PMU are retained (discarded). This is achieved by an additional constraint,
d i , j = d i , k k , ( i , j ) , ( i , k ) Z S
Combining objectives F 1 and F 2 allows maximizing island observability using a minimum number of non-secure PMUs under situations when attacks remain completely unknown.

4. Islanding under Partial Uncertainty

In this section, a new controlled islanding strategy under partial information on cyberattacks is developed to (1) isolate vulnerable PMUs and (2) maximize the observability of the islands. The size of the island also depends on the additional stability objectives described in Section 5.3.

4.1. Objective 1: Isolate PMUs under Attack

Consider false data injections that alter specific PMU measurements to bypass the state estimator. Partial information on potentially vulnerable PMUs can be identified by scanning ports, user logs, and registry entries [29]. False measurements are also discerned by analyzing PMU measurements using model-based and data-driven detection techniques [14,30]. With model-based approaches, false data may be partially detected by (1) estimation-based methods that compare estimated states with state measurements and (2) direct calculation-based methods that combine measurements and system parameters to detect anomalies. On the other hand, data-driven methods employ supervised and unsupervised machine learning algorithms to detect anomalies in data. It should be noted that the detection of false data is outside the scope of this paper.
Assume node i is vulnerable based on the partial information received from any of the described methods. The objective is to isolate all possible vulnerable PMUs into a single island. The idea is illustrated in Figure 2. Centered at node i, all nodes N i at a radius R are labeled as vulnerable. We employ a breadth-first search for this purpose, where the search starts at the root node i and explores all neighboring nodes at the same level before moving to the next depth [31]. The value of R may be determined on the basis of the architecture of the PMU communication network. The process is repeated for each suspected node.
Now, define a binary variable x i , i N for the placement of node i in an island as,
x i , h = 1 if node i is in island h 0 otherwise
The overall objective is to minimize the size of the island with vulnerable PMUs. The objective function is defined as,
F 3 = x 1 , h + x 2 , h + + x n , h = i = 1 n x i , h
In (15), h = 1 is explicitly set to indicate that all potentially compromised PMUs are contained in partition ‘1’. This smaller partition is denoted by sub-graph G G . When combined with the additional objectives described in Section V, the optimization problem in (15) isolates all possible vulnerable PMUs in a single island while creating stable partitions.

4.2. Objective 2: Maximize Island Observability

We introduce an additional objective to maximize the observability of the newly formed islands. Buses may lose observability when multiple lines are disconnected during islanding [26]. An observability decision matrix is defined as,
Z = diag ( z i , j ) ( i , j ) Z S
where z i , j is described in (1). The decision matrix Z takes into account the impact of physical line disconnection on system observability. The optimization problem is defined as maximizing the trace ( H T ZH ) , where H is the topological observability matrix described in (7). This problem is similar to (10) defined in Section 3.1.

5. Stability Objectives and Islanding Constraints

5.1. Stability Objectives

For Scenario 1 and Scenario 2, additional objectives are considered to maintain the load-generation balance and the transient stability of the system.
Consider P i as the net power injected at node i. Minimizing the load-generation imbalance in each island is defined as [32],
F ˜ 4 = h = 1 K i = 1 n P i x i , h
To tackle the absolute values, the equation in (17) is written as a linear program by introducing slack variables. Let the slack variable S h = i = 1 n P i x i , h denote the mismatch in island h. Hence, (17) can be written with additional constraints as,
F 4 = h = 1 k S h
i = 1 n P i x i , h S h
Balanced islands prevent frequency excursions, minimize load interruption, and reduce dependence on black-start units.
On the other hand, minimizing the line power flow disconnection prevents the creation of islands with a negative transient stability margin and avoids system collapse [3]. The objective function for the total line power flow disconnection is defined as [6],
F 5 = ( i , j ) Z 1 2 ( 1 z i , j ) P i , j

5.2. Identifying Coherent Generators

While securing the power grid from compromised PMU measurements is critical, an islanding solution should consider the dynamic stability of the system. The dynamics of the system are considered by grouping coherent generator clusters together [33]. The steps to identify the coherent generators, while not the focus of this paper, are briefly outlined below. Due to space limitations, the readers are referred to our previous work in [32] for more details.
First, different fault scenarios are simulated, and the generator rotor angle data are obtained. Typically, generators close to the fault location have fast non-coherent motion while those further away exhibit slow coherent motions [33]. Next, a hierarchical clustering method is employed on rotor angle time-series data to group the slow coherent motions. The similarity in characteristics of the time-series data is computed using the correlation metric—machines that exhibit coherency have higher rotor angle correlations. The closeness between generator clusters is evaluated based on the shortest distance between two points in each cluster. When groups of generators have a large inter-cluster distance, they are identified as separate set of coherent generators. In this paper, two and four coherent sets of generators are considered for controlled islanding.

5.3. Partitioning and Connectivity Constraints

The binary variables z i , j and x i , h are coupled through another binary variable w i , j , h as [6],
z i , j = h w i , j , h
w i , j , h x i , h
w i , j , h x j , h
z i , j = z j , i
The constraint restricting a node to a single island is given by,
h x i , h = 1
Additionally, ensuring at least M nodes are present in an island is enforced by the constraint,
i N x i , h M
For each island h, one bus j is designated as a source node to: (a) act as a reference bus for state estimation, and (b) ensure islands are connected. The source node is set as,
u j , h = 1 j N s
To ensure the islands are connected, an arbitrary network flow variable f i , j , h R is defined as,
0 f i , j , h n z i , j
The source variable and the connectivity flow variable together ensure that the optimization problem yields connected islands by exploiting basic network flow concepts. If a unit flow f i , j , h is sent from u j , h to each node in area h and if each node consumes one unit flow (with f i , j , h and f j , i , h being the node inflow and outflow, respectively), islands are connected when,
u j , h i N x i , h x j , h + i , j N , ( i , j ) Z f i , j , h = i , j N , ( j , i ) Z f j , i , h

6. Multi-Objective Optimization

The two islanding strategies under cyberattack uncertainties are formulated as multi-objective optimization problems, which find pertinent trade-offs between all the aforementioned objective functions. The multi-objective optimization problem for Scenario 1 is written as,
minimize F = [ F 1 , F 2 , F 4 , F 5 ] = [ trace ( H T ZH ) , observability ( i , j ) Z S β i d i , j , retained PMUs h = 1 k S h imbalance , ( i , j ) z 1 2 ( 1 z i , j ) P i , j power flow disconnection ] subject to ( 3 ) ( 5 ) , ( 13 ) , ( 18 b ) ( 18 c ) , ( 20 ) ( 28 )
Here, d i , j , v i , j , z i , j , x i , h , w i , j , h { 0 , 1 } and S h , f i , j , h R are the optimization decision variables. Similarly, the multi-objective optimization problem for Scenario 2 is written as,
minimize F = [ F 1 , F 3 , F 4 , F 5 ] = [ trace ( H T ZH ) , observability i x i , h = 1 , island size h = 1 k S h imbalance , ( i , j ) z 1 2 ( 1 z i , j ) P i , j power flow disconnection ] subject to ( 18 b ) ( 18 c ) , ( 20 ) ( 28 )
Here, z i , j , x i , h , w i , j , h { 0 , 1 } and S h , f i , j , h R are the optimization decision variables. Any optimal solution for (29) and (30) is a Pareto optimal (non-dominated) solution. Due to the competing nature of the objectives, no ideal solution exists that simultaneously minimizes every objective. The choice of an acceptable solution depends on the preference of the reliability coordinator overseeing the islanding.

6.1. Solution Approaches

The multi-objective optimization problems are solved using different methods [34], as shown in Table 1, categorized into two types—(1) hierarchical and (2) scalarization.
The hierarchical approach assigns objective priorities and solves each objective iteratively and is given as,
minimize F i i = 1 , , 4 subject to F j F j * + η j j = 1 , , i 1
The tolerance η j allows for defining optimal solution degradation. For example, let minimizing load-generation imbalance be of high priority and maximizing the rank be of low priority. Let the optimal solution for minimizing load-generation imbalance be 20 MW. When the solution degradation η 1 = 5 MW, the optimization problem will tolerate a non-optimal solution of 20 + 5 = 25 MW or better for the imbalance while maximizing rank .
The scalarization processes are classified into methods that specify (1) a posteriori or (2) a priori articulation of preferences, respectively [35]. Posteriori techniques, such as weighted sum and ϵ-constraint approaches, find a wide range of solutions with different trade-offs. A priori approaches [35], such as Chebyshev’s and Benson’s, incorporate a reference point representing a solution that the operator aspires.
The weighted sum approach captures the relative importance among all objectives F i through operator-specified weights γ i > 0 as,
minimize i = 1 4 γ i F i
The ϵ-constraint approach transforms trivial objectives into bounded constraints with operator-specified tolerances and optimizes only the most critical objective(s) as,
minimize i γ i F i + j ρ j F j i j subject to F j ϵ j j = 1 , , i 1 , i + 1 , 4
The tolerances reflect the extent the system operators can relax the objectives without incurring significant risks. Extremely tight tolerances may result in an empty feasible space.
The weighted Chebyshev’s approach minimizes the maximum weighted difference between the current solution and a reference point F i * as,
minimize b + j = 1 4 ρ j F j subject to γ i [ F i * F i ] b , i = 1 , , 4
The reference solution is considered the best solution each objective can achieve in the feasible region, and Chebyshev’s approach aims to find the closest solution to this ideal solution [34]. The term j ρ j F j , with a small positive scalar ρ j , ensures a strict non-dominated solution.
For Benson’s approach, the system operator selects a non-optimal reference point F i 0 as,
minimize i = 1 4 b i subject to F i 0 F i = b i , i = 1 , , 4
Benson’s approach then generates a Pareto-optimal solution that is farthest away from the dominant reference solution [34].
A combination of cutting planes and branch-and-bound method [36] is used to solve the mixed integer optimization problem in (29) and (30). In this process, all integer variables are first relaxed, and valid inequalities are generated to constrain the feasible solution set such that the extreme points are binary. The feasible region is then divided into subsets, and the optimization problem is solved for each subset. The optimality gap is set to zero to ensure both the linear relaxations of the integer problem and the dual of the relaxation have feasible integral solutions. For more details on generating valid inequalities, the readers are referred to [37].
By varying (a) the scalarization parameters, (b) the objective priority, and (c) the objective degradation tolerances, the system operators may obtain a wide range of solutions for the islanding problem.

6.2. Improving Computation Time

Controlled islanding is a general graph partition problem that is NP-hard, i.e., there exists no known algorithm to solve the problem in polynomial time [7]. Three steps are taken to improve the computation time. First, assuming the available blackstart capability, the objective function to minimize the total load-generation imbalance in each island in (18) is converted into an inequality constraint as h = 1 k S h ϵ load . Similarly, the objective function in (15) is converted to a constraint i = 1 n x i , h = 1 ϵ size to ensure that the maximum size of the island with vulnerable PMUs is limited to a pre-determined fraction of the entire system. Second, when information on power system components not affected by cyber-attacks (such as nodes with secure PMUs) is available, such components are pre-assigned as not vulnerable. Pre-assignment of buses has been shown to drastically reduce the computation time [6]. Third, the integrality constraints on some or all binary variables are relaxed until binary solutions are obtained.

7. Case Studies

Under complete and partial uncertainty, the developed controlled islanding strategies are tested on the synthetic Illinois 200-bus, South Carolina 500-bus, and Texas 2000-bus systems [38]. A branch-and-cut approach [36] is employed to solve the multi-objective mixed-integer program in Gurobi on an Intel(R) i5-4460, 3.20 GHz with 16 GB RAM.

7.1. Test Case and Parameter Setup

Most digital relays these days are equipped with PMUs (e.g., widely used Schweitzer Engineering Laboratories relays). Hence, it is reasonable to assume a certain availability of PMU measurements throughout the system in the near future [39,40,41]. With this assumption, the power system network is made observable through optimal PMU placement schemes [42]. We consider two schemes to demonstrate the applicability of the developed approach under a diversity of PMU placements: (1) each bus is observed at least once, and (2) each bus is observed at least twice to protect against the loss of a single PMU [43]. The detailed case descriptions, including the total number of secure and non-secure PMUs, are summarized in Table 2. The weights γ i associated with the four objectives, and tolerances ϵ load and ϵ size are given in Table 3. The reference solutions for Chebyshev’s and Benson’s approach are given in Table 4 and Table 5, respectively. All β i are set to 1 assuming no prior information on attack is available.

7.2. Performance of Controlled Islanding under Complete Uncertainty

For Scenario 1 under complete uncertainty, the observability of islands is maximized using a minimum number of non-secure PMUs, while maintaining island stability. The power system network is divided into two or four islands based on two coherent sets of generators [32]. With no prior information on false data, each non-critical PMU is assumed equally vulnerable, and the corresponding weights β i are set to one.

7.2.1. Partitioning into Two Islands

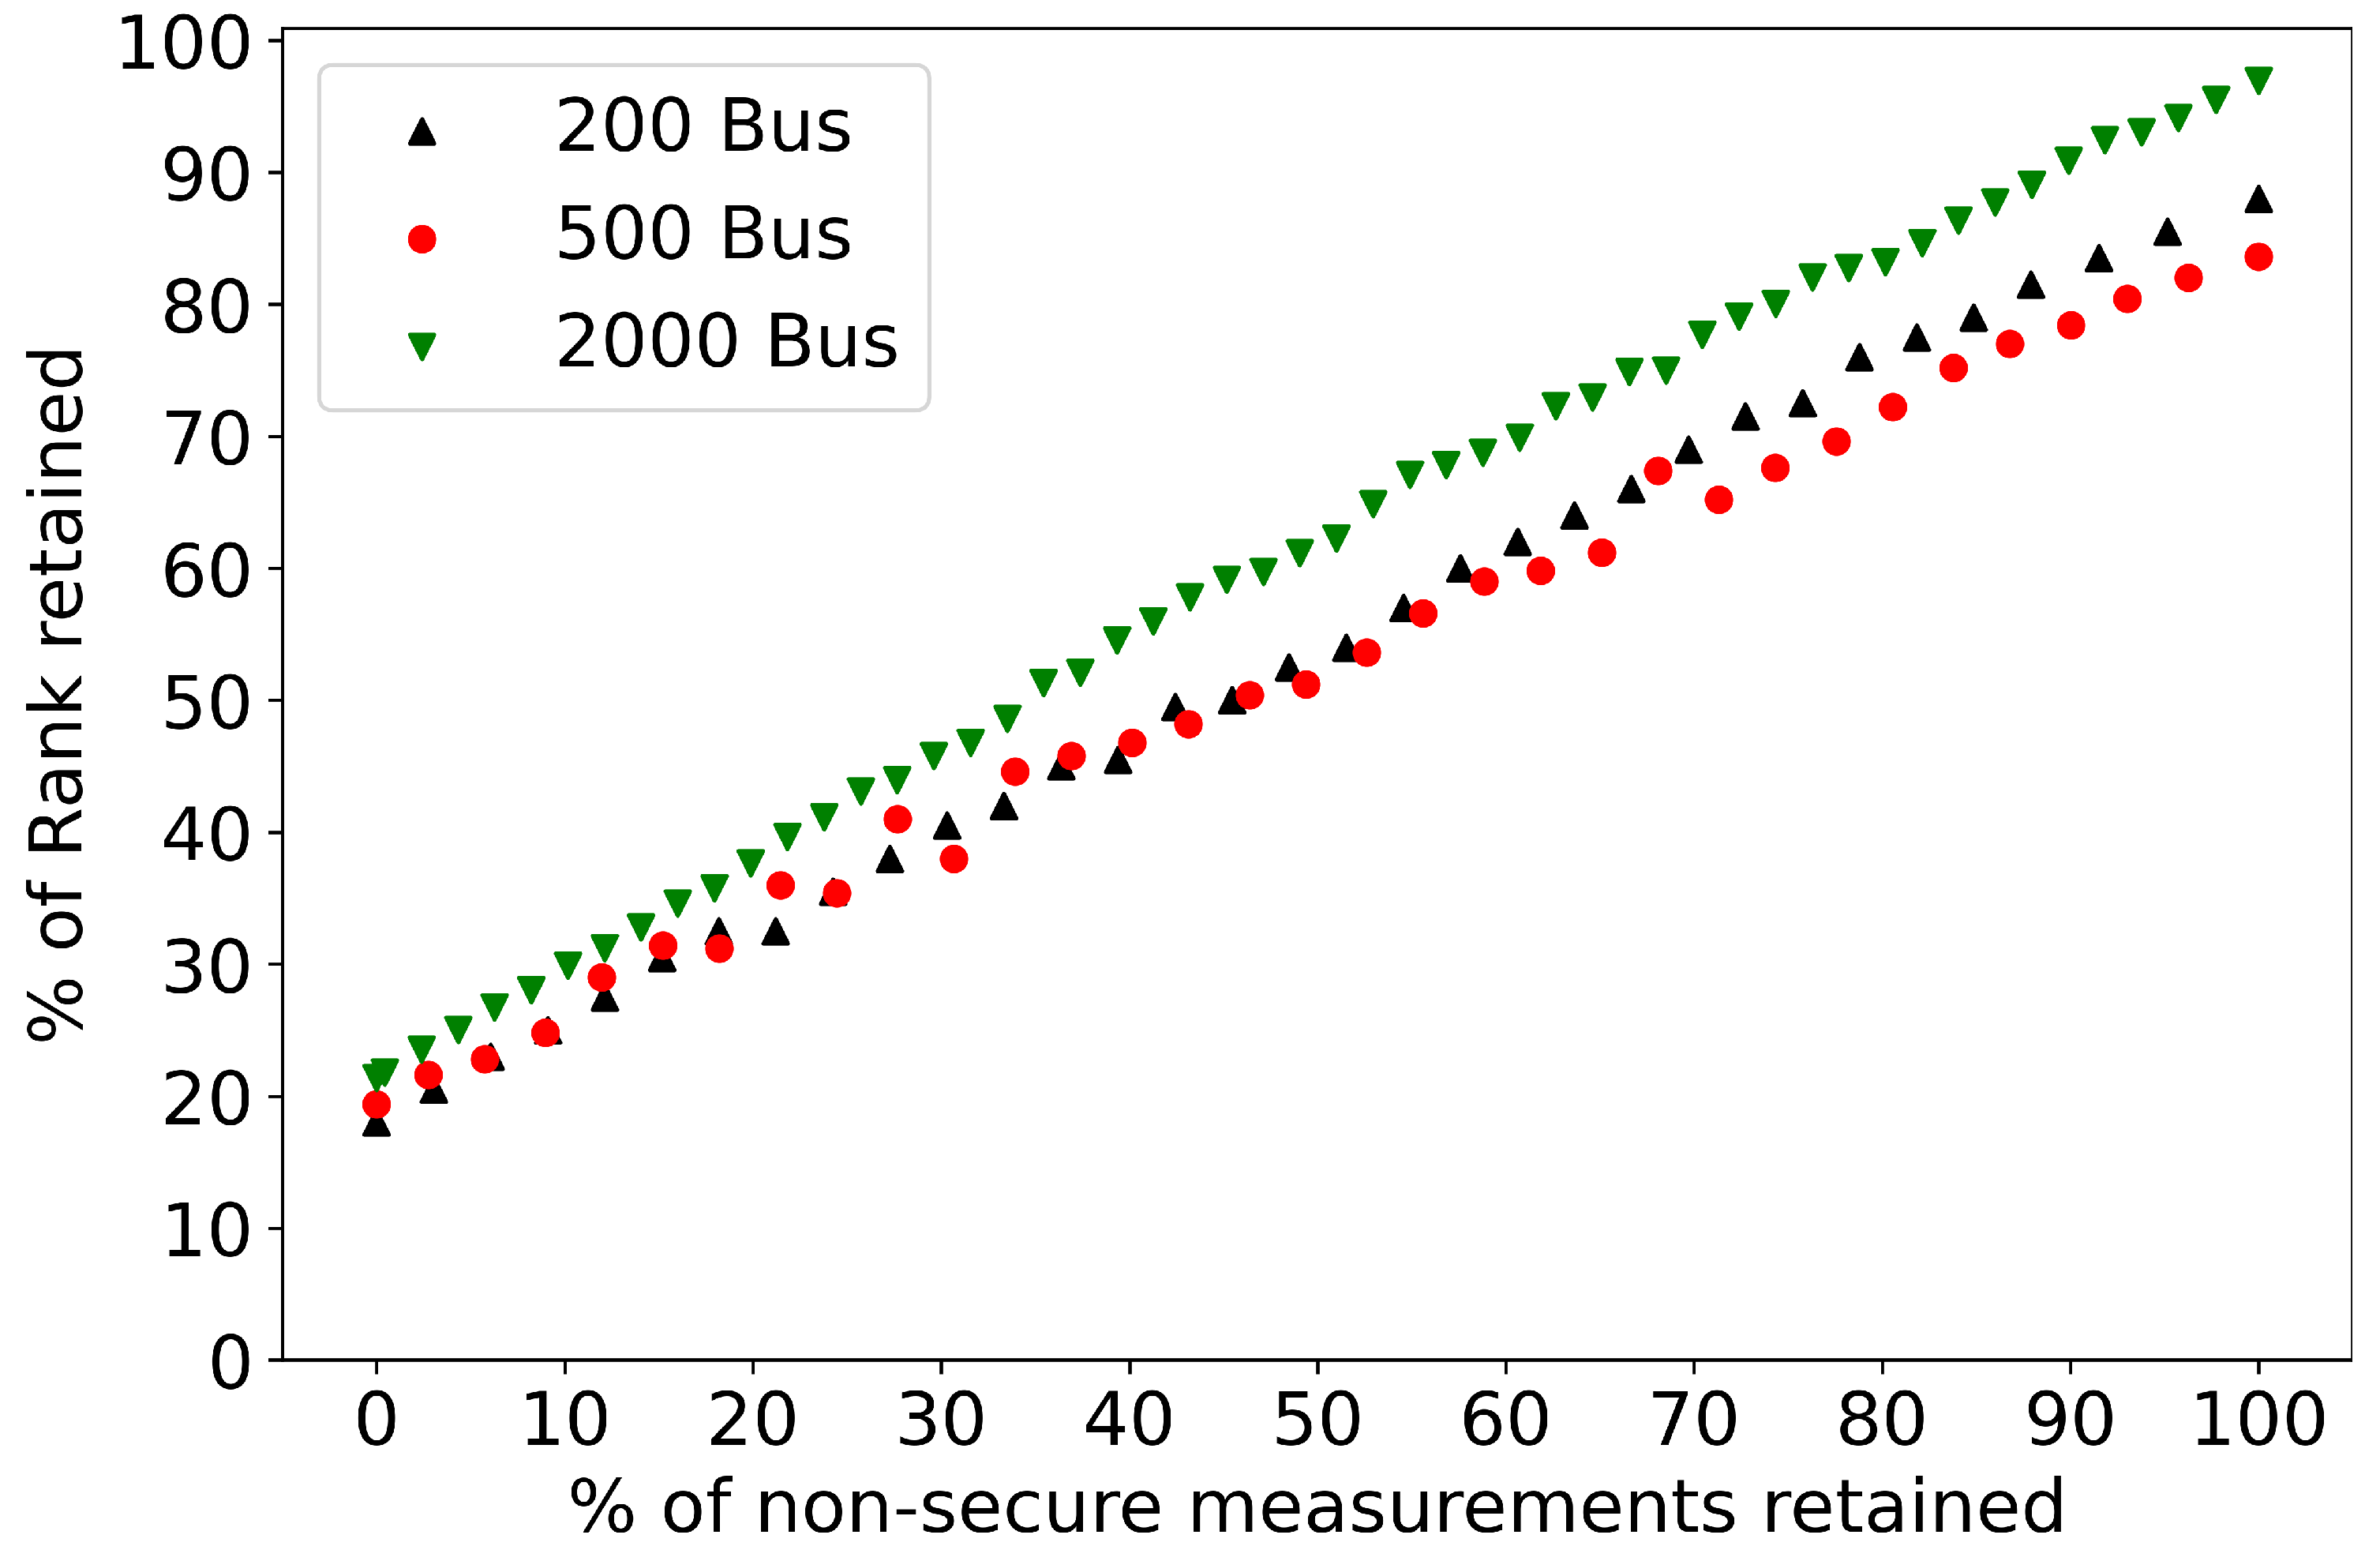
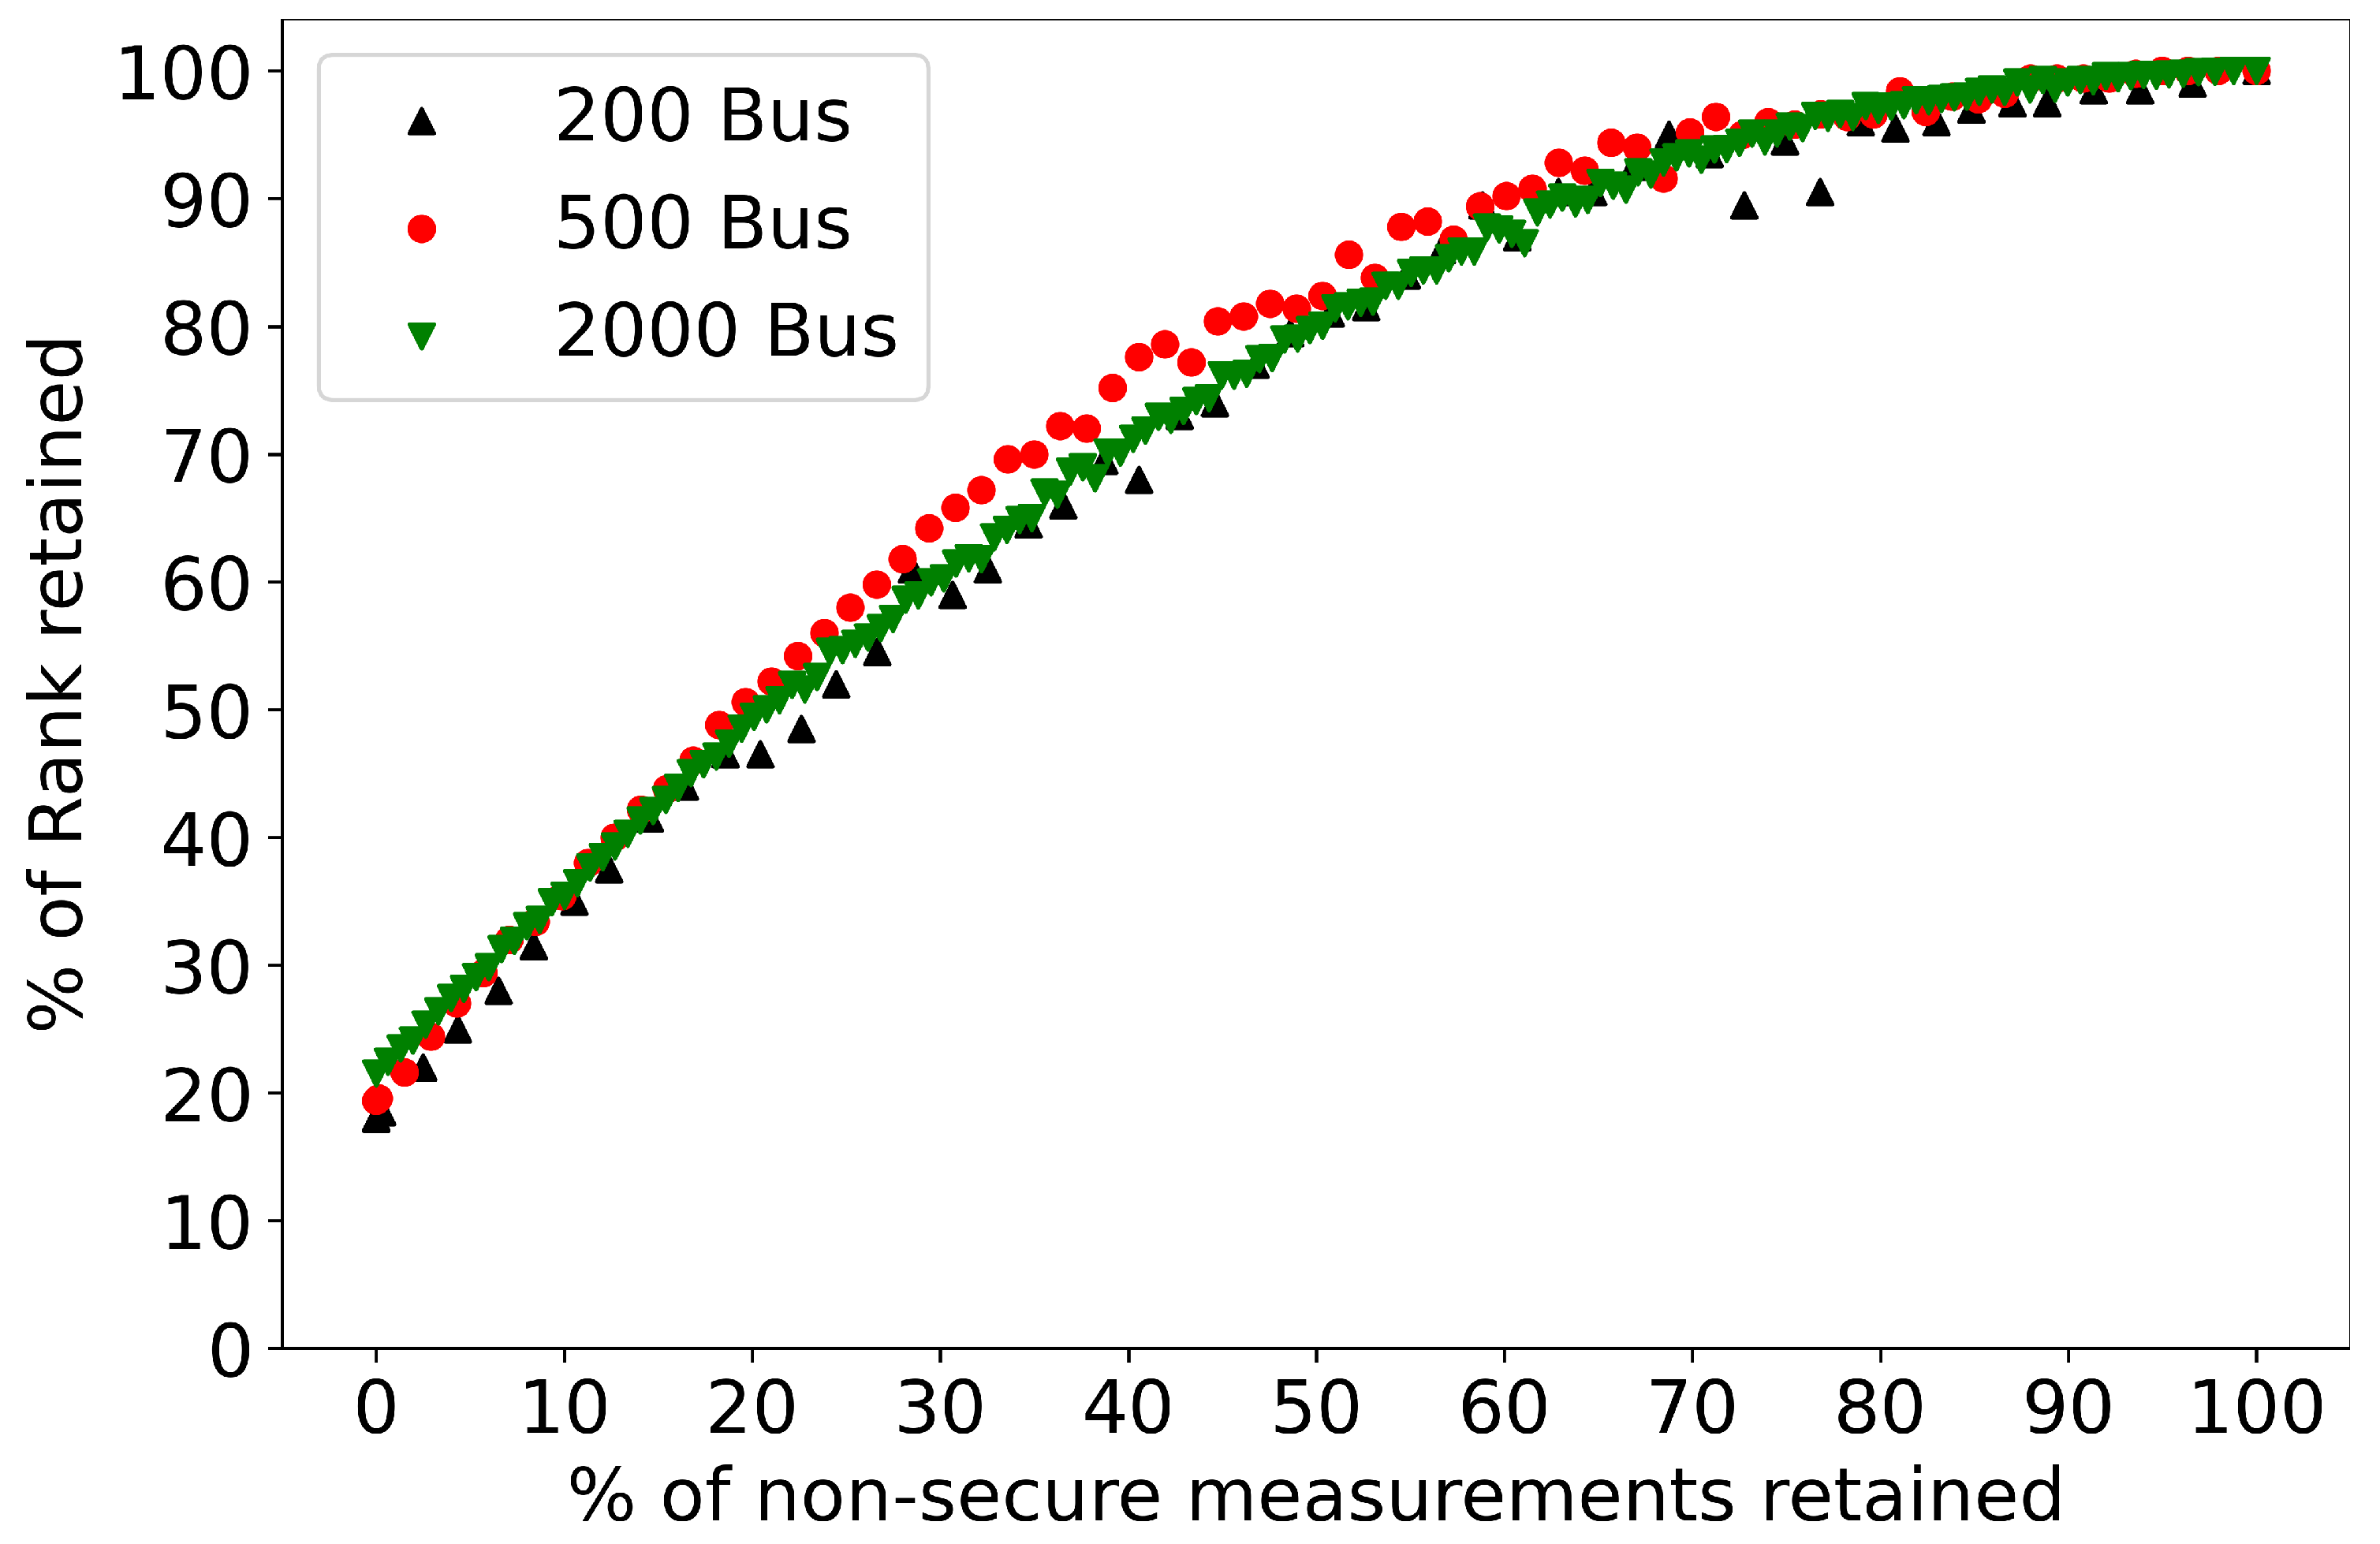
The hierarchical approach in Table 1 is used to solve the problem. Figure 3 and Figure 4 demonstrate the performance of the islanding strategy developed for systems where each node is observed by a single PMU or by at least two PMUs, respectively. The following observations are noted. For all three systems in Figure 3, retaining 100 % of non-secure PMUs does not ensure full observability after islanding, i.e., a 100 % rank is not achieved, because lines disconnected result in loss of observability. On the other hand, the disconnected lines during islanding in Figure 4 do not result in a loss of observability due to the presence of redundant PMU measurements. For the same reason, as the number of retained non-secure measurements is decreased, the system observability decreases at a steeper rate in Figure 3 compared to Figure 4.
The hierarchical optimization allows assigning individual importance to objectives during the islanding process. Consider one case for the 200 bus system—when maintaining transient-stability has a higher priority, the line flow disconnection is 240.05 MW at the expense of 348.62 MW of load-generation imbalance. When maintaining load-generation balance has a higher priority, the islands have a 17.57 MW imbalance, and 437.61 MW line flow is disconnected. Similar results are noted for the 500-bus and 2000-bus systems. This demonstrates that a small number of non-secure PMUs can maximize the island observability while maintaining island stability. Once selected PMUs are retained, the actual PMU measurements can now be used to obtain the steady state bus voltage and angle estimation for the smaller partitions. The dynamic stability of the islands is later investigated in Section 7.4.

7.2.2. Partitioning into Multiple Islands

The hierarchical optimization approach is extended to cases where the system is partitioned into multiple smaller islands where each bus is observed only once. Consider the 200-bus system with the set of coherent generators given in [32]. The multi-objective optimization is solved and the system is partitioned into 4 islands. In this case, the objective degradation for rank is set to 10, which allows the later objectives to degrade the earlier objective of rank off its optimal value by 10. Table 6 summarizes the results of islanding considering different objective priorities. Similar observations to Section 7.2.1 are noted. Consider the case when the highest priority is assigned to rank in row 2, a total of 178 buses remain observable, while 100 % non-secure measurements are retained. As observed previously, the reduction in the number of observable buses occurs due to increase in the number of multiple line disconnections when creating more islands.

7.3. Performance of Controlled Islanding under Partial Uncertainty

For Scenario 2 under partial knowledge of an attack, the size of the island with vulnerable PMUs is minimized while maximizing observability, steady-state, and transient stability. The redundant PMU placement is considered for the studies.

7.3.1. Identification of Attack Buses

First, potential attackable nodes are identified following the approach in [13]. For the 200-bus, 500-bus, and 2000-bus systems, the load injection nodes { 17 , 18 } , { 100 , 101 } , and { 657 , 663 } are identified to be under attack. Next, all neighboring PMUs at a distance of R = 3 are labeled as vulnerable. The parameter R can be tuned when more information on the extent of attack becomes available. The dependency of the island size on the value of R is illustrated later in Section 7.3.4. Depending on the distribution of zero injection buses in the network, a total of 27 , 9 , and 19 buses are initially designated as untrustworthy for the 200 , 500 , and 2000-bus systems, respectively. The total number of buses flagged as potentially vulnerable will vary when different candidate nodes are chosen for attack. A wide range of solutions are obtained by varying the objective priority and the degradation tolerance of the solution using the hierarchical optimization approach.

7.3.2. Partitioning into Two Islands

The solutions obtained by varying the objective priority and the degradation tolerance are summarized in Table 7, Table 8 and Table 9. First, Table 7 illustrates the effect of optimal solution degradation. Compare rows 1 and 3 of Table 7. With an objective degradation tolerance of 50 MW for flow disconnection and 10 MW for load-generation imbalance in row 3, the size of the uncertain island G decreases from 42 to 38, and the imbalance improves from 9.8 MW to 0.07 MW. The improvements, come at the expense of a 7.7 MW increase in flow outages. The system remains 98 % observable (as seen from rank ) in both cases. Similar observations are noted in Table 9 for the 2000-bus system.
The impact of objective prioritization is explored in Table 8 for the 500-bus system. Here, the priority = 1 corresponds to the objective of the highest importance, and the priority = 4 , the lowest. Consider row 1 in Table 8 649.16 MW line power flow is disconnected because the top priority is to minimize the total flow disconnection. When maximizing observability is of interest in row 2, complete observability is maintained at the expense of large islands with uncertain PMUs, a significant imbalance of 1610 MW, and a large power flow disconnection of 1465 MW. When isolating attack is the top priority in row 3, the vulnerable PMUs are contained in an island of 2.2 % of the entire system. However, such a small island may not survive independently without generators. Hence, a suitable prioritization between the four objectives is necessary to maintain island stability. This example shows the flexibility of designing islands that cater to a particular need during islanding. The dynamic stability of the islands is investigated in Section 7.4.
The solutions obtained from the hierarchical optimization approach are compared to different scalarization methods. Here, Scenario 2 is considered for comparison purposes. The results of the scalarization methods, using the parameters in Table 3, Table 4 and Table 5, are summarized in Table 10, Table 11 and Table 12. As an example, Figure 5 illustrates the two partitions corresponding to row 1 of Table 10.

7.3.3. Partitioning into Multiple Islands

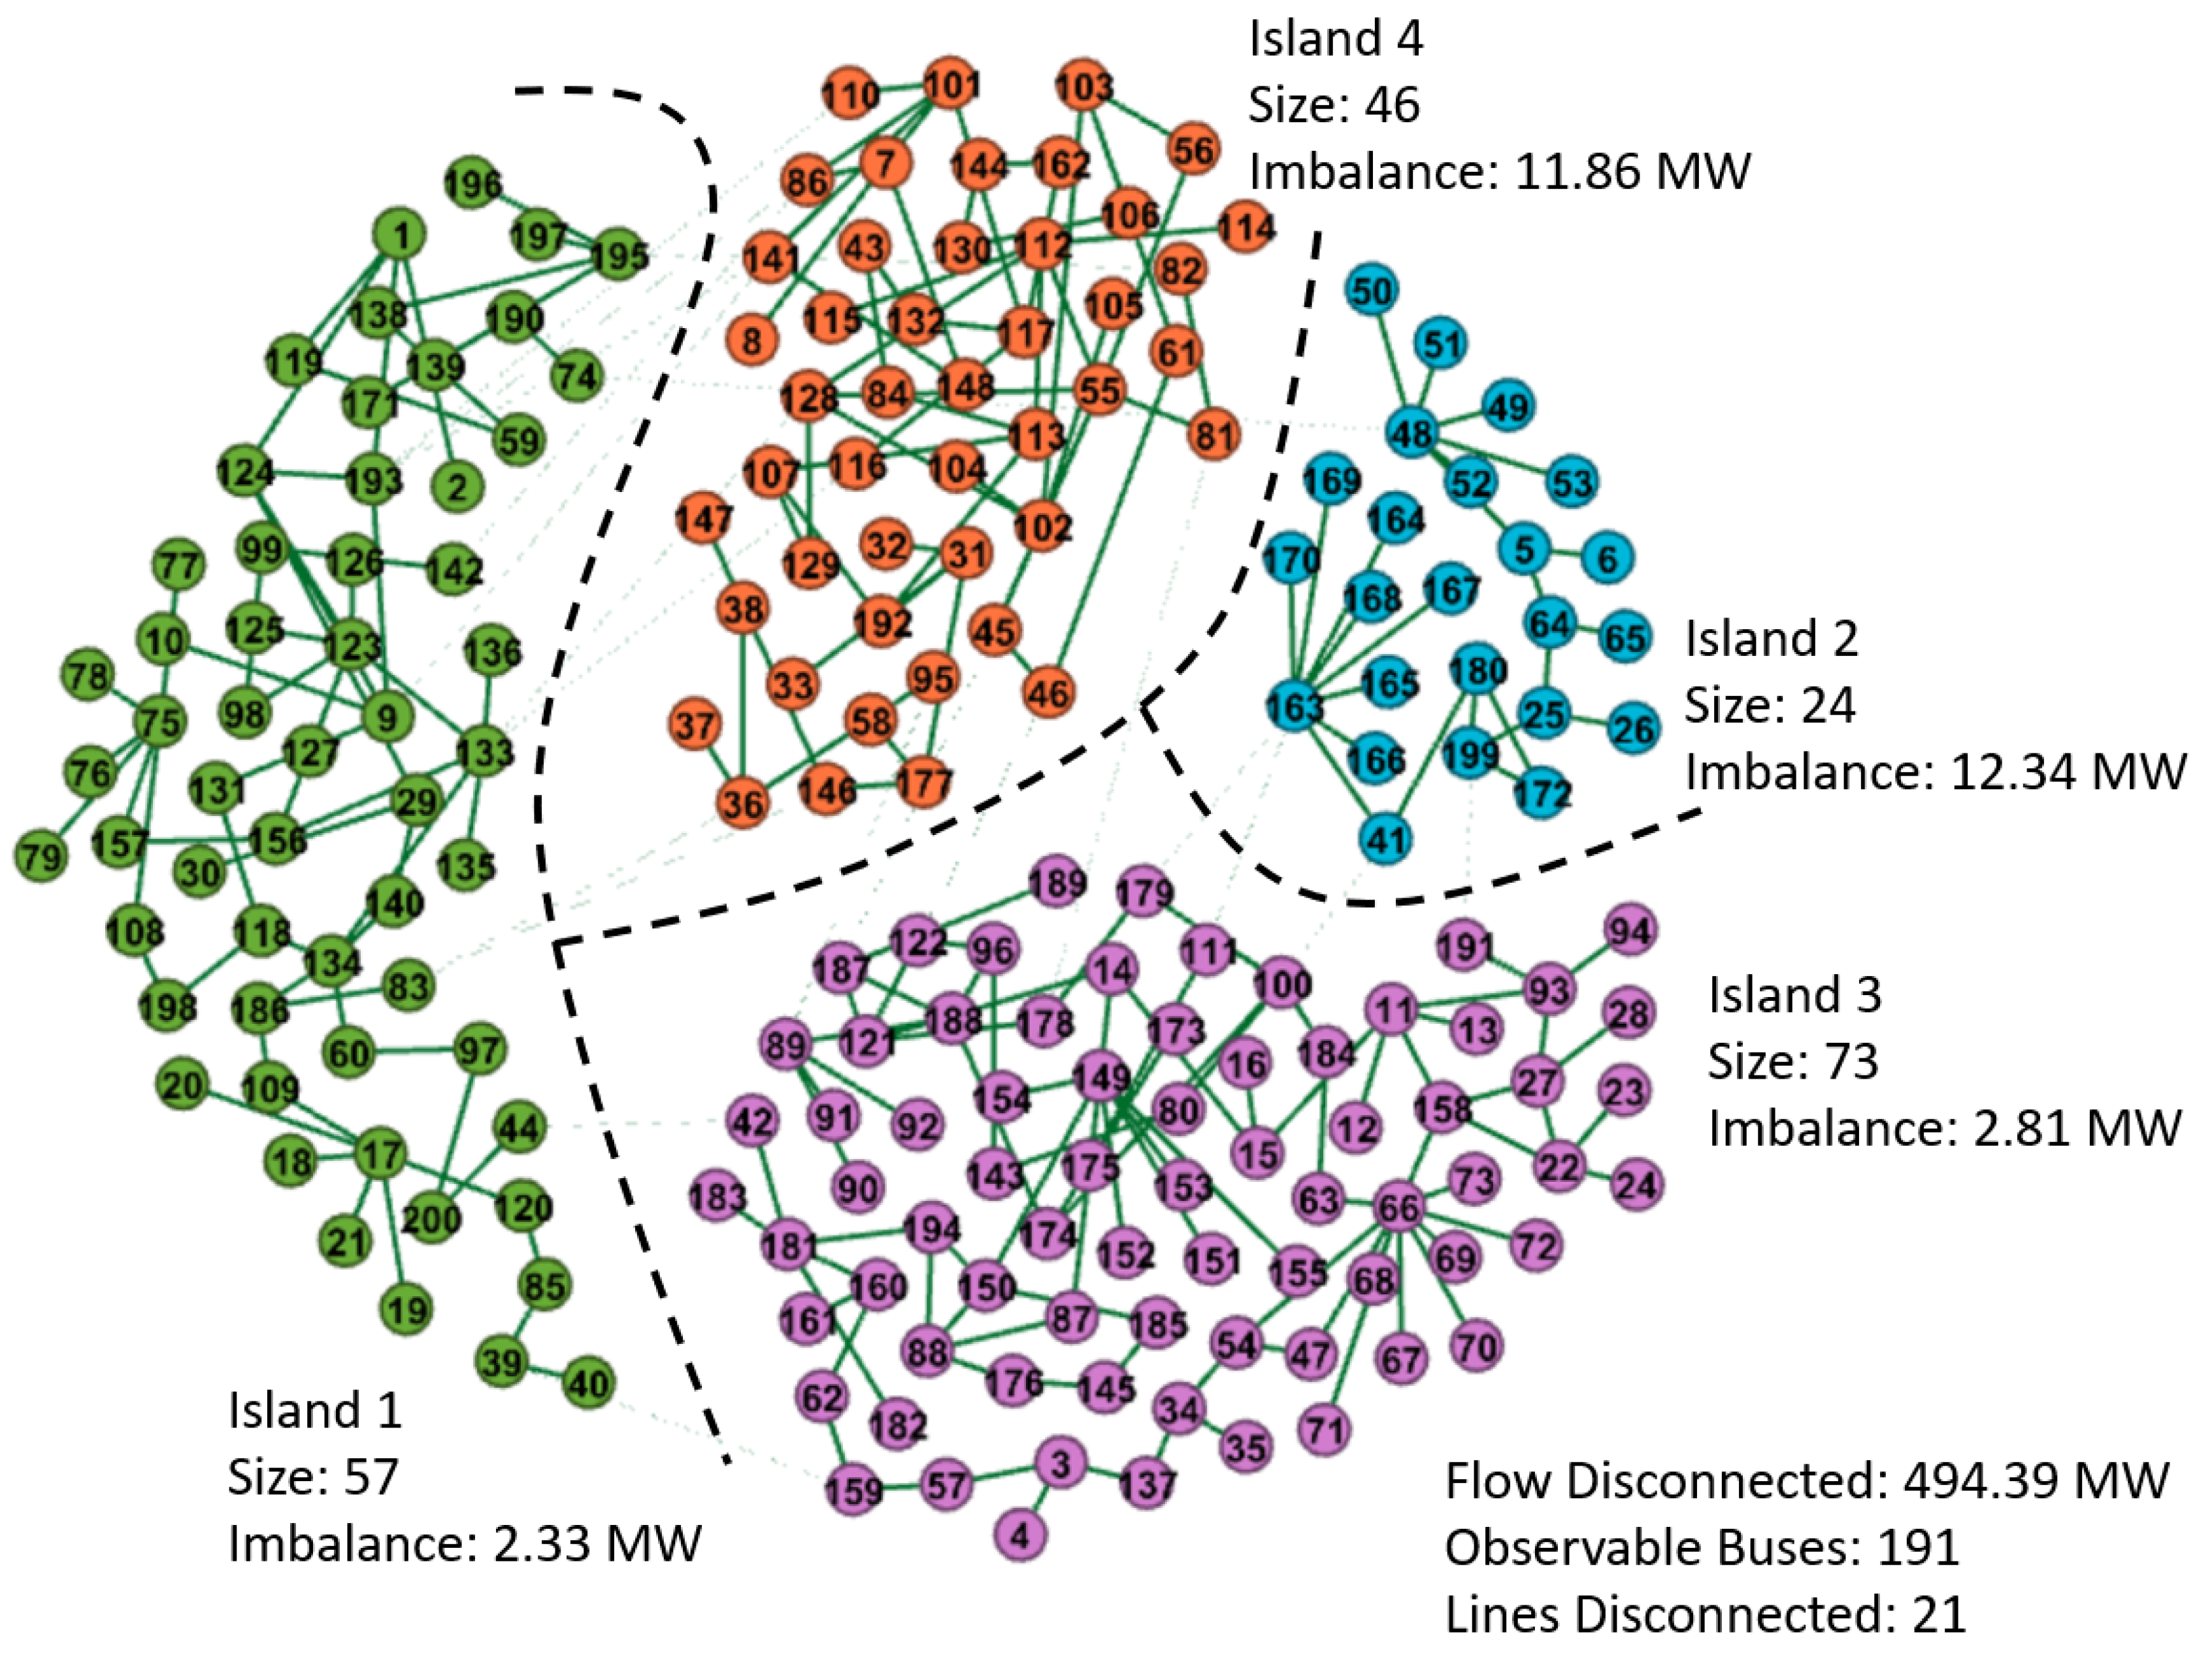
The problem of partitioning the system into multiple smaller islands is considered next. Four coherent generator groups are assumed to exist for the 200-bus system [32]. The group of vulnerable buses was chosen to be 17 , 18 , 19 , 20 , 21 , 39 , 83 , 85 , 109 , 120 , 134 , 186 . This group was assigned to the closest coherent generator set based on electrical distance. Figure 6 illustrates the four partitions obtained using the weighted-sum scalarization process. It is observed that the size of the island with vulnerable buses is now 28.5 % of the entire system. The increase in size is attributed to assignment of coherent generators and, subsequently, additional nodes to yield lower load-generation imbalance. The remaining three islands have low MW imbalances. A total of 494 MW of line flow is disconnected while 191 buses remain observable.

7.3.4. Effect of Attack Radius R on Size of Vulnerable Island

The design of islands is further investigated considering different attack radius R. Quite often, the actual extent to which the attack has compromised the PMU network may not be accurately determined under rapidly evolving power system situations in real-time. Table 13 and Table 14 illustrate the size of the vulnerable island under different values of R. With larger R, more buses are deemed vulnerable. While a very large value of R is impractical, more reasonable values can be obtained by identifying the underlying architecture of the PMU-PDC communication network between different areas.
The results conducted on the test systems in this section demonstrate that the proposed recovery scheme effectively isolates attacks while creating stable and observable islands. The optimal islanding decisions ultimately depend on how operators choose to strike a balance between multiple competing objectives.

7.4. Dynamic Simulations

To avoid a total system blackout, it is necessary to ensure the smaller islands are transient stable during controlled islanding. While the objective function in Equation (19) prevents disconnections of lines with large power flow [3], it is important to assess the transient stability of the newly formed islands through time-domain simulations (TDS). The TDS are performed using DSAToolsTM and the Transient Stability Index (TSI) of the smaller partitions are reported. The TSI of the system is calculated as [44],
TSI = 360 δ max 360 + δ max × 100
where δ max represents the maximum angle difference between any two generators in an island at any particular time. Here, TSI is generally considered as the smallest index among all islands in the system. In this paper, transient studies are performed on the 200-bus and the 500-bus systems.
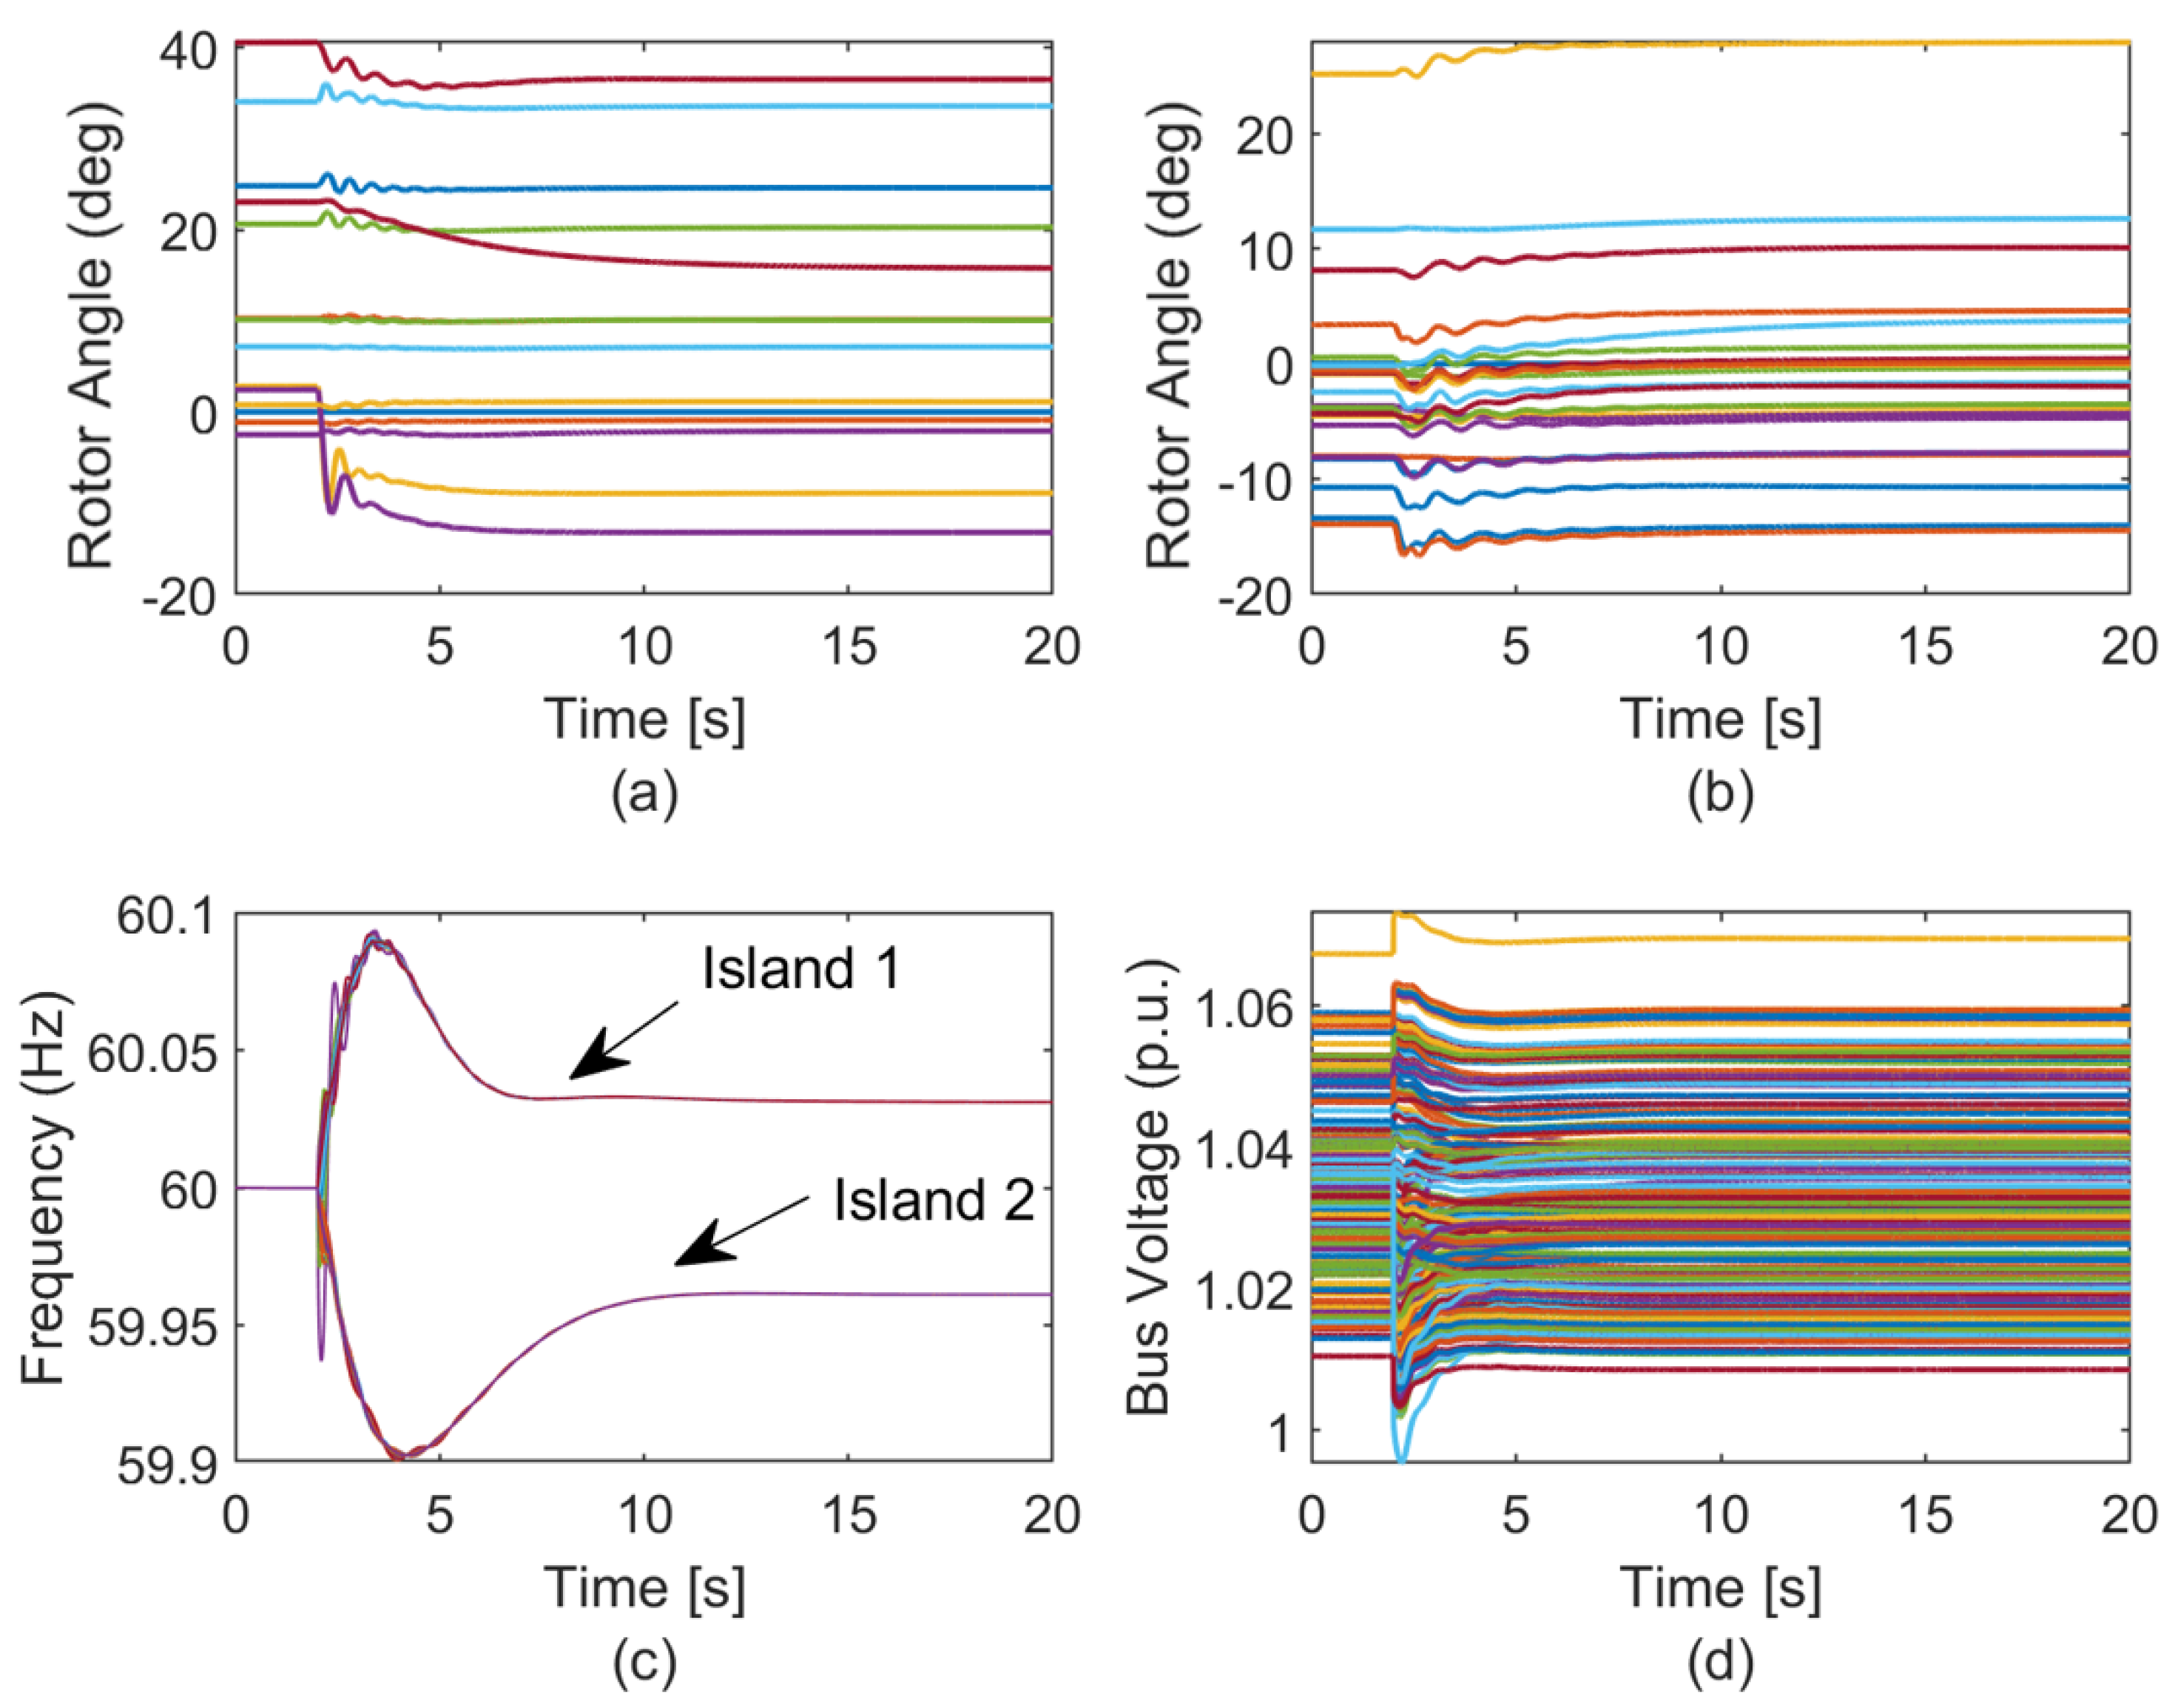
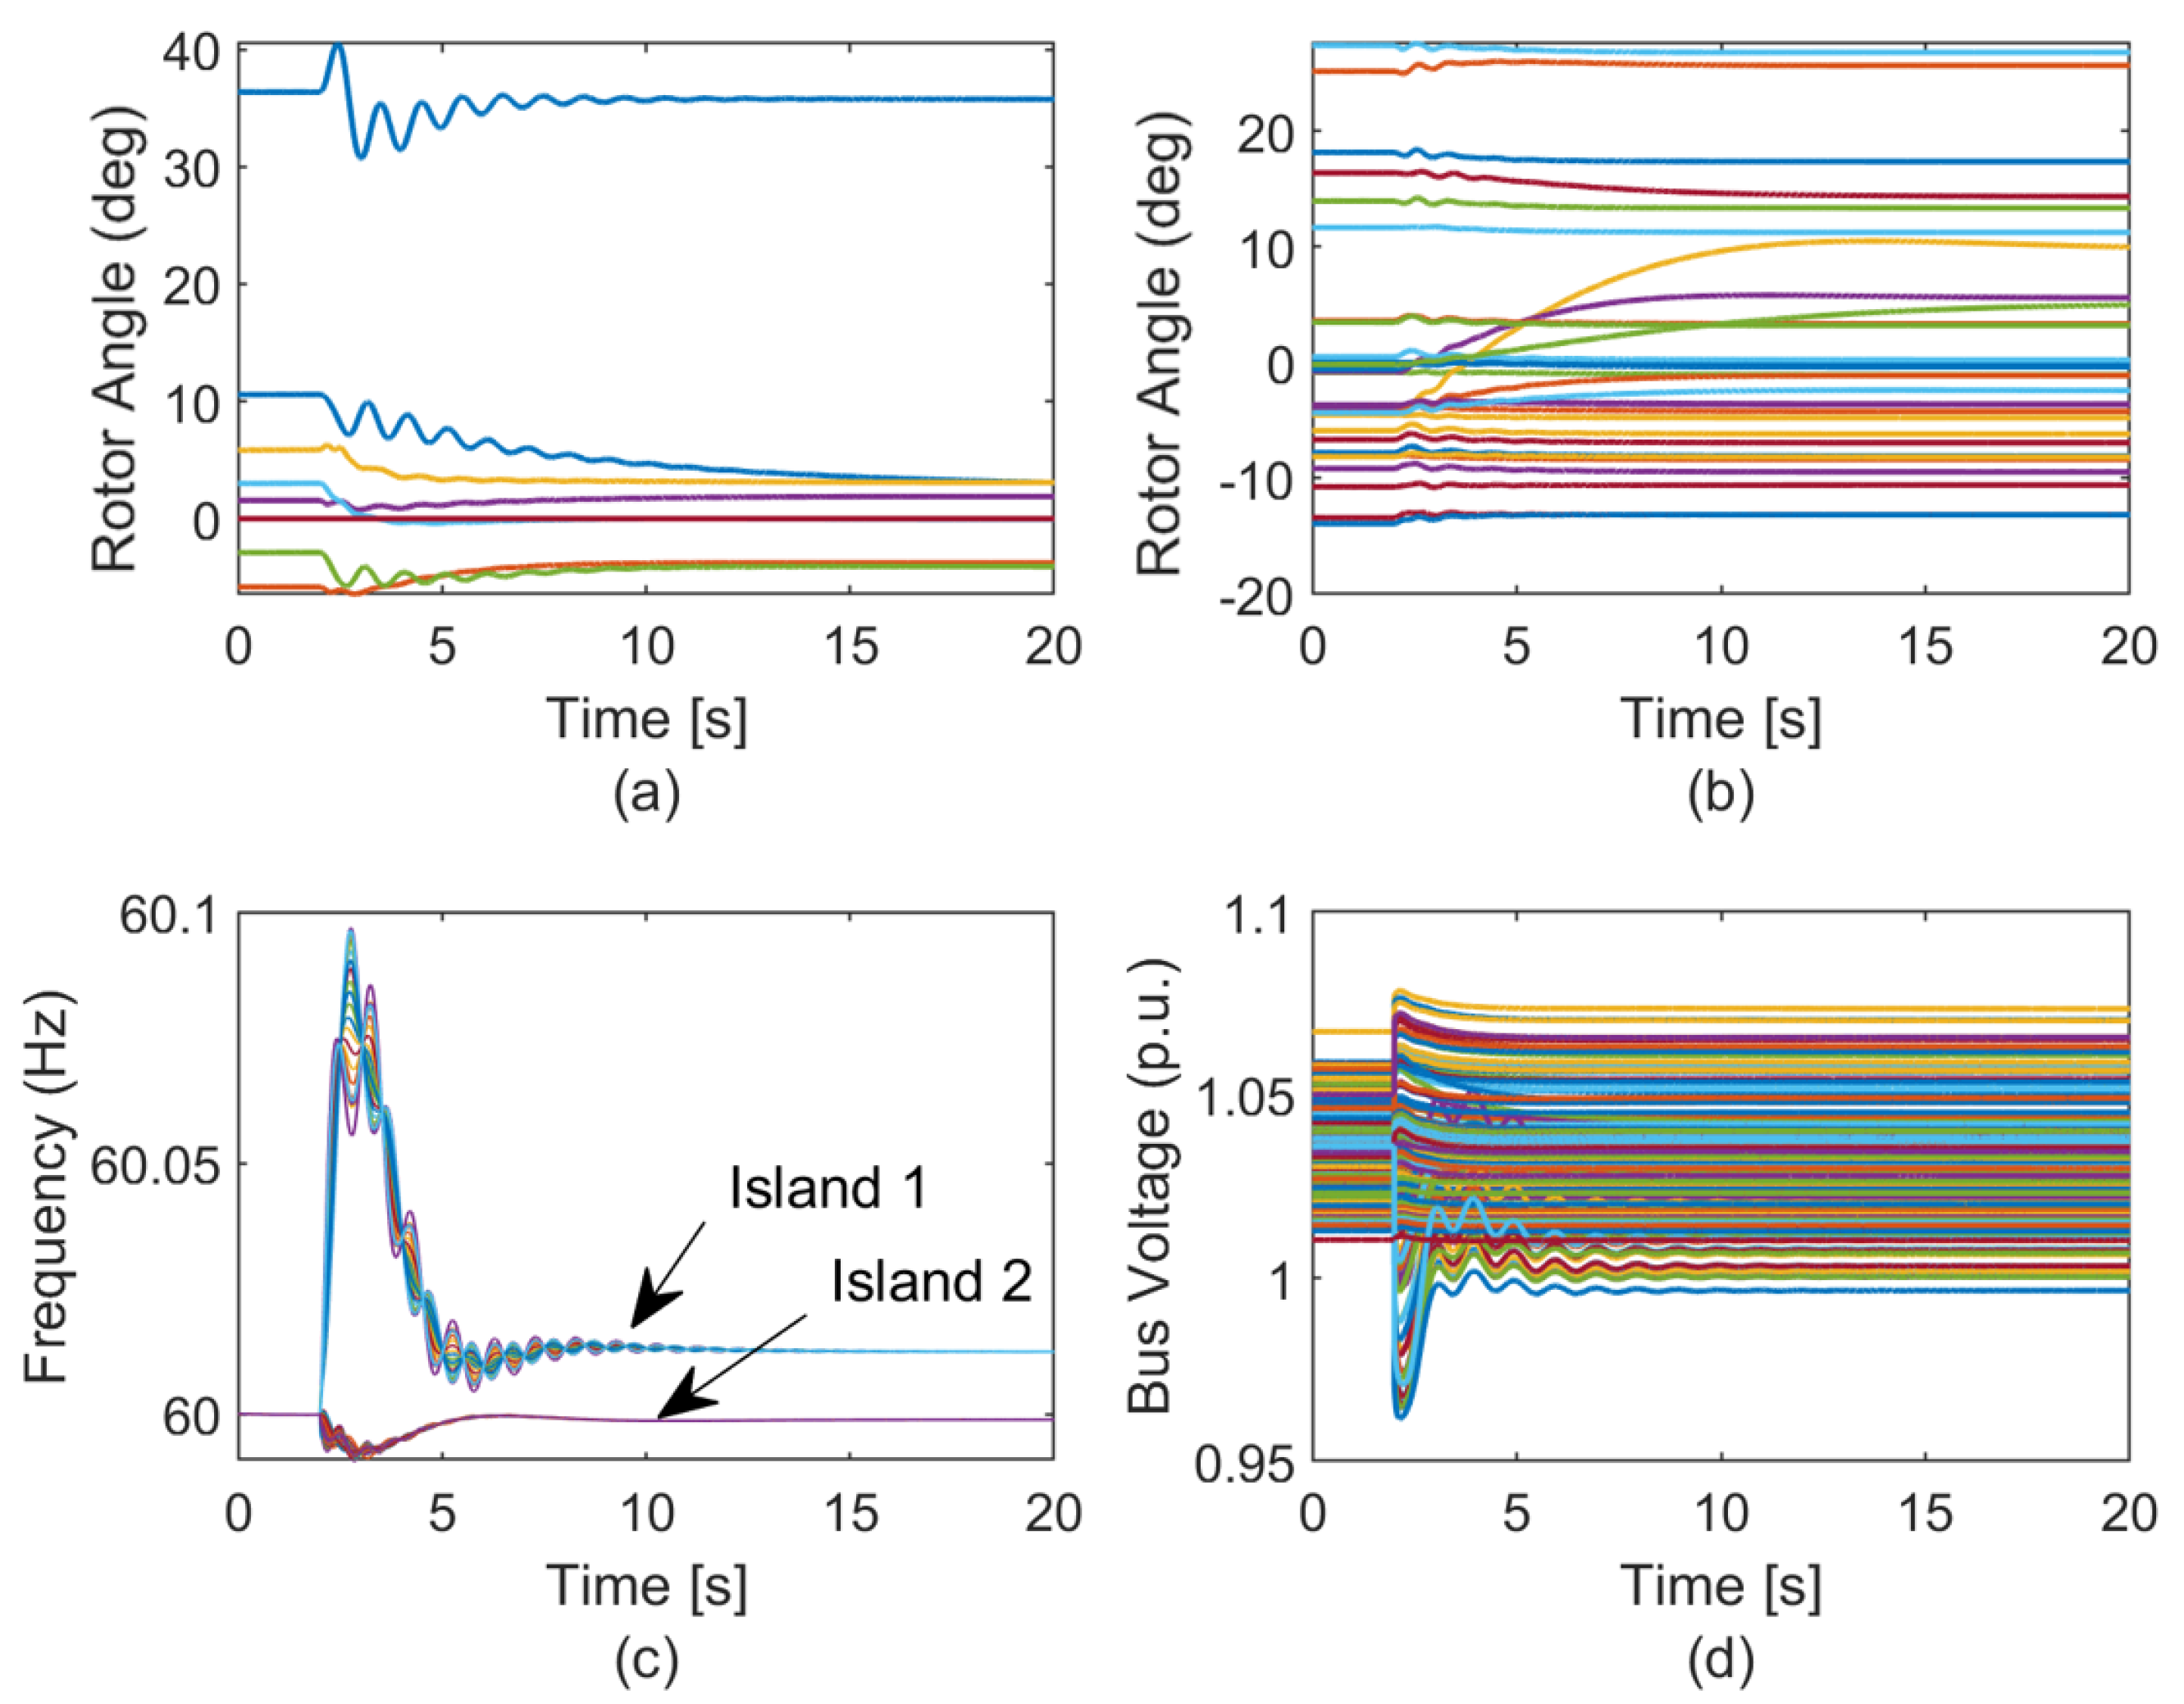
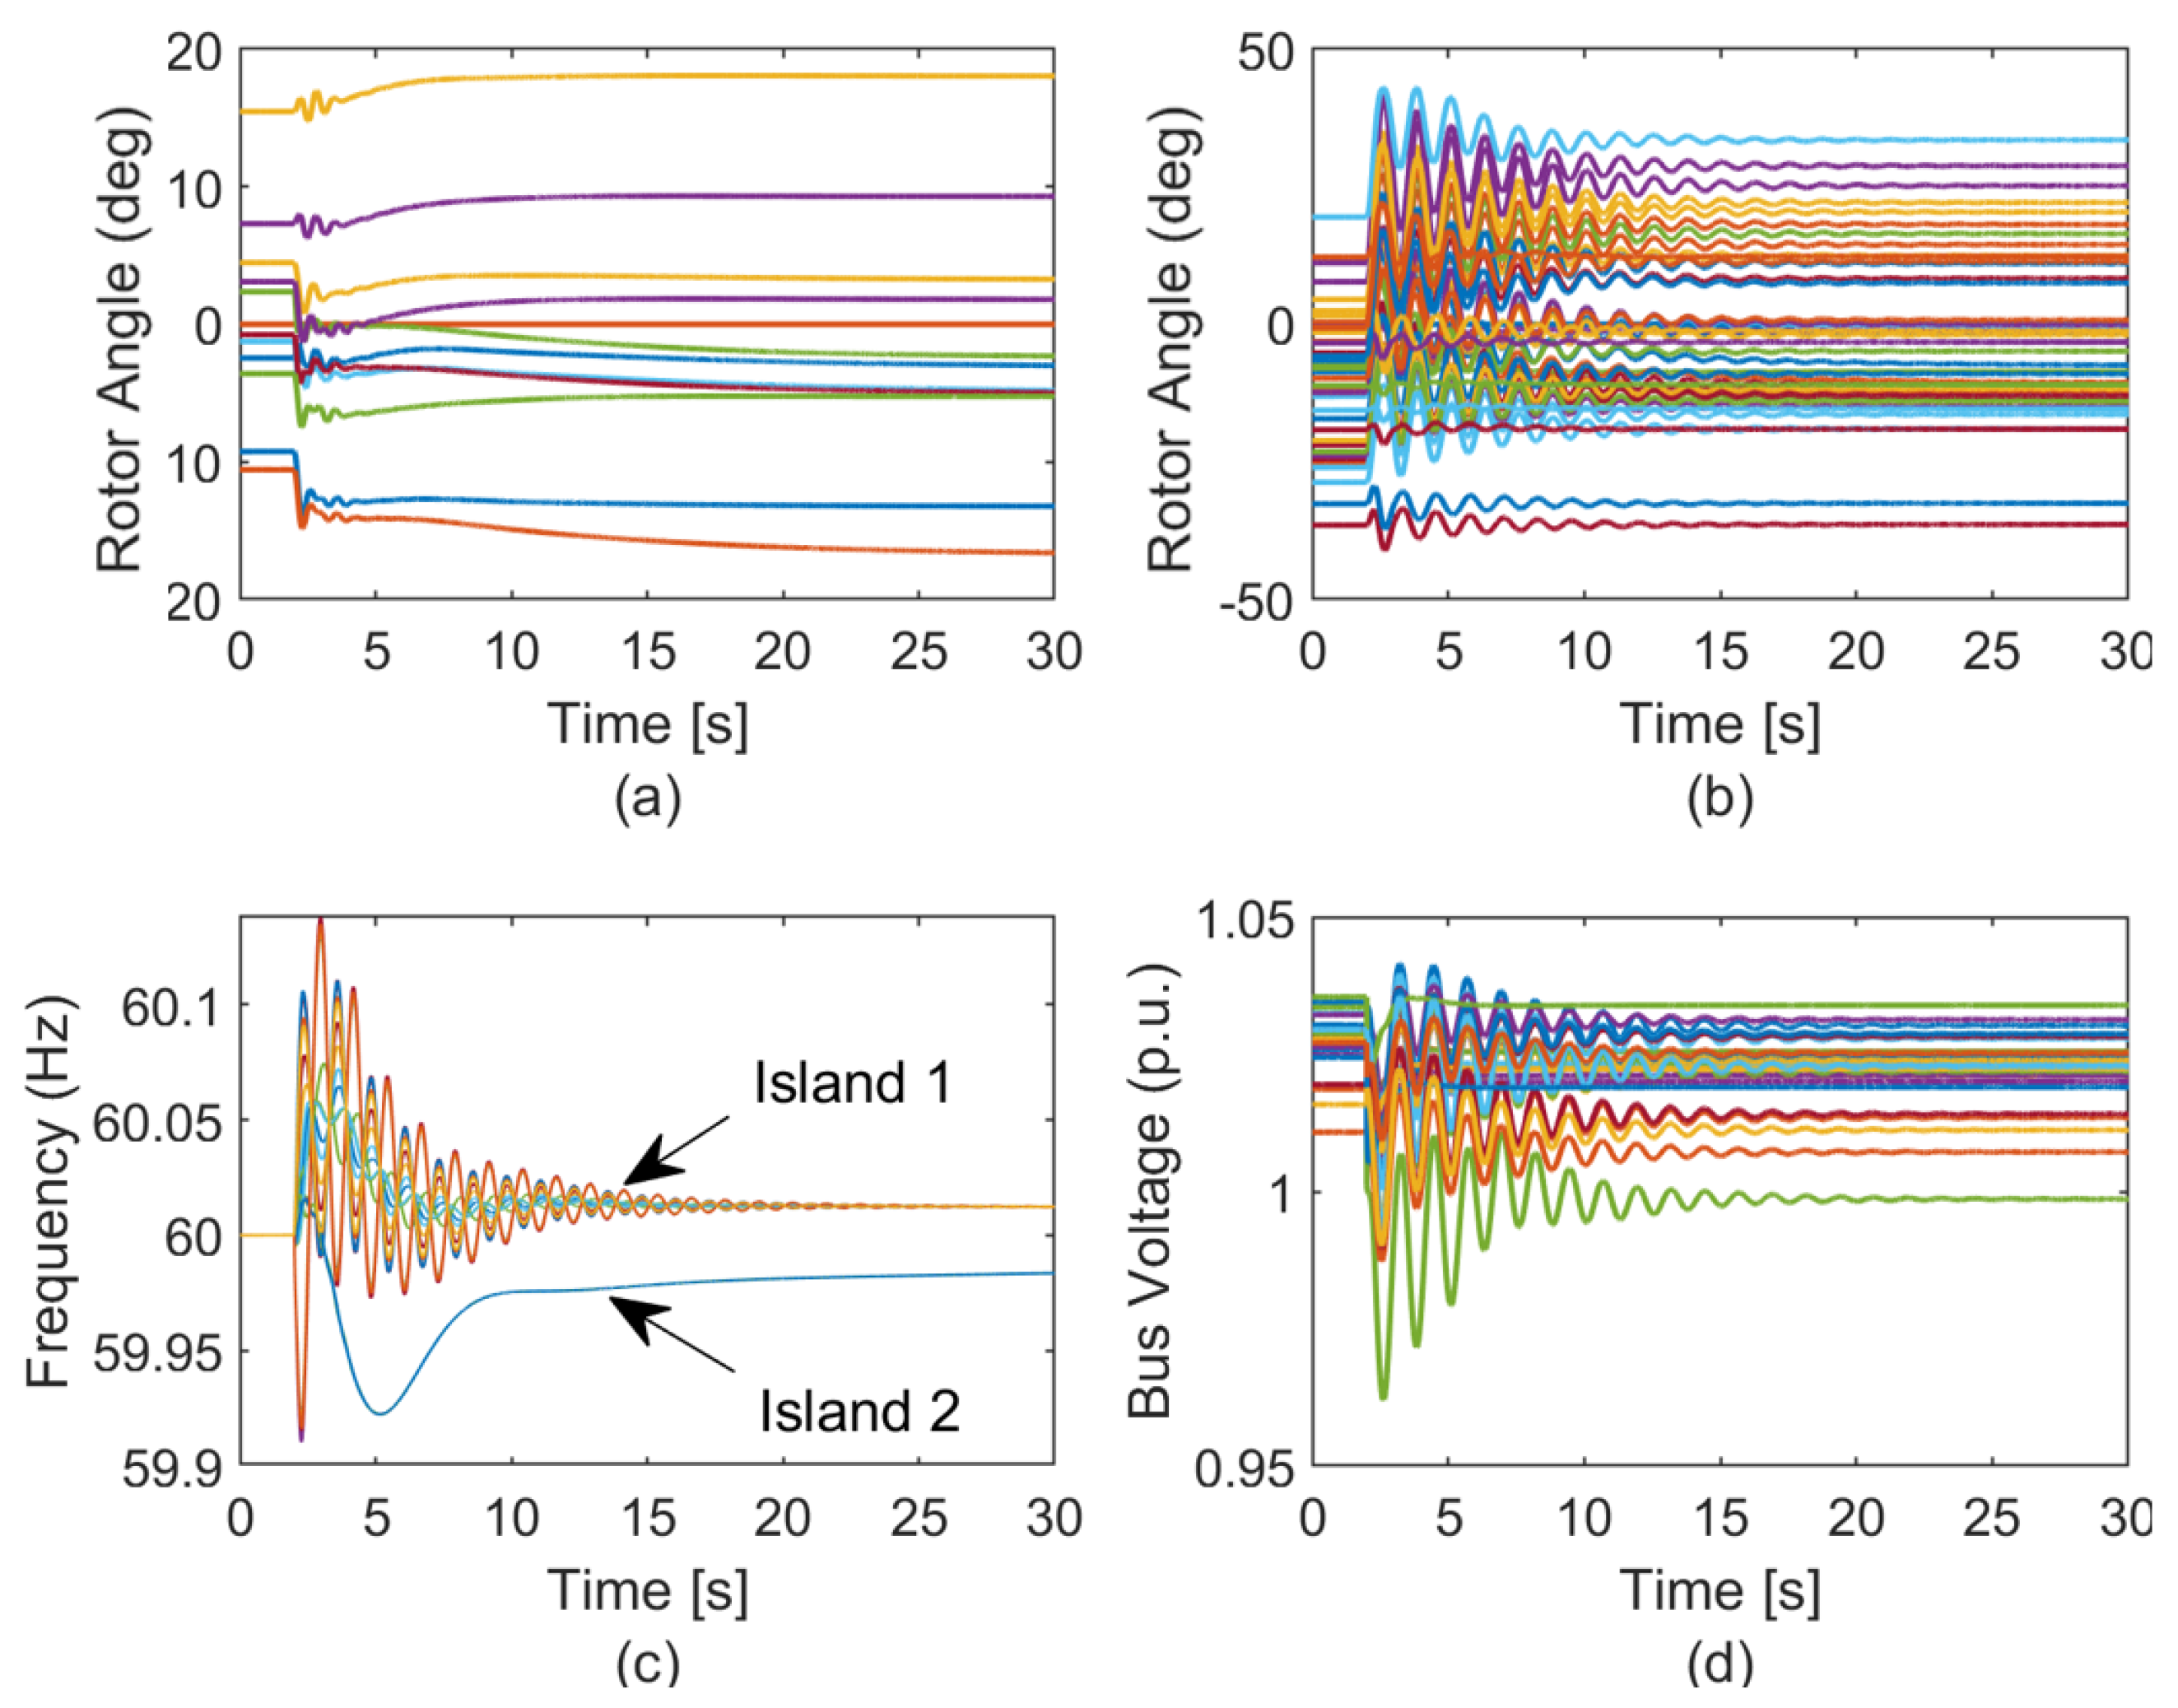
For Scenario 1, Figure 7 and Figure 8 illustrate the transient stability through time-domain simulations. Figure 7a,b show that the generator rotor angles in both islands are transient stable. The frequency of the islands in Figure 7c are 60.03 Hz and 59.96 Hz, respectively. These deviations are caused by imbalances of 183.11 MW and 165.51 MW in islands 1 and 2, respectively. Furthermore, the bus voltages in Figure 7d are within the acceptable limits of 0.90 p.u. and 1.1 p.u. Similar observations are noted for the 500-bus system in Figure 8.
For Scenario 2, Figure 9 and Figure 10 illustrate the transient stability results. Figure 9a,b show that the generator rotor angles in both islands are stable. The frequency of the islands in Figure 9c are 60.01 Hz and 59.99 Hz, respectively. Furthermore, the bus voltages in Figure 9d are well within the acceptable limits of 0.90 p.u. and 1.1 p.u. The transient stability indices, obtained using DSATools TM time-domain simulations, are summarized in Table 15.
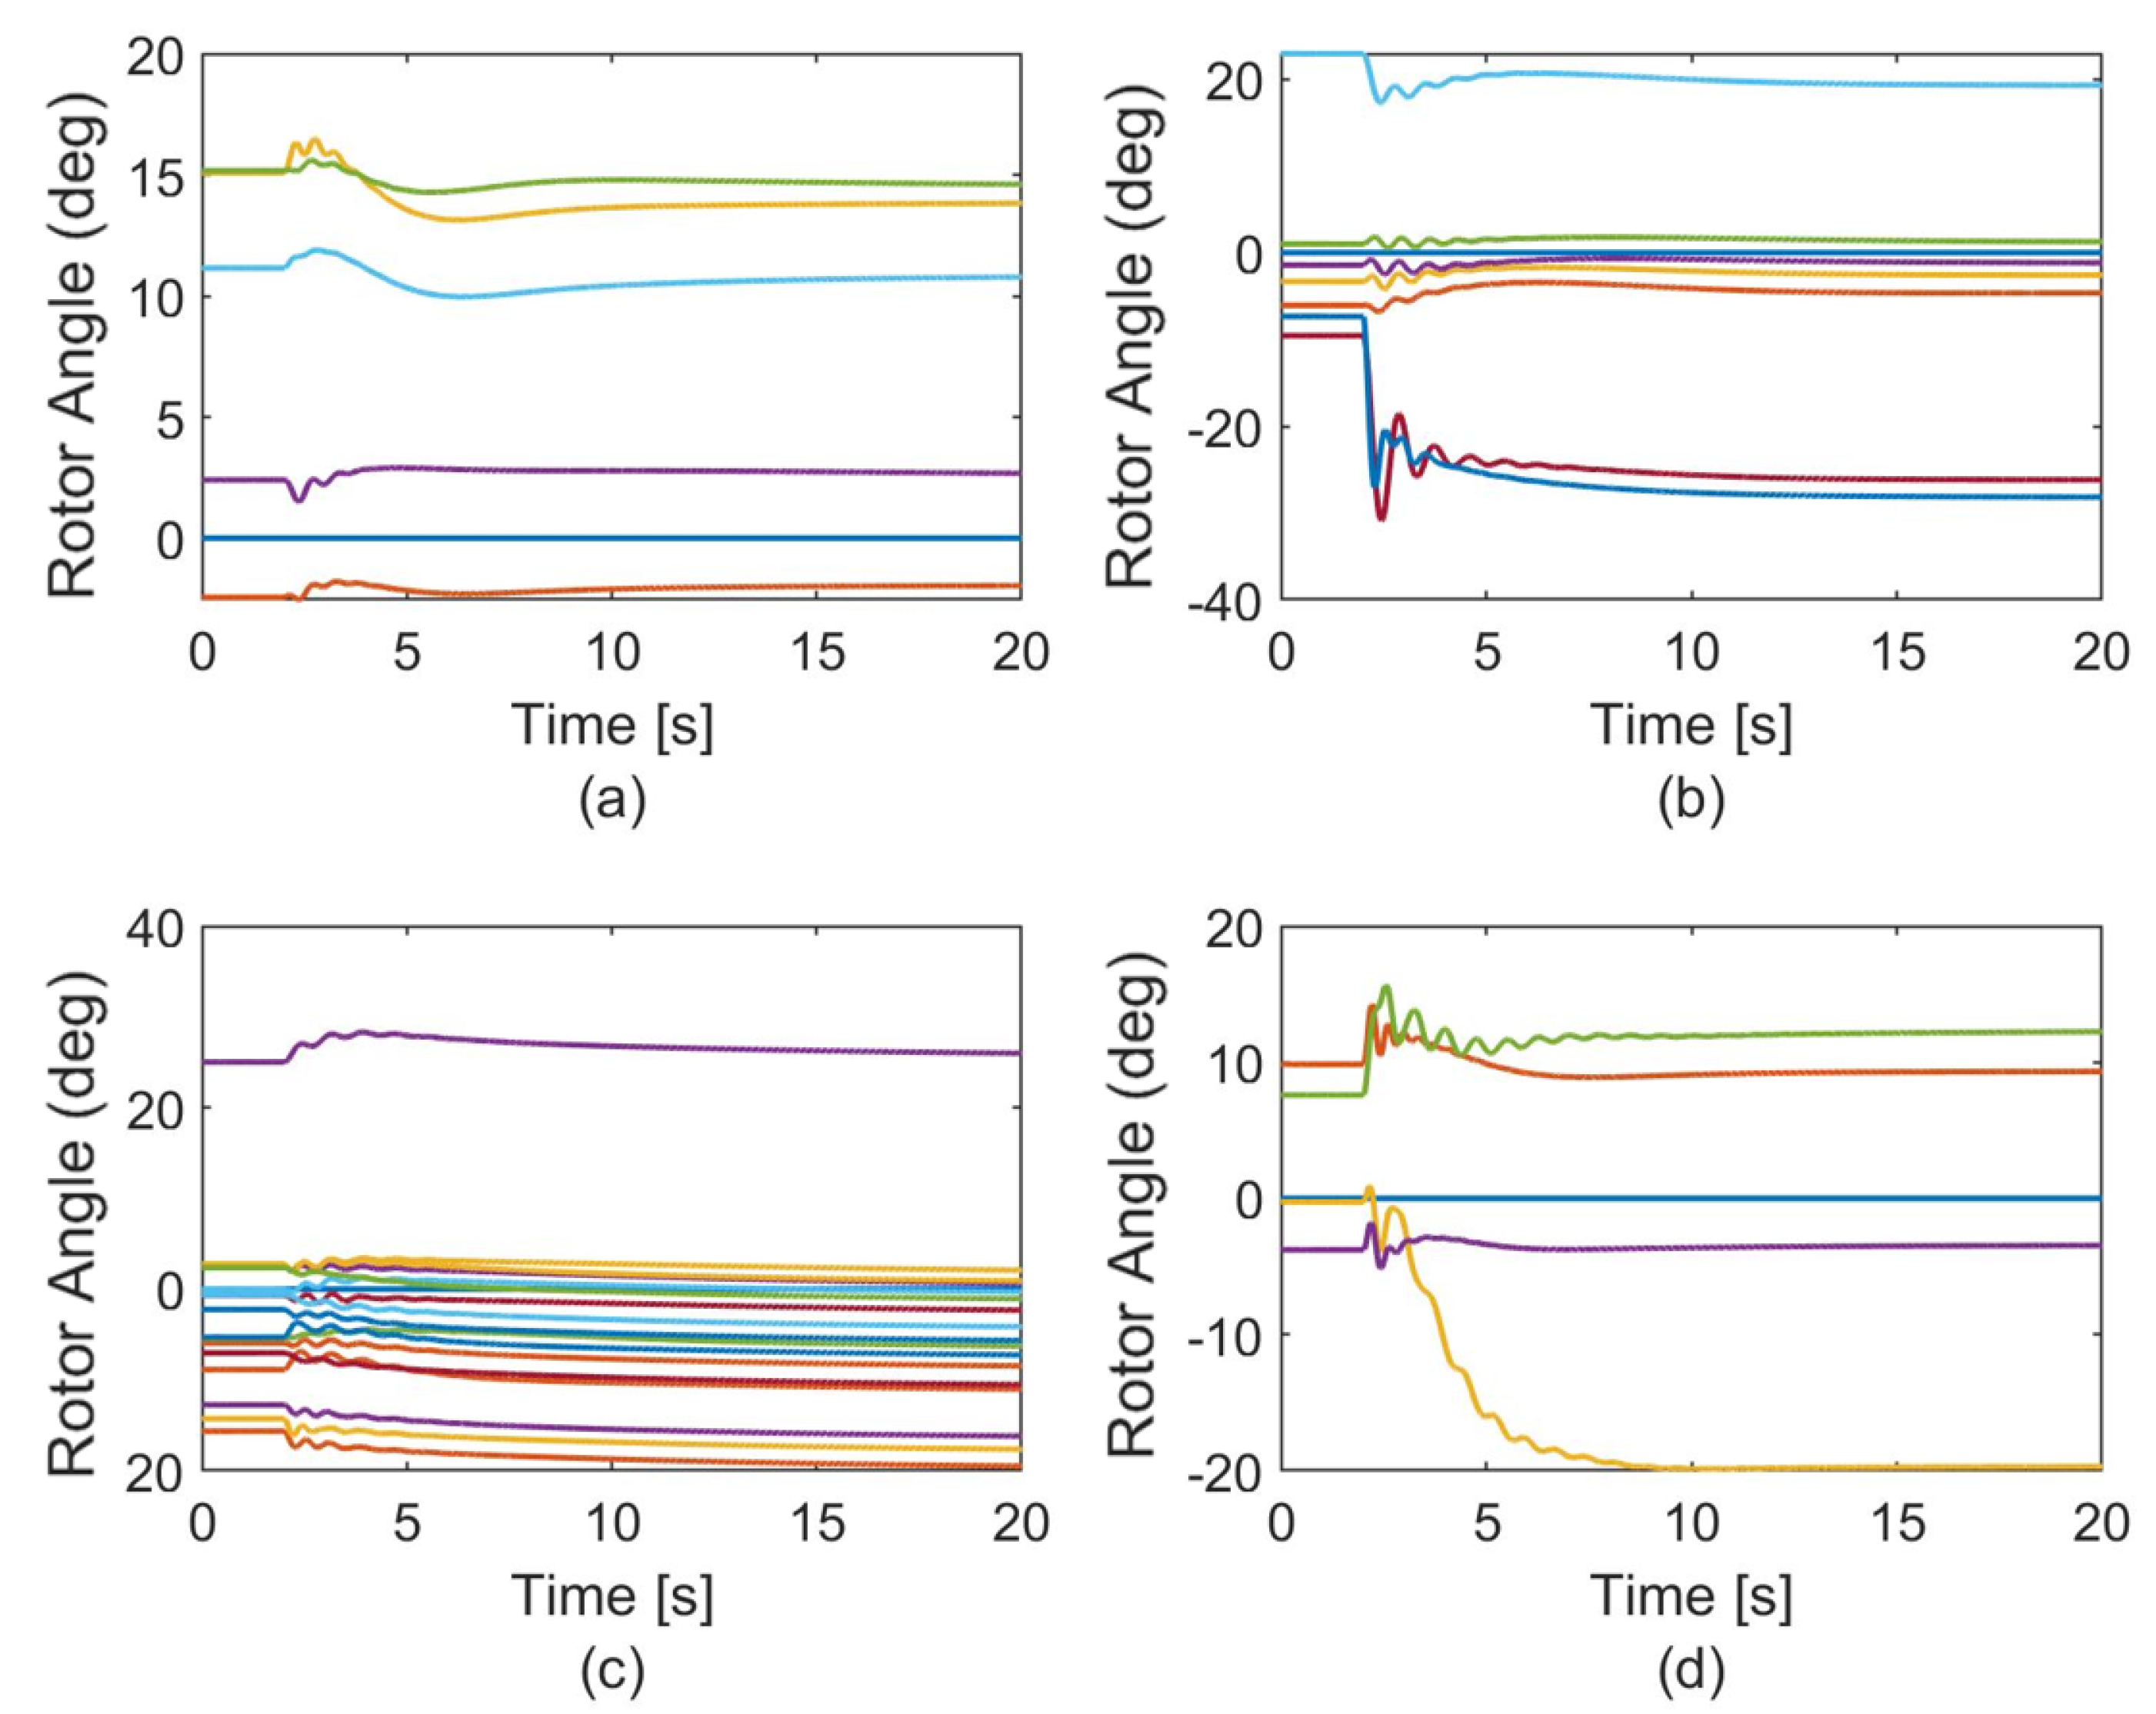
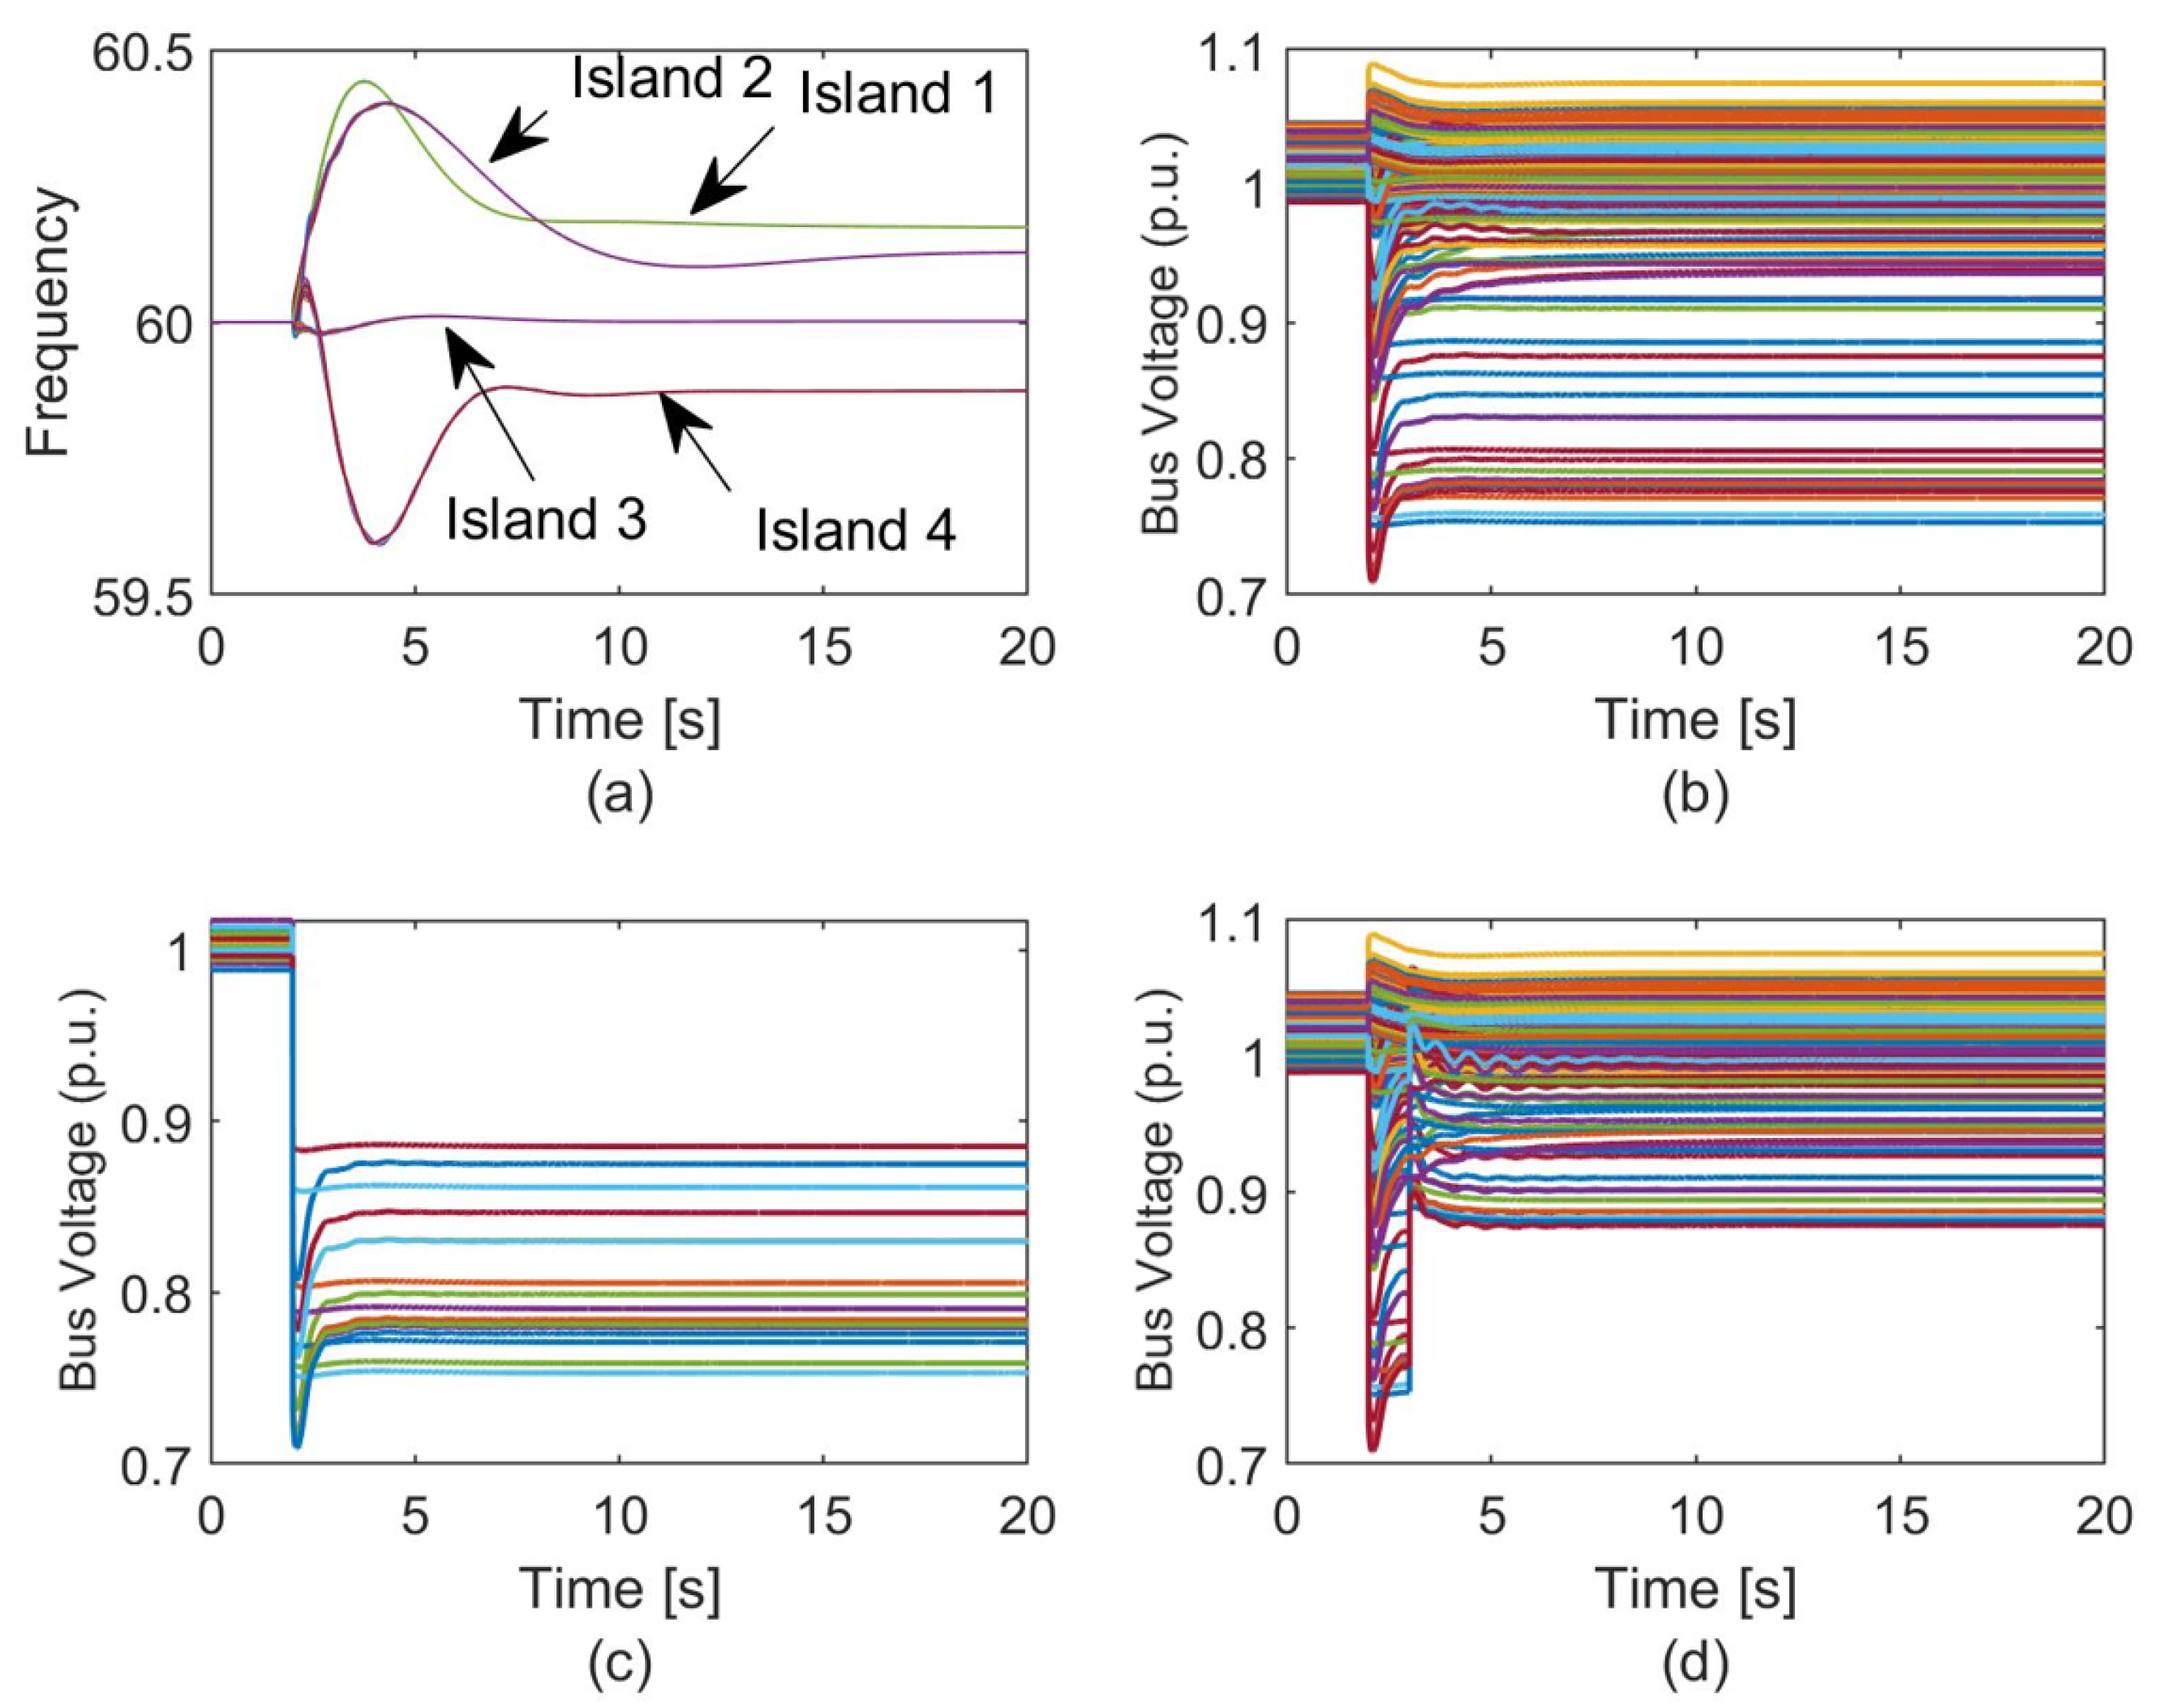
The results for partitioning the system into four smaller islands, corresponding to Figure 6, are demonstrated in Figure 11 and Figure 12. The rotor angles in Figure 11 and the frequency in Figure 12a demonstrates the dynamic stability of the four smaller partitions. However, it is observed in Figure 12b that few buses have low voltages post partition. Corresponding to Figure 6, buses with low voltage are 59 , 74 , 138 , 139 , 171 , 190 , 195 , 196 , and 197 in island 1 and 7 , 8 , 43 , 86 , 110 , 112 , 116 , 117 , 132 , 141 , 144 , 148 , and 162 in island 4. The buses with low voltages are shown in Figure 12c. The cause of low voltages on these two neighboring clusters of buses is attributed to the following—(1) there is a lack of local reactive power production in these two clusters, and (2) a total of 29.32 MVAR of reactive power flow is disconnected during islanding. There are two possible mitigation strategies to overcome this problem—(1) incorporate a reactive power term in the objective function of the optimization problem for controlled islanding [4], or (2) reduce the MVAR load post islanding. As demonstrated in [4], incorporating additional objectives solves the reactive power problem, however, for our study, this increases the number of objective functions to five, which may become difficult for the operator to optimize. Instead, post islanding MVAR load shedding is employed near the affected buses after which voltages return to near nominal values as shown in Figure 12d.
These results demonstrate that the optimization problem can successfully create stable partitions while minimizing the impact of attacks.
Irrespective of which optimization algorithm the operator uses, the proper way for system operators to use the results of the optimization are as follows: (1) The set of transmission lines to be disconnected for controlled islanding is the output of the optimization problem. (2) All circuit breakers (CB), installed on two ends of the candidate lines, are then identified. These circuit breakers can be directly controlled by the operator through relays at the local user interface or at the remote control center. (3) Multiple CB can be tripped from SCADA, the communication protocol being the Distributed Network Protocol 3 (DNP3) protocol. In general, the DNP3 outstation runs on substation relay, in this case, PMU such as SEL 421 [45]. On the other hand, the DNP3 Master is on SCADA. The remote circuit breaker trip commands to go from the DNP3 master to the substation relay through the communication path comprising the SCADA gateway router and the substation gateway. (4) Once the breakers are opened and the system is partitioned into smaller islands, the operators can use real-time PMU measurements from selected devices to estimate the steady states of the islands using SE.

7.5. Computation Time

The computation times for the hierarchical optimization are summarized in Table 7, Table 8 and Table 9 while those for the scalarization approaches are given in Table 16. The comparison demonstrates that hierarchical approaches often lead to more solution time for large systems, because the hierarchical technique solves multiple single-objective problems iteratively. However, the provision for optimal solution degradation makes the hierarchical approach particularly attractive for larger power systems when prompt islanding decisions are needed at the expense of non-optimal but acceptable solutions.
Table 9 illustrates the effect of solution degradation in reducing the computation time from 511 s to 3.4 s for the 2000-bus system—a reduction of almost 99% at the expense of 4.45 % decrease in observability and 8.9 MW increase in imbalance. Solution degradation offers similar flexibility as the ϵ -constraint approach. This makes the hierarchical process more intuitive as preferences on objectives are assigned according to their importance. In contrast, the correct choice of weights in scalarization methods may not be readily determined unless multiple optimizations are solved. Furthermore, the reference solutions for Chebyshev and Benson’s approach have to be pre-determined, which may not be feasible during the fast islanding process. A drawback of the hierarchical technique is that the number of additional constraints imposed in each iteration increases as the number of objectives increases. However, this is of little concern as the number of objectives is limited to four in this paper. Overall, the hierarchical approach offers greater flexibility in designing islands in a very short period at the expense of non-optimal but acceptable solutions.
To further improve the solution time, the integrality constraints are relaxed. For example, when variables z i , j and w i , j are relaxed in the 200-bus system, binary solutions are promptly obtained. Similarly, z i , j is relaxed for the 500 and the 2000-bus systems. The computation times with these relaxations are given in Table 16.
Overall, the time from initiation to completion of the recovery process can be determined as follows. For Scenario 1, in the absence of any attack information, system operators may doubt the fidelity of the data depending on the evolution of steady-state failures, which may take dozens of minutes [46]. For Scenario 2, partial knowledge on compromised data may be obtained in sub-seconds, assuming a learned (data-driven) offline model is already available [14]. The time to solve the optimization problem developed in this paper is less than a second to a few seconds (from Section 7.5). Finally, assuming that the line open status signals are sent to the correct set of circuit breakers, it will take a few cycles (incorporating communication delays) for the circuit breakers to respond to the islanding commands.

7.6. Comparison of Multiple Solutions

Figure 13 demonstrates Pareto-optimal solutions for the 200-bus and the 500-bus systems. The approach introduced in this paper allows system operators to create islands considering a broad spectrum of choices, which affects the islands’ operation. For example, a loss of substantial MW flow disconnection negatively impacts the transient stability of the system, thereby increasing the chances of further outages. On the other hand, low observability increases dependency on pseudo-measurements and yields poor state estimation results. Furthermore, a higher load-generation imbalance results in load loss, large frequency excursions, and increased reliance on black-start units.

7.7. Limitations

The first limitation arises when attacks are distributed and span multiple regions. In such scenarios, isolating vulnerable PMUs in one single island is not desired. While such large-scale distributed attacks are rare due to the inherent security measures of the electric grid, they are not impossible given a large attacker budget. The developed method can be extended to create multiple smaller islands to isolate attacks. However, this approach comes at the expense of an increase in the number of binary variables, longer computation times, and difficulties in the coordination of multiple smaller islands. This work makes a practical assumption where different power system areas have different cyber security policies, and considers attacks against single cyber security architecture, thereby isolating all potential vulnerable nodes in a single island.
The second limitation arises when ample integration of renewables introduces new sets of dynamic stability constraints to the power system. We acknowledge that this limitation cannot be solely tackled by enclosing coherent synchronous generators in one island. Controlled islanding with renewables is a separate problem related to islanding itself and is currently outside the scope of this paper.
In the future, we will explore approximation algorithms [47] to further reduce the complexity of the optimization problem. These approximation techniques can help find near-optimal solutions and accelerate computation times when a prompt and reliable islanding solution is desired. Moreover, the set of candidate lines for controlled islanding depends on real-time system conditions and is not fixed. Additional studies leveraging the line topology status are needed to ensure that the line open signal is sent to the correct breakers during partitioning.

8. Conclusions

This paper presents controlled islanding methods that incorporate different degrees of uncertainty in PMU measurement. Uncertainties are considered under the lack of or partial information on the reliability of PMU measurements originating from sophisticated false data injection attacks. When attacks remain undetected, the impact of measurements in each island is minimized by creating islands that require a minimal number of PMU measurements for a state estimation solution. This allows system operators to allocate additional security to a minimum number of nodes on the network, thus improving recovery plans. When partial information on bad data is available, the impact is minimized by isolating vulnerable PMUs in a single island. This prevents malicious attacks from spreading to larger sections of the grid.
The major findings of this paper are summarized as follows.
  • Under complete attack uncertainty with different numbers of PMUs in the original system, it was observed that redundant PMUs played a major role in retaining more observable sections of the newly formed islands.
  • Under partial attack uncertainty, it was found that a smaller island was sufficient to isolate all vulnerable PMUs into a single region.
  • Various multi-objective optimization methods are compared based on the number of iterations, number of parameters, optimal solution, and the total run time. It was found that the hierarchical approach is particularly attractive in providing acceptable controlled islanding solutions incorporating objective priority and optimal solution degradation when considering multiple competing objectives.
  • It was observed that partitioning the power system into multiple smaller islands using the proposed approach created partitions with sufficient steady-state and transient stability margins and maximal observability.
  • Lastly, it was found that accurate islanding solutions were obtained when integral constraints on some binary variables were relaxed in the optimization problem and certain objective functions were converted into bounded constraints, thereby reducing computation time.
Our findings demonstrate that it is feasible to successfully limit the impact of bad PMU data while creating islands. The developed approach offers considerable flexibility to operators in designing islands that cater to a particular objective. The improvements in traditional islanding address post-incident analysis, enable quick recovery, and ensure continuity of grid operations. Such a consistent and collaborative approach will help contain threats and help power utilities minimize operational losses and financial threats in the face of contingencies. In the future, additional studies will be conducted to incorporate communication delays in circuit breaker operations, incorporate dynamic stability constraints due to renewables, and further improve the computation time of controlled islanding.

Author Contributions

Conceptualization, S.E.; methodology, S.B., S.E. and M.F.; software, S.B.; validation, S.B.; investigation, S.B. and S.E.; resources, S.E.; data curation, S.B.; writing—original draft preparation, S.B.; writing—review and editing, S.B., S.E. and M.F.; visualization, S.B.; supervision, S.E. and M.F.; project administration, S.E.; funding acquisition, S.E. All authors have read and agreed to the published version of the manuscript.

Funding

This work is supported by the National Science Foundation (NSF) Grant No.1600058. Financial support from the NSF under award CAREER CMMI-1750531 is gratefully acknowledged.

Institutional Review Board Statement

Not applicable.

Informed Consent Statement

Not applicable.

Data Availability Statement

Not applicable.

Acknowledgments

The authors would like to thank Brian K. Johnson, Rui Ma, Xiaochuan Luo, Slava Maslennikov and Paolo Serafini.

Conflicts of Interest

The authors declare no conflict of interest.

Abbreviations

The following abbreviations are used in this manuscript:
Z Set of transmission lines
Z S , Z S Set of lines with secure and non-secure PMU measurements, respectively
N Set of nodes
N s Set of source nodes
P i Net injection measurement at node i
P i , j Active powerflow measurement on line ( i , j )
H Matrix for topological observability
H S , H S Observability sub-matrices for secure and non-secure PMU measurements, respectively
G System gain matrix
Z Observability decision matrix
Z S , Z S Decision sub-matrix for lines with secure and non-secure measurements, respectively
hNumber of islands
n , l Number of nodes and lines, respectively
mNumber of PMU measurements
z i , j Line ( i , j ) connectivity status variable
x i , h Node i placement in island h status variable
w i , j , h Coupling variable between x i , h and z i , j
d i , j Line measurement status variable
v i , j Linearization variable z i , j
f i , j , h Network connectivity flow variable
S h Slack variable for load-generation balance
β Weight associated with non-secure PMU
γ i Weight associated with objective function
η Tolerance for optimal solution degradation
ϵ Tolerance for bounded constraint
F i * Reference solution for Chebyshev’s method
F i 0 Reference solution for Benson’s method

References

  1. Trodden, P.; Bukhsh, W.; Grothey, A.; McKinnon, K. MILP formulation for controlled islanding of power networks. Int. J. Elec. Power Energy Sys. 2013, 45, 501–508. [Google Scholar] [CrossRef] [Green Version]
  2. You, H.; Vittal, V.; Wang, X. Slow coherency-based islanding. IEEE Trans. Power Syst. 2004, 19, 483–491. [Google Scholar] [CrossRef]
  3. Ding, L.; Gonzalez-Longatt, F.M.; Wall, P.; Terzija, V. Two-step spectral clustering controlled islanding algorithm. IEEE Trans. Power Syst. 2012, 28, 75–84. [Google Scholar] [CrossRef] [Green Version]
  4. Li, J.; Liu, C.C.; Schneider, K.P. Controlled partitioning of a power network considering real and reactive power balance. IEEE Trans. Smart Grid 2010, 1, 261–269. [Google Scholar] [CrossRef]
  5. Trodden, P.; Bukhsh, W.; Grothey, A.; McKinnon, K. MILP islanding of power networks by bus splitting. In Proceedings of the 2012 IEEE Power and Energy Society General Meeting, San Diego, CA, USA, 22–26 July 2012; pp. 1–8. [Google Scholar]
  6. Kyriacou, A.; Demetriou, P.; Panayiotou, C.; Kyriakides, E. Controlled Islanding Solution for Large-Scale Power Systems. IEEE Trans. Power Syst. 2018, 33, 1591–1602. [Google Scholar] [CrossRef]
  7. Sun, K.; Zheng, D.Z.; Lu, Q. Splitting strategies for islanding operation of large-scale power systems using OBDD-based methods. IEEE Trans. Power Syst. 2003, 18, 912–923. [Google Scholar] [CrossRef] [Green Version]
  8. Xu, G.; Vittal, V. Slow coherency based cutset determination algorithm for large power systems. IEEE Trans. Power Syst. 2010, 25, 877–884. [Google Scholar] [CrossRef]
  9. Ding, T.; Sun, K.; Huang, C.; Bie, Z.; Li, F. Mixed-integer linear programming-based splitting strategies for power system islanding operation considering network connectivity. IEEE Syst. J. 2015, 12, 350–359. [Google Scholar] [CrossRef]
  10. Zhang, J.; Chu, Z.; Sankar, L.; Kosut, O. False data injection attacks on phasor measurements that bypass low-rank decomposition. In Proceedings of the 2017 IEEE International Conference on Smart Grid Communications (SmartGridComm), Dresden, Germany, 23–26 October 2017; pp. 96–101. [Google Scholar]
  11. Gao, P.; Wang, M.; Chow, J.H.; Ghiocel, S.G.; Fardanesh, B.; Stefopoulos, G.; Razanousky, M.P. Identification of successive “unobservable” cyber data attacks in power systems through matrix decomposition. IEEE Trans. Signal Process. 2016, 64, 5557–5570. [Google Scholar] [CrossRef]
  12. Zhang, Z.; Gong, S.; Dimitrovski, A.D.; Li, H. Time Synchronization Attack in Smart Grid: Impact and Analysis. IEEE Trans. Smart Grid 2013, 4, 87–98. [Google Scholar] [CrossRef]
  13. Hug, G.; Giampapa, J.A. Vulnerability assessment of AC state estimation with respect to false data injection cyber-attacks. IEEE Trans. Smart Grid 2012, 3, 1362–1370. [Google Scholar] [CrossRef] [Green Version]
  14. Musleh, A.S.; Chen, G.; Dong, Z.Y. A Survey on the Detection Algorithms for False Data Injection Attacks in Smart Grids. IEEE Trans. Smart Grid 2019. [Google Scholar] [CrossRef]
  15. Yuan, L.; Xing, W.; Chen, H.; Zang, B. Security Breaches as PMU Deviation: Detecting and Identifying Security Attacks Using Performance Counters. In Proceedings of the ACM SIGOPS Asia-Pacific Workshop on Systems, Shanghai, China, 11–12 July 2011. [Google Scholar]
  16. Liu, X.; Li, Z. Local Load Redistribution Attacks in Power Systems With Incomplete Network Information. IEEE Trans. Smart Grid 2014, 5, 1665–1676. [Google Scholar] [CrossRef]
  17. Che, L.; Liu, X.; Li, Z.; Wen, Y. False data injection attacks induced sequential outages in power systems. IEEE Trans. Power Syst. 2018, 34, 1513–1523. [Google Scholar] [CrossRef]
  18. Li, Z.; Shahidehpour, M.; Alabdulwahab, A.; Abusorrah, A. Bilevel Model for Analyzing Coordinated Cyber-Physical Attacks on Power Systems. IEEE Trans. Smart Grid 2016, 7, 2260–2272. [Google Scholar] [CrossRef]
  19. Deng, R.; Zhuang, P.; Liang, H. CCPA: Coordinated Cyber-Physical Attacks and Countermeasures in Smart Grid. IEEE Trans. Smart Grid 2017, 8, 2420–2430. [Google Scholar] [CrossRef]
  20. Bernstein, A.; Bienstock, D.; Hay, D.; Uzunoglu, M.; Zussman, G. Power grid vulnerability to geographically correlated failures—Analysis and control implications. In Proceedings of the IEEE INFOCOM Conference on Computer Communications, Toronto, ON, Canada, 27 April–2 May 2014; pp. 2634–2642. [Google Scholar]
  21. NERC. In Special Protection Systems (SPS)/Remedial Action Schemes (RAS): Assessment of Definition, Regional Practices, and Application of Related Standards; North American Electric Reliability Corporation: Atlanta, GA, USA, 2013.
  22. Basumallik, S.; Eftekharnejad, S.; Johnson, B.K. The impact of false data injection attacks against remedial action schemes. Int. J. Electr. Power Energy Syst. 2020, 123, 106225. [Google Scholar] [CrossRef]
  23. Wei, F.; Wan, Z.; He, H. Cyber-Attack Recovery Strategy for Smart Grid Based on Deep Reinforcement Learning. IEEE Trans. Smart Grid 2019, 11, 2476–2486. [Google Scholar] [CrossRef]
  24. Kushal, T.R.B.; Lai, K.; Illindala, M.S. Risk-based mitigation of load curtailment cyber attack using intelligent agents in a shipboard power system. IEEE Trans. Smart Grid 2018, 10, 4741–4750. [Google Scholar] [CrossRef]
  25. Zhao, J.; Mili, L.; Wang, M. A generalized false data injection attack against power system nonlinear state estimator and countermeasures. IEEE Trans. Power Syst. 2018, 33, 4868–4877. [Google Scholar] [CrossRef]
  26. Huang, L.; Sun, Y.; Xu, J.; Gao, W.; Zhang, J.; Wu, Z. Optimal PMU placement considering controlled islanding of power system. IEEE Trans. Power Syst. 2013, 29, 742–755. [Google Scholar] [CrossRef]
  27. Monticelli, A. State Estimation in Electric Power Systems: A Generalized Approach; Springer Science & Business Media: Berlin/Heidelberg, Germany, 2012. [Google Scholar]
  28. Fazel, S.M. Matrix Rank Minimization with Applications. Ph.D. Thesis, Stanford University, Stanford, CA, USA, 2003. [Google Scholar]
  29. Gibert, D.; Mateu, C.; Planes, J. The rise of machine learning for detection and classification of malware: Research developments, trends and challenges. J. Netw. Comput. Appl. 2020, 153, 102526. [Google Scholar] [CrossRef]
  30. Esmalifalak, M.; Liu, L.; Nguyen, N.; Zheng, R.; Han, Z. Detecting Stealthy False Data Injection Using Machine Learning in Smart Grid. IEEE Syst. J. 2017, 11, 1644–1652. [Google Scholar] [CrossRef]
  31. Bundy, A.; Wallen, L. Breadth-first search. In Catalogue of Artificial Intelligence Tools; Springer: Berlin/Heidelberg, Germany, 1984; p. 13. [Google Scholar]
  32. Basumallik, S.; Eftekharnejad, S. Dynamic Islanding in Power Systems Based on Real-Time Operating Conditions. In Proceedings of the 2019 North American Power Symposium (NAPS), Wichita, KS, USA, 13–15 October 2019; pp. 1–6. [Google Scholar]
  33. Chow, J.H.; Peponides, G.; Kokotovic, P.; Avramovic, B.; Winkelman, J. Time-Scale Modeling of Dynamic Networks with Applications to Power Systems; Springer: Berlin/Heidelberg, Germany, 1982; Volume 46. [Google Scholar]
  34. Antunes, C.H.; Alves, M.J.; Clímaco, J. Multiobjective Linear and Integer Programming; Springer: Berlin/Heidelberg, Germany, 2016. [Google Scholar]
  35. Cohon, J.L. Multiobjective Programming and Planning; Courier Corporation: Chelmsford, MA, USA, 2004; Volume 140. [Google Scholar]
  36. Mitchell, J.E. Branch-and-cut algorithms for combinatorial optimization problems. In Handbook of Applied Optimization; 2002; Volume 1, pp. 65–77. Available online: https://homes.di.unimi.it/righini/Didattica/ComplementiRicercaOperativa/MaterialeCRO/2000%20-%20Mitchell%20-%20branch-and-cut.pdf (accessed on 27 June 2020).
  37. Grotschel, M. Geometric Algorithms and Combinatorial Optimization; Springer Science & Business Media: Berlin/Heidelberg, Germany, 1988. [Google Scholar]
  38. Birchfield, A.B.; Xu, T.; Gegner, K.M.; Shetye, K.S.; Overbye, T.J. Grid Structural Characteristics as Validation Criteria for Synthetic Networks. IEEE Trans. Power Syst. 2017, 32, 3258–3265. [Google Scholar] [CrossRef]
  39. PJM. Phasor Measurement Unit (PMU) Placement Plan in RTEP Planning Process 2020. Available online: https://www.pjm.com/-/media/committees-groups/subcommittees/sos/2020/20200713/20200713-item-09-phasor-measurement-unit-placement-plan-in-rtep-planning-process.ashx;asthisisanonlineppt (accessed on 10 February 2021).
  40. Melhem, Z. Electricity Transmission, Distribution and Storage Systems; Woodhead Publishing Series in Energy; Woodhead Publishing: Sawston, UK, 2013. [Google Scholar]
  41. U.S. Department of Energy. Synchrophasor Technologies and their Deployment in the Recovery Act Smart Grid Programs, American Recovery and Reinvestment Act of 2009. 2013. Available online: https://www.energy.gov/oe/downloads/synchrophasor-technologies-and-their-deployment-recovery-act-smart-grid-programs-august (accessed on 15 January 2021).
  42. Xu, B.; Abur, A. Optimal Placement of Phasor Measurement Units for State Estimation; Final Project Report; Power Systems Engineering Research Center: Tempe, AZ, USA, 2005; pp. 5–58. [Google Scholar]
  43. Lu, C.; Wang, Z.; Ma, M.; Shen, R.; Yu, Y. An optimal PMU placement with reliable zero injection observation. IEEE Access 2018, 6, 54417–54426. [Google Scholar] [CrossRef]
  44. Kundur, P. Power system stability. In Power System Stability and Control; John Wiley & Sons: Hoboken, NJ, USA, 2007; p. 7-1. [Google Scholar]
  45. Instruction Manuals. SEL-421 Relay 2001. Available online: https://selinc.com/literature/instruction-manuals/?title=421 (accessed on 15 March 2019).
  46. Schäfer, B.; Witthaut, D.; Timme, M.; Latora, V. Dynamically induced cascading failures in power grids. Nat. Commun. 2018, 9, 1975. [Google Scholar] [CrossRef]
  47. Vazirani, V.V. Approximation Algorithms; Springer Science & Business Media: Berlin/Heidelberg, Germany, 2013. [Google Scholar]
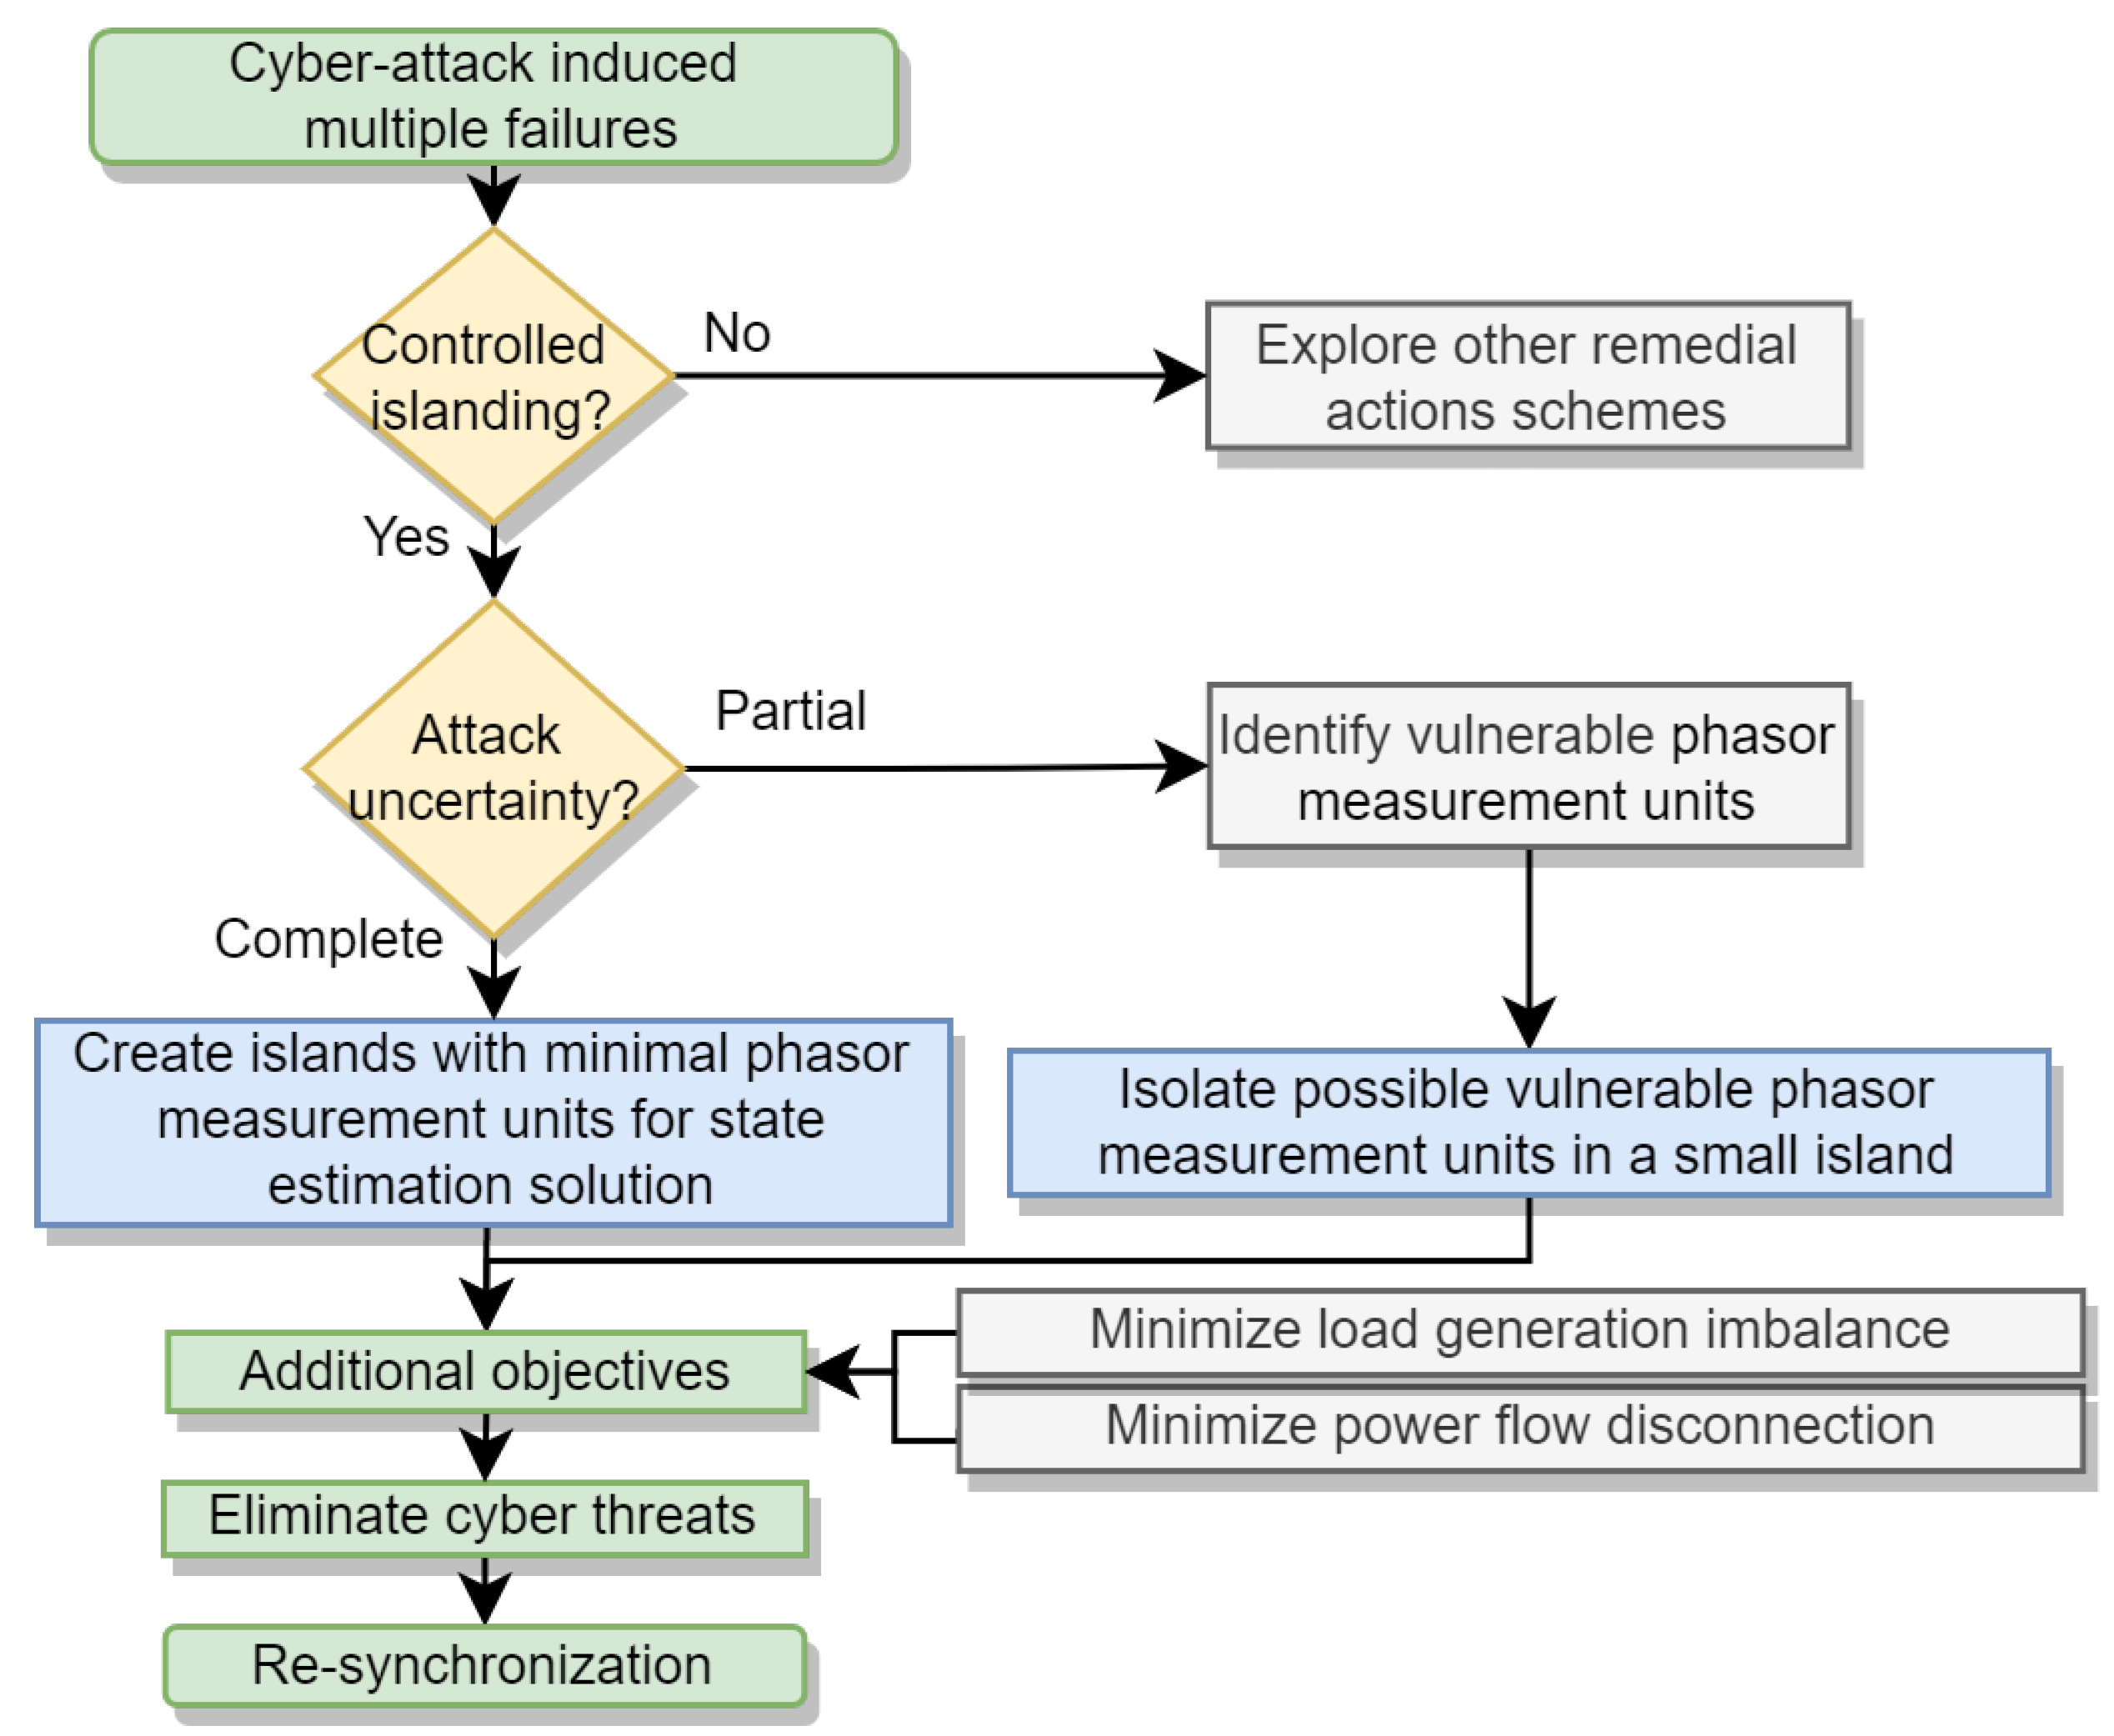
Figure 1. The developed controlled islanding process for system recovery from a successful cyber attack under PMU measurement uncertainty.
Energies 15 05723 g001
Figure 2. Scenario 2: (a) PMUs (shaded nodes) identified as untrustworthy, (b) 1-hop and (c) 2-hop distance neighbors. All PMUs at R-hop distance are assumed to be vulnerable and isolated in a small island. Additional nodes are added during the optimization process to maintain island stability and observability.
Energies 15 05723 g002
Figure 3. Scenario 1: Maximizing island observability with the minimum number of non-secure measurements—single observable system with two islands.
Energies 15 05723 g003
Figure 4. Scenario 1: Maximizing island observability with minimum non-secure measurements—double observable system with two islands.
Energies 15 05723 g004
Figure 5. Partition of the 200-bus system into two islands corresponding to row 1 of Table 10.
Energies 15 05723 g005
Figure 6. Partition of the 200-bus system into four islands corresponding to Scenario 2.
Energies 15 05723 g006
Figure 7. Scenario 1—controlled islanding in the 200-bus system at t = 2 s, corresponding to hierarchical approach. Relative rotor angles for all generators for (a) island 1 and (b) island 2, (c) frequency, and (d) p.u. bus voltages for all buses in the system. TSI = 75.71.
Energies 15 05723 g007
Figure 8. Scenario 1—controlled islanding in the 500-bus system at t = 2 s, corresponding to hierarchical approach. Relative rotor angles for all generators for (a) island 1 and (b) island 2, (c) Frequency, and (d) p.u. bus voltages ( 345 kV buses only). TSI = 72.38.
Energies 15 05723 g008
Figure 9. Scenario 2—controlled islanding in 200-bus system at t = 2 s, corresponding to weighted-sum, Chebyshev and, Benson’s approaches in Table 10. Relative rotor angles for all generators for (a) island 1, and (b) island 2, (c) frequency, (d) p.u. bus voltages for all buses in the system. TSI = 76.55.
Energies 15 05723 g009
Figure 10. Scenario 2—500-bus-controlled islanding at t = 2 s, corresponding to weighted-sum approach in Table 11. (a) Relative rotor angles for all generators in Island 1, (b) Relative rotor angles for all generators in Island 2, (c) Frequency, (d) p.u. bus voltages (≥345 kV buses only). TSI = 62.16.
Energies 15 05723 g010
Figure 11. Scenario 2—200-bus-controlled islanding at t = 2 s into 4 islands, corresponding to Figure 6. (a) Relative rotor angles for all generators in Island 1, (b) Relative rotor angles for all generators in Island 2, (c) Relative rotor angles for Island 3, (d) Relative rotor angles for Island 4. TSI = 76.38.
Energies 15 05723 g011
Figure 12. Scenario 2—200-bus-controlled islanding at t = 2 s into 4 islands, corresponding to Figure 6. (a) Frequency of all generators, (b) voltage of all buses without reactive power correction, (c) buses with low voltages, (d) voltage of all buses with reactive power correction.
Energies 15 05723 g012
Figure 13. Pareto-optimal solutions: rank vs. MW line flow disconnection for (a) 200-bus, (b) 500-bus, load generation imbalance vs. MW line flow disconnection for (c) 200-bus, (d) 500-bus, and rank vs. size of vulnerable island for (e) 200-bus, (f) 500-bus.
Energies 15 05723 g013
Table 1. Multi-objective Optimization Solution Methods.
SolutionFormulation
Hierarchical minimize F i i = 1 , , 4 subject to F j F j * + η j j = 1 , , i 1
Weighted-sum minimize i = 1 4 γ i F i
ϵ -constraint minimize i γ i F i + j ρ j F j i j subject to F j ϵ j j = 1 , , i 1 , i + 1 , 4
Weighted
Chebyshev
minimize b + j = 1 4 ρ j F j subject to γ i [ F i * F i ] b i = 1 , , 4
Benson minimize i = 1 4 b i subject to F i 0 F i = b i i = 1 , , 4
Table 2. Details of the Studied Test Cases.
SystemLoadGen# Secure# Non-Secure# Non-Secure
(MW)(MW)PMUsPMUs (Obs = 1)PMUs (Obs = 2)
200175017652546130
5007750783263176394
200067,10968,7281325891247
Table 3. Scalarization Parameters.
System γ 1 γ 2 γ 3 γ 4 ϵ load ϵ size
2000.11111040
5000.011113050
20000.010.11150350
Table 4. Reference Solutions for Chebyshev’s Approach.
SystemRankSize ( G )   * Imbalance (MW)Flow Out (MW)
20041229028.03
50010008010400.0
2000423230305373.29
* Size ( G ) refers to the size of the island with vulnerable PMUs.
Table 5. Reference Solutions for Benson’s Approach.
SystemRankSize ( G )Imbalance (MW)Flow Out (MW)
200400502050
50010002003502000
20004000400207000
Table 6. Hierarchical optimization for the 200-bus system: 4 islands.
Optimal Solution [Priority, Degradation]
Rank% Meas RetainedImbalance (MW)Flow Out (MW)
(Non-Secure) | S 1 | + | S 2 | + | S 3 | + | S 4 |
173 [3, 10]100 [4, 0]445.48 [2, 0]294.15 [1, 0]
178 [1, 10]100 [4, 0]675.52 [2, 0]428.09 [3, 0]
163 [3, 10]93.33 [4, 0]17.57 [1, 0]527.98 [2, 0]
Table 7. Scenario 2: Hierarchical optimization for a 200-bus system.
Optimal Solution [Priority, Degradation]
RankSize ( G )Imbalance (MW)Flow Out (MW)Time (s)
| S 1 | + | S 2 |
196 [3, 0]42 [2, 0]9.80 [4, 0]28.03 [1, 0]0.27
197 [3, 0]29 [2, 0]32.3 [4, 0]54.16 [1, 50]0.36
197 [3, 0]38 [2, 0]0.07 [4, 10]35.76 [1, 50]0.69
Table 8. Scenario 2: Hierarchical Optimization for a 500-bus system.
Optimal Solution [Priority, Degradation]
RankSize ( G )Imbalance (MW)Flow Out (MW)Time (s)
| S 1 | + | S 2 |
499 [3, 0]107 [2, 0]649.16 [4, 0]649.16 [1, 0]0.19
500 [1, 0]196 [3, 0]1610.0 [4, 0]1465.1 [2, 0]0.30
498 [2, 0]11 [1, 0]124.22 [4, 0]867.36 [3, 0]0.15
Table 9. Scenario 2: Hierarchical Optimization for a 2000-bus system.
Optimal Solution [Priority, Degradation]
RankSize ( G )Imbalance (MW)Flow Out (MW)Time (s)
| S 1 | + | S 2 |
1979 [4, 0]312 [1, 0]370.5 [2, 0]8519.1 [3, 0]511.5
1980 [4, 0]352 [1, 40]0.01 [2, 0]5650.4 [3, 0]131
1891 [4, 0]351 [1, 40]8.9 [2, 10]5526.9 [3, 0]3.4
Table 10. Scenario 2: Scalarization Results for the 200-Bus System.
ScalarizationRankSize ( G )Imbalance (MW)Flow Out (MW)
| S 1 | + | S 2 |
Weighted-Sum197380.0735.76
ϵ -Constraint196392.9334.98
Chebyshev197380.0735.76
Benson197380.0735.76
Table 11. Scenario 2: Scalarization Results for the 500-Bus System.
ScalarizationRankSize ( G )Imbalance (MW)Flow Out (MW)
| S 1 | + | S 2 |
Weighted-Sum4991113.7850.82
ϵ -Constraint49811612.69847.07
Chebyshev49811326.69833.83
Benson4991113.7850.82
Table 12. Scenario 2: Scalarization Results for the 2000-Bus System.
ScalarizationRankSize ( G )Imbalance (MW)Flow Out (MW)
| S 1 | + | S 2 |
Weighted-Sum19823752.05470.56
ϵ -Constraint198235024.725513.70
Chebyshev19793401.855727.20
Benson19803530.025501.86
Table 13. Effect of attack radius R on the size of vulnerable islands: 200-bus system.
Optimal Solution [Priority, Degradation]
RRankSize ( G )Imbalance (MW)Flow Out (MW)Time (s)
| S 1 | + | S 2 |
3198663.94107.930.71
4198851.82108.990.57
51961032.78126.120.42
619611011.96116.930.33
71961208.74257.320.27
Table 14. Effect of R on size of vulnerable island: 500-bus system.
Optimal Solution [Priority, Degradation]
RRankSize ( G )Imbalance (MW)Flow Out (MW)Time (s)
| S 1 | + | S 2 |
25007153.28385.913.31
34972065.64378.621.19
44982544.02449.395.16
550025819.961266.381.68
Table 15. Transient Stability Index.
SystemScenario 1Scenario 2
HierarchicalWeighted
Sum
ϵ -
Constraint
ChebyshevBenson
200-bus75.7176.5574.4776.5576.55
500-bus72.3862.1658.5961.2062.14
Table 16. Simulation Time (s) with and without Relaxation.
System200-bus500-bus2000-bus
RelaxationNoYesNoYesNoYes
Weighted Sum0.070.050.430.2169.960.70
ϵ -Constraint0.000.0013.010.6010.001.58
Chebyshev0.150.001.680.44148.822.85
Benson0.150.0331.610.2814.646.72
Publisher’s Note: MDPI stays neutral with regard to jurisdictional claims in published maps and institutional affiliations.