Abstract
Numerical simulation is an effective tool for the thermal management of propulsion systems. Moreover, it contributes to the design and performance assessment of solar greenhouses for mushroom ventilation. Because the planning and design of the clustered solar greenhouse are still undiscovered, this study has developed a 3-D mathematical model suitable for a large-scale park of mushroom solar greenhouses based on computational fluid dynamics (CFD) theory. The effects of the orientation arrangement, horizontal spacing, vertical spacing of the cultivation racks, and the building distance between adjacent greenhouses on the ventilation performance were analyzed. The numerical simulation showed good agreement with the experimental measurement. The CFD results indicated that the reasonable layout of cultivation racks in mushroom solar greenhouses is a north-south arrangement. The horizontal spacing of cultivation racks has a significant influence on the wind speed and cooling rate, and the optimal spacing is 0.8 m. The overall height of the cultivation racks has little effect on the ventilation performance. Nevertheless, the vertical spacing between cultivation rack layers has a remarkable effect, and the optimal vertical spacing is 0.29 m. Reducing the building distance between the two adjacent greenhouses within a certain range helps increase the ventilation efficiency, leading to an increase in land utilization in the greenhouse park. The optimal building distance between the adjacent greenhouses is 10 m. The research results can provide theoretical guidance for improving the production quality and land utilization of mushroom facilities.
1. Introduction
Propulsion systems are important, widespread, and reliable devices in many fields such as aircraft engines, rocket engines, and scramjets. To improve the thermal management and flow control, numerical simulation has been employed as an effective method for the design and performance assessment. Computational fluid dynamics (CFD) plays an important role in the numerical simulation and is widely used in the field of engineering design, such as for solar greenhouse [1,2,3]. The solar greenhouse is a unique and distinctive greenhouse type in northern China, which does not need to consume fuel for heating in the production process [4,5]. It is a type of high-efficiency and energy-saving horticultural facility [6]. Even in the cold season, the solar greenhouse can only rely on sunlight to meet the needs of crop growth due to the conversion of heat energy to maintain the indoor temperature [7,8,9]. The production and consumption of edible fungi in the world is very large [10]. In recent years, the planting area and output of mushrooms have shown a multiple growth. It is worth mentioning that China’s annual output of mushrooms can reach more than 70% of the global total. This is mainly attributed to the rapid development of the special solar greenhouse for mushroom production [11]. Although the heat flux in the greenhouse mostly comes from solar radiation and energy storage during the day, heating systems are used to deal with extreme weather in the design of the greenhouse. Zheng et al. [12] investigated the thermal performance of various nanofluids in heat exchangers. The tested optimal Fe3O4-water nanofluid was used as a heat transfer medium in the heating system. The results provided an empirical formula of Nusselt numbers for adjustment strategies under different working conditions. The effects of various surfactants on the stability and thermophysical properties of nanofluids were investigated experimentally after the preparation of the nanofluids [13], and the thermal efficiencies of different nanofluids were analyzed in a plate heat exchanger [14], a pipe [15], and an indoor electric heater under a magnetic field [16]. In order to ensure the high yield and high quality of crops in solar greenhouses, it is necessary to properly control the main environmental factors, such as temperature, humidity, and CO2 concentration [17,18]. The most practical and most effective way to control temperature is ventilation. Therefore, the planning and design of the mushroom solar greenhouse can be carried out according to ventilation performance. As mushrooms are placed on the cultivation rack in the form of fungus sticks, the layout of the cultivation racks is extremely important. However, the existing construction principle for a clustered greenhouse park is based on the effective light interception, which does not fit into the weak-light habit of mushroom.
The ventilation plays a very important role in the greenhouse management, directly affecting the yield of mushrooms. A reasonable ventilation design of the mushroom solar greenhouse can not only regulate the internal environment of the greenhouse, but can also improve the efficiency of energy utilization [19]. Firstly, the ventilation can eliminate excess heat inside the greenhouse to the outside environment, so as to reduce the internal humidity and harmful gases [20]. Secondly, due to the external and internal air circulation, the temperature distribution in the greenhouse will become more uniform. The elimination of extreme temperature helps adjust the micro-environment to avoid disease. Thirdly, the air exchange can also accelerate the airflow, which is conducive to the growth and development of mushrooms [21]. Bournet et al. [22] performed a CFD simulation to investigate the vent configuration in the glass greenhouse. Villagrán et al. [23] studied the effect of roof vents on the ventilation performance of multi-span greenhouses. He et al. [24] evaluated the ventilation characteristics of a plastic greenhouse. Bartzanas et al. [25] investigated the natural ventilation in an arched greenhouse. Pakari and Ghani [26] analyzed the airflow distribution in a greenhouse equipped with wind towers. Zhang et al. [27] assessed the impacts of vent structure in Chinese solar greenhouses. Nevertheless, there are few studies on the ventilation of mushroom solar greenhouses. The mushroom solar greenhouse has high requirements regarding temperature, humidity, and other environmental factors. In general, the research results of a vegetable greenhouse cannot be copied to mushroom solar greenhouses. Therefore, there is an urgent need to fill that gap.
Mushrooms are produced in the form of fungus sticks in cultivation racks. Therefore, the ventilation is more complicated than soil cultivation. The uneven airflow distribution may reduce mushroom growth speed, so the greenhouse ventilation for mushroom fungus sticks plays a significant role [28]. Although scholars have carried out some research on greenhouse ventilation, the reported literature mostly takes the empty greenhouse as the research object. Han et al. [29] developed a ventilation equation for a mushroom greenhouse based on functional heat balance, and the air vents were designed to improve the temperature distribution. Zhang et al. [30] proposed a method to install ventilation pipes on the cultivation racks to improve the ventilation performance. Beak et al. [31] used CFD to simulate the effect of airflow pattern on the crop growth in the cultivation racks. Kim et al. [32] pointed out that the increase of the number of cultivation racks would significantly increase the airflow resistance and thus reduce the uniformity of temperature and humidity in the greenhouse. However, there are essential differences between vegetable and mushroom plant in solar greenhouses. In fact, the layout of cultivation racks in planting vegetables cannot meet the efficient production of mushrooms because the fungus will produce a significant amount of heat energy. It is important to ensure a uniform temperature distribution in greenhouses for mushroom cultivation [33]. In the production practice, it is found that the ventilation ability of fungus sticks is not strong due to the too-small spacing between the layers of the cultivation racks, resulting in an excessively high temperature to the disadvantage of mushroom growth. Moreover, in the planning and design of large-scale greenhouse parks, the building distance between adjacent greenhouses also has a significant impact on the ventilation. However, little attention has been given to the clustered solar greenhouse.
In the present research, a mushroom solar greenhouse in China is used as the study object, and the ventilation performance is studied by CFD numerical simulation. Through analyzing the influence of the important parameters of orientation arrangement, horizontal spacing, vertical spacing of the cultivation racks, and the building distance between adjacent greenhouses, the optimal arrangement scheme of cultivation racks and the layout strategy of a clustered greenhouse park can be obtained. The results can provide important theoretical guidance for improving the production quality and land utilization rate of mushroom facilities and provide key technical support for the system design of mushroom solar greenhouses.
2. Theories and Methods
2.1. The Experimental Greenhouse
As shown in Figure 1, the greenhouse used in the experiment is the third generation of energy-saving mushroom solar greenhouse located in the Shenyang area (latitude: 41°49′ N, longitude: 123°34′ E, altitude: 42 m). The orientation is 7° from south to west. The east-west length is 60 m. The span is 10 m. The ridge height is 6 m. The north wall height is 4 m. The horizontal projection length of the rear slope is 1.9 m. The thicknesses of the two side walls and the back wall are both 0.5 m. The outside of each wall is installed with a 0.1 m EPS insulation layer., and the front roof of the greenhouse is 0.15 mm PO film.
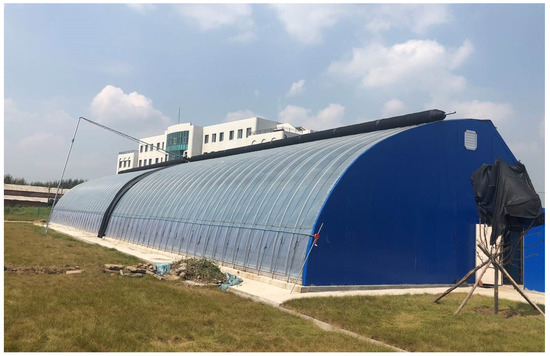
Figure 1.
Schematic diagram of the mushroom solar greenhouse.
Under continuous sunny weather conditions, the environmental monitoring station based on the internet of things platform is used to measure the external environment, including temperature, humidity, solar radiation, wind speed, and wind direction. These measured parameters act as the initial and boundary conditions of the CFD model. The temperature and humidity measurement instrument in the greenhouse is the RC-4HC hygrothermograph (temperature precision: ±0.5 °C, temperature range: −40 °C~85 °C, humidity precision: ±3% RH, humidity range: 0%~100% RH). The device uses the Em50/R/G data collector as the core system. Sensors measuring different environmental parameters are integrated into the same collector for data collection, and the data are recorded every 10 min. The distribution of measuring points in the greenhouse is as follows: The wind speed measuring points from the north to the south are 0.5 m, 3.5 m, and 6.5 m away from the front foot, and there are four measuring points in total. The data collection interval is set at 10 min. The soil measurement points are arranged at a greenhouse soil depth of 0.1 m plane and are 2 m, 5 m, and 8 m away from the front foot, respectively. There are nine air temperature and humidity measuring points, distributed on four different planes, which are 2 m, 5 m, and 7 m away from the front roof, and the measuring planes are 1 m, 3 m, 5 m, and 6 m away from the ground. The time interval of data collection is 10 min. The temperature and humidity sensors, positioned 10 cm below the soil, are numbered A1–A3 order. Similarly, the height of 1 m is numbered A4–A6. The height of 3 m is numbered A7–A9. The height of 5 m is numbered A10 and A11, and the height of 6 m is numbered A12. The specific arrangement of measuring points is shown in Figure 2.
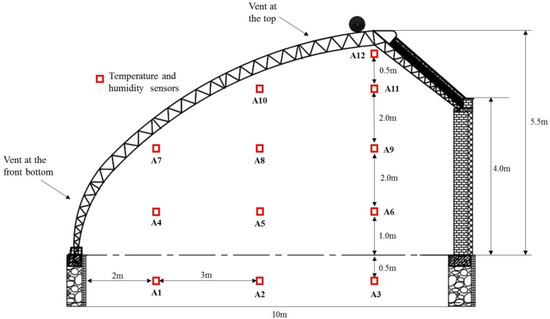
Figure 2.
Distribution of measuring points in the experimental testing.
2.2. Geometry Model and Meshing
As shown in Figure 3a, the 3-D geometry model is built according to the actual structure parameters of a mushroom solar greenhouse. As displayed in Figure 3b, the computational domain is divided by an unstructured hexahedral grid, and the size threshold is set as 25 mm. Moreover, grid refinement is carried out for the vents of the solar greenhouse, where the threshold is set as 3 mm. The mesh quality is controlled based on the mesh distortion standard. The maximum distortion range is 0.42~0.66. The weight is 0.24. The mean value is 0.52, and the standard deviation is 0.07. The mesh number of each model ranges from 4.68 × 10⁵ to 4.77 × 10⁵. According to the verification of mesh independence and maximum deformation, the numerical simulation requirements can be achieved.
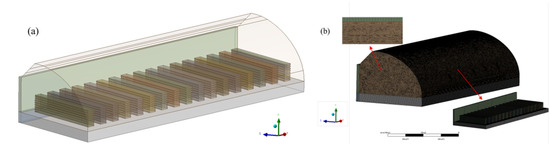
Figure 3.
Geometry and grid model of the mushroom solar greenhouse: (a) geometric configuration; (b) grid division.
2.3. Governing Equations
The fluid dynamics mainly follow the mass conservation equation, energy conservation equation, and momentum conservation equation. The finite volume method is used for the numerical simulation of the mushroom solar greenhouse. The computational domain is divided into a finite number of single, small discretization units to solve control equations. By this means, the physical parameters of each node can be obtained to effectively analyze the fluid flow. The mass conservation equation represents the volume and mass changes caused by the density changes of substances in unit space in unit time, and its expression is as follows:
where is the fluid density (kg·m−3), is the time (s), and is the velocity vector.
The momentum conservation equation is the accumulated amount of all external forces acting on the computing unit in time, namely, the momentum changes of the computing unit. The expression is as follows:
where is the pressure, is the stress tensor, and is the gravity acceleration.
The energy conservation equation is the spatial accumulation of the resultant force on the computing unit, namely, the energy change of the computing unit. The expression is as follows:
where is the flow energy, is the effective conductivity, represents the temperature, is the sensible enthalpy, is the effective viscosity shear, and is the diffusion flux of species.
The discrete coordinate (DO) model can be directly applied to transparent, translucent, and opaque optical media such as air, film, glass, and soil surface. It has been used in many climate models of greenhouses [34]. In this numerical simulation, the DO model is employed to calculate the radiation heat flux in several directions.
In order to simulate the internal environment in solar greenhouses, different turbulence models have been compared [35]. The results indicate that the standard k-ε turbulence model has the highest prediction accuracy. Therefore, the standard k-ɛ turbulence model is selected in this research, and the expressions of the k equation and ɛ equation are as follows:
where is the turbulence kinetic energy, is the dissipation rate of turbulence kinetic energy, is the velocity vector in Cartesian coordinates, is the eddy viscosity, and and are the turbulent Prandtl numbers; their values are and , respectively. and are the model courants, and their values are and , respectively. is the generation of due to mean velocity gradients, is the generation of due to buoyancy, and is the contribution of fluctuating dilation in compressible turbulence to overall dissipation rate.
2.4. Numerical Details
In summer, the south wind is dominant in Shenyang, China. Therefore, the south wind direction is set as 0° angle, and the wind speed is set as 5 m/s according to the actual situation. The airflow in the greenhouse is very complicated and not only has a large range but also produces many eddy currents and a large Reynolds coefficient. In the established model, the east, west, and north sides of the greenhouse are set as opaque wall boundaries, while the south roof is defined as a translucent boundary. The physical parameters of soil, envelope, and air in the numerical model are shown in Table 1.

Table 1.
Material property parameters in the mushroom solar greenhouse.
The 3-D transient analytical solution is calculated in ANSYS FLUENT. The discrete format is the second-order upwind format, and the semi-implicit method for the pressure linked equation (SIMPLE) algorithm is used as a means of pressure and velocity correction. The absolute convergence criterion is 10−6 for the energy equation, 10−3 for the mass and momentum equation, and 10−4 for the other equations. The report function is used to calculate the ventilation cooling efficiency and wind speed.
2.5. Experimental Verification
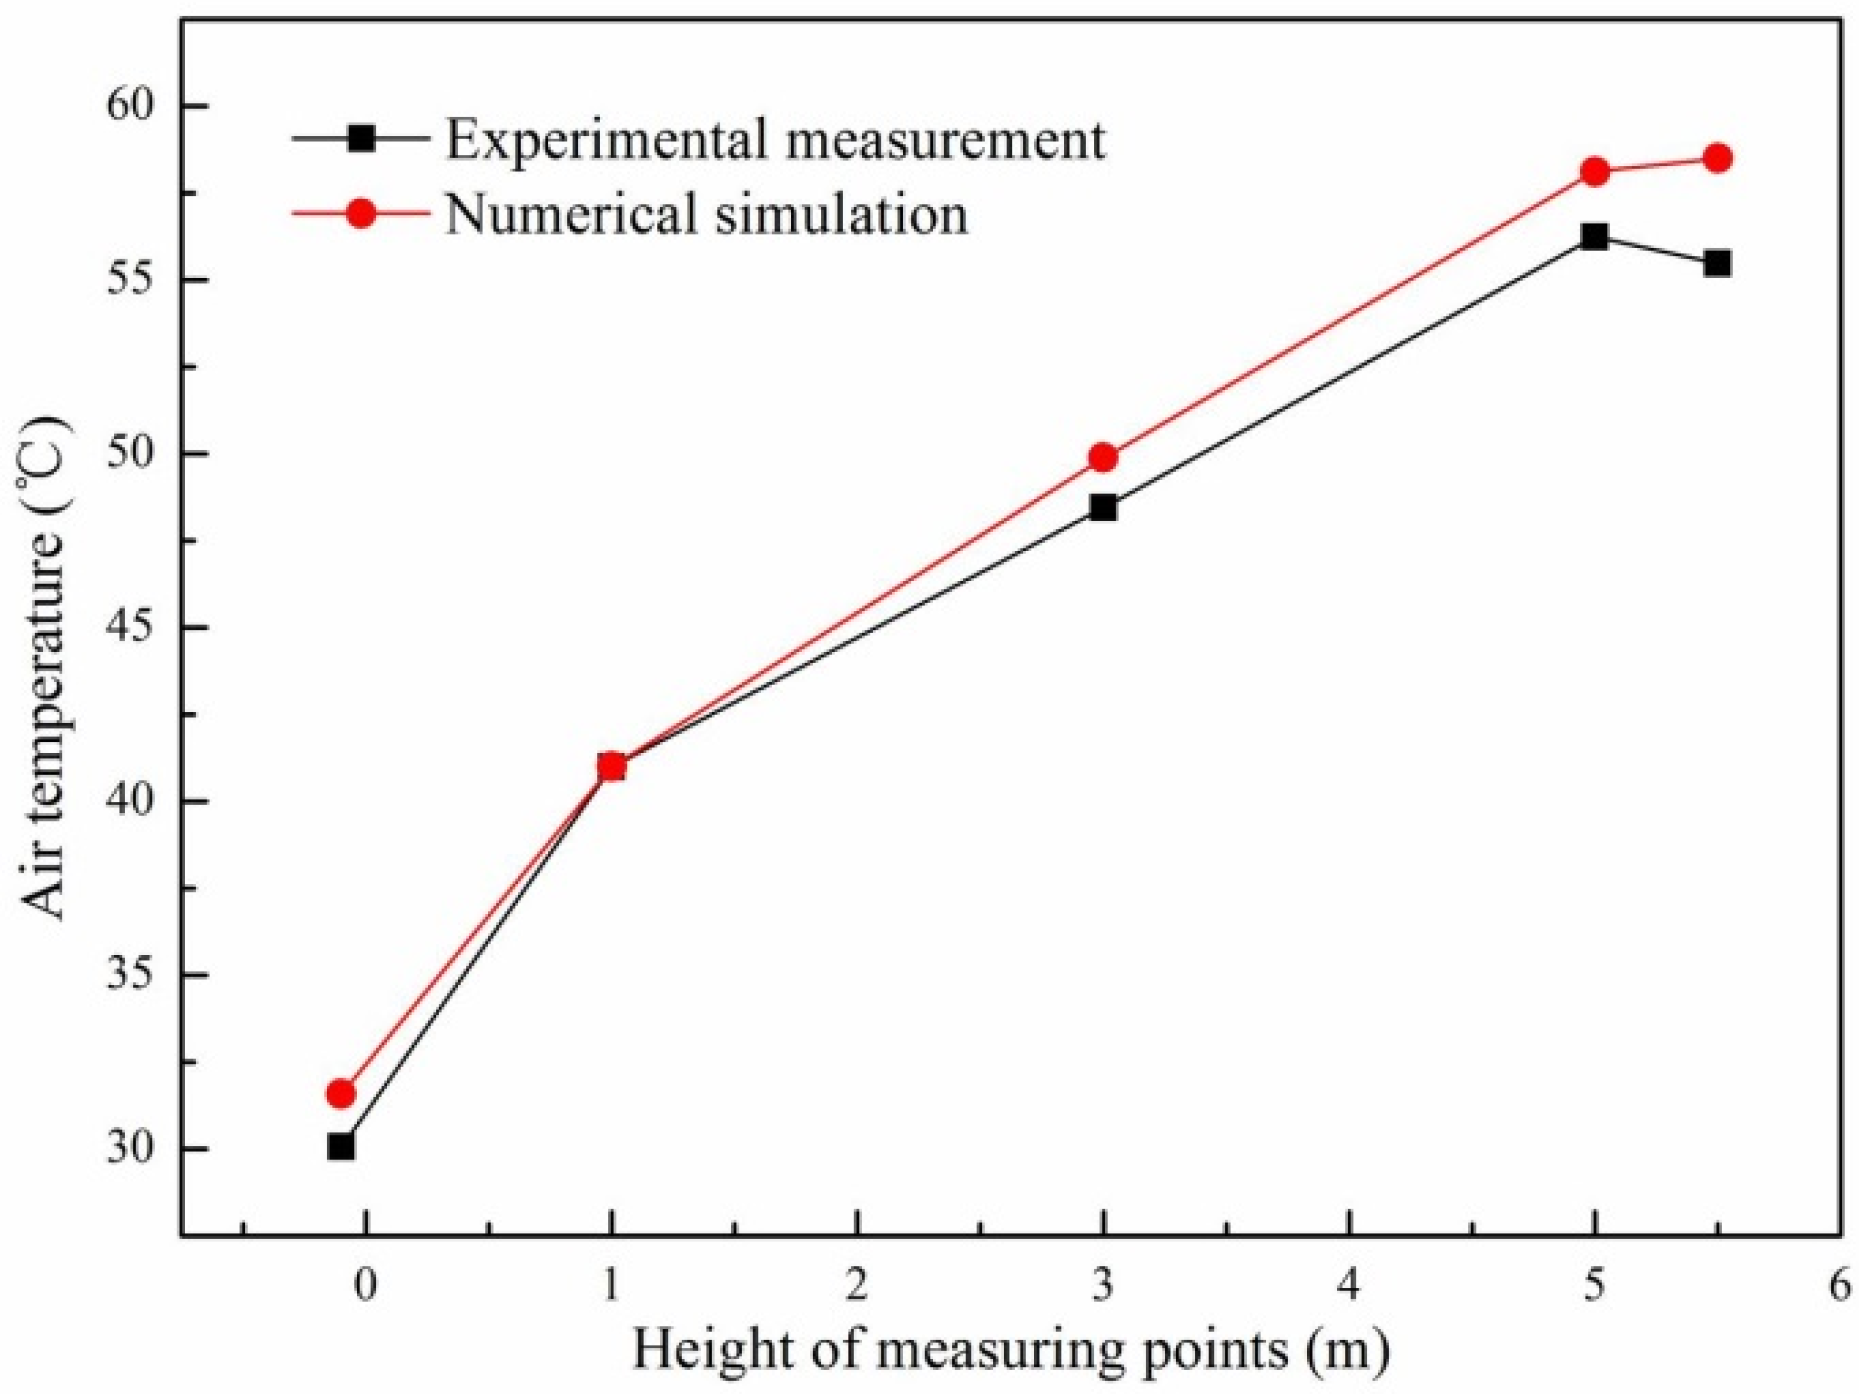
The CFD simulation results are compared with the experimental measurements to verify the prediction accuracy of the established model. As shown in Figure 4, the comparison of the measuring points at different heights is basically consistent, which indicates that the numerical simulation shows good agreement with the experiment. The maximum relative error between the average simulated and the measured values is at 5.5 m from the ground. Because this height is relatively high in the greenhouse, it is easy for there to be gaps in the film in the ventilation position near the top. Therefore, the temperature at the measurement point A12 is affected by the airflow outside the greenhouse, and the relative error is 5.42%. In the soil at the height of −0.1 m, the difference between the average simulated and measured values is 0.94 °C, with a relative error of 5.08%. This is because the front foot and top vents of the greenhouse are easily affected by external airflow.
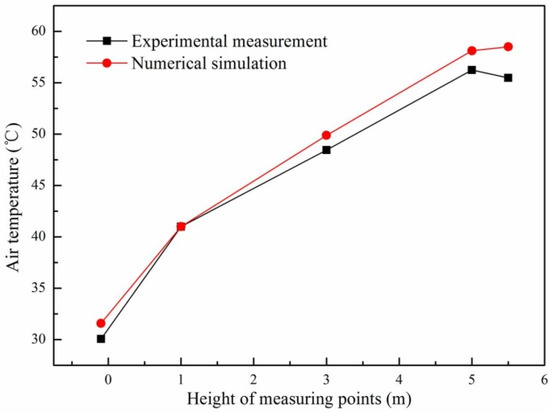
Figure 4.
Comparison between the numerical simulation and experimental measurement.
3. Results
3.1. Effect of Orientation Arrangement of Cultivation Racks
A model is established for two arrangements (i.e., north-south vertical arrangement and east-west horizontal arrangement) of cultivation racks frequently used by farmers in production practice, and the influence of different orientation modes on the ventilation performance of fungus sticks is analyzed. In the premise of ensuring the same fungus sticks, the specific parameters are listed in Table 2.
Table 2.
Parameters of cultivation racks in the orientation arrangement investigation.
Through numerical simulation methods, Figure 5 demonstrates the distribution of wind speed at different heights (i.e., 0.5 m, 1 m, 1.5 m) of the mushroom solar greenhouse under the two orientation modes of cultivation racks. The airflow field inside the greenhouse reached a stable state at 50 s after the vent is opened. As can be seen from the velocity distribution, the wind speed near the ground of the greenhouse reaches the maximum, while that on the cross section shows a decreasing trend as the height increases. In the east-west arrangement mode, the maximum wind speeds on the sections of 0.5 m, 1 m, and 1.5 m are 8.2 m/s, 7.0 m/s, and 4.7 m/s, respectively. Nevertheless, in the north-south arrangement mode, they are 6.9 m/s, 4.7 m/s, and 2.3 m/s, respectively. There are two important findings. On the one hand, the wind speed at each height in the vertical arrangement mode is larger than that in the horizontal arrangement mode. On the other hand, the wind speed distribution of the vertical arrangement is significantly more uniform than that of the horizontal arrangement. The reason for this can be explained by the ventilation effect. The comprehensive ventilation of front bottom and top is adopted in the mushroom solar greenhouse. Therefore, the vertical arrangement of cultivation racks is conducive to providing smooth passage for airflow propagation. As a result, the ventilation efficiency of fungus sticks is higher.
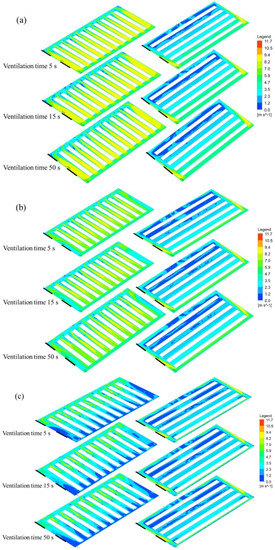
Figure 5.
Velocity distributions of typical horizontal cross sections under different arrangements of cultivation racks: (a) 0.5 m height; (b) 1.0 m height; (c) 1.5m height.
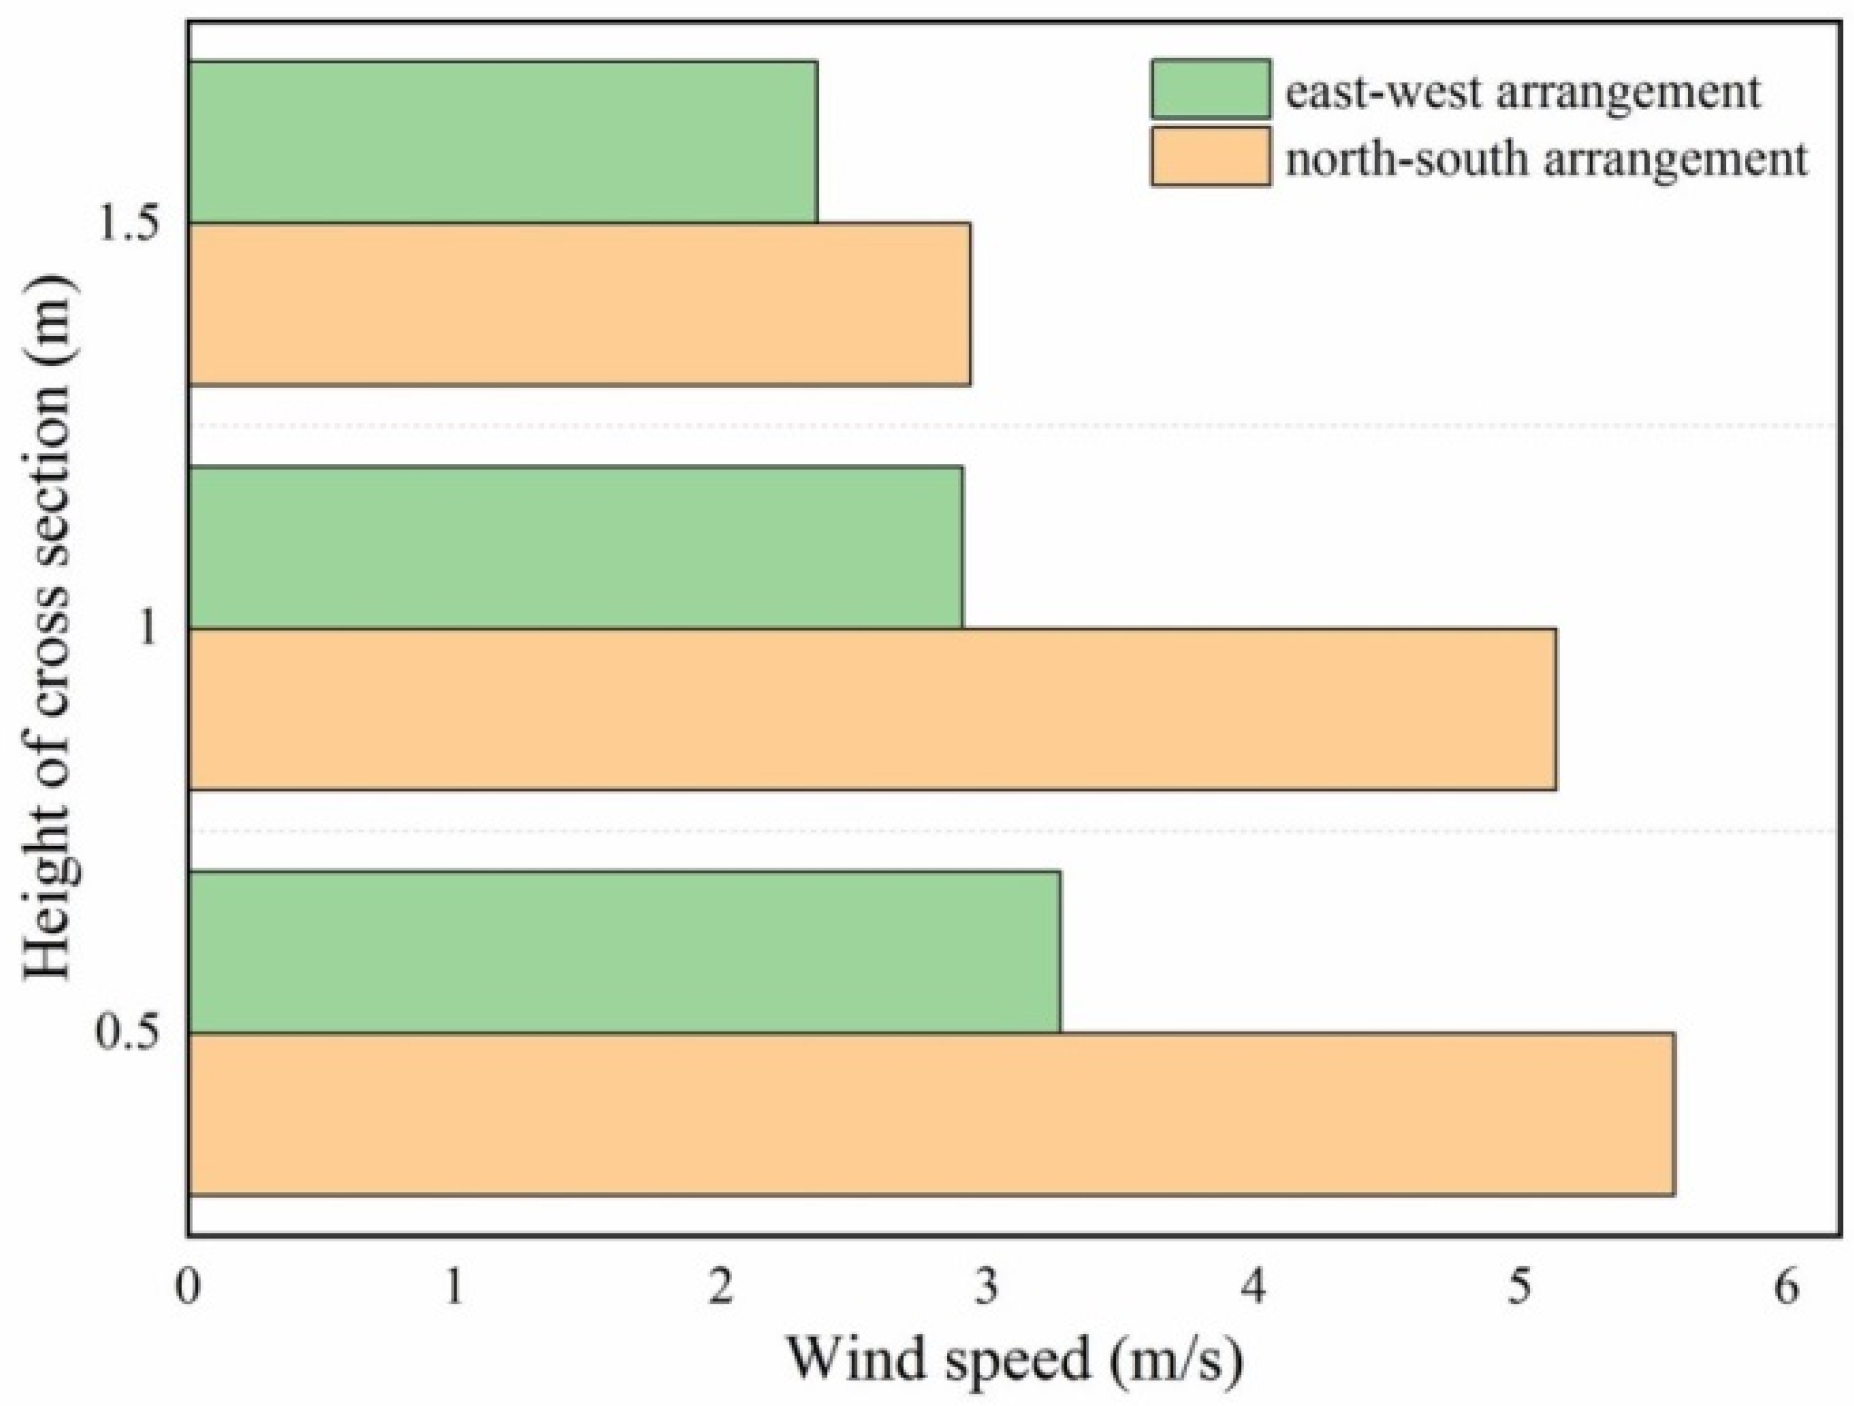
Figure 6 shows the comparison of average wind velocity under the two arrangement modes of cultivation racks. On each cross section, the wind speeds of the east-west arrangement at three different heights are significantly higher than that of the north-south arrangement. The average velocity of the east-west arrangement at 0.5 m height is 2.4 m/s higher than that of the north-south arrangement. Similarly, the average velocities of the east-west arrangement at 1.0 m and 1.5 m are 1.4 m/s and 0.8 m/s higher than that of the north-south vertical arrangement, respectively. The results indicate that the north-south arrangement of cultivation racks significantly improves the ventilation performance of the mushroom fungus sticks.

Figure 6.
Velocity magnitudes of typical horizontal cross sections under different arrangements of cultivation racks.
The speed vectors under the two modes were analyzed, and the numerical simulation results are illustrated in Figure 7. Due to the blocking effect of the east-west cultivation racks in the front row, the fresh air from outside cannot be smoothly blown to the rear cultivation racks, but can only be blown through the small gap between the layers. As a result, the ventilation effect on the cultivation racks in the last row cannot be achieved. Nevertheless, in the north-south arrangement of cultivation racks, the outside wind can smoothly flow into the greenhouse without the blocking effect. The cooling rate of each layer of the cultivation rack is reasonable. The wind can form a uniform flow in every gap between two rows of cultivation racks, which guarantees the ventilation efficiency in the mushroom solar greenhouse.
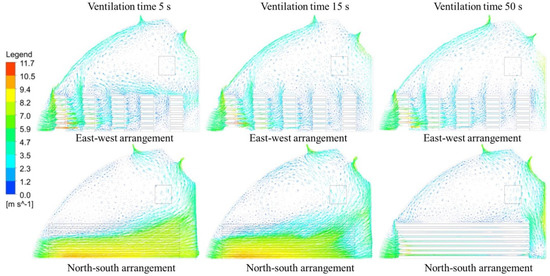
Figure 7.
Velocity vectors of typical vertical cross sections under different arrangements of cultivation racks.
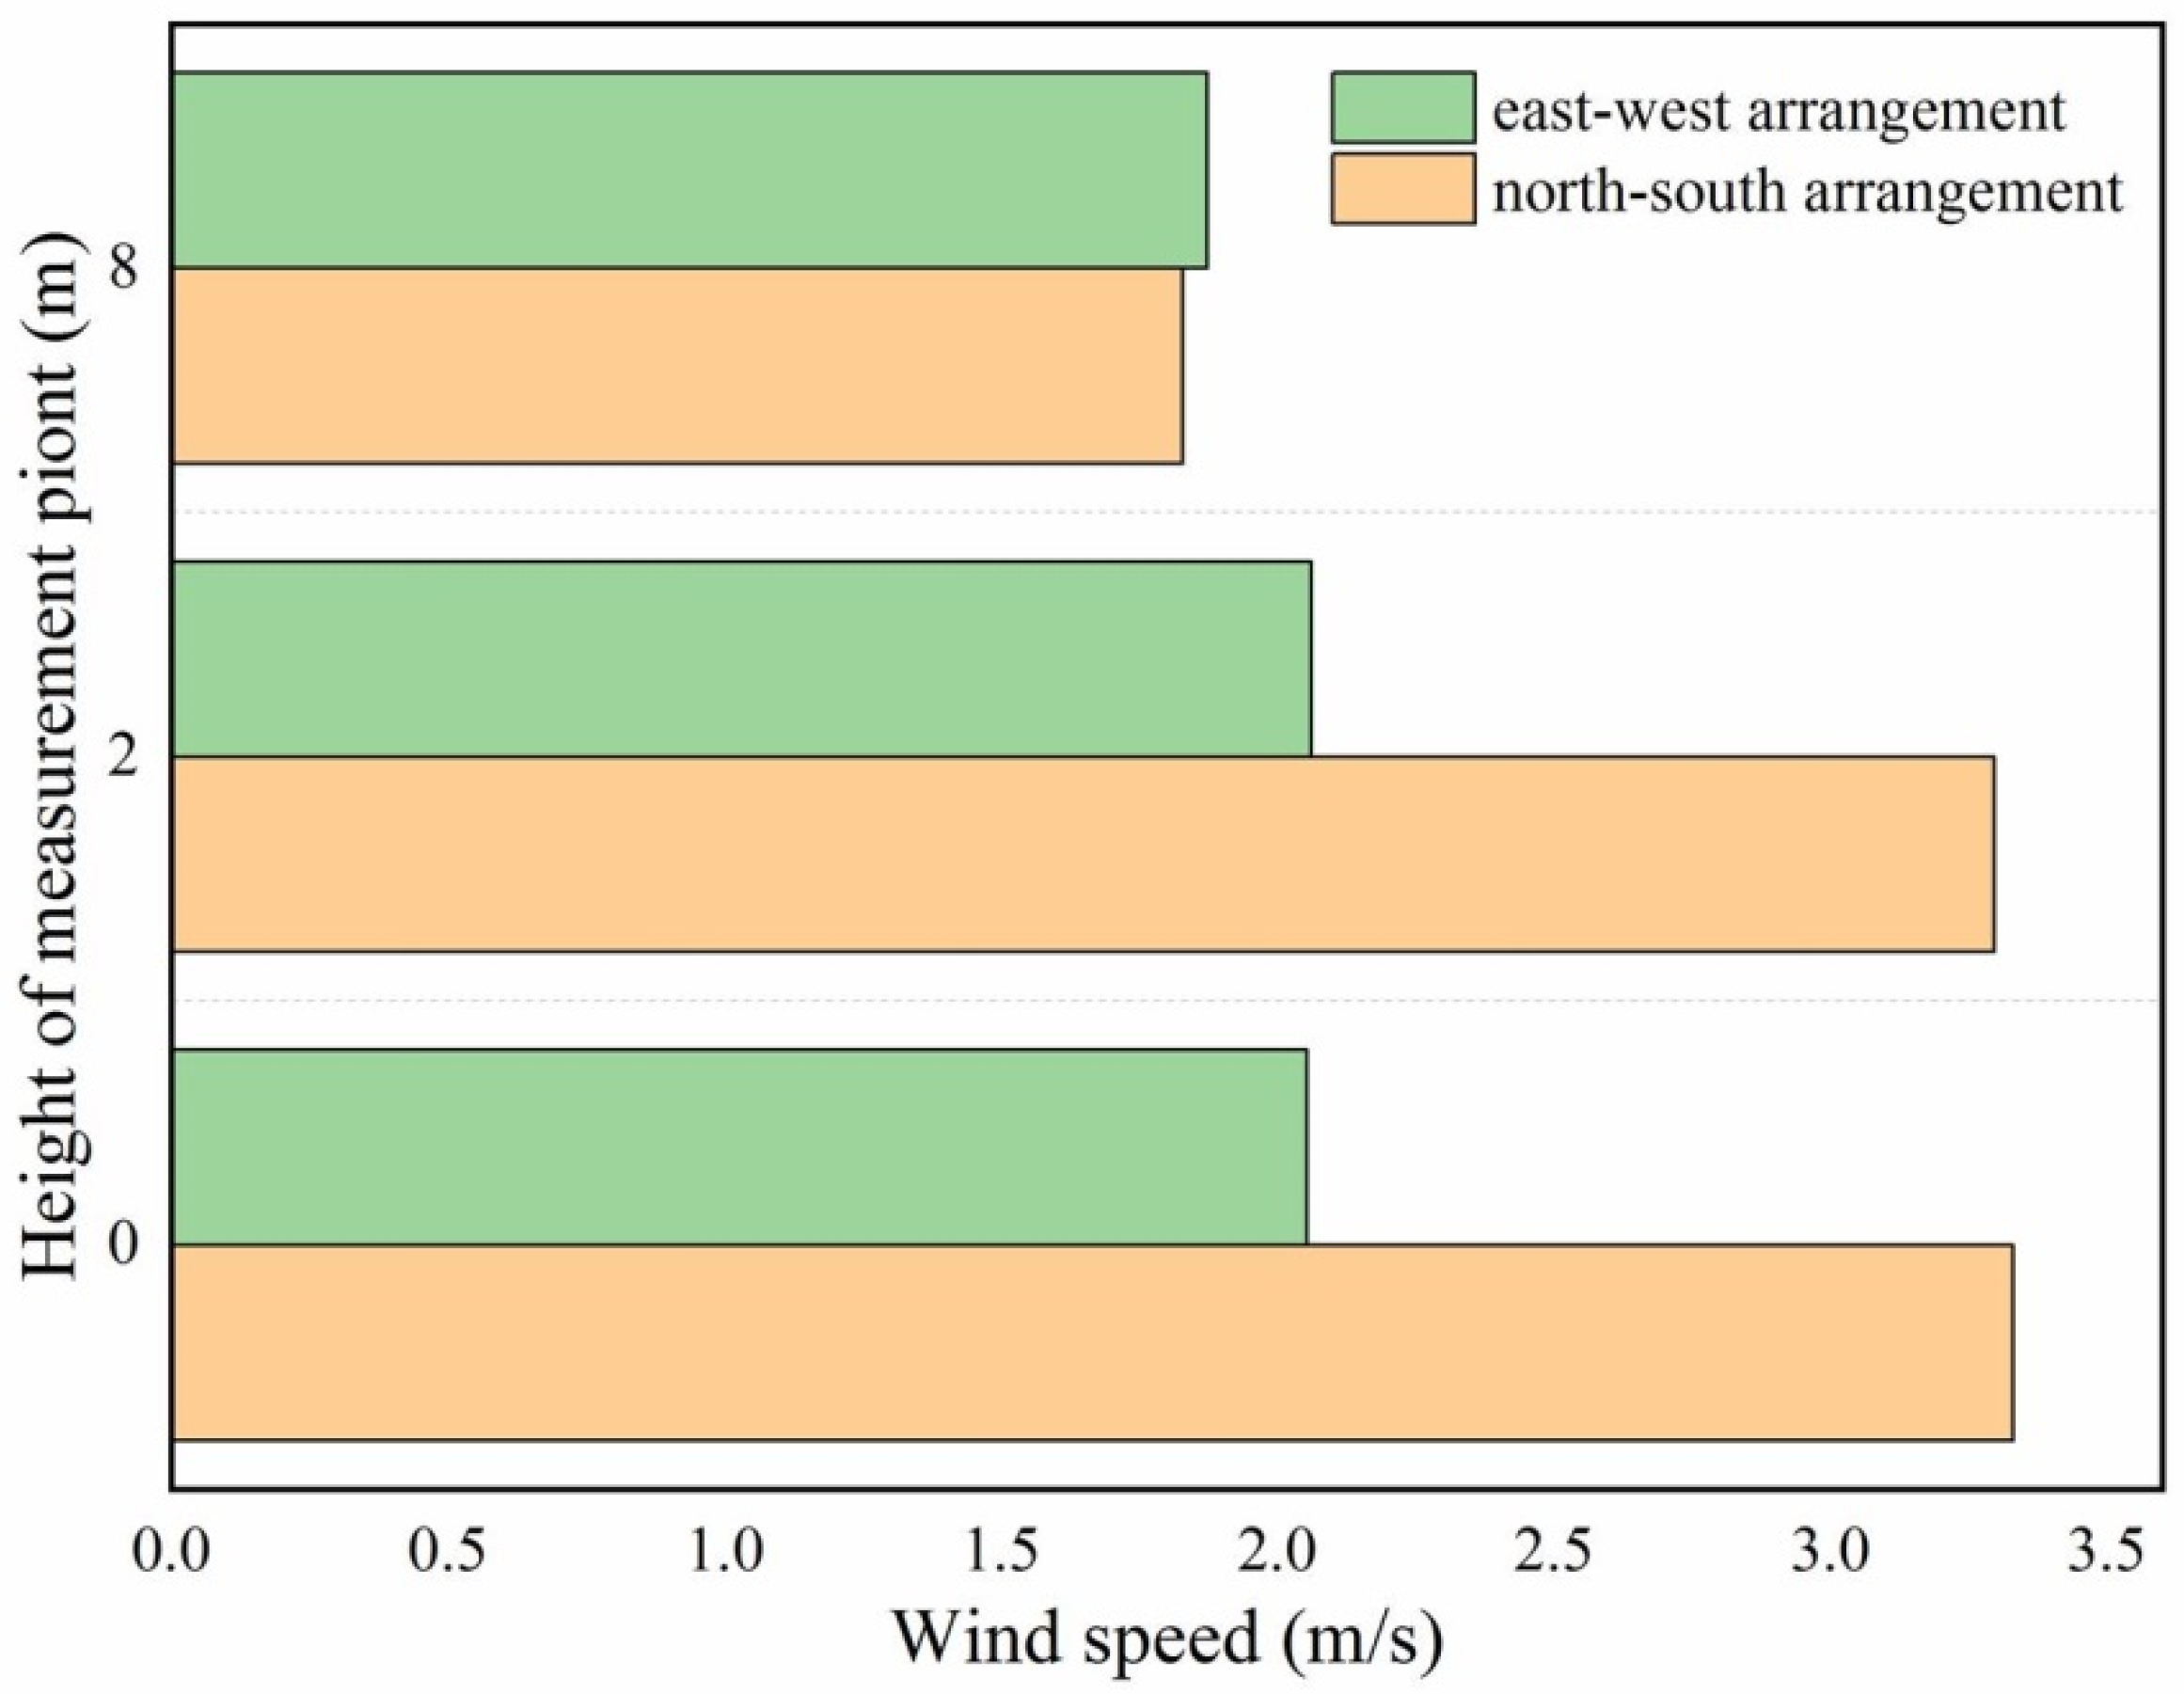
Statistical analysis was conducted on the average velocity of different heights, and the processing results are shown in Figure 8. It can be seen that the wind speed of the north-south arrangement in most areas of the greenhouse is much larger than that of the east-west arrangement. However, the wind speed of the east-west arrangement is slightly larger at the 1/3 section of the greenhouse. This is because the horizontally arranged cultivation racks in the front rows will block the wind flow into the greenhouse. The airflow has to move from the gap near the film to the top location of the greenhouse. As a result, fresh wind that has not been fully exchanged will escape from the top vent. What is worse, is that the last two rows have little airflow because the fresh wind cannot smoothly reach those cultivation racks. In conclusion, the appropriate orientation arrangement of cultivation racks in the mushroom solar greenhouse is the north-south arrangement. The average wind velocity in this layout is larger in comparison with the east-west arrangement, and the airflow is more uniform. It not only helps improve the ventilation efficiency in each layer of the cultivation racks, but also contributes to the breath of mushroom fungus sticks.
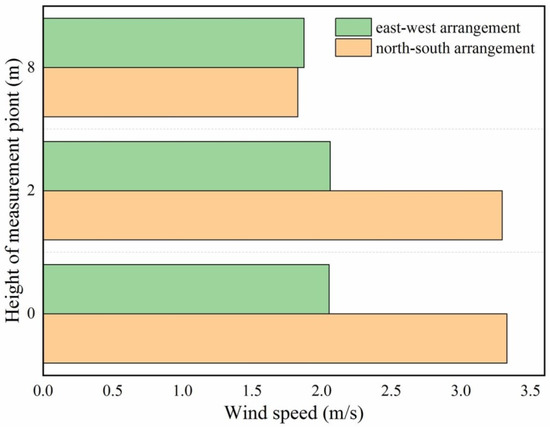
Figure 8.
Velocity magnitudes of typical vertical cross sections under different arrangements of cultivation racks.
3.2. Effect of Horizontal Spacing of Cultivation Racks
As the configuration of cultivation racks in the mushroom solar greenhouse does not have a definitive design, the present research has carried out numerical simulation to determine the horizontal spacing of the cultivation racks. In order to find out the best horizontal spacing, seven different cases were investigated, and the detailed parameters are exhibited in Table 3.
Table 3.
Parameters of cultivation racks in the horizontal spacing investigation.
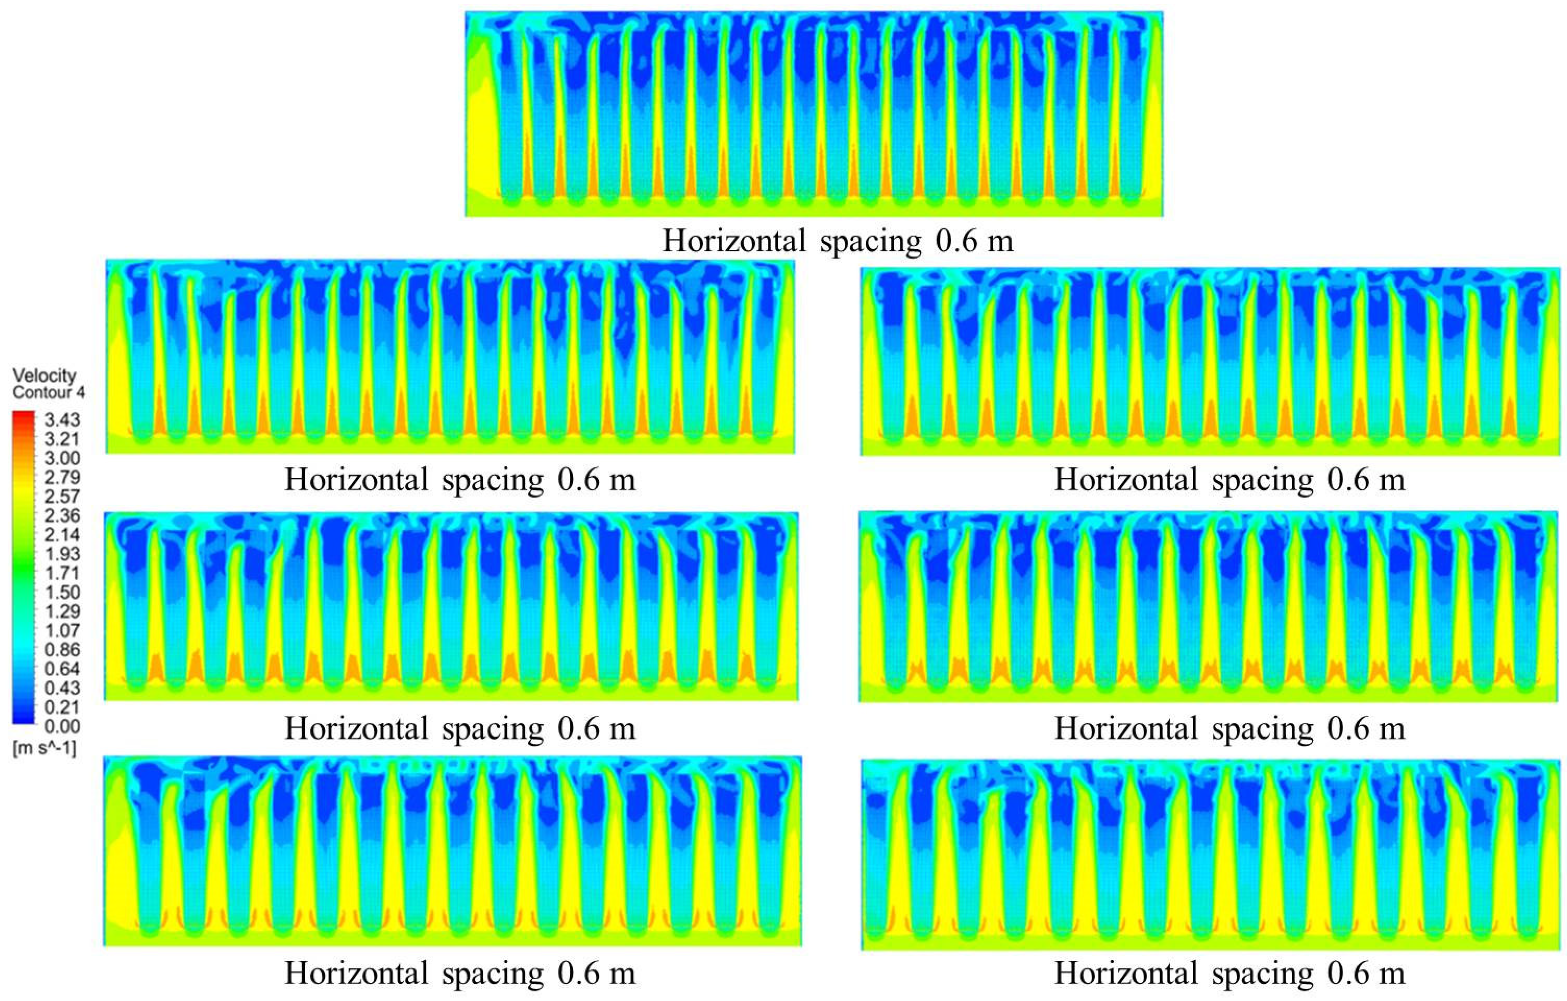
The ventilation characteristics of different horizontal spacings of cultivation racks were compared, and the numerical results are displayed in Figure 9. The numerical results indicate that the overall velocity distribution is not significantly affected by the horizontal spacing. Nevertheless, the magnitude of the wind speed is distinguishing. As can be seen from the horizontal spacing of 0.6 m and 0.7 m, the maximum wind speed between adjacent cultivation racks reaches 3.21 m/s due to the small spacing. Nevertheless, most of the airflow directly moves in the corridor between the cultivation racks, resulting in low wind speed and uneven velocity distribution inside the cultivation racks. When the spacing is enlarged from 0.8 m to 1.2 m, the wind can run through the internal fungus stick of the cultivation racks, so as to achieve the desired ventilation effect. Through the numerical simulation, it can be concluded that the larger the spacing, the more advantageous it is for the ventilation inside the greenhouse. However, the horizontal spacing between the existing cultivation racks is too low. Some of the cultivation racks near the back wall do not have the fresh wind evenly blowing to them. As the horizontal spacing of the cultivation racks is enlarged to 1.2 m, the predicament is relieved. Nevertheless, too-large horizontal spacing is detrimental to the scale of production. In this way, the number of fungus sticks will be reduced, which will greatly reduce the total output of the mushroom solar greenhouse.

Figure 9.
Velocity distributions of typical cross sections under the different horizontal spacings of cultivation racks.
Statistical analysis was conducted on the average wind speed under different horizontal spacings of the cultivation racks, and the results are demonstrated in Figure 10. The average airflow velocities of the five cases with horizontal spacing of 0.8 m, 0.9 m, 1.0 m, 1.1 m, and 1.2 m, all of which are 0.65 m/s, are basically the same. However, the wind speeds of 0.6 m and 0.7 m are about 0.46 m/s when the external wind just enters the greenhouse, and the wind speeds only reach about 0.6 m/s when the ventilation period is 15 s. This indicates that too-small horizontal spacing is to the disadvantage of ventilation of the cultivation racks. The difference of wind speed between 0.8 m and 1.2 m is only 0.05 m/s, suggesting that the ventilation performance of the cultivation racks can be satisfied when the horizontal spacing is 0.8 m. This is consistent with the above results.
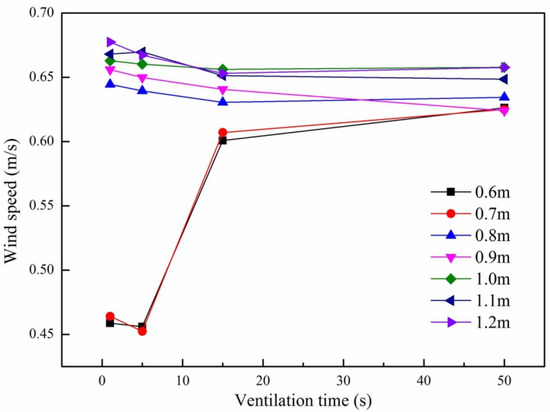
Figure 10.
Velocity magnitudes of typical cross sections under different horizontal spacings of cultivation racks.
3.3. Effect of Vertical Spacing of Cultivation Racks
There is no systematic study on the ventilation effect of the spacing between cultivation rack layers (i.e., vertical spacing) on the ventilation performance. Based on the above research results, the layout of cultivation racks is the north-south arrangement. The horizontal spacing is specified as 0.8 m, and the vertical spacing of the cultivation racks is investigated with an interval of 0.1 m and 0.01 m for interpolation modeling. The specific parameters of the six different established cases are shown in Table 4.
Table 4.
Parameters of cultivation racks in the vertical spacing investigation.
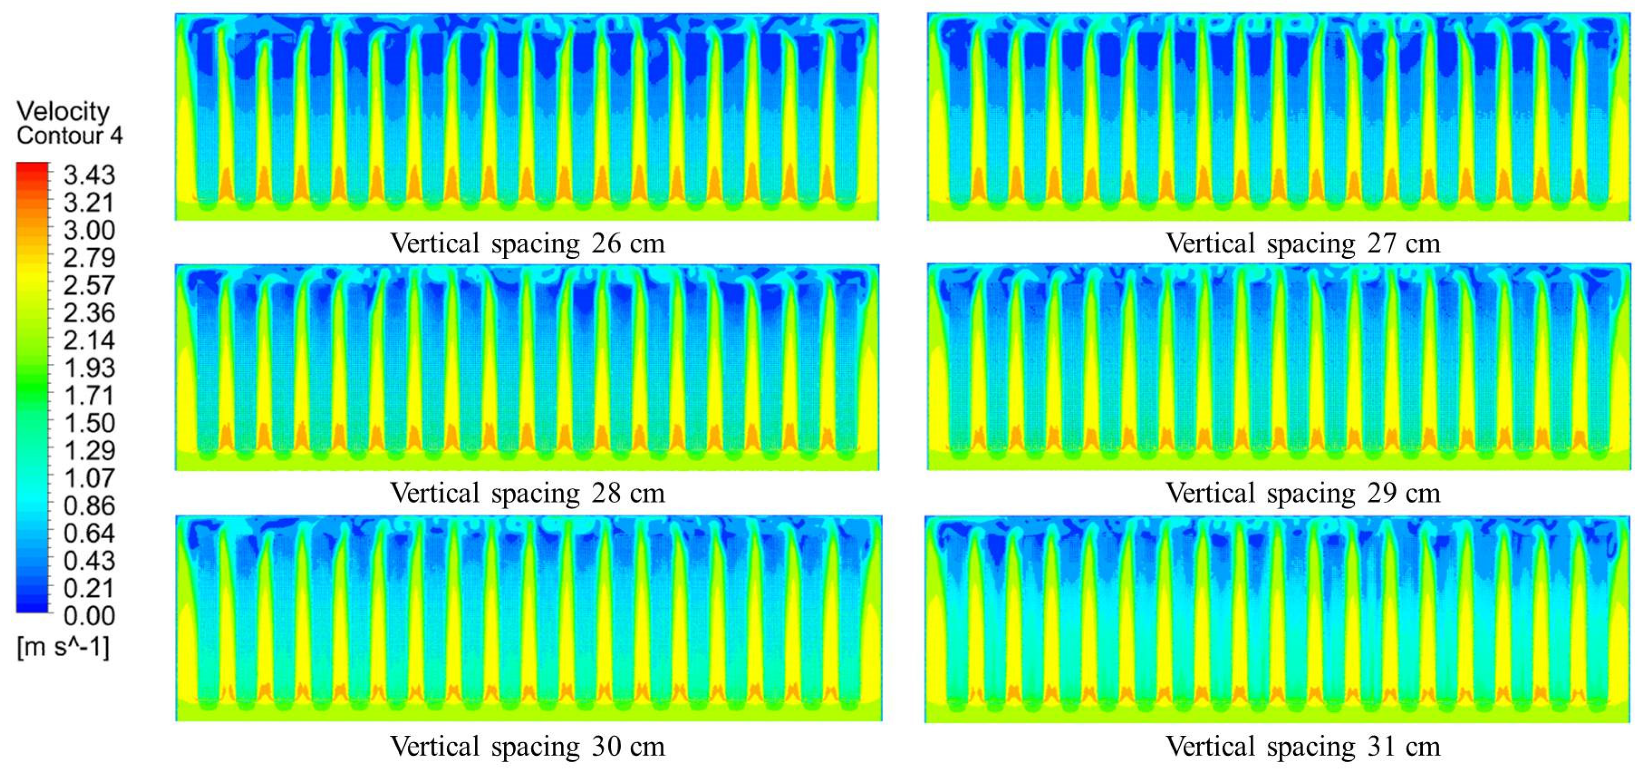
Numerical simulation was conducted on the overall ventilation rate of the greenhouse under different vertical spacings of the cultivation racks, and the results are illustrated in Figure 11. It can be seen from the velocity distribution that the wind speed is more uniform with an increase in the vertical spacing between adjacent cultivation racks. Moreover, the greater the vertical spacing between the layers is, the larger the average wind speed is. When the vertical spacing is 26 cm, the wind speed inside the cultivation racks near the back wall is very low. Only the front part has airflow, which is too high and reaches 2.48 m/s. With the increase of vertical spacing, the cultivation racks near the back wall gradually acquire wind flow. When the vertical spacing increases to 29 cm, the whole cultivation rack can gain access to wind flow, and the distribution of wind speed is much more uniform. As the vertical spacing of the cultivation racks increase to 30 cm and 31 cm, however, the ventilation performance is disappointing. Even though the wind can run through the whole cultivation rack, the distribution of wind speed is disorganized.
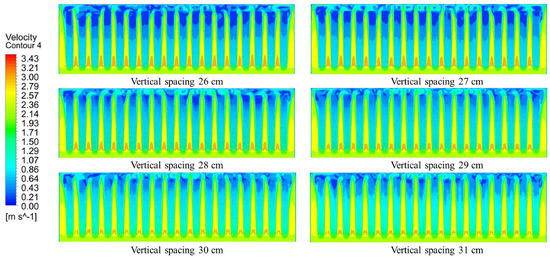
Figure 11.
Velocity distributions of typical cross sections under different vertical spacings of cultivation racks.
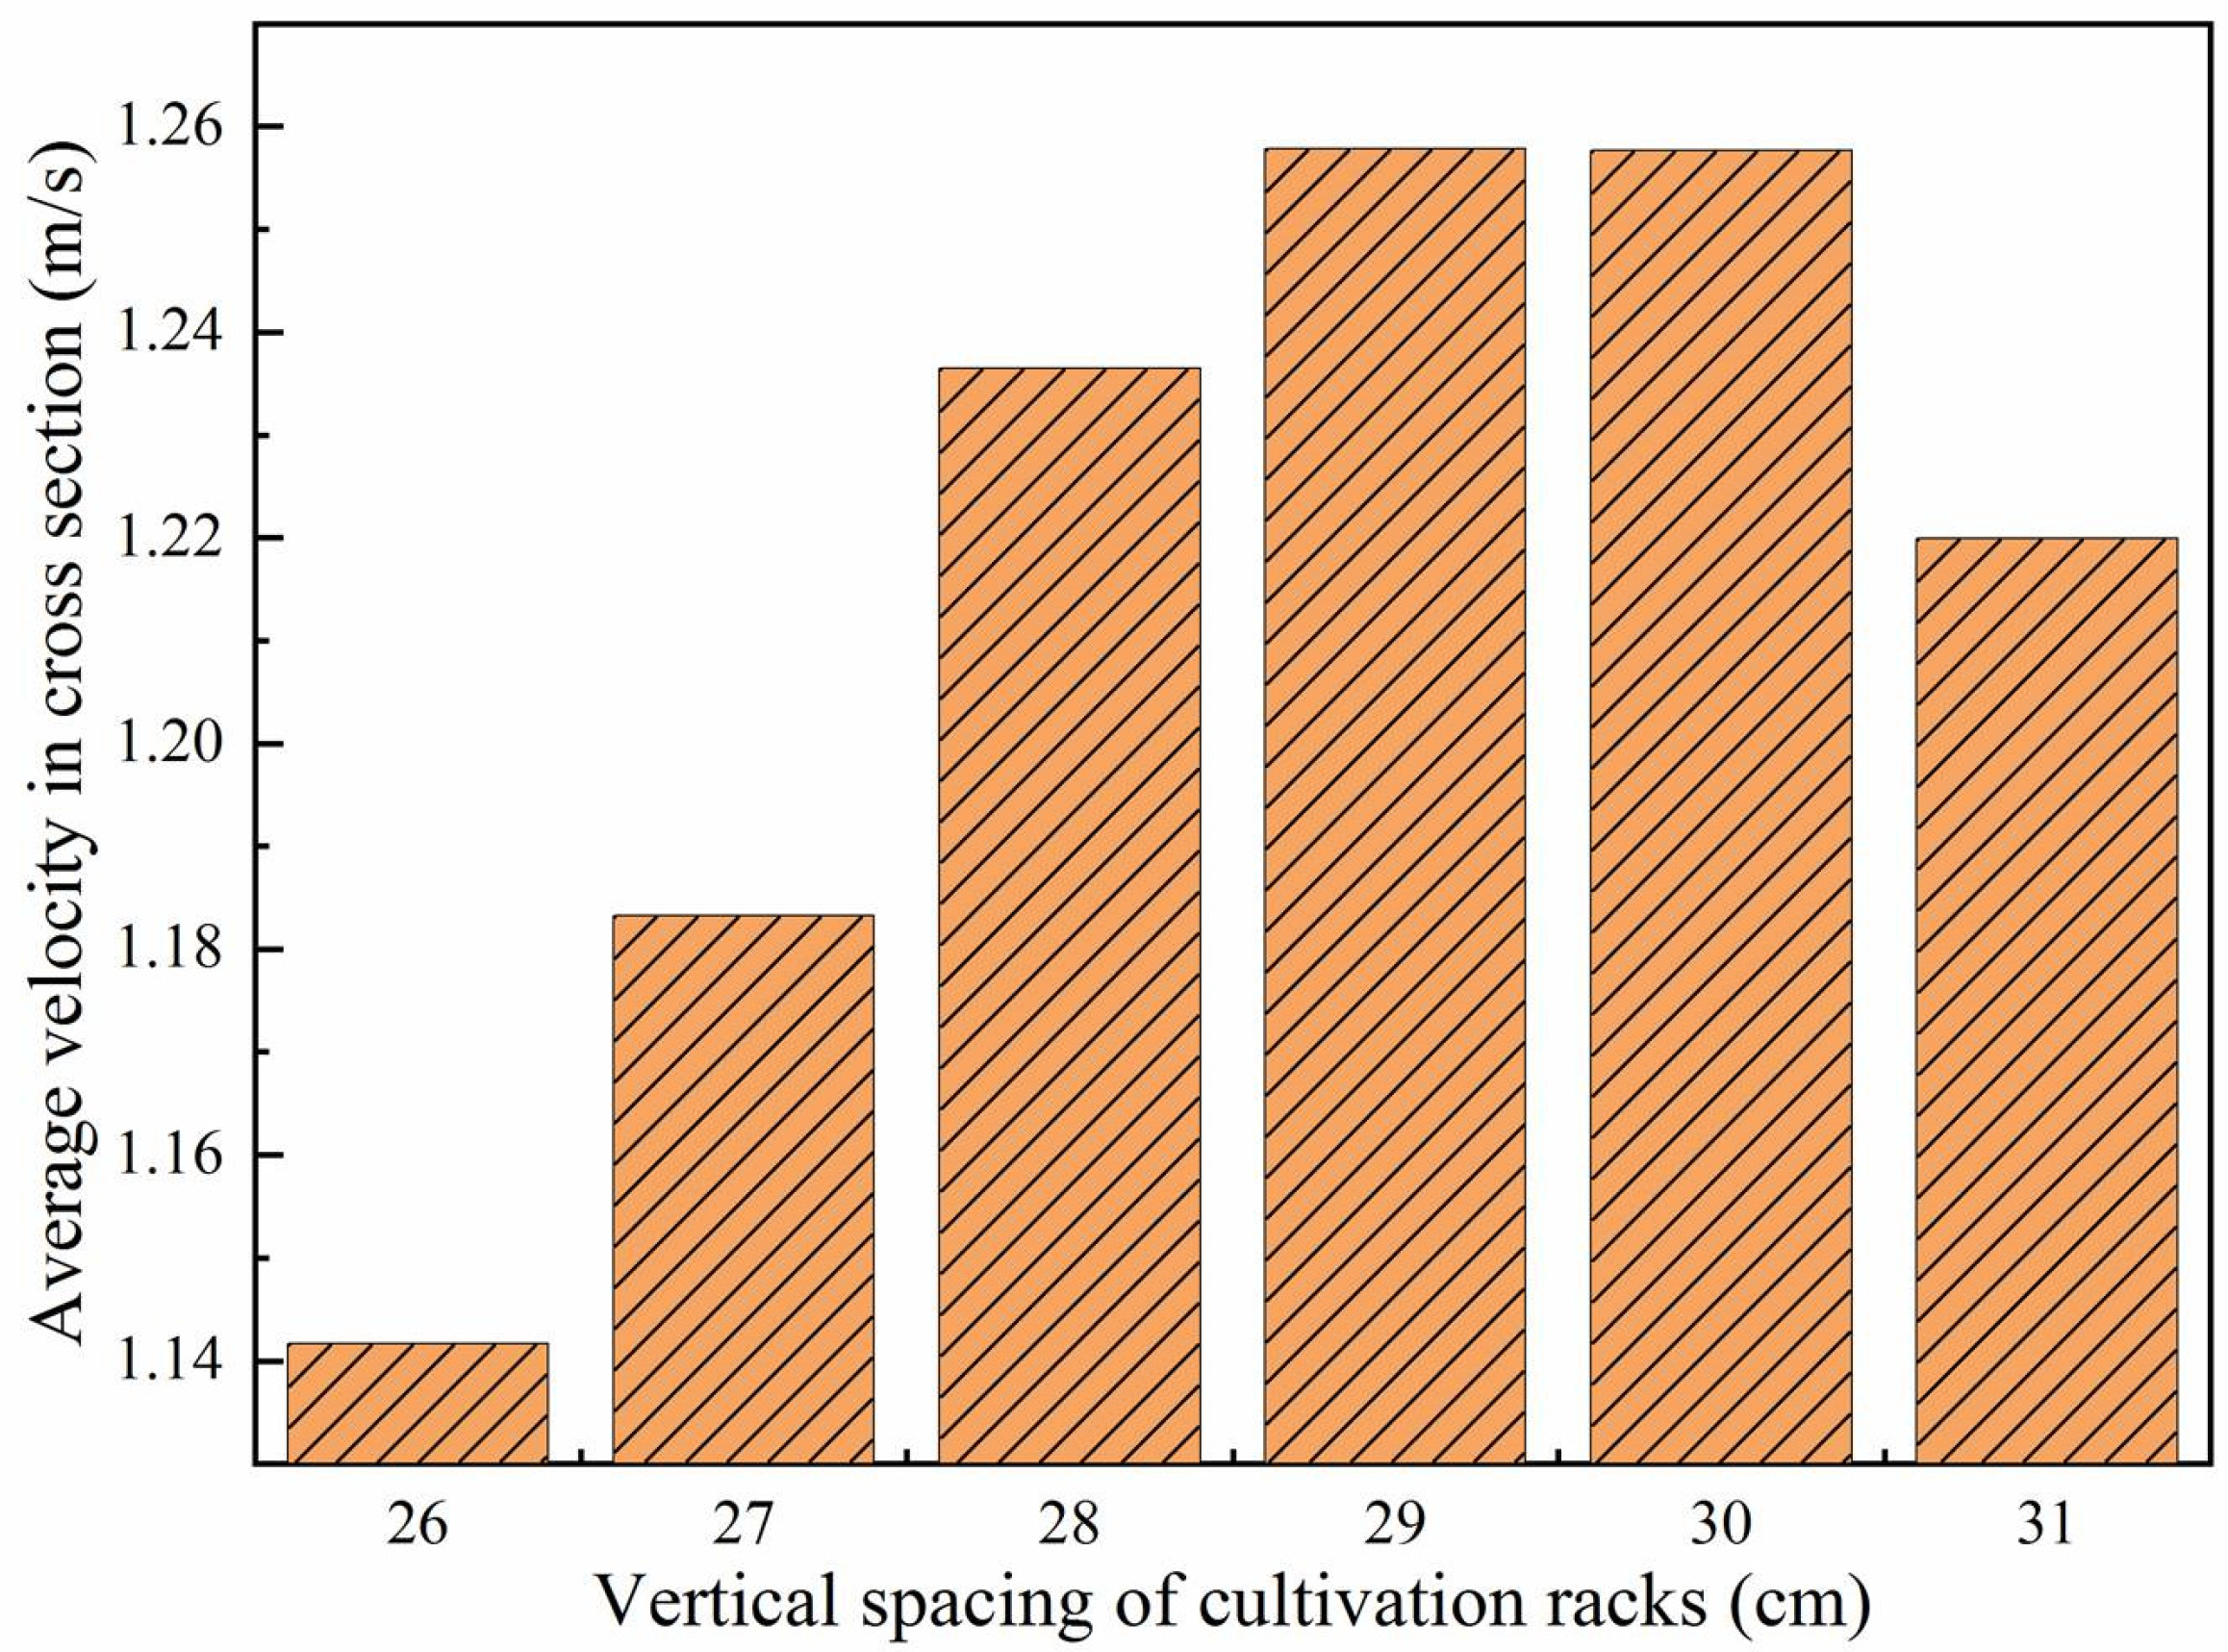
Figure 12 exhibits the statistical value of the average wind speed in each cross section. The results indicate that the average velocity first increases and then decreases according to the increase in the vertical spacing from 26 cm to 31 cm. and the maximum wind speed reaches 1.26 m/s at 29 cm. If the vertical spacing is increased further, the ventilation effect becomes weak. Therefore, the best vertical spacing of the cultivation rack layer is 29 cm.
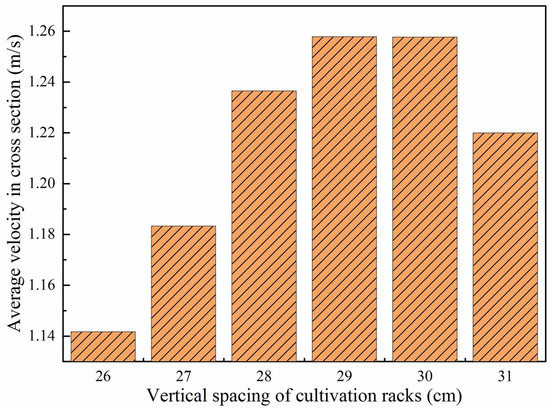
Figure 12.
Velocity magnitudes of typical cross sections under different vertical spacings of cultivation racks.
3.4. Ventilation Design of Clustered Greenhouse Park
The simulation model of twelve greenhouses in a double row has been established in the cluster greenhouse park, and the ventilation effect is displayed in Figure 13. It can be seen that the airflow outside the first three rows of greenhouses is irregular, and the wind speed at the air inlet of each greenhouse is inconsistent. Nevertheless, the airflow movement of the front inlet of each greenhouse is relatively consistent from the fourth row to the sixth row, which is quite different from the first three greenhouses. By contrast, the wind speed of the middle cross section in the six rows is uniform without significant difference. It can be clearly seen from the top cross section that the airflow in the first two rows is irregular, and the wind speed at the outlet of each greenhouse is inconsistent. However, the airflow movement of each greenhouse is relatively consistent from the third row to the sixth row.
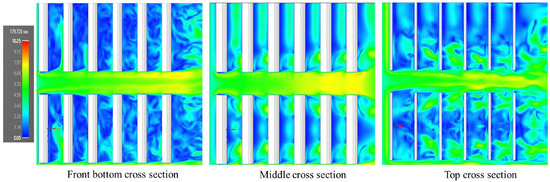
Figure 13.
Flow fields of three typical cross sections under different greenhouse arrangement.
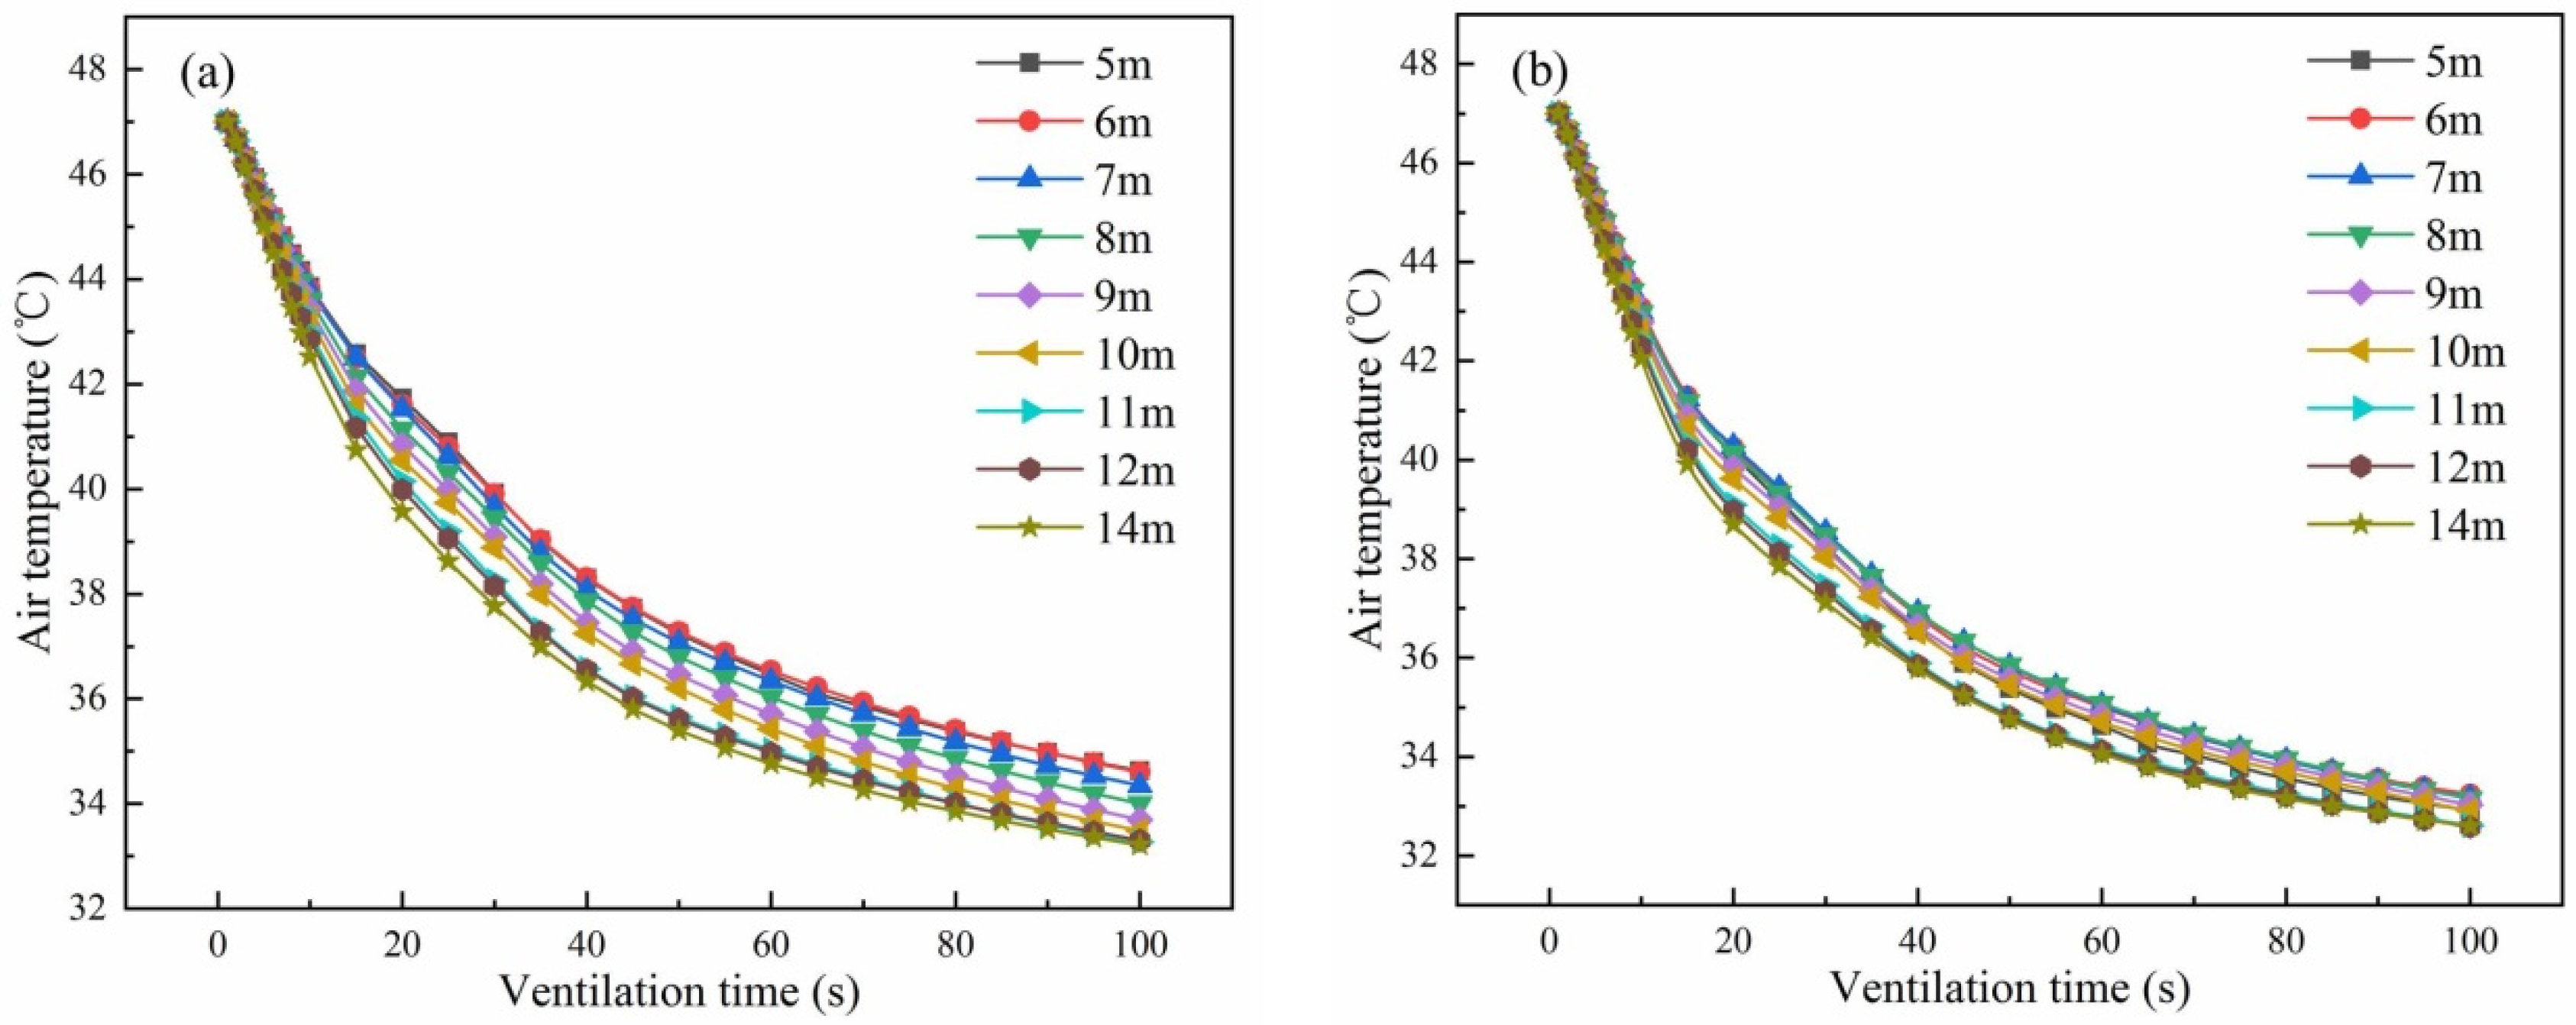
Furthermore, in order to reduce the calculation cost and to improve the accuracy, an enriched model of three greenhouses was established. The ventilation and cooling efficiency of different building distances before and after the greenhouse were studied. Because there is no shading effect in the front greenhouse, this numerical simulation mainly analyzes the second and third row of greenhouses. Figure 14 shows the comparison of cooling efficiency under different building spacings between the two greenhouses. Figure 14a demonstrates the internal temperature variation inside the second row under the building spacing from 5 m to 14 m. As can be seen, the internal cooling rate of the greenhouse decreases obviously with the increase in building spacing. It shows a decreasing trend of 0.3 m/s for every 1 m increase. However, the quantitative change occurs between 10 m and 11 m. The cooling rate of 11 m spacing is significantly faster than that of 10 m from the beginning of 10 s, and the gap increases to 1 °C in the ventilation period of 40 s. However, the difference fades away after 100 s. Moreover, the cooling rate does not change significantly when the building spacing increases to 12 m and 14 m. The cooling efficiency of the third row of clustered greenhouses was also analyzed, and the results are shown in Figure 14b. It can be seen that the cooling trend of the third row is consistent with that of the second row. The temperature decreases by 0.1 °C every 1 m increase in the building spacing. The third row also undergoes quantitative changes at 10 m and 11 m. In the ventilation period of 20 s, the cooling rate is significantly faster when the building spacing is 11 m than when it is 10 m, and the maximum temperature difference reaches to 0.8 °C at 50 s. Nevertheless, the temperature at 10 m and 11 m is basically the same when the ventilation time reaches 100 s, and there is no change in the cooling rate when the building spacing increases to 12 m and 14 m.
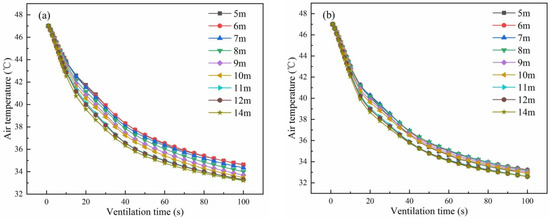
Figure 14.
Cooling rate of the clustered solar greenhouse under different building spacings: (a) the second row; (b) the third row.
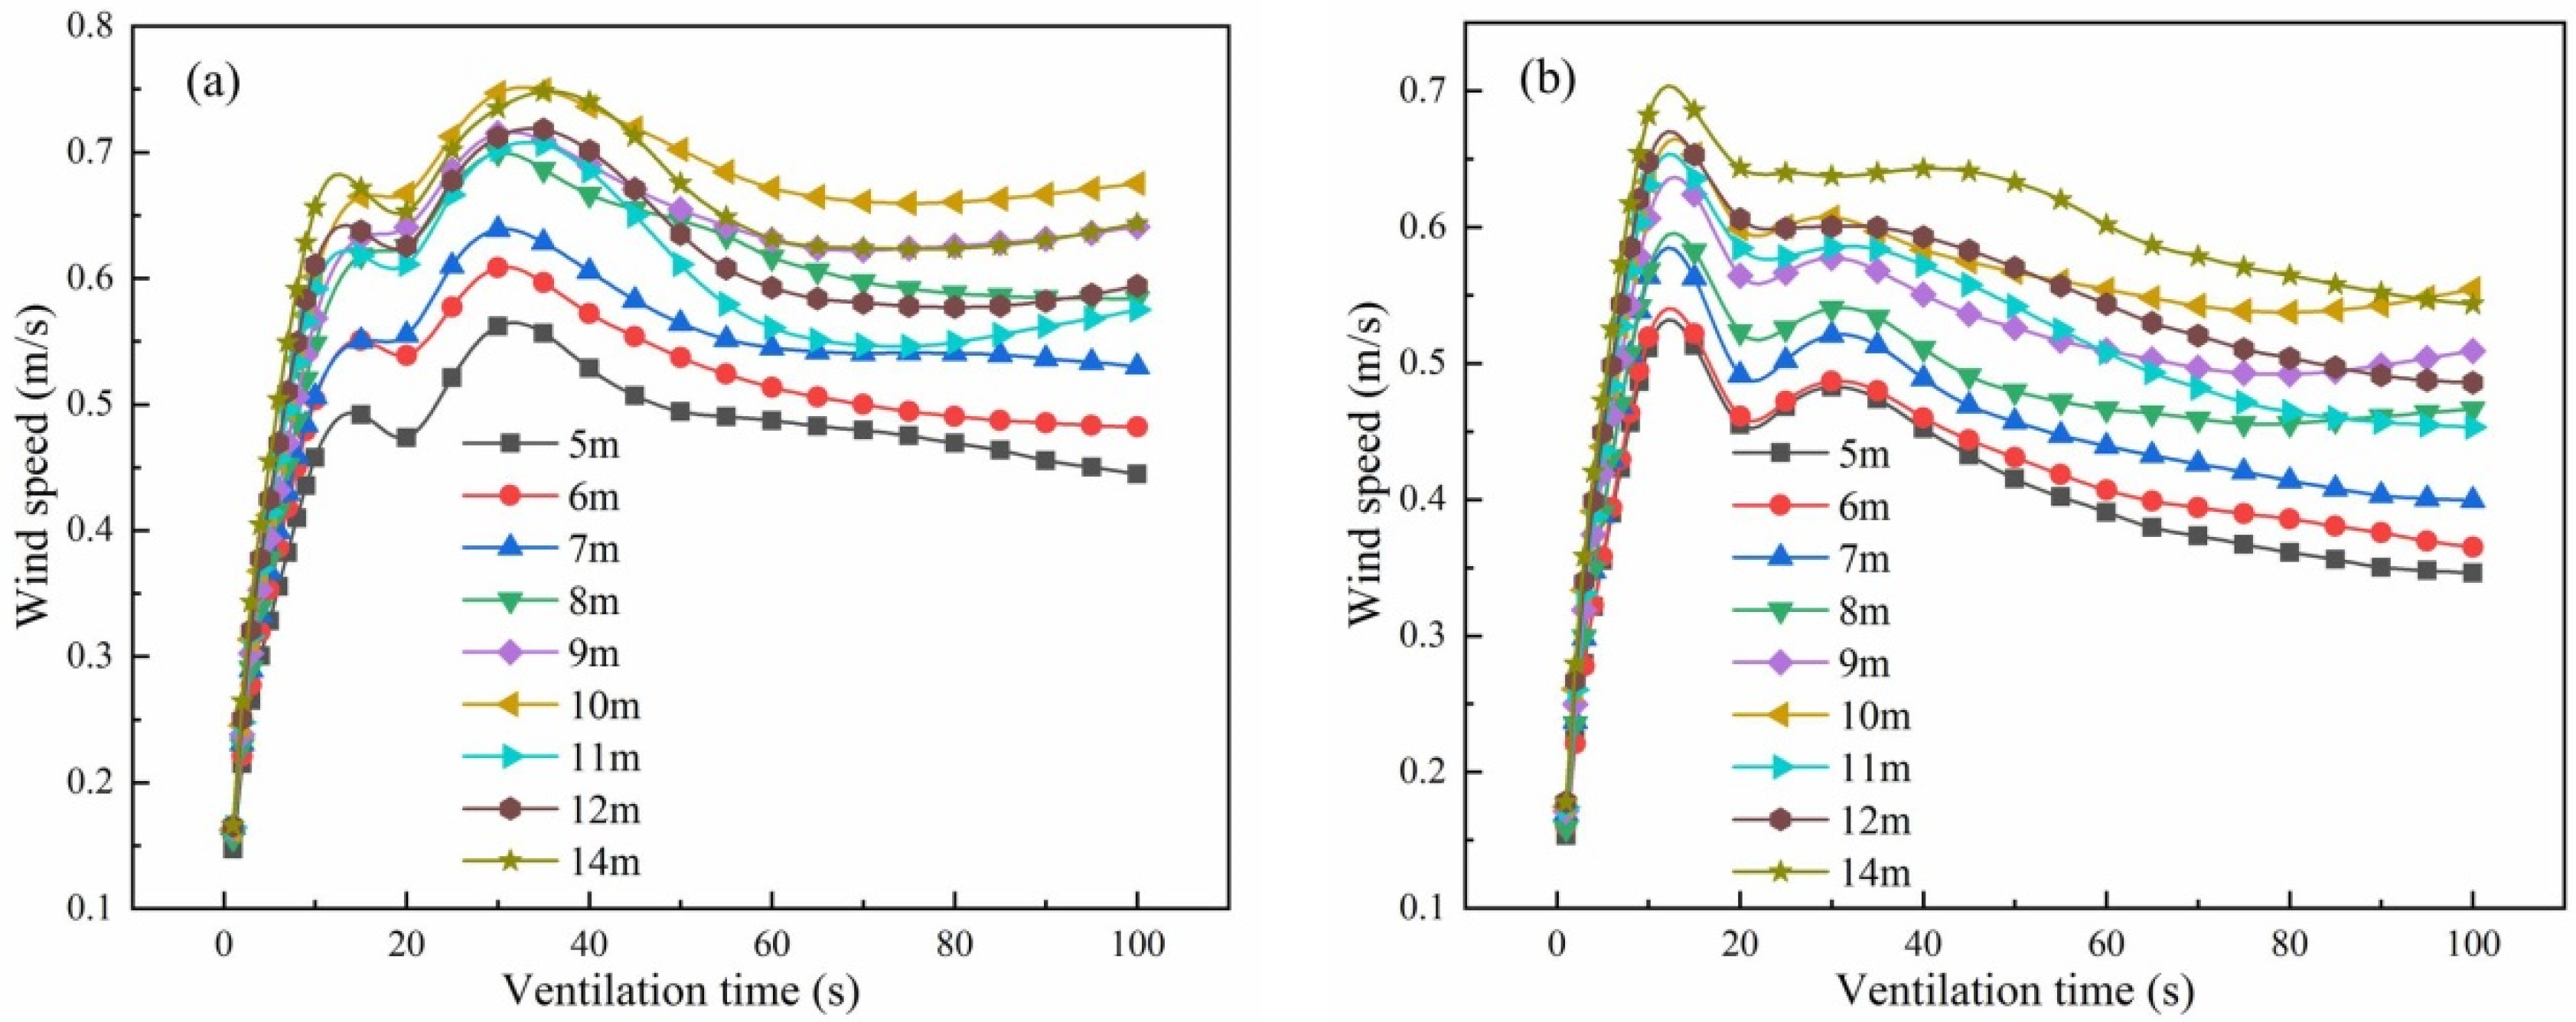
The ventilation performance was studied, and the distribution of the average wind speed in the clustered greenhouses is exhibited in Figure 15. The wind speed inside the second row is analyzed in Figure 15a. According to intuition, the greater the building spacing between greenhouses is, the greater the wind speed. Nevertheless, the velocity magnitude first increases to the maximum, and then slowly reduces to smooth. The average wind speed rises gradually with the increase in building spacing from 5 m to 7 m. However, the change of airflow is not significant from 8 m to 14 m. The peak value of wind speed reaches 0.71 m/s under the building spacing of 10 m. After the ventilation flow is stable in the greenhouse, the wind speed at 11 m, 12 m, and 14 m are 0.59 m/s, 0.62 m/s, and 0.68 m/s, respectively. The fungus sticks actually need high wind speed to achieve efficient ventilation. In consideration of the growth habit of mushroom, the optimal building spacing of the second row of clustered greenhouses is 10 m. Corresponding analysis was carried out on the third row, and the results are shown in Figure 15b. The wind speed increases to a maximum, and then slowly reduces to smooth. The velocity magnitude gradually increases as the building spacing is enlarged from 5 m to 9 m. However, there is no significant change from 10 m to 14 m. When the building distance between the clustered greenhouses is 14 m, the peak value of airflow velocity inside the greenhouses is 0.70 m/s. Nevertheless, it falls rapidly to 0.58 m/s when the ventilation effect reaches a stable level at 100 s. The average wind speed under the building spacing of 11 m, 12 m, and 14 m are 0.49 m/s, 0.52 m/s, and 0.54 m/s, respectively. With the increase in ventilation time, the wind speed inside the greenhouse begins to rise until it reaches a stable level when the building spacing is 10 m. Therefore, the optimal building spacing of the third row of greenhouses is also 10 m.
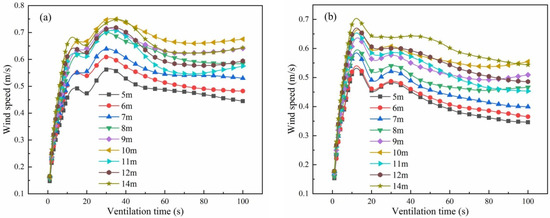
Figure 15.
Air velocity variation of the clustered solar greenhouse under different building spacings: (a) the second row; (b) the third row.
4. Discussion
The growth of mushrooms is greatly affected by environmental factors, such as temperature, humidity, illumination, and CO2 concentration. Among these environmental factors, the most influential one is the temperature. A too-high or too-low temperature will cause damage to the growth of mushrooms. The optimal growth temperature is 5~33 °C for mycelial growth and 12~28 °C for mushroom emergence. Because the growth of mushrooms requires less solar radiation intensity, the ventilation plays a very important role in the exchange of micro-environment and energy in the production process of solar greenhouses. In some places, it is difficult to grow mushrooms using conventional methods (i.e., cold winter or strong sunshine in summer, etc). However, in solar greenhouses, the mushroom can be grown in some harsh climate conditions. Previous scholars have performed a series of investigations into vegetable greenhouses and have obtained important results with academic value. However, little attention has been paid to the system design of a mushroom solar greenhouse. On the one hand, the mushroom has more demanding requirements on temperature and humidity; therefore, the ventilation results of a vegetable greenhouse cannot be directly applied to a mushroom greenhouse. On the other hand, the fungus sticks are produced in the form of cultivation racks, in which the ventilation is much more complicated than in soil cultivation. Nevertheless, there is a research gap in the configuration scheme of cultivation racks such as orientation arrangement, horizontal spacing, and vertical spacing. In addition, the planning and design of the vegetable greenhouse park is based on the principle that the front greenhouse does not affect the lighting of the back greenhouse. However, it does not fit into the weak light habit of mushroom. There is no systematic study on the ventilation of a large-scale park of mushroom solar greenhouses. In order to improve the production efficiency in the clustered mushroom greenhouse park, it is of significant importance to establish the theoretical basis of ventilation design theory.
In order to explore the system design of clustered mushroom solar greenhouses, the present research has developed a 3-D mathematical model based on CFD theory to study the ventilation performance. According to the analysis of different orientation arrangements of cultivation racks, it can be asserted that the best design is the north-south arrangement. This arrangement not only maximizes the wind speed in the greenhouse, but also enables the fresh air into the greenhouse to flow evenly to each cultivation shelf, which is conducive to the ventilation of fungus sticks. In addition, through the analysis of the horizontal spacing of the cultivation racks, it can be concluded that the optimal horizontal spacing is 0.8 m. If the separation distance of the cultivation racks is blindly increased, the overall airflow velocity in the greenhouse will not improve significantly, but will waste the land utilization. According to the analysis of vertical spacing of cultivation racks, it is suggested that the optimal vertical spacing of cultivation racks is 29 cm. This configuration helps create a smooth passage to achieve the best ventilation effect of the fungus sticks. According to the analysis of the cooling rate and ventilation efficiency of clustered greenhouses, the optimal building spacing is 10 m. This arrangement contributes to the normal growth and development of mushroom fungus sticks, which can not only increase the utilization rate of land, but also ensure the best cooling rate of each greenhouse.
Greenhouse cultivation is a suitable agricultural techniques for creating and controlling the inside microclimate to be adequate for plant growth. For mushroom solar greenhouses in summer, the temperature is too high to cause the normal growth of fungus crops under the strong solar radiation and weak wind. It is of great significance to find the reasonable planning of clustered greenhouse parks and the effective method of rapid cooling inside the greenhouse to ensure the high-quality production. As a matter of fact, the major environmental factors, including temperature, humidity, illuminance, and gas concentration, in the greenhouse are invisible. Nevertheless, the reported research on greenhouse ventilation is still mainly focused on experimental research, which has long cycle, high cost, and is difficult to reproduce according to different climate conditions. The CFD numerical simulation can effectively solve the above problems and can realize the visual analysis of airflow field and temperature distribution. However, there are few reports on the numerical simulation of mushroom solar greenhouse ventilation. The following work will further use CFD to study the effect of vent configuration on the ventilation performance of mushroom solar greenhouses.
5. Conclusions
In this study, the CFD theory has been used to establish a mathematical model for the numerical simulation of clustered mushroom solar greenhouses. The effects of orientation arrangement, horizontal spacing, vertical spacing of the cultivation racks, and the building spacing between clustered greenhouses on the ventilation performance have been investigated. The best orientation arrangement of cultivation racks inside the mushroom solar greenhouse is a north-south layout because of the maximum wind speed. Moreover, the fresh wind into the greenhouse can flow evenly to each layer of cultivation racks, which contributes to the ventilation of mushroom fungus sticks. The optimal horizontal spacing of the cultivation racks is 0.8 m, which is conducive to wind running through the interior of the cultivation racks, so as to achieve a reasonable ventilation effect. The optimal vertical spacing between cultivation rack layers is 29 cm, which can not only avoid the shielding effect, but can also improve the uniformity of wind speed distribution. For the clustered mushroom solar greenhouse park, the best building spacing between adjacent greenhouses is 10 m, which can not only increase the land utilization rate, but also ensure the best cooling effect of each greenhouse.
Author Contributions
Conceptualization, Y.L. and X.L.; methodology, Y.L. and X.L.; software, F.S.; validation, Y.L., W.S. and T.L.; formal analysis, F.S. and W.S.; investigation, F.S.; resources, W.S.; data curation, Y.L.; writing—original draft preparation, Y.L. and W.S.; writing—review and editing, X.L. and T.L.; visualization, Y.L.; supervision, X.L.; project administration, T.L.; funding acquisition, Y.L. and T.L. All authors have read and agreed to the published version of the manuscript.
Funding
This research was funded by the China Postdoctoral Foundation of Yiming Li (No. 275737) and the China Agriculture Research System of MOF and MARA (CARS-23-C01).
Institutional Review Board Statement
Not applicable.
Informed Consent Statement
Not applicable.
Data Availability Statement
Not applicable.
Conflicts of Interest
The authors declare no conflict of interest.
References
- Tong, G.; Christopher, D.M.; Li, B. Numerical modelling of temperature variations in a Chinese solar greenhouse. Comput. Electron. Agric. 2009, 68, 129–139. [Google Scholar] [CrossRef]
- Majdoubi, H.; Boulard, T.; Fatnassi, H.; Bouirden, L. Airflow and microclimate patterns in a one-hectare canary type greenhouse: An experimental and CFD assisted study. Agric. For. Meteorol. 2019, 149, 1050–1062. [Google Scholar] [CrossRef]
- Li, H.; Li, Y.; Yue, X.; Liu, X.; Tian, S.; Li, T. Evaluation of airflow pattern and thermal behavior of the arched greenhouses with designed roof ventilation scenarios using CFD simulation. PLoS ONE 2020, 15, e0239851. [Google Scholar] [CrossRef]
- Liu, X.; Wu, X.; Xia, T.; Fan, Z.; Shi, W.; Li, Y.; Li, T. New insights of designing thermal insulation and heat storage of Chinese solar greenhouse in high latitudes and cold regions. Energy 2022, 242, 122953. [Google Scholar] [CrossRef]
- Zhang, X.; Wang, H.; Zou, Z.; Wang, S. CFD and weighted entropy based simulation and optimisation of Chinese Solar Greenhouse temperature distribution. Biosyst. Eng. 2016, 142, 12–26. [Google Scholar] [CrossRef]
- Choab, N.; Allouhi, A.; Maakoul, A.E.; Kousksou, T.; Saadeddine, S.; Jamil, A. Review on greenhouse microclimate and application: Design parameters, thermal modeling and simulation, climate controlling technologies. Sol. Energy 2019, 191, 109–137. [Google Scholar] [CrossRef]
- Xu, F.; Shang, C.; Li, H.; Xue, X.; Sun, W.; Chen, H.; Li, Y.; Zhang, Z.; Li, X.; Guo, W. Comparison of thermal and light performance in two typical Chinese solar greenhouses in Beijing. Int. J. Agric. Biol. Eng. 2019, 12, 24–32. [Google Scholar] [CrossRef]
- Wu, X.; Liu, X.; Yue, X.; Xu, H.; Li, T.; Li, Y. Effect of the ridge position ratio on the thermal environment of the Chinese solar greenhouse. R. Soc. Open Sci. 2021, 8, 201707. [Google Scholar] [CrossRef]
- Tong, G.; Christopher, D.M.; Zhao, R.; Wang, J. Effect of location and distribution of insulation layers on the dynamic thermal performance of Chinese solar greenhouse walls. Appl. Eng. Agric. 2014, 30, 457–469. [Google Scholar]
- Cao, K.; Xu, H.; Zhang, R.; Xu, D.; Yan, L.; Sun, Y.; Xia, L.; Zhao, J.; Zou, Z.; Bao, E. Renewable and sustainable strategies for improving the thermal environment of Chinese solar greenhouses. Energy Build. 2019, 202, 109414. [Google Scholar] [CrossRef]
- Ma, Y.; Li, X.; Fu, Z.; Zhang, L. Structural design and thermal performance simulation of shade roof of double-slope greenhouse for mushroom-vegetable cultivation. Int. J. Agric. Biol. Eng. 2019, 12, 126–133. [Google Scholar] [CrossRef]
- Zheng, D.; Wang, J.; Chen, Z.; Baleta, J.; Sundén, B. Performance analysis of a plate heat exchanger using various nanofluids. Int. J. Heat Mass Transf. 2020, 158, 119993. [Google Scholar] [CrossRef]
- Wang, J.; Li, G.; Li, T.; Zeng, M.; Sundén, B. Effect of various surfactants on stability and thermophysical properties of nanofluids. J. Therm. Anal. Calorim. 2021, 143, 4057–4070. [Google Scholar] [CrossRef]
- Zheng, D.; Yang, J.; Wang, J.; Kabelac, S.; Sundén, B. Analyses of thermal performance and pressure drop in a plate heat exchanger filled with ferrofluids under a magnetic field. Fuel 2021, 293, 120432. [Google Scholar] [CrossRef]
- Wang, J.; Li, G.; Zhu, H.; Luo, J.; Sundén, B. Experimental investigation on convective heat transfer of ferrofluids inside a pipe under various magnet orientations. Int. J. Heat Mass Transf. 2019, 132, 407–419. [Google Scholar] [CrossRef]
- Chen, Z.; Zheng, D.; Wang, J.; Chen, L.; Sundén, B. Experimental investigation on heat transfer characteristics of various nanofluids in an indoor electric heater. Renew. Energy 2020, 147, 1011–1018. [Google Scholar] [CrossRef]
- Amani, M.; Foroushani, S.; Sultan, M.; Bahrami, M. Comprehensive review on dehumidification strategies for agricultural greenhouse applications. Appl. Therm. Eng. 2020, 181, 115979. [Google Scholar] [CrossRef]
- Chan, K.L.; Mo, C.; Shin, K.Y.; Im, Y.H.; Yoon, S.W. A Study of the effects of enhanced uniformity control of greenhouse environment variables on crop growth. Energies 2019, 12, 091749. [Google Scholar]
- McCartney, L.; Lefsrud, M.G. Field trials of the natural ventilation augmented cooling (NVAC) greenhouse. Biosyst. Eng. 2018, 174, 159–172. [Google Scholar] [CrossRef]
- Kittas, C.; Bartzanas, T. Greenhouse microclimate and dehumidification effectiveness under different ventilator configurations. Build. Environ. 2007, 42, 3774–3784. [Google Scholar] [CrossRef]
- Limtrakarn, W.; Boonmongkol, P.; Chompupoung, A.; Rungprateepthaworn, K.; Kruenate, J.; Dechaumphai, P. Computational fluid dynamics modeling to improve natural flow rate and sweet pepper productivity in greenhouse. Adv. Mech. Eng. 2012, 4, 158563. [Google Scholar] [CrossRef]
- Bournet, P.E.; Ould Khaoua, S.A.; Boulard, T. Numerical prediction of the effect of vent arrangements on the ventilation and energy transfer in a multi-span glasshouse using a bi-band radiation model. Biosyst. Eng. 2007, 98, 224–234. [Google Scholar] [CrossRef]
- Villagrá, E.A.; Baeza Romero, E.J.; Bojacá, C.R. Transient CFD analysis of the natural ventilation of three types of greenhouses used for agricultural production in a tropical mountain climate. Biosyst. Eng. 2019, 188, 288–304. [Google Scholar] [CrossRef]
- He, K.; Chen, D.; Sun, L.; Huang, Z.; Liu, Z. Effects of vent configuration and span number on greenhouse microclimate under summer conditions in eastern China. Int. J. Vent. 2015, 13, 381–396. [Google Scholar] [CrossRef]
- Bartzanas, T.; Boulard, T.; Kittas, C. Effect of vent arrangement on windward ventilation of a tunnel greenhouse. Biosyst. Eng. 2004, 88, 479–490. [Google Scholar] [CrossRef]
- Pakari, A.; Ghani, S. Airflow assessment in a naturally ventilated greenhouse equipped with wind towers: Numerical simulation and wind tunnel experiments. Energy Build. 2019, 199, 1–11. [Google Scholar] [CrossRef]
- Zhang, G.; Fu, Z.; Yang, M.; Liu, X.; Dong, Y.; Li, X. Nonlinear simulation for coupling modeling of air humidity and vent opening in Chinese solar greenhouse based on CFD. Comput. Electron. Agric. 2019, 162, 337–347. [Google Scholar] [CrossRef]
- Al-Helal, I.M.; Waheeb, S.A.; Ibrahim, A.A. Modified thermal model to predict the natural ventilation of greenhouses. Energy Build. 2015, 99, 1–8. [Google Scholar] [CrossRef]
- Han, J.H.; Kwon, H.J.; Yoon, J.Y.; Kim, K.; Nam, S.W.; Son, J.E. Analysis of the thermal environment in a mushroom house using sensible heat balance and 3-D computational fluid dynamics. Biosyst. Eng. 2009, 104, 417–424. [Google Scholar] [CrossRef]
- Zhang, Y.; Kacira, M.; An, L. A CFD study on improving air flow uniformity in indoor plant factory system. Biosyst. Eng. 2016, 147, 193–205. [Google Scholar] [CrossRef]
- Baek, M.S.; Kwon, S.Y.; Lim, J.H. Improvement of the crop growth rate in plant factory by promoting air flow inside the cultivation. Int. J. Smart Home 2016, 10, 63–74. [Google Scholar] [CrossRef]
- Kim, K.; Yoon, J.Y.; Kwon, H.J.; Han, J.H.; Son, J.E.; Nam, S.W.; Giacomelli, G.A.; Lee, I.B. 3-D CFD analysis of relative humidity distribution in greenhouse with a fog cooling system and refrigerative dehumidifiers. Biosyst. Eng. 2008, 100, 245–255. [Google Scholar] [CrossRef]
- Ryu, K.J.; Son, J.H.; Han, C.W.; Nah, K.D. A study on the design of air conditioning system in the mushroom cultivation greenhouse. J. Korea Acad. -Ind. Coop. Soc. 2017, 18, 743–750. [Google Scholar]
- Xia, T.; Li, Y.; Wu, X.; Fan, Z.; Shi, W.; Liu, X.; Li, T. Performance of a new active solar heat storage–release system for Chinese assembled solar greenhouses used in high latitudes and cold regions. Energy Reports. 2022, 8, 784–797. [Google Scholar] [CrossRef]
- Nebbali, R.; Roy, J.C.; Boulard, T. Dynamic simulation of the distributed radiative and convective climate within a cropped greenhouse. Renew. Energy 2012, 43, 111–129. [Google Scholar] [CrossRef]


Publisher’s Note: MDPI stays neutral with regard to jurisdictional claims in published maps and institutional affiliations. |
© 2022 by the authors. Licensee MDPI, Basel, Switzerland. This article is an open access article distributed under the terms and conditions of the Creative Commons Attribution (CC BY) license (https://creativecommons.org/licenses/by/4.0/).