Article

Simulation Analysis of Issues with Grid Disturbance for a Photovoltaic Powered Virtual Synchronous Machine

1
Renewable Energy Research Center, National Institute of Advanced Industrial Science and Technology, 2-2-9, Machiikedai, Koriyama 963-0298, Japan
2
TEPCO Research Institute, Tokyo Electric Company Holdings, 4-1, Egasaki-cho, Tsurumi-ku, Yokohama 230-8510, Japan
*
Author to whom correspondence should be addressed.
Energies 2022, 15(16), 5921; https://doi.org/10.3390/en15165921
Submission received: 13 April 2022 / Revised: 5 August 2022 / Accepted: 8 August 2022 / Published: 15 August 2022
(This article belongs to the Section F1: Electrical Power System)

Abstract

:
The increase in inverter-based resources associated with the increased installation of PV sources is a concern because it reduces the inertia of the power system during peak PV generation periods. As a countermeasure to reduce grid inertia, the addition of pseudo-inertia using virtual synchronous machines can be selected, and PV generation can cooperatively contribute to the stable operation of the power system by using the suppressed output as reserve power. However, few studies have analyzed VSMs that do not use batteries and use PV as a resource (PV-VSM) in simulations, including grid interconnection and solar radiation fluctuations, and it is necessary to clarify the issues and discuss countermeasures. In this study, electromagnetic transient response analysis was applied to a VSM connected to a two-generator system, simulations were performed, and the following findings were reported and countermeasure methods for the problem were proposed. When the PV capacity is insufficient for the output required by the VSM inverter, the PV-VSM control system may become unstable. This is caused by a drop in the capacitor voltage of the DC/DC converter due to insufficient PV output. The limiter control system is designed to address this problem by combining the headroom estimation system with the current limiting algorithm. The proposed limiter control system is validated on solar radiation ramp fluctuations as a test case and found that the system was effective in supressing PV-VSM instability. In our simulation case, the PV-VSM with our limiter control can continue to operate stably even if the PV available power is 0.03 [p.u.] short of the inverter’s reference power by the solar power ramp fluctuation, as long as the inverter installation rate is less than 50%.

1. Introduction

With the entry into force of the Paris Agreement in November 2016, many countries are accelerating their decarbonization efforts based on international agreements. On the other hand, the Intergovernmental Panel on Climate Change (IPCC) special report in 2018 pointed out that, in order to keep global warming below 1.5 ° C, CO 2 emissions need to be significantly lower than the original target and achieve carbon neutrality in 2050–2060 [1], which has led to further efforts to decarbonize the power sector in many countries. For instance, the Glasgow Climate Pact at the 26th session of the Conference of the Parties (COP26) to the United Nations Framework Convention on Climate Change in November 2021 calls for all parties to work towards a transition to a low emission energy system, “including accelerating efforts towards the phasedown of unabated coal power” [2].
The 2050 Net Zero Scenario released by the International Energy Agency (IEA) in 2021 states that, in addition to the elimination of inefficient coal-fired power generation by 2040, renewable energy sources must be expanded to 90% of the electricity generated (including 70% from solar and wind) for the achievement of the scenario [3]. To realize sustainable development while reducing a carbon footprint, renewable energy moreover becomes important. In particular, Japan’s Sixth Strategic Energy Plan calls for PV capacity to play an important role as a low-carbon power source in the future power system, as PV capacity accounts for a large percentage of VRE in Japan’s power supply mix planned for 2030 [4]. (PV accounts for 14–16% within 36–38% of renewable energy sources as shown in Figure 1).
However, PV is an inverter-based resource (IBR), and there is a concern about the reduction of grid inertia (deterioration of frequency stability against contingency) with the increase of their installation rate [6,7,8]. For example, in a system with a large number of synchronized inertia, the Rate of Frequency Change (RoCoF) is suppressed, which means that there is sufficient time before generators supply the governor response. On the other hand, in a power system with little inertia, the large RoCoF may cause the system to deviate from the allowed range of frequency change before the injection from generators, and in the worst case, IBRs and synchronous generators may dissociate one after another, resulting in a blackout.
In order to ensure the frequency stability of power systems with high IBR implementation rates, the following major approaches exist:
  • Adding inertia such as a synchronous condenser;
  • Increasing the allowable range of frequency fluctuation in the system;
  • Providing fast frequency control (FFC) ancillary service from IBRs.
Introducing additional inertia with a synchronous condenser is considered to be a simple and effective approach but has the disadvantage of high equipment cost. The second approach corresponds to the sophistication of the fault ride through (FRT) function of IBRs, but this approach alone has its limitations. To deal with significant frequency fluctuations with FRTs, the hardware must be designed to withstand overcurrents, which can be very costly. With regard to the third approach, operating IBRs as a regulating power source is considered to be one of the effective ways to offset their disadvantages, as IBRs are characterized by their ability to provide very fast output regulation compared to the governor’s conventional frequency response while reducing grid inertia. For example, Hoke et al. showed that the fast frequency compensation by the inverter systems with PV is effective in stabilizing the grid frequency in the low-inertia system on Oahu. [9]. In addition, the IEA has also organized the grid interconnection requirements for distributed energy resources (DERs) with classifying four stages according to their penetration, and they assume that the technical requirement for DERs includes the low power operation for supplying reserve power and autonomous adjustment function for system frequency and voltage in a third-fourth stage with high penetration [10].
As an FFC by IBRs, in addition to the frequency droop control, recent researchers have focused on the implementation of pseudo-inertia to suppress RoCoF. IBRs with this function, called Virtual Synchronous Machine (VSM) or Virtual Synchronous Generator (VSG), are expected to contribute to resolving the technical constraint of the inverter penetration (referred to as VSMs in this paper).
Some approaches have been proposed to implement the pseudo-inertia function of the VSM. One is to impose a first order lead–lag unit on the droop control [11], and another is to emulate a synchronous generator with the controller of the IBR [12]. The latter approach is unique in that a virtual rotor frequency is stored and used as an internal signal in the control system, where various topologies have been proposed, including KHI topology [13], synchronverter topology [14,15], ISE Lab topology [16,17], VISMA topology [18,19,20], universal VSM topology [21], etc. (Refs. [22,23,24] are detailed as recent reviews.) However, pseudo-inertia by VSM is a function reproduced in software, and in order for the emulated pseudo-inertia to trigger the actual output compensation (in particular, the operation of increasing output against frequency decrease), energy resources which correspond to the kinetic energy of the synchronous generator must be reserved by the IBR side.
Such alternative energy can be guaranteed by the following options:
  • Use of kinetic energy inside IBRs, such as turbine blades;
  • Use of fast-responding energy storage systems (ESSs) such as batteries and capacitor banks;
  • Reserve capacity from the IBR source’s headroom.
In the case of wind power, the turbine blades function as inertial bodies, making them a practical option as a virtual inertial energy resource with VSM. However, this approach cannot be adopted for PV, which is one of VRE’s main forms of power generation. The second approach of harnessing Energy Storage is one of the effective approaches, but it is burdened by additional costs. As for the third approach, particularly during peak times of PV output in low-load periods (e.g., consecutive holidays), it is necessary to curtail PV output due to the system’s inertial constraints; setting reserve power in the curtailment (headroom) could translate the opportunity loss of PV generation into system value.
The provision of reserve power through PV headroom was examined by CAISO, First Solar, and the National Renewable Energy Laboratory in 2016 at a mega solar facility in California, and its effectiveness is demonstrated [25]. When utilizing headroom, two points are important: the design of the control system and determination of reserve capacity. As a review, Dreidy et al. [26] gave a comprehensive review of frequency control of the PV system utilizing headroom. Most of them are achieved by operating PV at a voltage higher than the voltage of maximum power point (MPP) and adjusting the PV operating voltage according to the frequency deviation. (This approach is sometimes referred to as ‘de-loading’.) In addition, determining the appropriate reserve capacity is also important to achieve both grid stability and PV generation revenue, and machine learning-based methods such as neural network and random forest were recently proposed [27,28].
Regarding the study of PV-powered VSMs (hereafter referred to as PV-VSMs), those supported by ESSs are vigorously researched by many researchers [29,30]. (Recent works of them are referred to in [31,32].) On the other hand, several studies focus on the headroom-based VSMs. Ding et al. proposed a voltage limiting method and adaptive tuning of simulated inertia parameters for stable PV-VSM operation without ESS [33]; Feldmann and de Oliveira proposed an adaptively controlled PV-VSM for supporting a black start with utilizing headroom [34]; Zhang et al. proposed the headroom-based PV-VSM control method with multiple PV inverters’ cooperative control [35]; Yan et al. proposed the methodology of the adaptive switching control between maximum power point tracking mode and VSM mode according to the remaining capacity from PV maximum power [36]; Jietan et al. proposed synthetic inertia and droop controller with shifting the operating point from MPP [37].
The provision of pseudo-inertia by PV power sources is an important option for future power systems, and therefore it is important to analyze the operational feasibility of PV-VSM with headroom as virtual inertial energy. However, to the authors’ knowledge, there are few studies that have analyzed PV-VSM in power systems with high IBR ratios in a detailed model (through such as an electromagnetic transient program), including the interaction with the system, except for [34]. It should be noted that, although a detailed analysis based on a 60th order model was performed in [34] for a PV-VSM connected to the grid with a 50% IBR installation rate, their study simulated a black start situation and did not include the contingency and solar radiation ramp variations during grid operation.
In this paper, a circuit analysis by PSCAD/EMTDC (one of the tools for electro-magnetic transients program) with a two-generator system model was carried out with the aim of extracting the issues involved in a PV-VSM with headroom control, and the following findings were obtained:
  • If the headroom of the PV-VSM is insufficient for the required FFR output, PV-VSMs without adequate control of the upper output limit (output limiter) will become unstable in operation. Note that insufficient headroom can be caused by solar radiation fluctuations as well as frequency fluctuations.
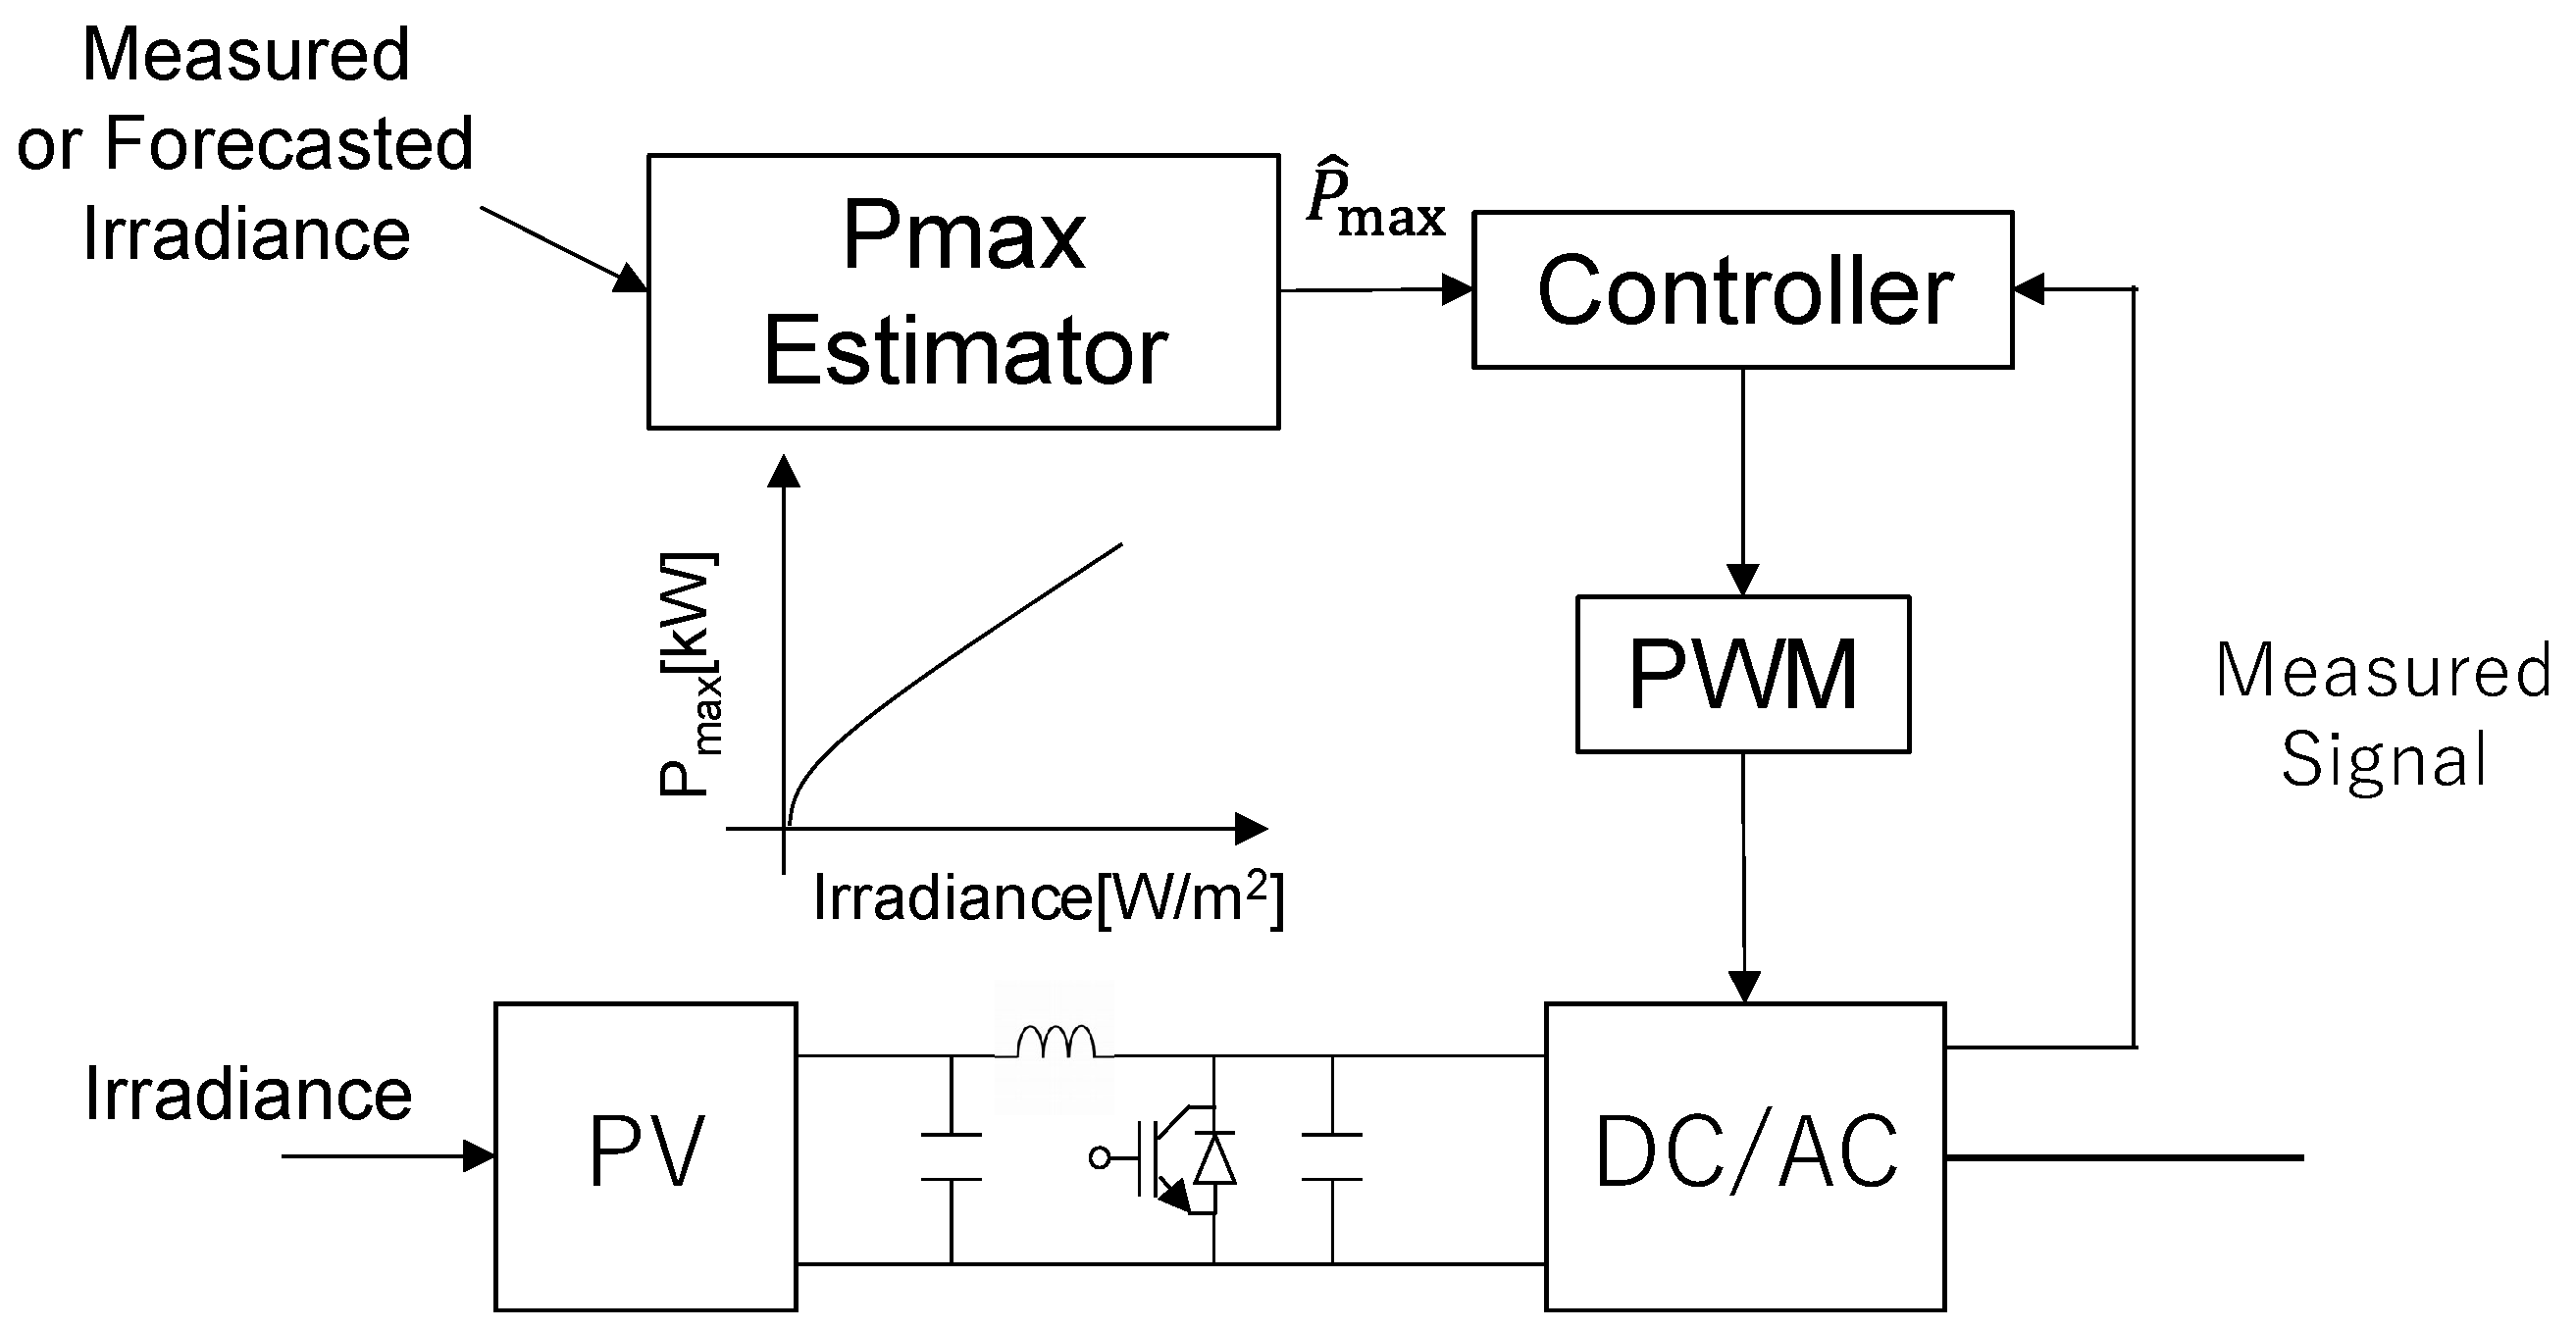
  • The introduction of output limiters to PV-VSMs with maximum power estimation can prevent PV-VSM instability due to a lack of headroom or solar radiation fluctuations.
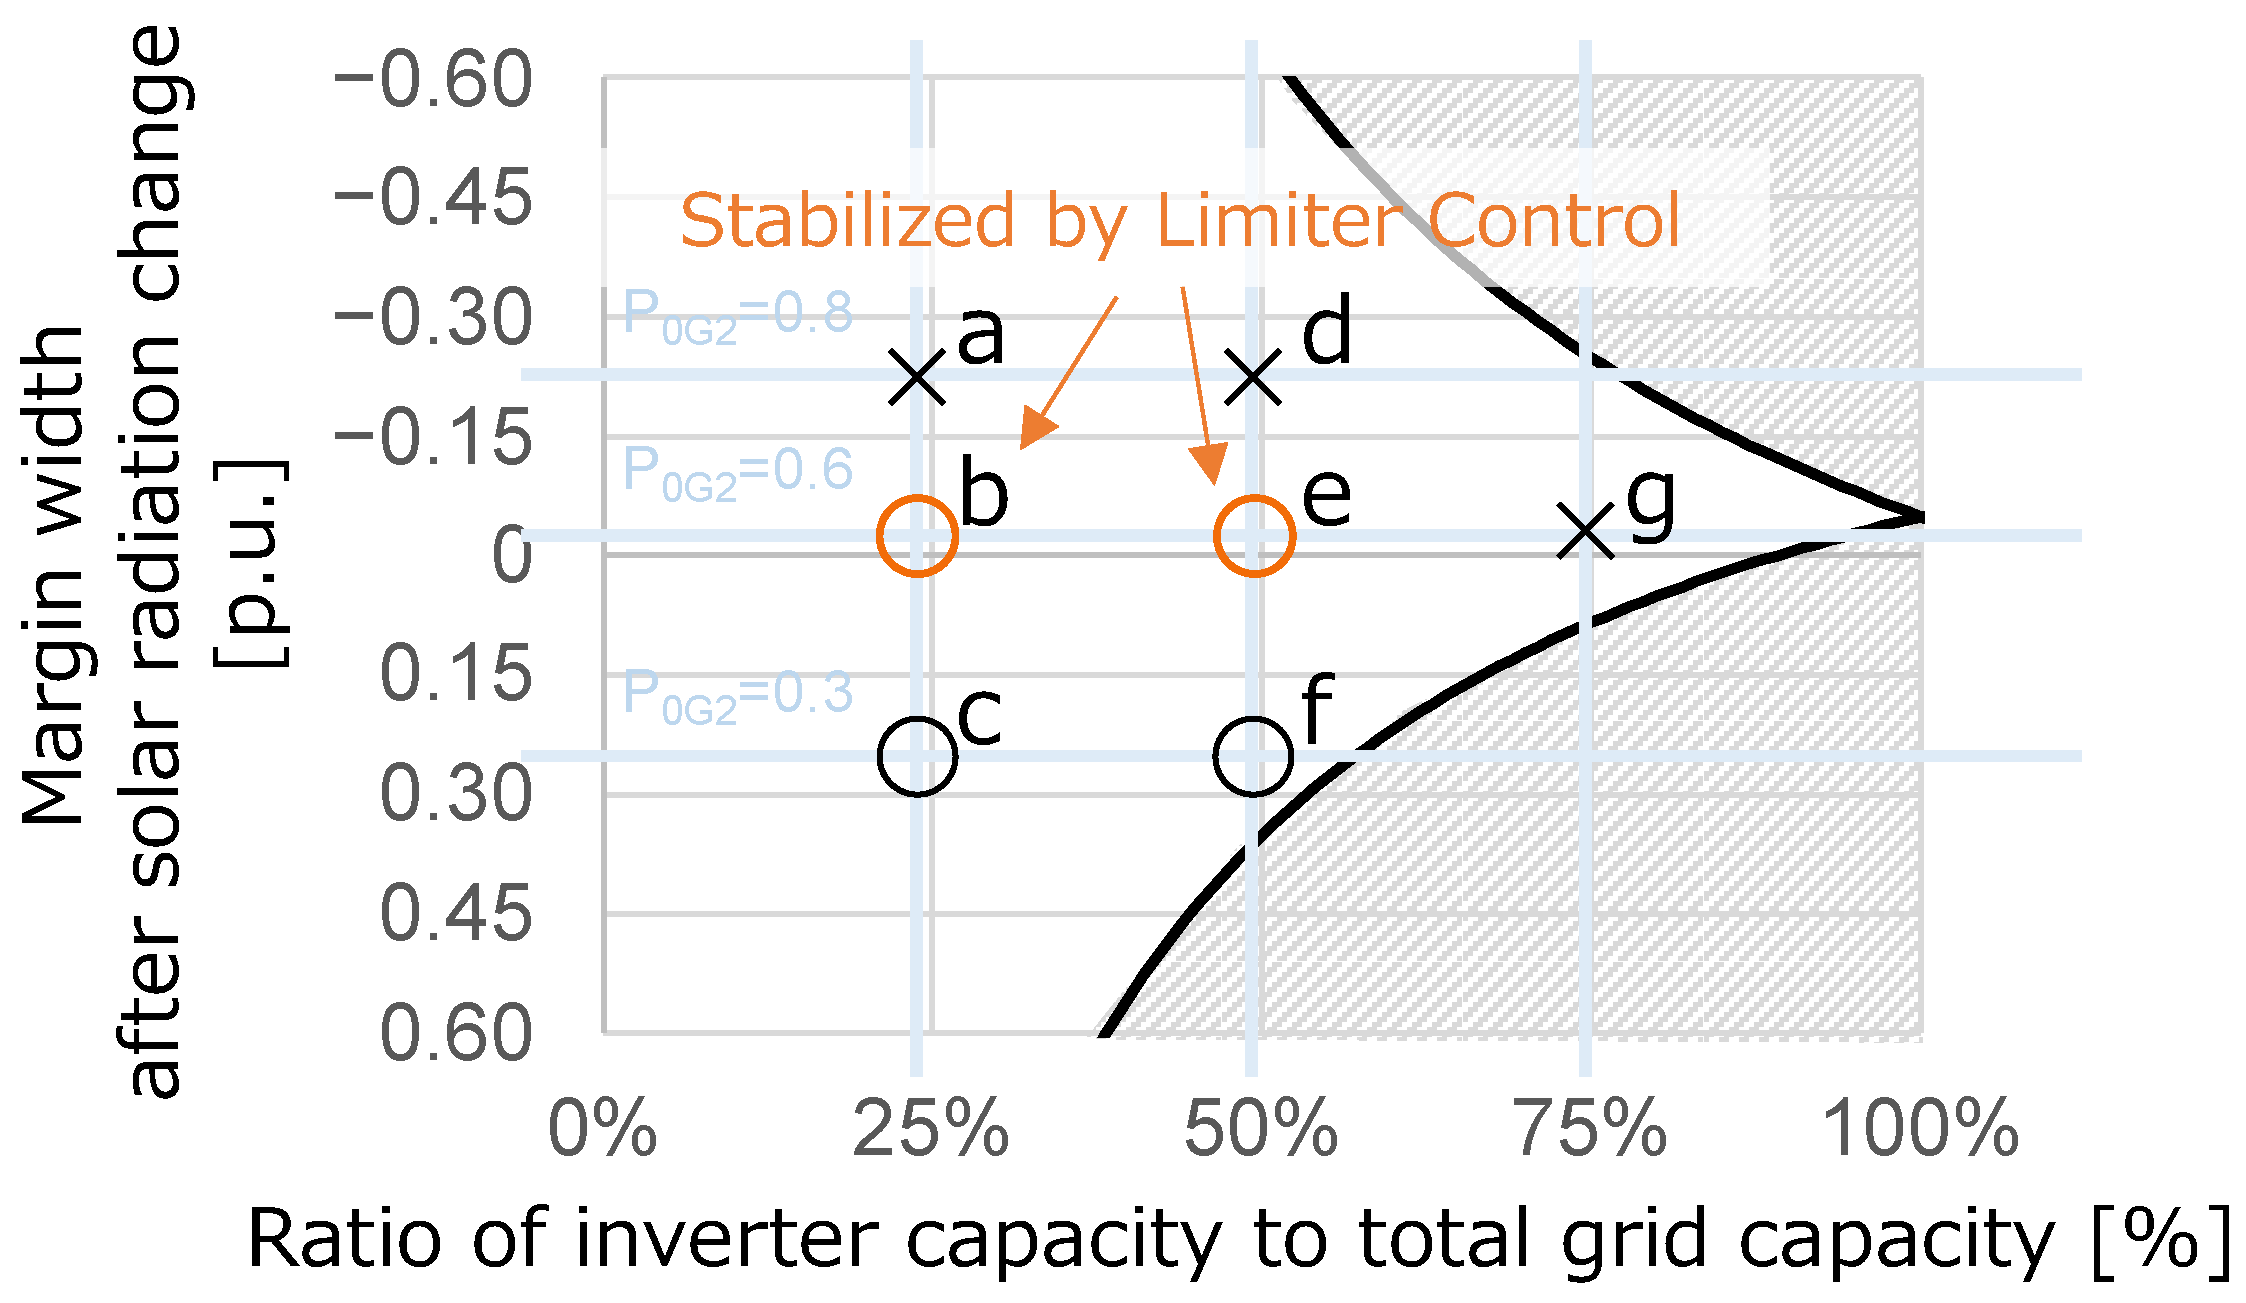
  • However, in case the PV-VSMs’ planned generation is high for their headroom, there is a risk of grid instability due to reduced solar radiation. The instability is caused by PV-VSMs being in output-specified control mode (Grid Follow) due to reduced headroom; that is, estimated PV-VSMs’ virtual energy disappears and causes more imbalance. Consequently, insufficient Primary Frequency Response (PFR) from the synchronous machine becomes impossible to compensate rapid frequency reduction by insufficient grid inertia. Therefore, care must be taken to cope with reduced solar radiation during operation of the reserve power supply by the headroom.
This paper is organized as follows: Section 1 describes the background of the study. Section 2 describes the simulation model used in the analysis of this paper. In Section 3, we simulate the case of insufficient headroom in the FFR of the PV-VSM, and discuss the VSM control problems caused by the absence of inertial energy and how to solve them by using a power limiter. In Section 4, we describe the PV-VSM with output limiting control based on headroom estimation, simulate the system under the assumption of solar irradiance ramp fluctuation and load step-changing, and discuss the issues to be addressed when operating the PV-VSM in the grid. Section 5 summarizes the conclusions.

2. Simulation Model

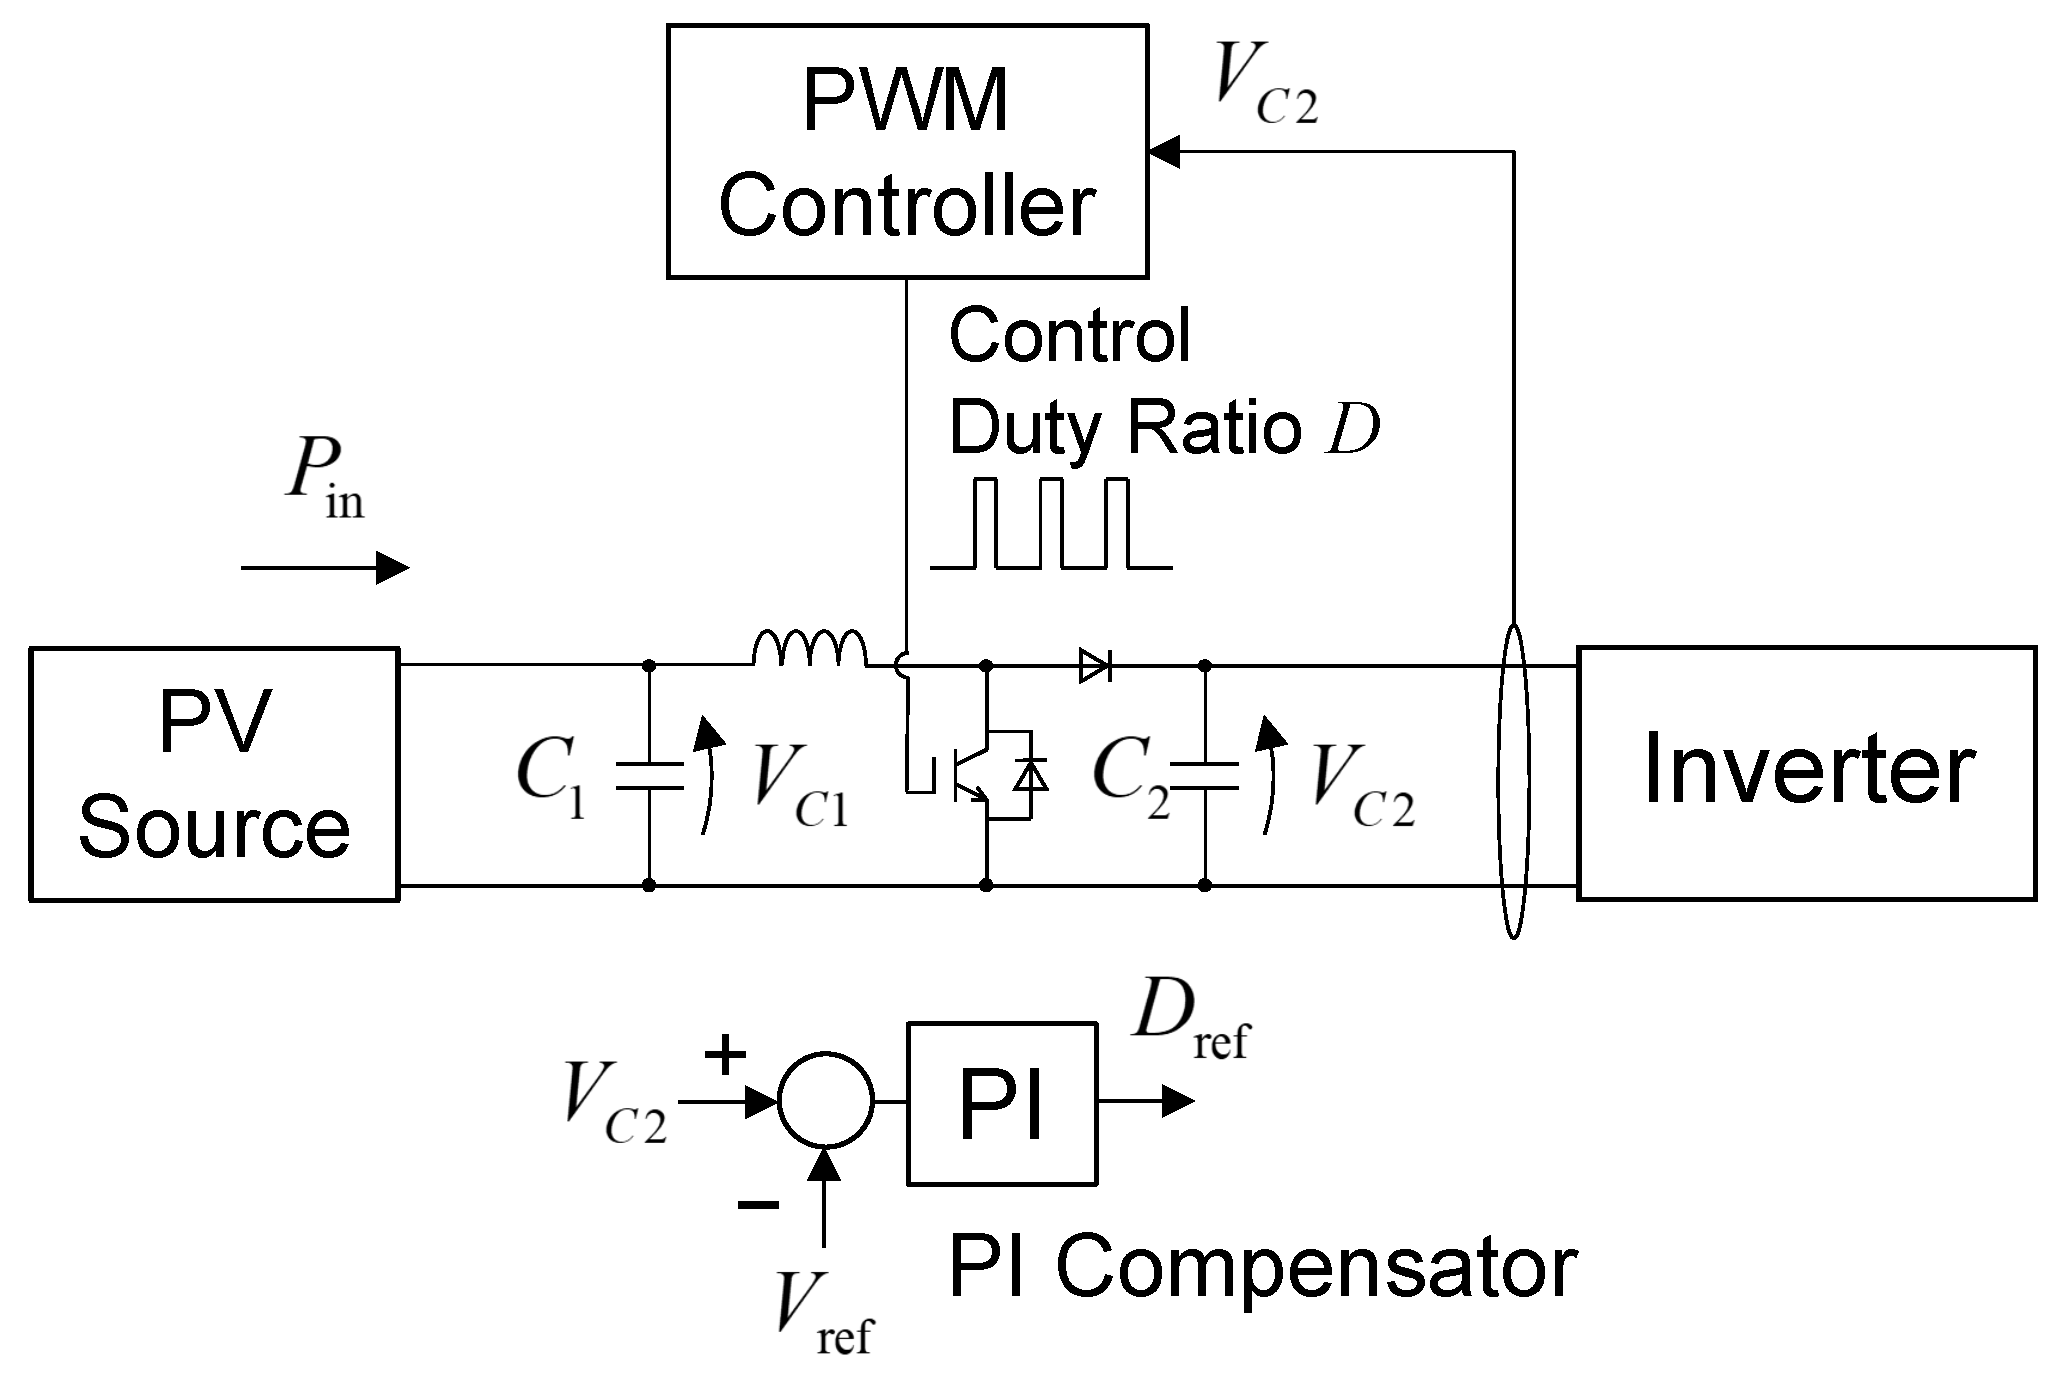
2.1. Photovoltaic Powered Virtual Synchronous Machine

The circuit diagram of the PV-VSM with a two-stage configuration is shown in Figure 2. In this circuit, the PV source is stepped up by the boost converter, and a three-phase AC current is output to the grid through the VSM-controlled inverter. Note that, in our PV-VSM model, the boost converter and the VSM are independently controlled; the boost converter uses the measurement signals on the DC side of the inverter and the VSM uses the measurement signals on the AC side of the inverter. In addition, the rated capacity of the VSM is 100 [kVA], and two PV source models with different capacities were used: large capacity module (PVL) and small capacity module (PVS). PVL enables outputting about 98% of the VSM’s rated capacity, and PVS’s maximum power is given as about 65% of the VSM’s rated capacity under conditions of 1000 [W/m 2 ] of solar irradiance and 298 [K] of temperature. The parameters of the PV-VSM circuit are shown in Table 1.
The control scheme of the VSM algorithm is shown in Figure 3. As the VSM controller in this work, we adopt the phasor-based VSM implementation, which includes the current feedback loop and the auto voltage regulation (AVR) model. In Figure 3, * means the reference signal. This VSM controller simulates the rotor state using a simple swing equation expressed as the following equations:
M d d t ω vir ω * = K ω vir ω * + P * P ,
M = 2 H vir ω *
where H vir is the virtual normalized inertia constant, K is the gain parameter of the virtual governor, ω vir is the angle speed of the virtual rotor, ω * corresponds to the frequency reference signal, which is the constant, and P * and P correspond to the mechanical power and the electrical power in the virtual rotor. That is, virtual rotor speed is given by the following equation from the signals:
ω ^ vir ω ^ * = 1 M s + K P ^ * P ^ ,
where s is the Laplace operator, and ^ is the Laplace transform. VSM is the unique control system in that it uses ω vir as an internal signal to simulate the response from pseudo inertia.
The control strategy on the the DC side of the inverter may take the following three approaches:
(1)
Maximum power point tracking (MPPT);
(2)
Constant voltage control for the primary side of the converter;
(3)
Constant voltage control for the secondary side of the converter.
They commonly adjust the duty ratio of the pulse width modulation signal as a control input to adjust the respective target signal. MPPT control is generally performed by a hill climbing algorithm, which obtains maximum output by updating the operating point in the direction of more output while measuring the PV output; primary and secondary side constant voltage control measures the respective voltages and adjusts the control input based on the difference between the reference value and the measured value using a PI compensator or other means.
Table 2 shows the operational stability of the PV-VSM with each control strategy mounted on a DC/DC converter when connected to the grid model described in the next subsection. MPPT and primary side constant voltage control results in unstable operation of the PV-VSM with the structure represented in Figure 2. These approaches correspond to the direct specification of the PV output by the DC-side controller, and, therefore, an imbalance in the input/output when the VSM control automatically adjusts the AC-side output results unstable operation; it is not appropriate to use these approaches for DC-side control of the PV-VSM unless the VSM cooperates with the DC/DC converter. On the other hand, the PV-VSM operates stably under the secondary-side constant voltage control case. In this case, the DC/DC converter does not directly specify the PV output, but operates to adjust the charge of the secondary-side capacitor: the control system adjusts the PV operating point by compensating for the capacitor voltage that changes in accordance with the VSM output, and therefore this DC/DC converter follows the VSM for contributing to the stable operation of the power conversion system.
From the above, the secondary side constant voltage control is adopted as the DC side control of the PV-VSM in this study and used for simulation. (the Control Scheme of it is shown in Figure 4). In this paper, a simple PI controller is used to generate the reference signal to the PWM. On the other hand, optimally tuning a PID-type controller is also an option, and several studies on tuning the control system of DC/DC converters using meta-heuristic algorithms have been done in recent years [38,39].

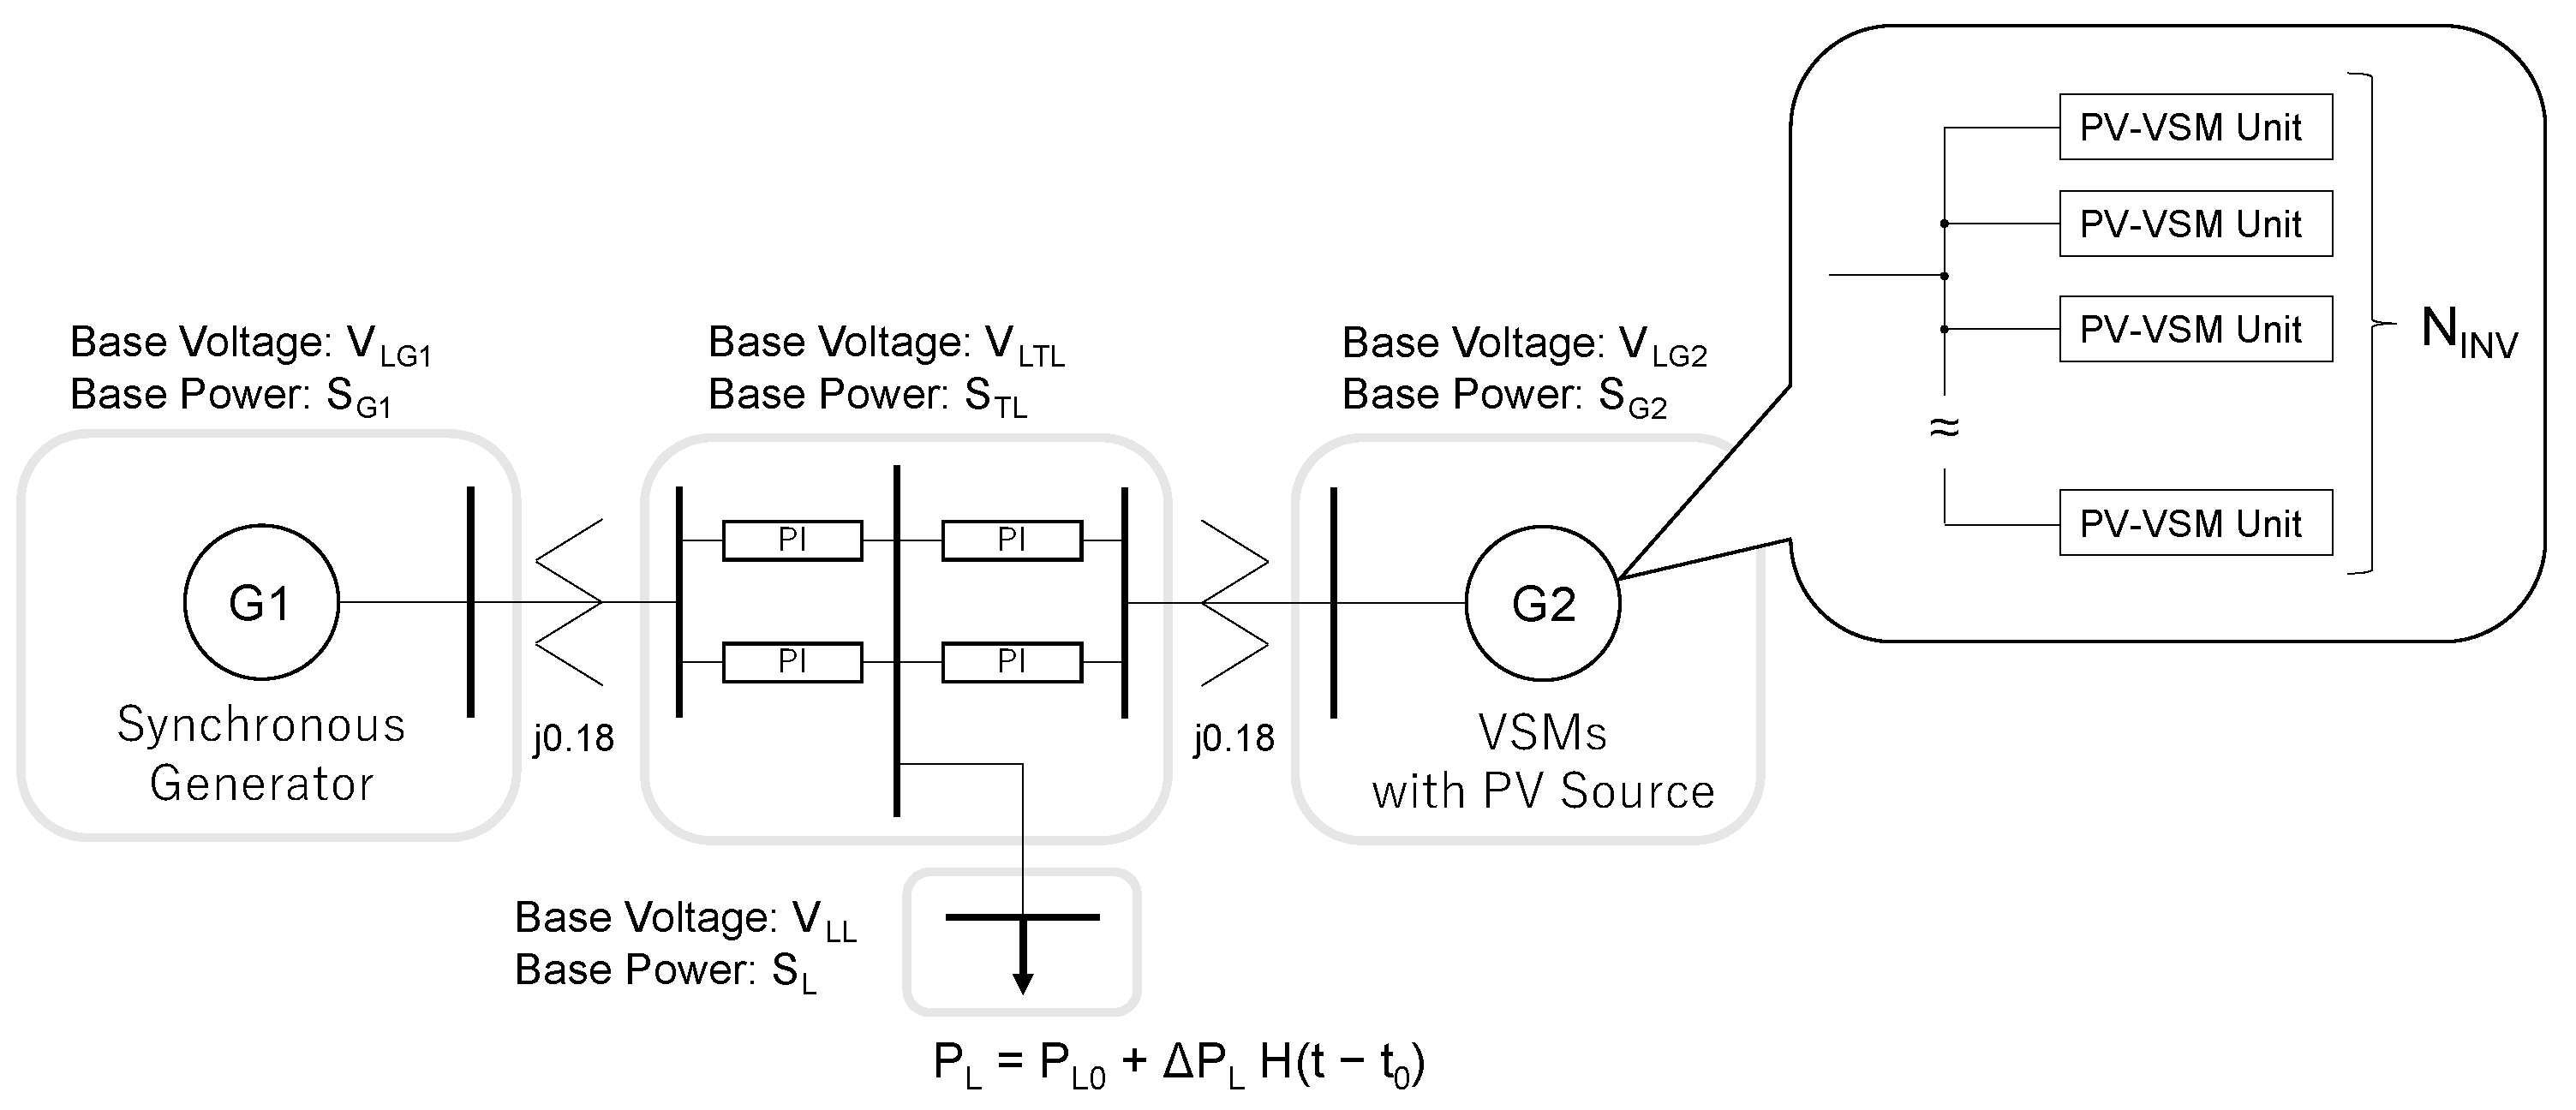
2.2. Two-Generator System Model

To simulate the interaction of the PV-VSM with the grid, a simple two-generator system, represented in Figure 5, is used in the simulation, where the base frequency is given by 50 [Hz]. The system consists of two generator nodes with transformers, a constant power load, and four PI section lines, with G1 as the synchronous generator and G2 representing N INV PV-VSMs connected in parallel to the grid connection point in an aggregated form. The total capacity of the generators is fixed at 2000 MVA, and the capacity of G2 is adjusted to analyze the scenario given different IBRs’ penetration. The capacity of G2 is adjusted by changing the parallel number of the PV-VSMs (100 [kVA/unit]), which is described in the previous subsection ( S G 2 [ MVA ] = N INV [ unit ] × 0.1 [ MVA / unit ] ). The model is configured to simulate disturbances in the system by adding and removing constant power loads by switches in the model, thereby causing a step change in the effective power to the load. The list of grid parameters is shown in Table 3. In this table, the parameters marked ‘Variable’ are those that will be changed for each case in the subsequent simulations. In the synchronous generator model (G1), the dynamic characteristics of the turbine and governor are simulated by the LPT1 model of the Central Research Institute of Electric Power Industry (CRIEPI) [40] as shown in Figure 6 with the parameters in Table 3. Note that the PV-VSMs’ virtual governors do not mimic a detailed model as G1’s turbin&governor; it is simply described by 1st order transfer function 1 / 2 H G 2 s + D G 2 . The two-generator model can simulate generator dropout accidents (load spikes), and its simple structure allows for analysis of the behavior of the VSM during accidents with limited effects on the grid side.
With the above mentioned grid model and PV-VSM, the following two situations will be analyzed by simulation:
  • Step changing load power fluctuation for the PV-VSM with insufficient headroom;
  • Ramp changing irradiance fluctuation for the PV-VSM.

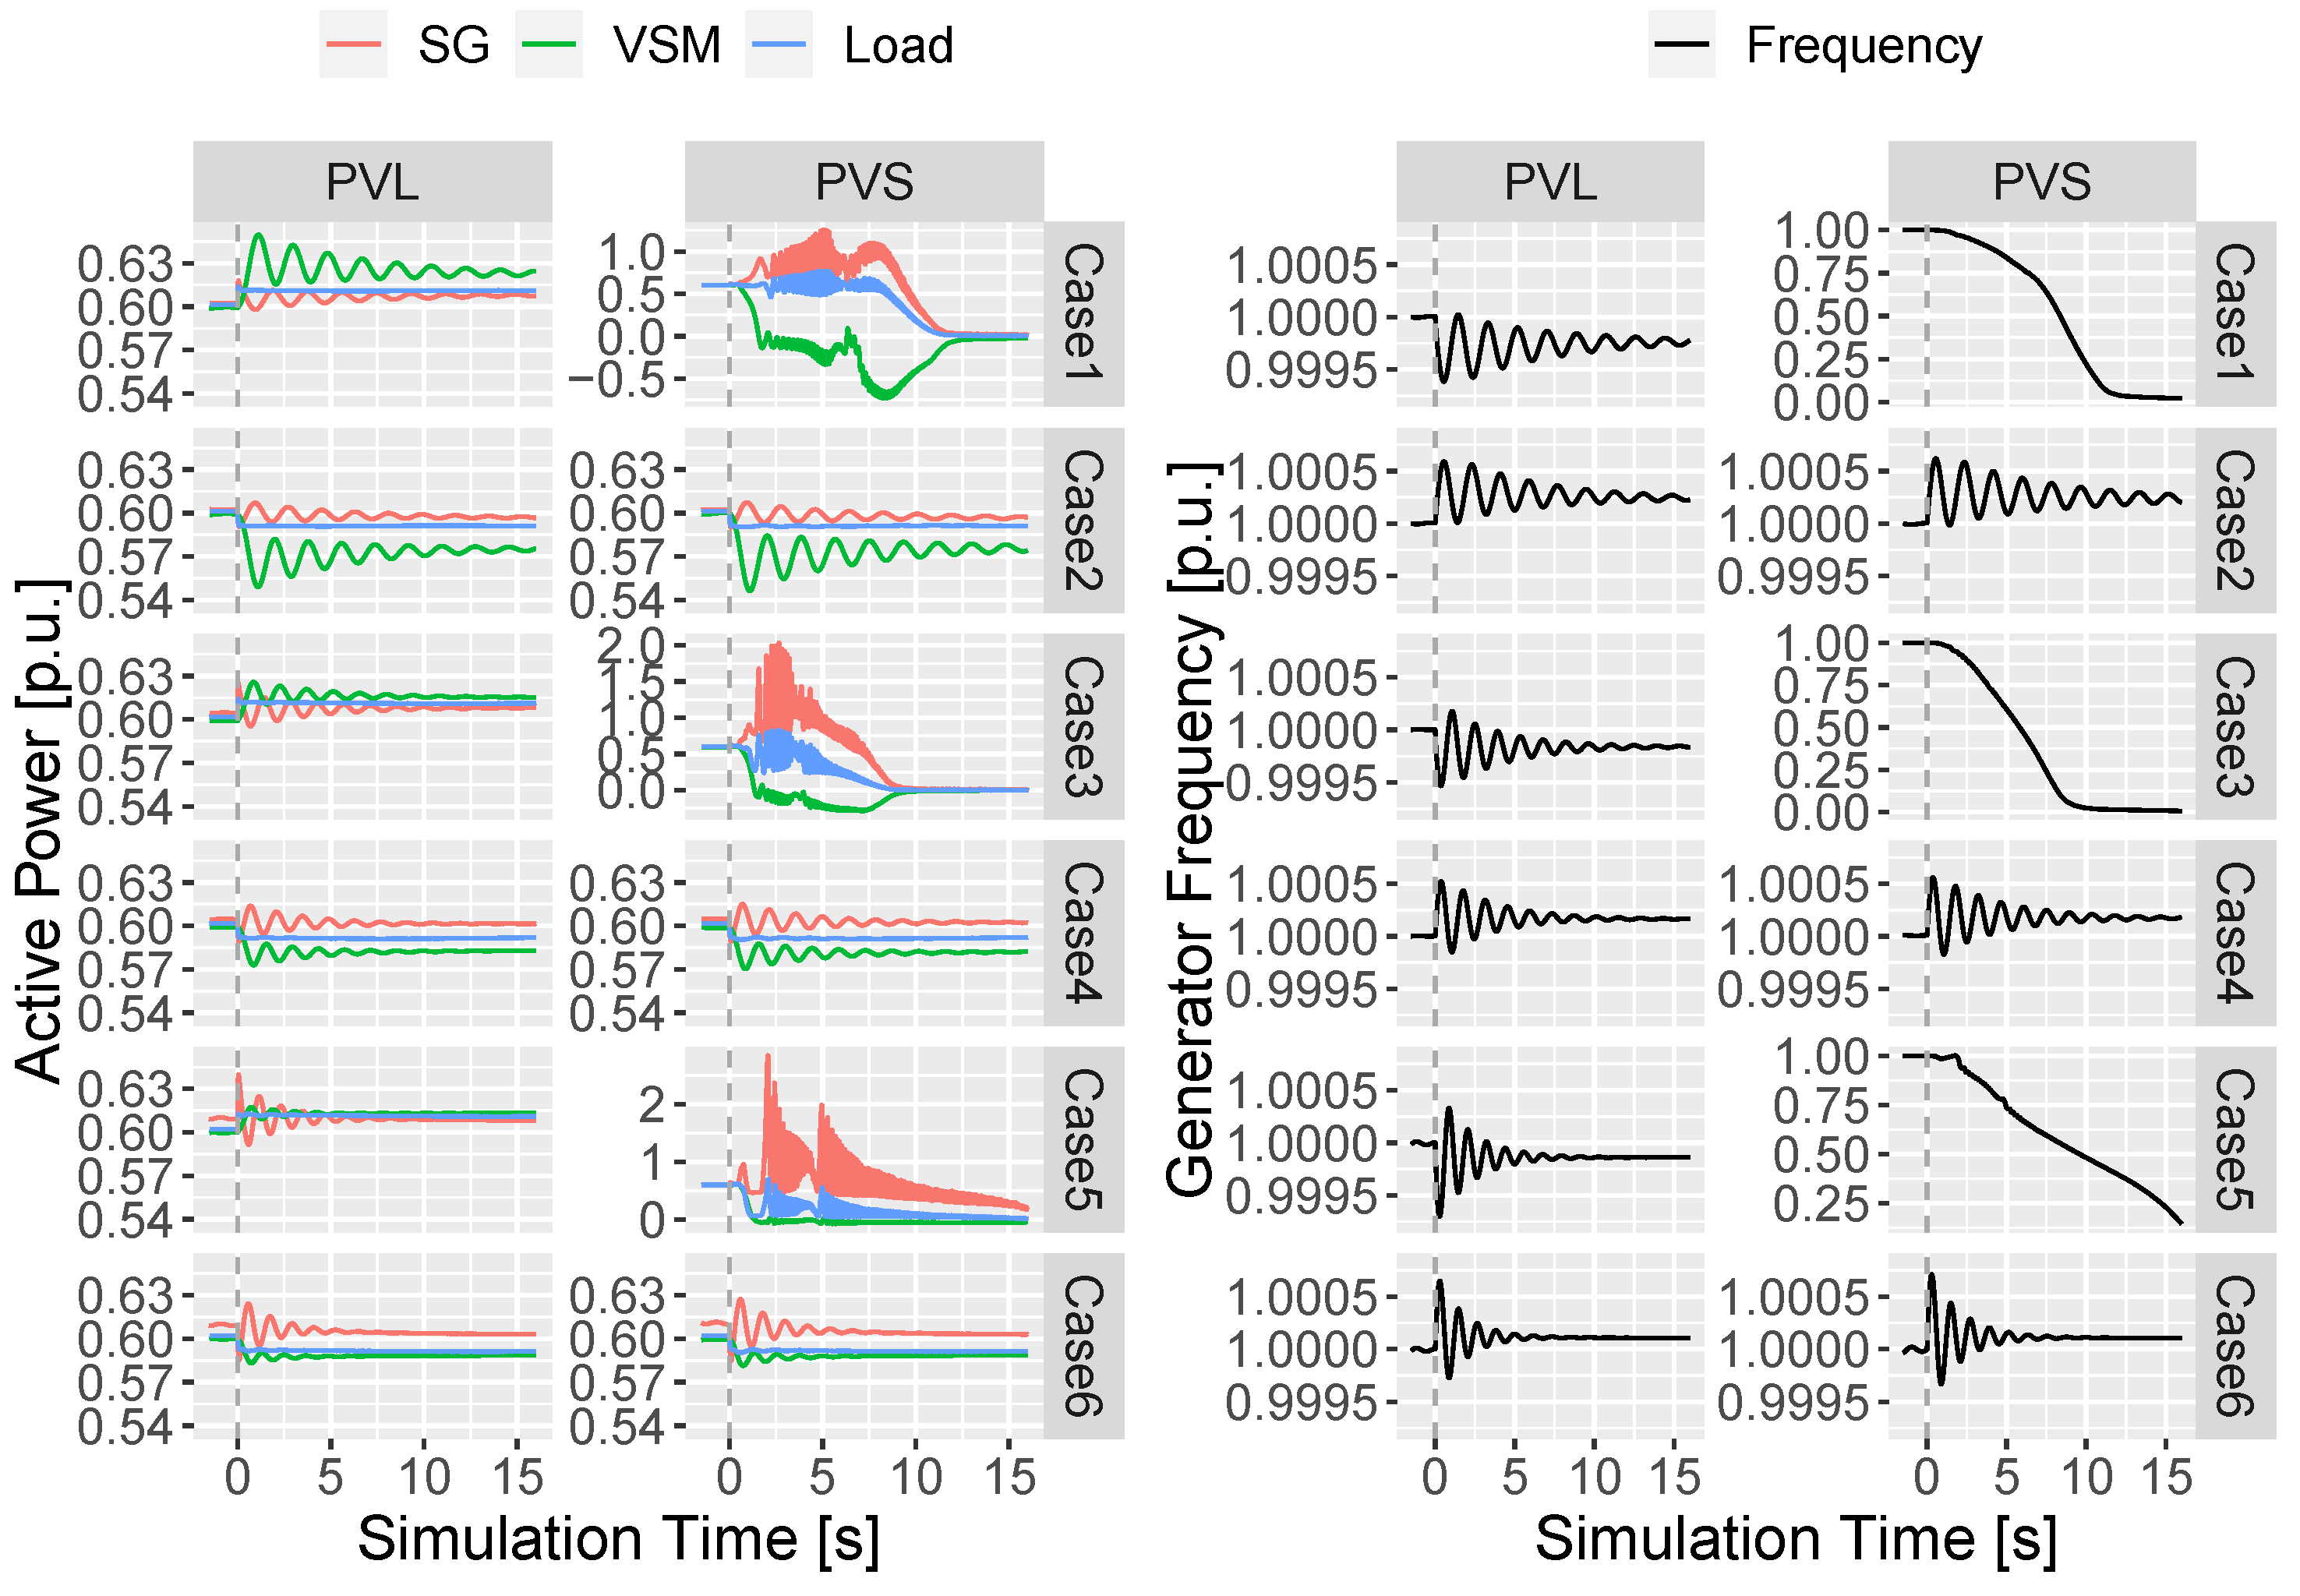
3. Simulation of the Step Changing Load Power Fluctuation

In order to verify the behavior of the PV-VSM in situations where the headroom is insufficient for the required regulation of the power supply due to grid disturbances, simulations are performed by connecting two different modules (PV-L, PV-S) with varying PV capacities in each case shown in Table 4 (12 patterns in total). Each case corresponds to a situation where 1.7% of the load active power at a given time (1% of the base power of the load) increases or decreases in steps on a grid with IBR penetration set at 25%, 50%, and 75%.
The results of the simulations are shown in Figure 7, Figure 8, Figure 9 and Figure 10. In each figure, the time axis represents the elapsed time after the step change in load active power.
In Figure 7, it can be seen that, in the case of decreasing load active power (Case2, Case4, Case6), the PV- VSM operates to suppress the active power output to eliminate the imbalance between generation and supply in the grid, regardless of the PV capacity. As the penetration of the PV-VSM increases, the oscillation of the effective power tends to subside in a shorter time, and the frequency of the synchronous generator also represented in Figure 7 shows that the oscillation of the frequency can be suppressed in a shorter time, regardless of the decrease in inertia. The same tends to be true for the upward output power regulation if the PV source has sufficient capacity. In the simple 1st order transfer function from the swing equation, the time constant is given by 2 H / D , which corresponds to 0.28 and 0.5 for the synchronous generator and PV-VSM, respectively. At first glance, the time constant of the synchronous generator may appear to be smaller than that of the PV-VSM, but, because the synchronous generator is driven by the turbine, mechanical constraints require a longer time to adjust the output by the governor. IBRs are not subject to these constraints, which allows for fast output adjustment, and thus the increase in IBR penetration allows frequency oscillations to be suppressed in a shorter period of time.
For the cases where the headroom (maximum power) of the PV source is insufficient for the required regulating power (Case1:PVS, Case3:PVS and Case5:PVS), it was confirmed that the system became unstable along with the instability of the PV-VSM operation. From Figure 8 and Figure 9, it can be seen that the secondary voltage of the DC/DC converter (the DC side voltage of the inverter) decreases with the imbalance of the input and output power to the capacitor in the destabilized cases. In the control algorithm of PV-VSM, the output voltage command value to the PWM controller is adjusted to increase or decrease the output current in response to changes in the electric angular frequency at the point of interconnection regardless of the PV source capacity. Therefore, the reason for the instability of the operation of the PV-VSM is that the PV-side output power is insufficient to maintain the DC-side capacitor voltage, while the inverter output power has increased due to the decrease in the frequency at the point of interconnection. In addition, it can be seen from Figure 10 that, in the destabilization case, the operating point of the PV power supply moves to the short circuit side after moving to the maximum power point. This means that, if the PV-VSM is operated without a sufficient margin for the maximum output power of PV, there is a possibility of losing the power supplied by the PV-VSM to the grid when contingency occurs. Therefore, to prevent such unstable operation of the PV-VSM, it is necessary to ensure an appropriate margin for the maximum power or to introduce a limiter in the control system.
Ref. [36] has exemplified a few simulation results for which the lack of maximum power of the source makes the VSM unstable. This simulation reinforces their result, which is an important issue for PV-VSMs.
In the next section, the impact of solar radiation fluctuations and load fluctuation on the grid is analyzed in the situation where measures to add limiters are implemented in the PV-VSM.

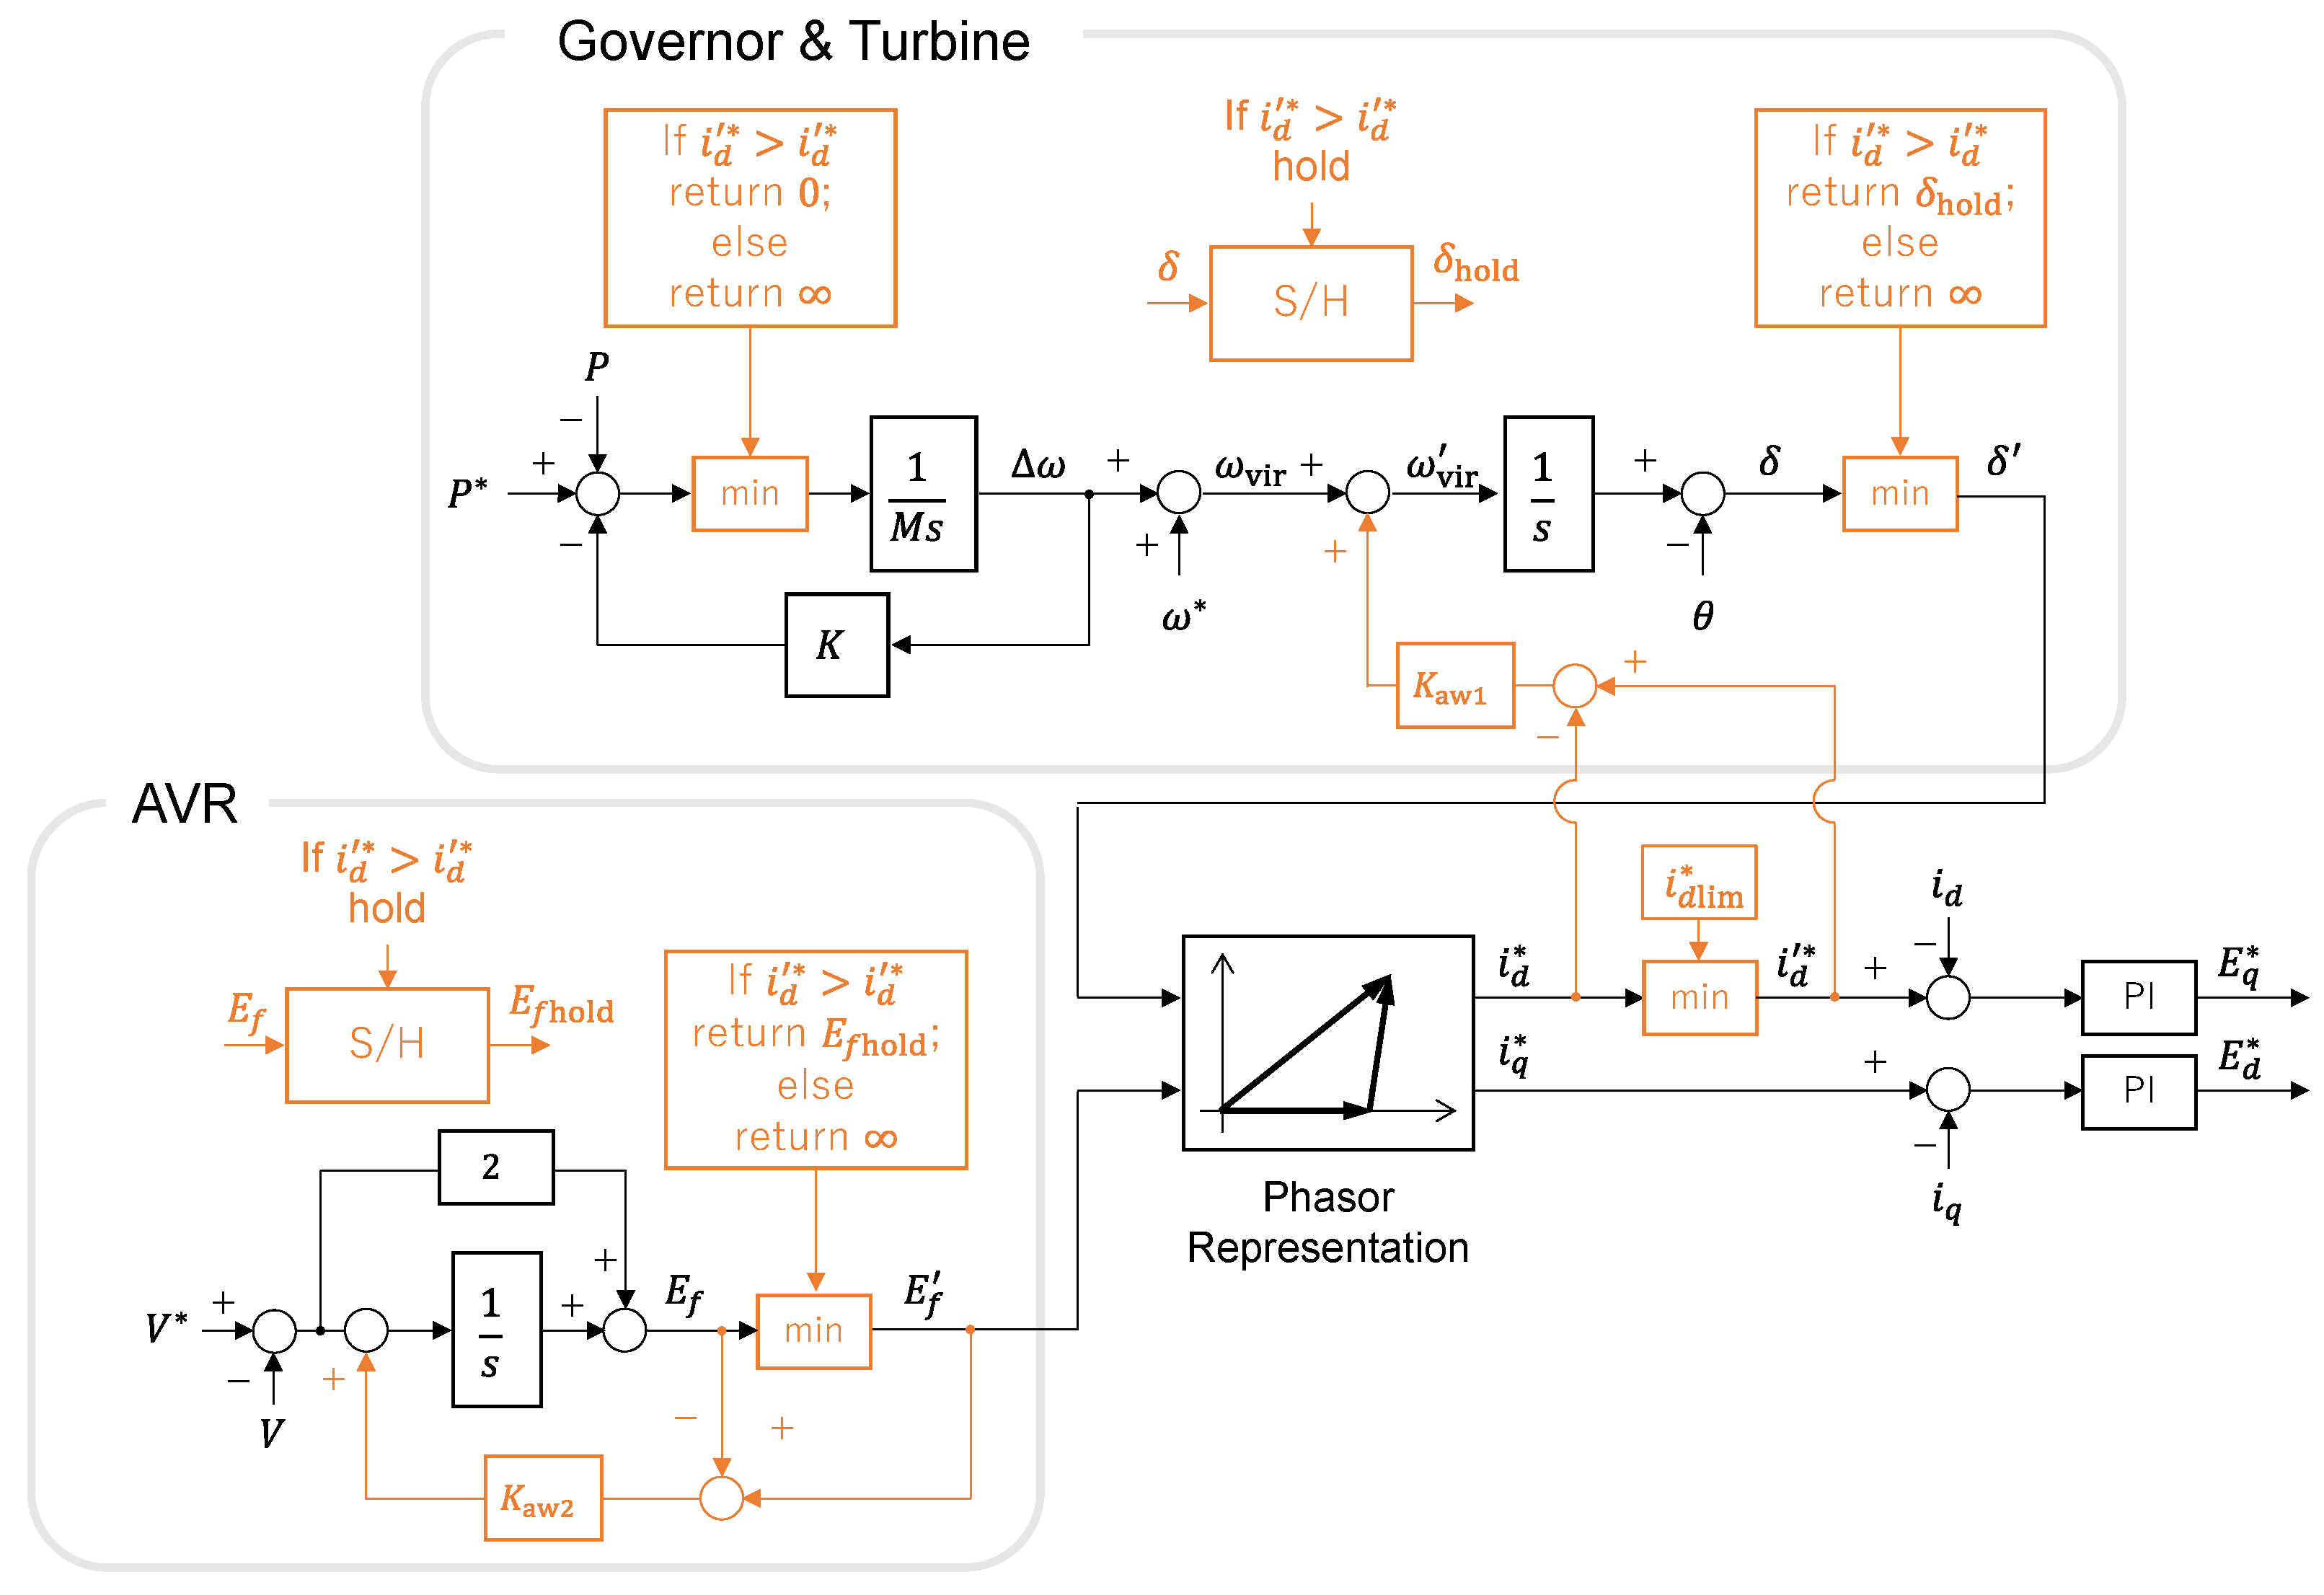
4. Photovoltaic Powered Virtual Synchronous Machine with a Limiter Control System

4.1. Scheme of the Limiter Control System

The necessity to introduce limiters in VSMs is often discussed as overcurrent protection for inverters, not limited to power source side restrictions. This is because the switching semiconductors in inverters have a short thermal time constant, and, from the standpoint of damage prevention, it is necessary to protect against the high currents that could occur when mimicking a synchronous generator; synchronous generators could support about 7 [p.u.] overcurrent, while the inverters could only support less than 0.4 [p.u.] overcurrent [41].
A detailed review is reported in [32] on methods to address the VSM overcurrent issue. There are two broad categories: when an overcurrent threat occurs, switching the VSM to current source mode (Grid-following mode [GFL]) temporarily or keeping it controlled as a voltage source mode (Grid-forming mode [GFM]) by changing the virtual impedance.
An example of the former implementation is upper limit control by a current saturator or current saturation algorithm [42,43]. In this approach, a threshold value is set for the d-/q-axis currents, and overcurrents are prevented by substituting a certain saturation value for the current command value that exceeds the threshold value. Adding a current saturation algorithm to the VSM is one effective approach with low implementation cost because it does not necessarily require an additional PLL, but the possibility that it could lead to instable operation due to windup has been pointed out [44,45]. To cope with this problem, Orihara proposed a modification technique of the virtual internal induced voltage of the VSM by adding an anti-windup mechanism to the current saturation algorithm, and evaluated its effect on the frequency response performance [46].
Figure 11 shows the block diagram of the PV-VSM control algorithm with output power limiter in this study, where anti-windup gains are set at K aw 1 = 2 and K aw 2 = 1 . As the power limiting strategy, the anti-windup mechanism and saturators are applied to the virtual load angle and virtual field voltage of the PV-VSM. This control system limits output power by using a d-axis current saturator. The virtual load angle and virtual field voltage are held and limited when current saturation is detected. An anti-windup mechanism is used to compensate for the integrator that calculates the virtual rotor angle and Integral-control of the auto voltage regulator. By adjusting the upper limit of the command d-axis current i d limit * according to the solar irradiance, it is possible to prevent unstable operation of the PV-VSM when the VSM requires the power over the headroom. That is, the objective can be achieved by adjusting the parameter by the following equation:
i d limit * = P max i q E q E d ,
where P max is the maximum power output of PV source, i d limit * is the limit of the d-axis current, i q is the q-axis current, and E d and E q are the d-axis and the q-axis virtual internal voltage. Note that these are the parameters expressed in the phasor diagram with the terminal voltage at the grid connection point as the starting point.
While the above system enables control of the PV-VSM upper limit, issues remain regarding the appropriate method of determining the available power; the maximum power point needs to be properly estimated for the active power reserve. Literature reviews of the available power determination (headroom estimation) are reported in [47,48], and the PV-VSM controller may choose an option from the following approaches: sensors based approach [49,50]; entering MPPT mode periodically [51]; coordinate control by master&slave inverters [35,52]; and estimating PV characteristic by a curve fitting [53,54,55].
The PV-VSM upper limit control of this study is shown in Figure 12. The mechanism to estimate the maximum power based on solar irradiance measures or forecasts was adopted. The advantage of this method is that it does not use MPPT control, thus it does not require the coordination of the DC/DC converter and VSM, and the algorithm is easier to implement than the curve fitting method. However, this method is not necessarily optimal when sensor implementation costs and estimation accuracy and delay are considered. In this study, for the initial investigation, this control scheme was applied to the PV-VSM.

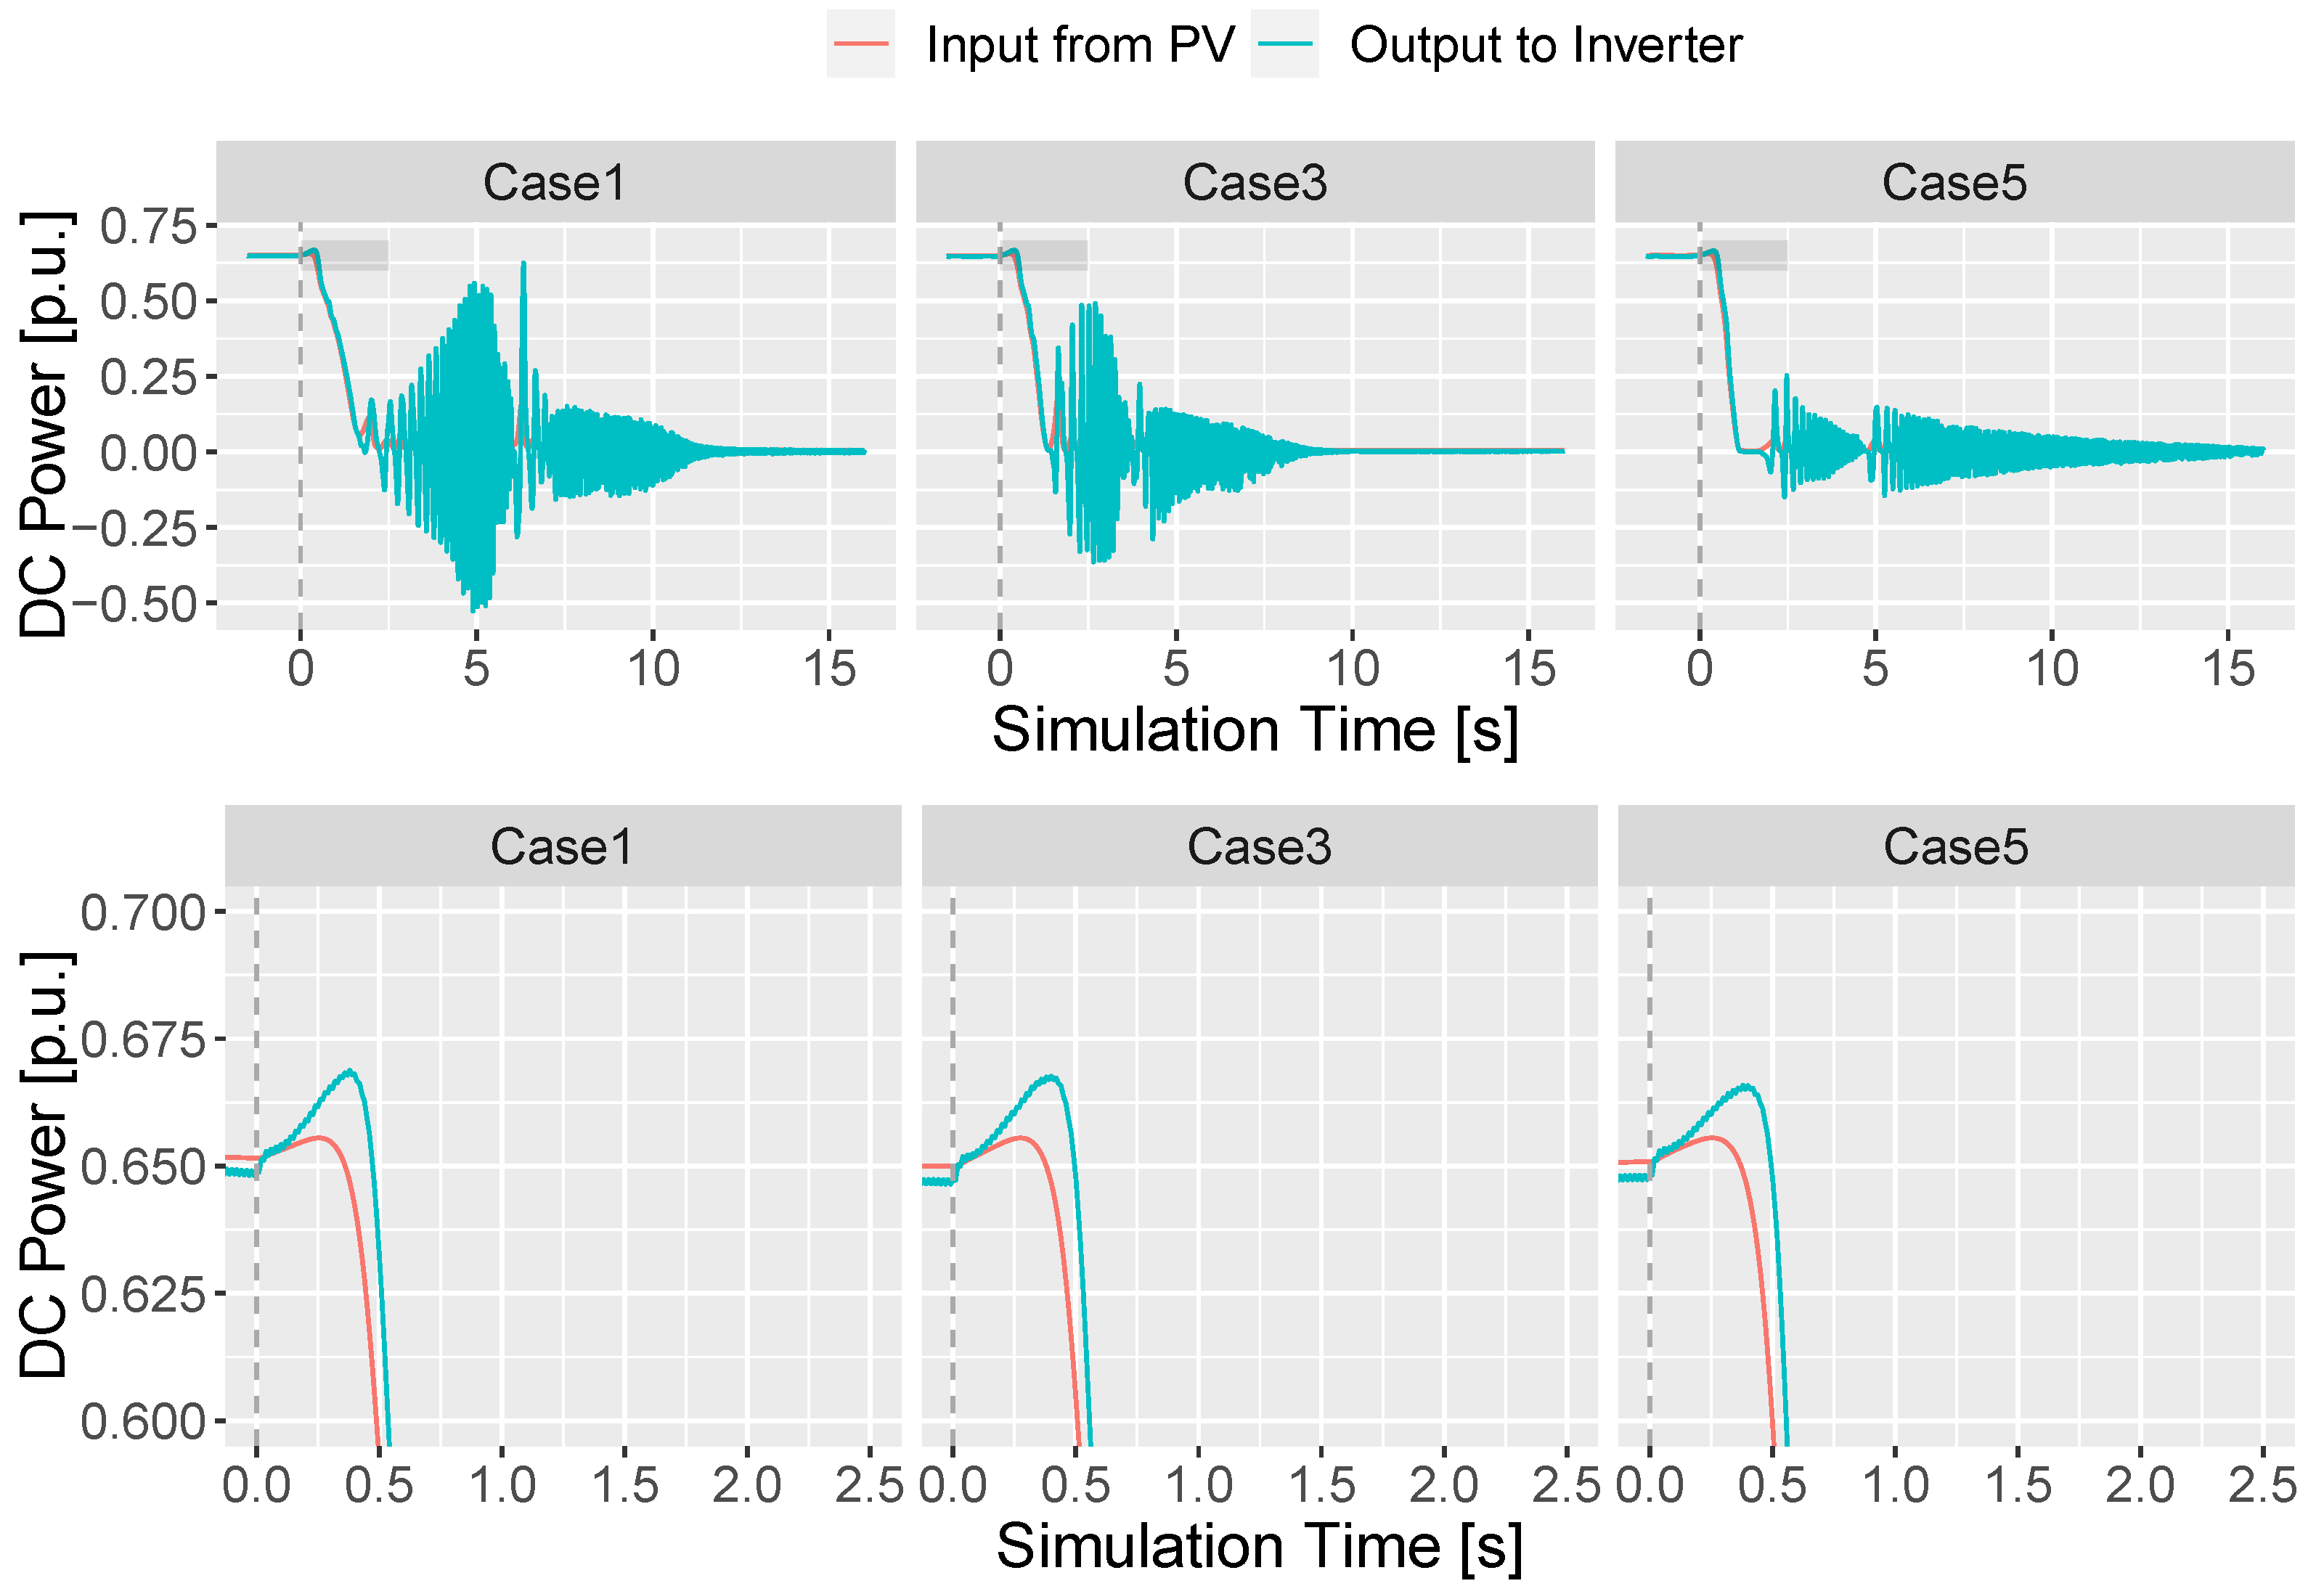
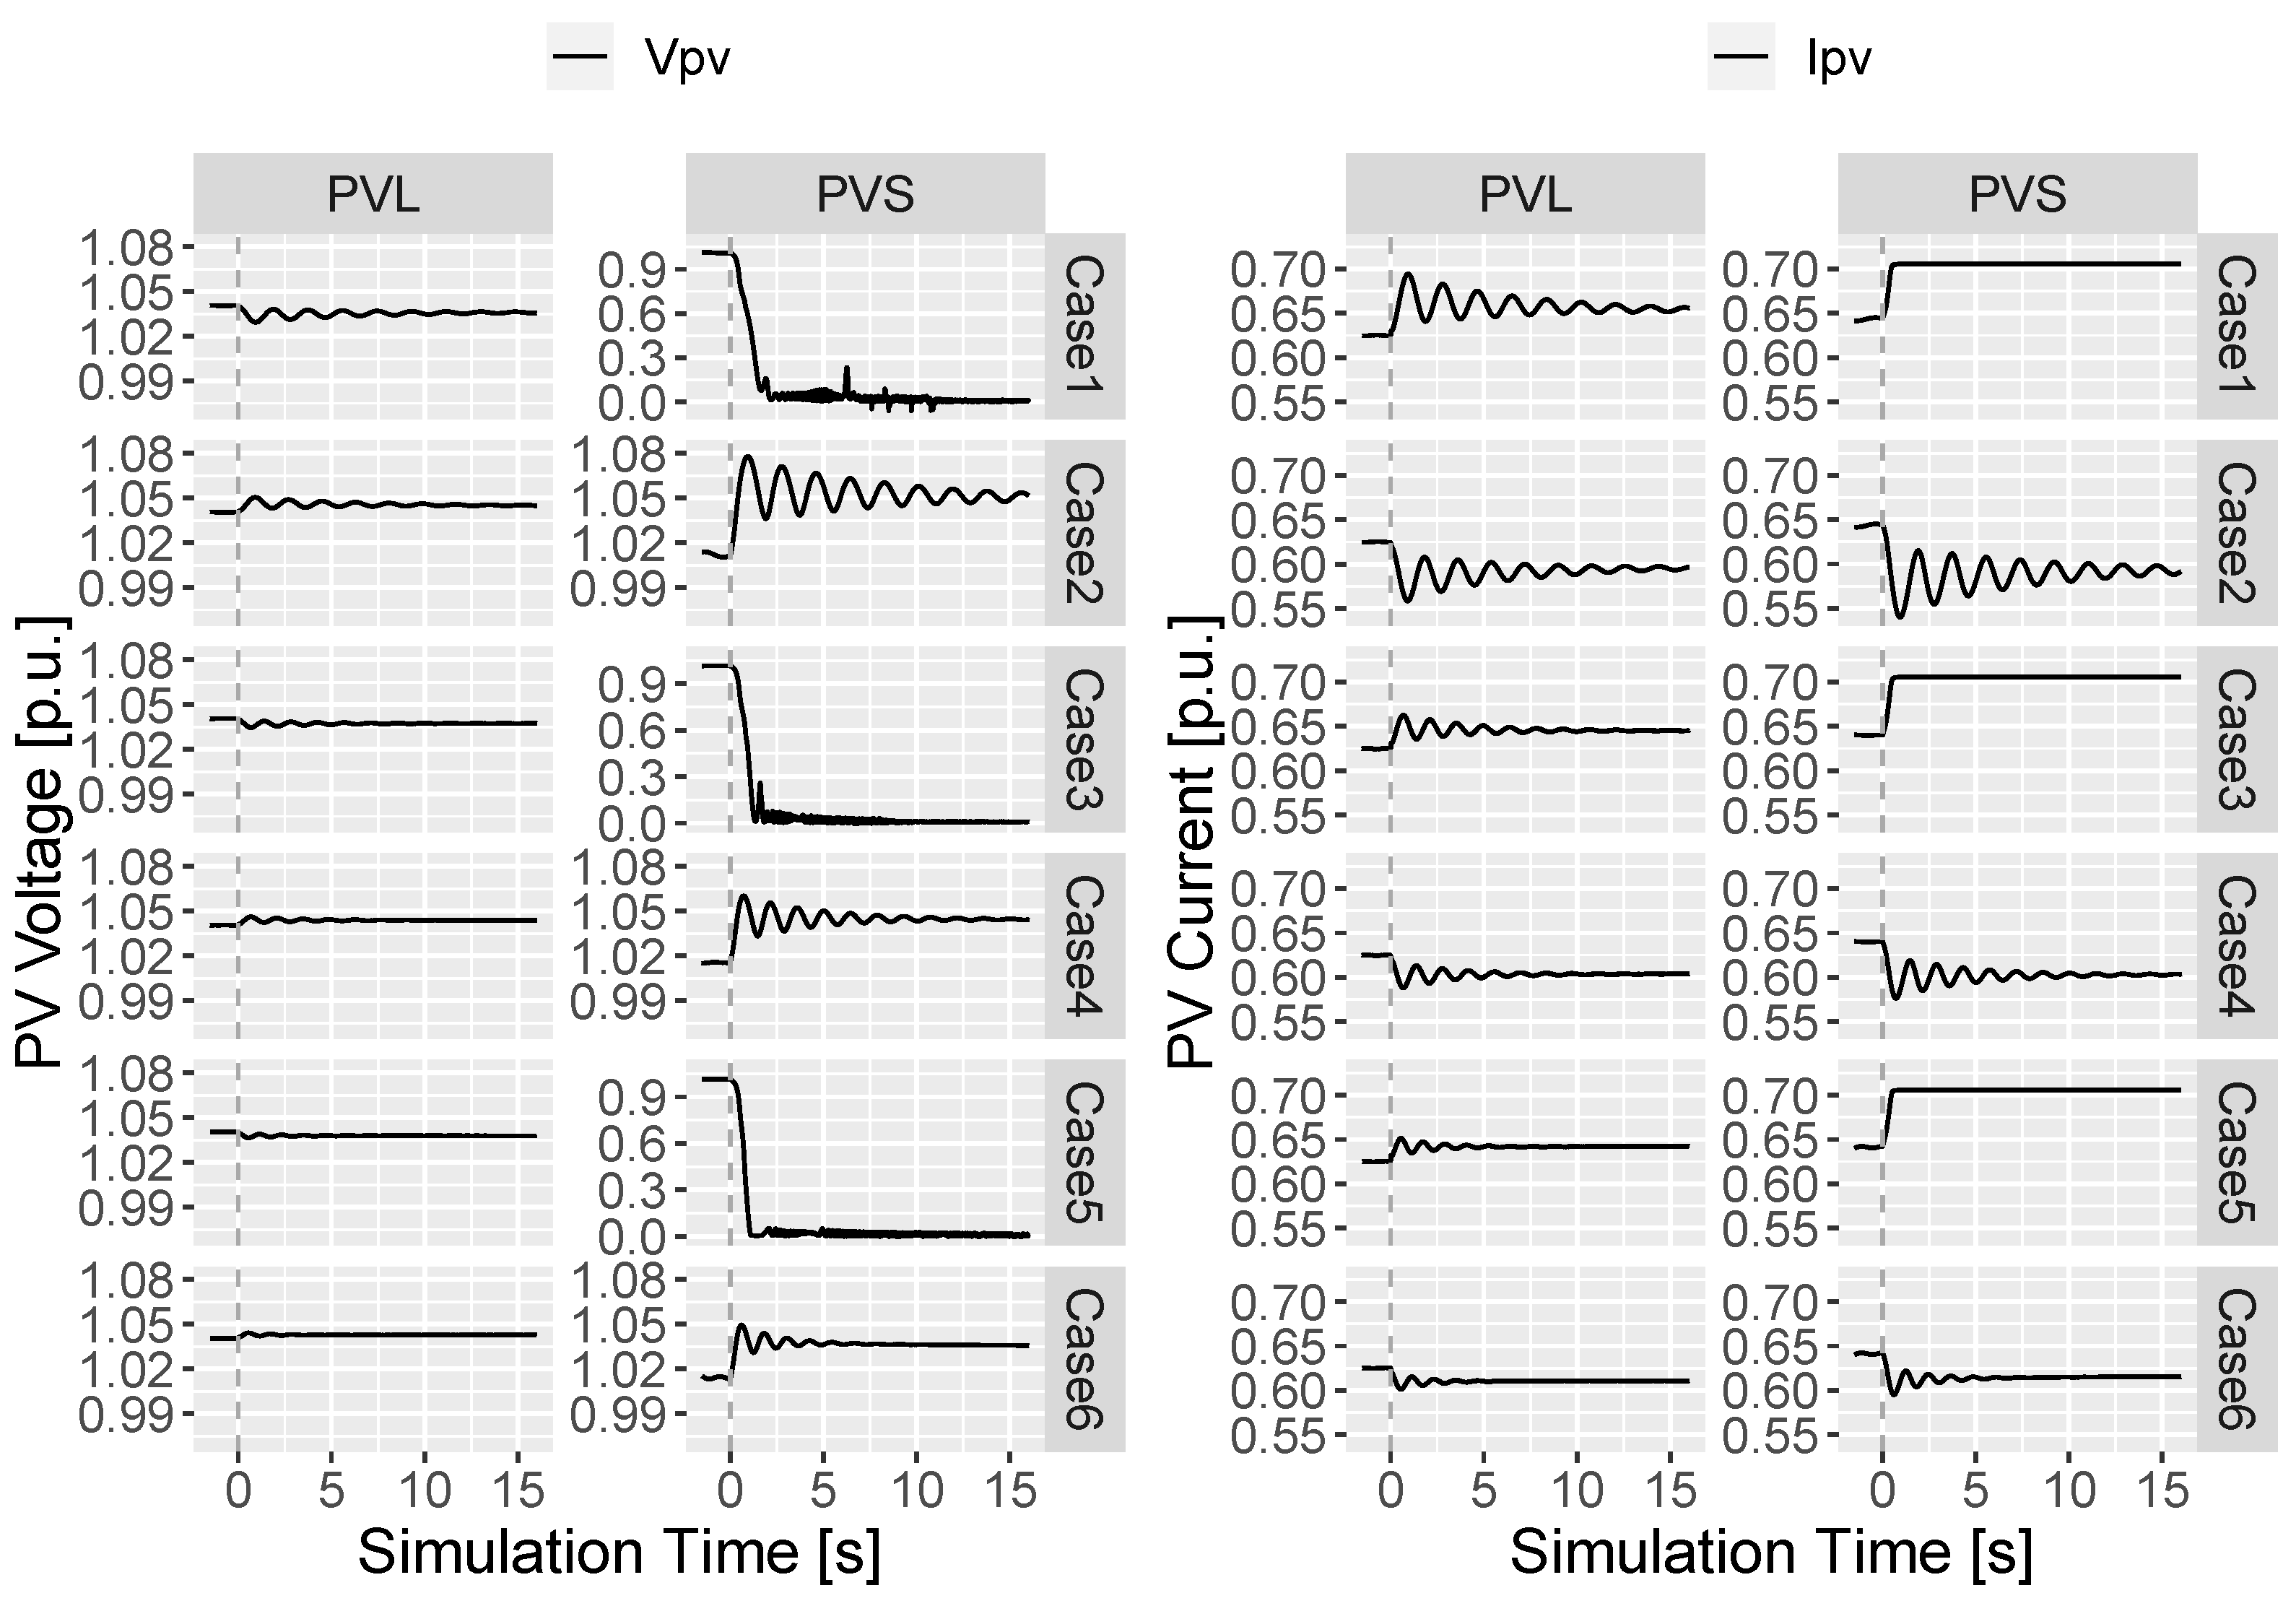
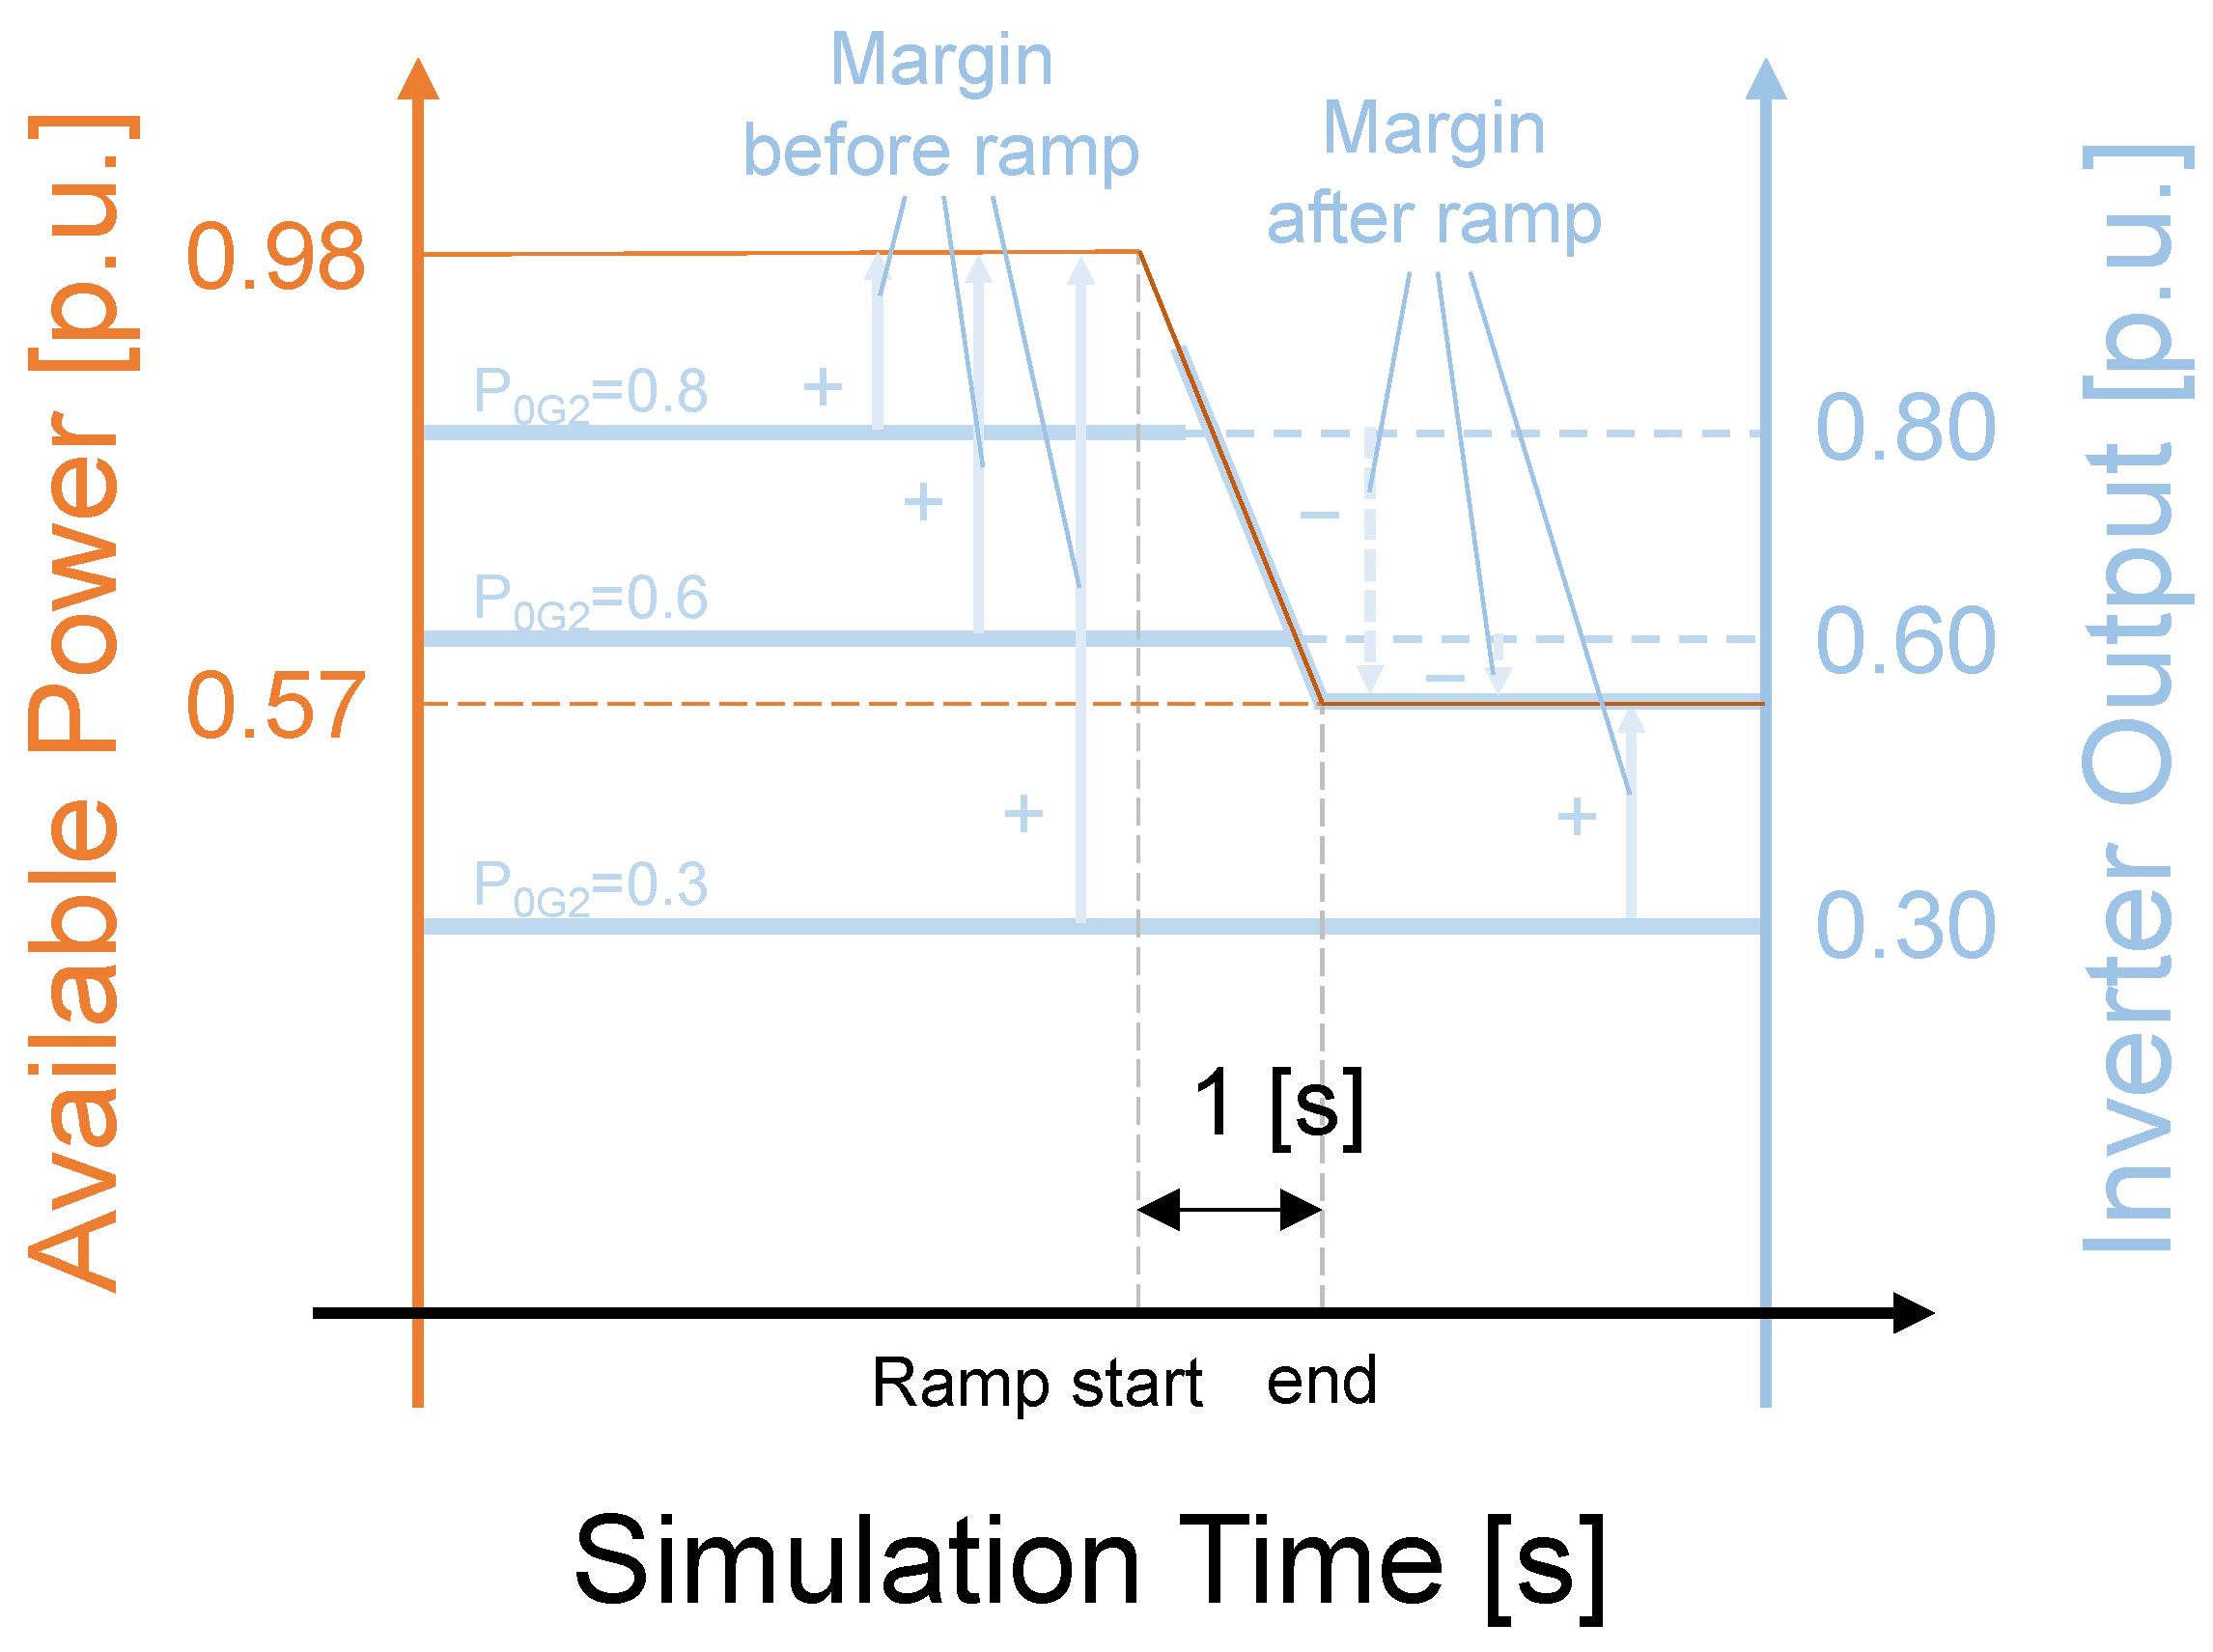
4.2. Simulation Results for Solar Power Fluctuation

When available power is estimated for PV- VSM as an operational condition of the grid, it is necessary to make a decision on what percentage of the available power should be reserved as reserve supply power. In other words, in the fixed demand case, changing the output ratio of synchronous generators and PV-VSMs is a situation that simulates different cases of supply and demand planning. In order to check the impact of the ramp variation of solar radiation on the grid in such a situation, simulations are performed according to the parameters shown in Table 5. Here, the solar radiation is varied from 1000 [W/m 2 ] to 680 [W/m 2 ] in 1 [s] in the situation where the initial cross section is formed.
Each simulation setting corresponds to a situation where the PV-VSM is operated with its initial output set to 80%, 60%, and 30% of capacity when the PV-VSM has 25%, 50%, and 75% of capacity relative to the total system capacity. (Note that combinations that are not possible as a system setup are excluded.) The PV source is PVL, and the maximum power decreases with solar radiation changes: the available power of the PV-VSM shrinks from 0.98 [p.u.] to 0.57 [p.u.] relative to the base power. Figure 13 shows the change in available power and inverter output before and after the ramp change. Even if the PV-VSM plans an operation with a margin range (headroom) before the solar irradiance fluctuation, a large fluctuation will result in a negative margin, which implies a deficiency imbalance from the planned PV generation.
The results for the grid stability under solar radiation fluctuations for each operating condition are represented in Figure 14, Figure 15 and Figure 16 showing the transient response of the grid’s active power flow and the generator frequency. Here, the areas of parameters that cannot be set as initial settings are shaded. (i.e., parameter areas where the rated output of the synchronous machine is exceeded [ P 0 G 1 1.0 [ p . u . ] ] or stopped [ P 0 G 1 0.0 [ p . u . ] ]). The vertical axis of each figure represents the margin after solar radiation fluctuation, and the negative value corresponds to the fall from the initial operating output.
In the case of the PV-VSM with limiter control, it can be confirmed that the grid can be operated stably even if the available power falls short of the initial operating state by about 0.05 [p.u.] due to solar radiation fluctuations in the cases where IBR penetration is lower than 75% (Case b and Case e). On the other hand, in cases where the decrease in available power is significantly large, the system cannot be operated stably even if a limiter control mechanism is used. Even if the unstable operation of the PV-VSM can be eliminated by the limiter control measures, the power supplied to the grid will decrease due to solar radiation fluctuations. Therefore, in an operation plan with a high PV-VSM output ratio, the synchronous generator cannot compensate in time for the power shortage imbalance caused by solar radiation fluctuations; and the grid becomes unstable by the fast frequency descending due to the small system inertia. The above results suggest that, in PV-VSM operation, it is important not only to improve the control algorithm of the inverter itself, but also to manage risk in terms of supply-demand planning and appropriate sizing of the available power reserve.

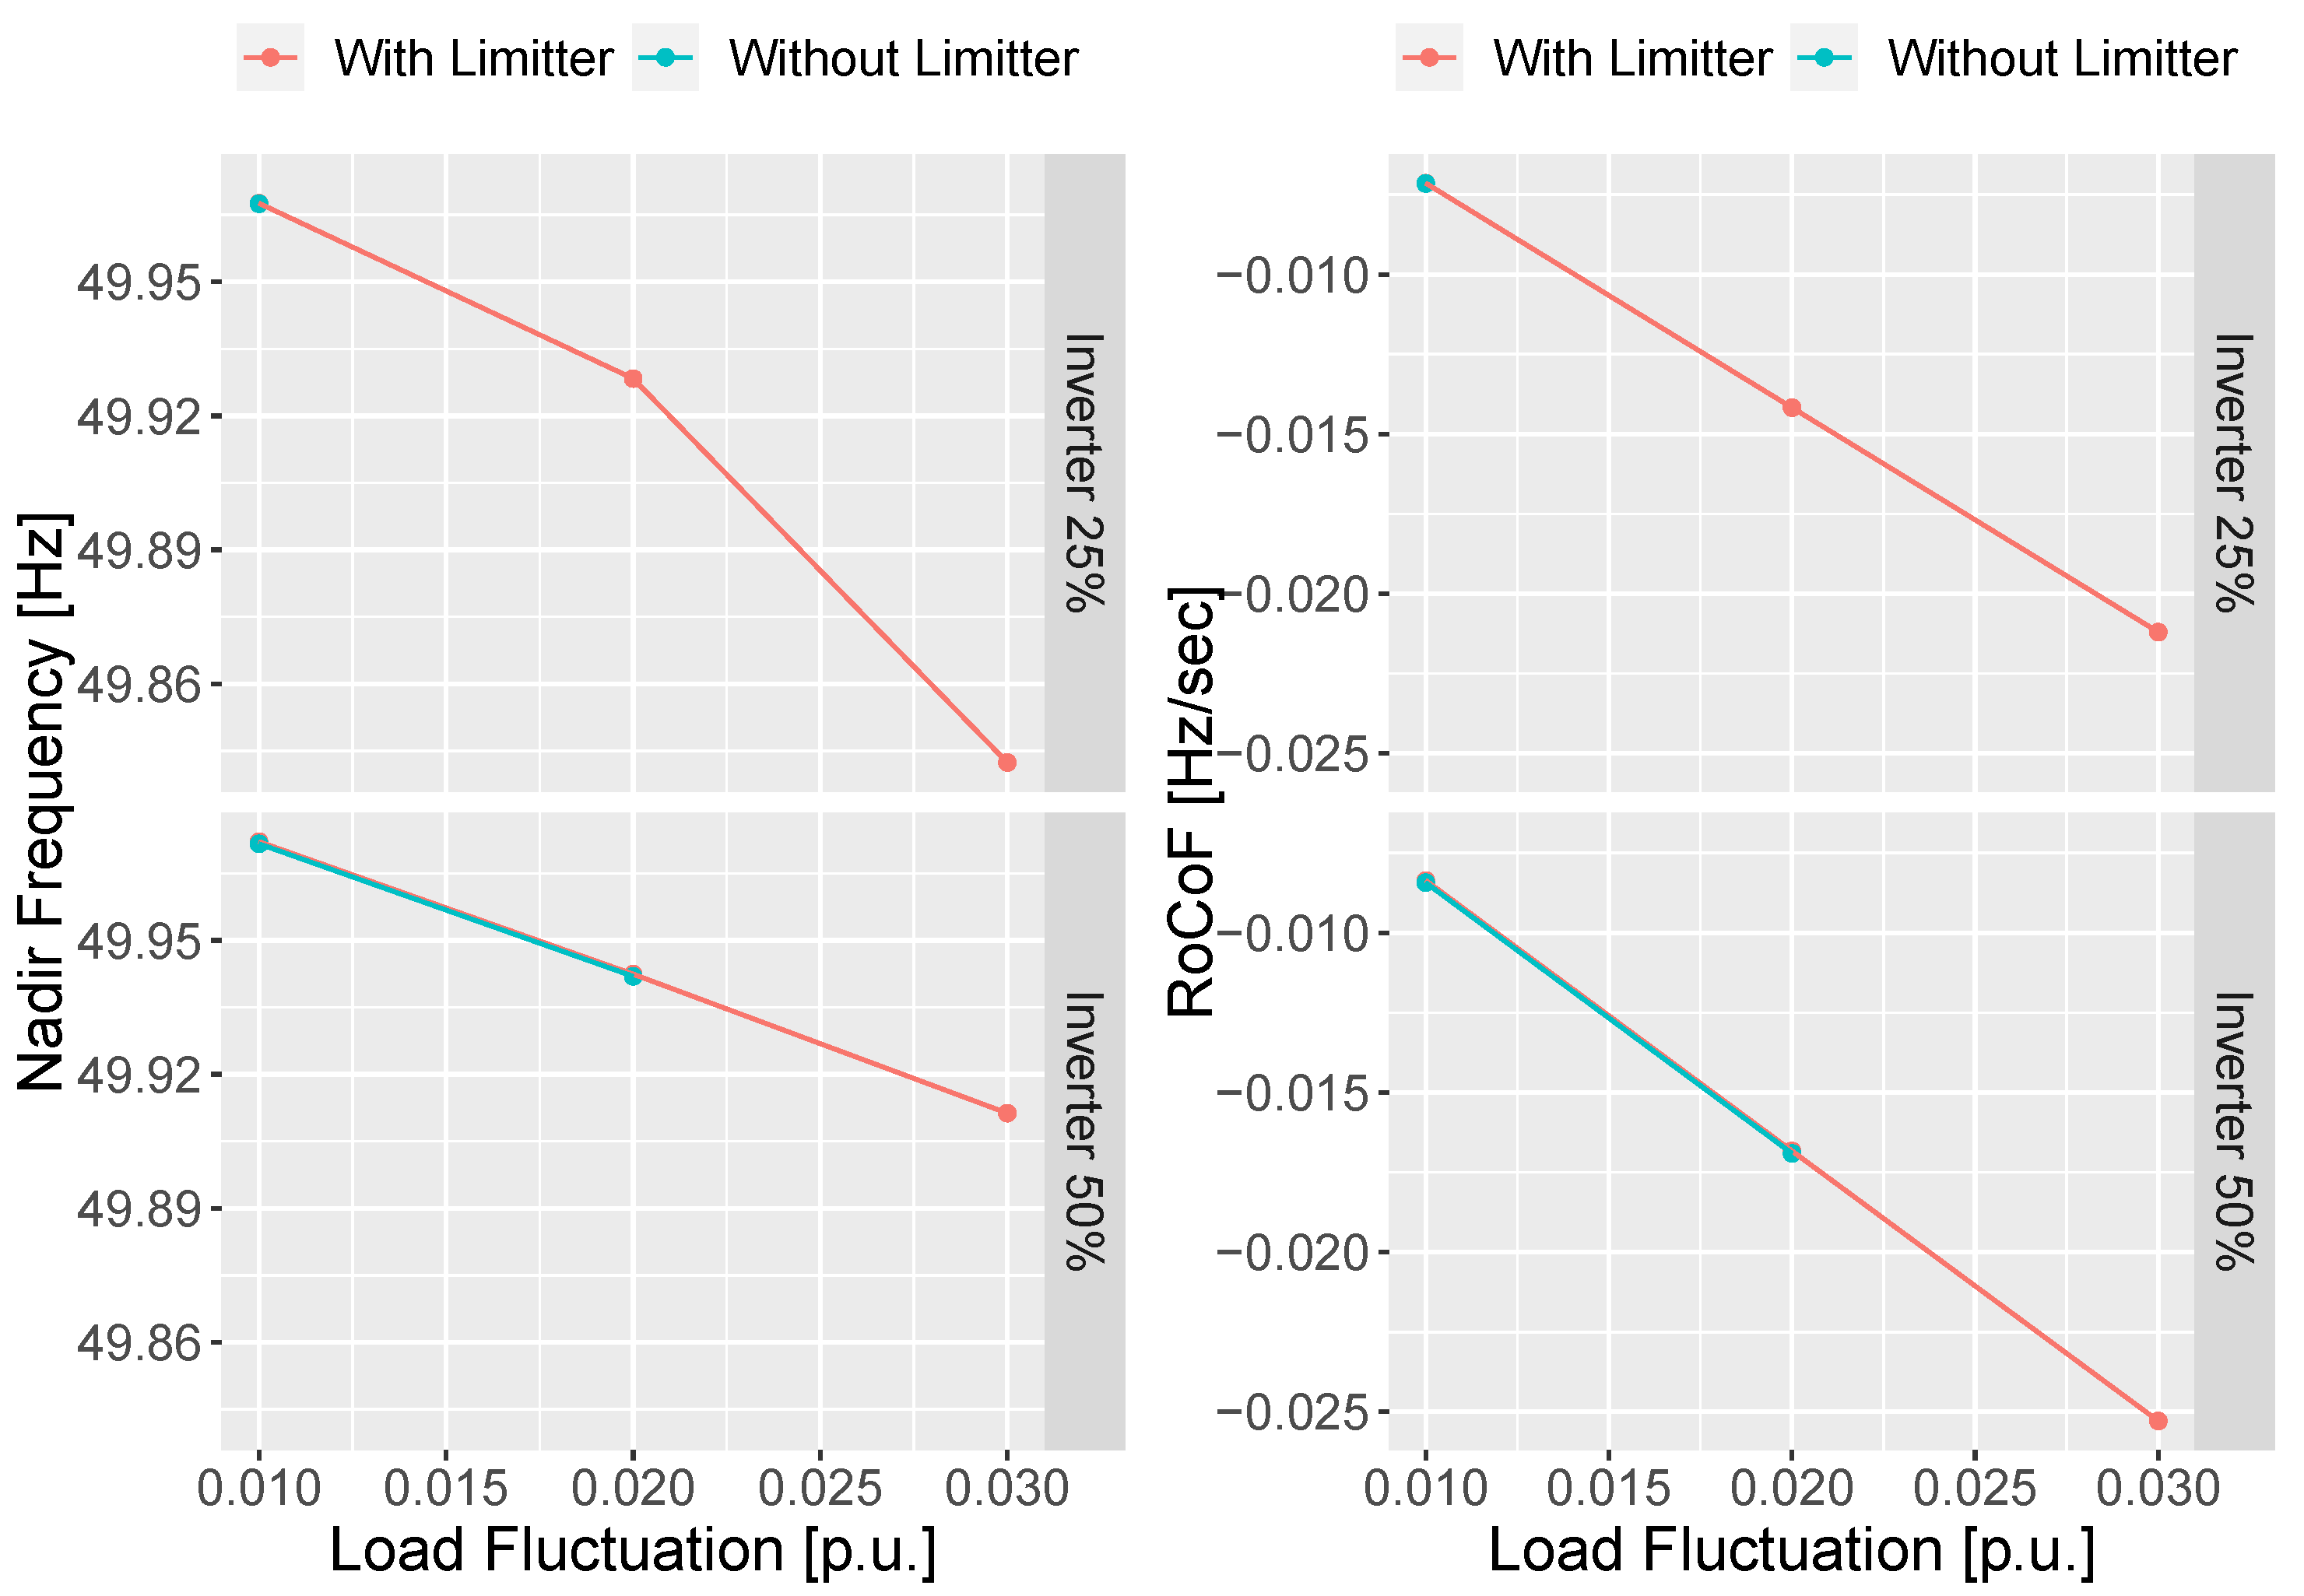
4.3. Simulation Results for Load Fluctuation

In order to confirm the effectiveness of the limiter control against step variations in load, additional simulations were performed under the conditions shown in Table 6; in order to evaluate the security performance of the limiter in the event of a grid accident, we shall additionally simulate a generator dropout (load surge) for the case of high initial output of IBRs in the previous subsection, where the variation of solar radiation is ignored and load fluctuation is added. The Nadir Frequency and RoCoF were evaluated as indicators to measure the impact of load variations.
The simulation results are shown in Figure 17. As shown in Figure 17 in the system without limiter control, the system becomes unstable in some cases, making it impossible to evaluate frequency stability. In addition, the two indices did not deteriorate with or without the limiter control, and no disadvantages of implementing the proposed method could be confirmed.

5. Conclusions

In this study, the issues for the operation of grid-connected PV-VSMs through simulations using EMT analysis with a two-generator system are investigated. Simulations were performed under conditions of rapid changes in load active power and rapid changes in solar radiation. In the simulations of the load changes, it is confirmed that the PV-VSM with insufficient headroom may experience unstable operation, partly because the capacitor voltage of the DC/DC converter drops due to input–output imbalance when the required output of the VSM exceeds the maximum power of the PV. A possible solution to this issue is to add a system that combines an overcurrent protection mechanism and estimation of available power to the PV-VSM. The results of using the PV-VSM with the countermeasure algorithm in the grid for the solar radiation fluctuation case showed that the grid can be operated stably even if the PV available power drops by about 5% relative to the base capacity. Furthermore, when Nadir frequency and RoCoF for load variations were evaluated, both indicators were not worsened by the proposed algorithm, and no disadvantages were identified from the introduction of the countermeasure algorithm. However, grid instability still remains if the PV-VSM is operated at a high planned output and the synchronous generator does not provide sufficient compensation when the PV available power drops due to reduced solar radiation. In PV-VSM operation, risk management of supply-demand planning including advanced forecasting and appropriate sizing of available power reserve are also important and not limited to control technology of the inverter alone.

Author Contributions

Conceptualization, T.T. and T.O.; validation, T.T., T.O., D.O., H.K. and J.H.; investigation, T.T. and T.O.; writing—original draft preparation, T.T.; supervision, T.O., J.H. and K.O.; project administration, T.M. (Takahiro Matsuura), S.M., H.H. and T.M. (Teru Miyazaki). All authors have read and agreed to the published version of the manuscript.

Funding

This study was based on the results obtained from a project commissioned by the New Energy and Industrial Technology Development Organization (NEDO), No. JPNP19002.

Institutional Review Board Statement

Not applicable.

Informed Consent Statement

Not applicable.

Data Availability Statement

Not applicable.

Conflicts of Interest

The authors declare no conflict of interest.

References

  1. IPCC: 2018 Global Warming of 1.5 °C An IPCC Special Report on the Impacts of Global Warming of 1.5 °C above Pre-Industrial Levels and Related Global Greenhouse Gas Emission Pathways, in the Context of Strengthening the Global Response to the Threat of Climate Change, Sustainable Development, and Efforts to Eradicate Poverty. Available online: https://www.ipcc.ch/site/assets/uploads/sites/2/2019/06/SR15_Full_Report_High_Res.pdf (accessed on 13 April 2022).
  2. UNFCCC Authors, Glasgow Climate Change Conference—OctoberNovember 2021 Decisions. 13 November 2021. Available online: https://unfccc.int/sites/default/files/resource/cop26_auv_2f_cover_decision.pdf (accessed on 12 April 2022).
  3. IEA. Net Zero by 2050; IEA: Paris, France, 2021; Available online: https://www.iea.org/reports/net-zero-by-2050 (accessed on 12 April 2022).
  4. METI. Outline of the Basic Energy Plan; METI: Tokyo, Japan, 2020; Available online: https://www.meti.go.jp/press/2021/10/20211022005/20211022005-2.pdf (accessed on 12 April 2022).
  5. METI. FY2020 Energy Supply and Demand Results (Preliminary [Announced on 26 November 2021]); METI: Tokyo, Japan, 2020; Available online: https://www.enecho.meti.go.jp/statistics/total_energy/pdf/gaiyou2020fyr.pdf (accessed on 12 April 2022).
  6. Denholm, P.; Mai, T.; Kenyon, R.W.; Kroposki, B.; O’Malley, M. Inertia and the Power Grid: A Guide without the Spin (No. NREL/TP-6A20-73856); National Renewable Energy Lab. (NREL): Golden, CO, USA, 2020. Available online: https://www.nrel.gov/docs/fy20osti/73856.pdf (accessed on 12 April 2022).
  7. Christensen, P.; Andersen, G.K.; Seidel, M.; Bolik, S.; Engelken, S.; Knueppel, T.; Krontiris, A.; Wuerflinger, K.; Bülo, T.; Jahn, J.; et al. High Penetration of Power Electronic Interfaced Power Sources and the Potential Contribution of Grid Forming Converters, ENTSO-E Technical Report. 2020, pp. 1–61. Available online: https://strathprints.strath.ac.uk/72581/1/ENTSO_E_2020_High_Penetration_of_Power_Electronic_Interfaced_Power_Sources.pdf (accessed on 12 April 2022).
  8. Ullah, N.; Ali, A.; Ali, H.; Mahmood, K. Frequency stability and synthetic inertia. Var. Scalability Stab. Microgrids 2019, 139, 377. [Google Scholar]
  9. Hoke, A.; Mahmud, R.; Nelson, A.; Pattabiraman, D.; Asano, M.; Arakawa, D.; Ifuku, E. Fast Grid Frequency Support from Distributed Energy Resources (No. NREL/TP-5D00-71156); National Renewable Energy Lab. (NREL): Golden, CO, USA, 2021. [Google Scholar]
  10. IEA. System Integration of Renewables; IEA: Paris, France, 2018; Available online: https://www.iea.org/reports/system-integration-of-renewables (accessed on 12 April 2022).
  11. Liu, J.; Miura, Y.; Ise, T. Comparison of dynamic characteristics between virtual synchronous generator and droop control in inverter-based distributed generators. IEEE Trans. Power Electron. 2015, 31, 3600–3611. [Google Scholar] [CrossRef]
  12. Delille, G.; Francois, B.; Malarange, G. Dynamic frequency control support by energy storage to reduce the impact of wind and solar generation on isolated power system’s inertia. IEEE Trans. Sustain. Energy 2012, 3, 931–939. [Google Scholar] [CrossRef]
  13. Hirase, Y.; Abe, K.; Sugimoto, K.; Shindo, Y. A grid-connected inverter with virtual synchronous generator model of algebraic type. Electr. Eng. Jpn. 2013, 184, 10–21. [Google Scholar] [CrossRef]
  14. Zhong, Q.C.; Weiss, G. Synchronverters: Inverters that mimic synchronous generators. IEEE Trans. Ind. Electron. 2010, 58, 1259–1267. [Google Scholar] [CrossRef]
  15. Zhong, Q.C. Virtual Synchronous Machines: A unified interface for grid integration. IEEE Power Electron. Mag. 2016, 3, 18–27. [Google Scholar] [CrossRef]
  16. Sakimoto, K.; Miura, Y.; Ise, T. Stabilization of a power system with a distributed generator by a virtual synchronous generator function. In Proceedings of the 8th International Conference on Power Electronics-ECCE Asia, Jeju, Korea, 29 May–2 June 2011; pp. 1498–1505. [Google Scholar]
  17. Alipoor, J.; Miura, Y.; Ise, T. Power system stabilization using virtual synchronous generator with alternating moment of inertia. IEEE J. Emerg. Sel. Top. Power Electron. 2014, 3, 451–458. [Google Scholar] [CrossRef]
  18. Beck, H.P.; Hesse, R. Virtual synchronous machine. In Proceedings of the 2007 9th International Conference on Electrical Power Quality and Utilisation, Barcelona, Spain, 9–11 October 2007; pp. 1–6. [Google Scholar]
  19. Hesse, R.; Turschner, D.; Beck, H.P. Micro grid stabilization using the virtual synchronous machine (VISMA). In Proceedings of the International Conference on Renewable Energies and Power Quality (ICREPQ’09), Valencia, Spain, 15–17 April 2009; pp. 15–17. [Google Scholar]
  20. Chen, Y.; Hesse, R.; Turschner, D.; Beck, H.P. Investigation of the virtual synchronous machine in the island mode. In Proceedings of the 2012 3rd IEEE PES Innovative Smart Grid Technologies Europe (ISGT Europe), Berlin, Germany, 14–17 October 2012; pp. 1–6. [Google Scholar]
  21. Fazeli, M.; Holland, P. Universal and seamless control of distributed resources-energy storage for all operational scenarios of microgrids. IEEE Trans. Energy Convers. 2017, 32, 963–973. [Google Scholar] [CrossRef]
  22. Cheema, K.M. A comprehensive review of virtual synchronous generator. Int. J. Electr. Power Energy Syst. 2020, 120, 106006. [Google Scholar] [CrossRef]
  23. Mallemaci, V.; Mandrile, F.; Rubino, S.; Mazza, A.; Carpaneto, E.; Bojoi, R. A comprehensive comparison of Virtual Synchronous Generators with focus on virtual inertia and frequency regulation. Electr. Power Syst. Res. 2021, 201, 107516. [Google Scholar] [CrossRef]
  24. Muftau, B.; Fazeli, M. The Role of Virtual Synchronous Machines in Future Power Systems: A Review and Future Trends. Electr. Power Syst. Res. 2022, 206, 107775. [Google Scholar] [CrossRef]
  25. Loutan, C.; Klauer, P.; Chowdhury, S.; Hall, S.; Morjaria, M.; Chadliev, V.; Milam, N.; Milan, C.; Gevorgian, V. Demonstration of Essential Reliability Services by a 300-MW Solar Photovoltaic Power Plant (No. NREL/TP-5D00-67799); National Renewable Energy Lab. (NREL): Golden, CO, USA, 2017. Available online: https://www.nrel.gov/docs/fy17osti/67799.pdf (accessed on 12 April 2022).
  26. Dreidy, M.; Mokhlis, H.; Mekhilef, S. Inertia response and frequency control techniques for renewable energy sources: A review. Renew. Sustain. Energy Rev. 2017, 69, 144–155. [Google Scholar] [CrossRef]
  27. Yuan, H.; Tan, J.; Zhang, Y.; Murthy, S.; You, S.; Li, H.; Su, Y.; Liu, Y. Machine Learning-Based PV Reserve Determination Strategy for Frequency Control on the WECC System. In Proceedings of the 2020 IEEE Power & Energy Society Innovative Smart Grid Technologies Conference (ISGT), Washington, DC, USA, 17–20 February 2020; pp. 1–5. [Google Scholar]
  28. Su, Y.; Li, H.; Cui, Y.; You, S.; Ma, Y.; Wang, J.; Liu, Y. An adaptive PV frequency control strategy based on real-time inertia estimation. IEEE Trans. Smart Grid 2020, 12, 2355–2364. [Google Scholar] [CrossRef]
  29. Liu, J.; Yang, D.; Yao, W.; Fang, R.; Zhao, H.; Wang, B. PV-based virtual synchronous generator with variable inertia to enhance power system transient stability utilizing the energy storage system. Prot. Control. Mod. Power Syst. 2017, 2, 1–8. [Google Scholar] [CrossRef]
  30. Quan, X.; Yu, R.; Zhao, X.; Lei, Y.; Chen, T.; Li, C.; Huang, A.Q. Photovoltaic synchronous generator: Architecture and control strategy for a grid-forming PV energy system. IEEE J. Emerg. Sel. Top. Power Electron. 2019, 8, 936–948. [Google Scholar] [CrossRef]
  31. Rajan, R.; Fernandez, F.M.; Yang, Y. Primary frequency control techniques for large-scale PV-integrated power systems: A review. Renew. Sustain. Energy Rev. 2021, 144, 110998. [Google Scholar] [CrossRef]
  32. Rathnayake, D.B.; Akrami, M.; Phurailatpam, C.; Me, S.P.; Hadavi, S.; Jayasinghe, G.; Zabihi, S.; Bahrani, B. Grid Forming Inverter Modeling, Control, and Applications. IEEE Access 2021, 9, 114781–114807. [Google Scholar] [CrossRef]
  33. Ding, X.; Lan, T.; Dong, H. Control strategy and stability analysis of virtual synchronous generators combined with photovoltaic dynamic characteristics. J. Power Electron. 2019, 19, 1270–1277. [Google Scholar]
  34. Feldmann, D.; de Oliveira, R.V. Operational and control approach for PV power plants to provide inertial response and primary frequency control support to power system black-start. Int. J. Electr. Power Energy Syst. 2021, 127, 106645. [Google Scholar] [CrossRef]
  35. Zhang, X.; Gao, Q.; Hu, Y.; Zhang, H.; Guo, Z. Active power reserve photovoltaic virtual synchronization control technology. Chin. J. Electr. Eng. 2020, 6, 1–6. [Google Scholar] [CrossRef]
  36. Yan, X.; Li, J.; Wang, L.; Zhao, S.; Li, T.; Lv, Z.; Wu, M. Adaptive-MPPT-based control of improved photovoltaic virtual synchronous generators. Energies 2018, 11, 1834. [Google Scholar] [CrossRef]
  37. Jietan, Z.; Linan, Q.; Pestana, R.; Fengkui, L.; Libin, Y. Dynamic frequency support by photovoltaic generation with “synthetic” inertia and frequency droop control. In Proceedings of the 2017 IEEE Conference on Energy Internet and Energy System Integration (EI2), Beijing, China, 26–28 November 2017; IEEE: Piscataway, NJ, USA, 2017; pp. 1–6. [Google Scholar]
  38. Águila-León, J.; Chiñas-Palacios, C.D.; Vargas-Salgado, C.; Hurtado-Perez, E.; García, E.X. Optimal PID Parameters Tunning for a DC-DC Boost Converter: A Performance Comparative Using Grey Wolf Optimizer, Particle Swarm Optimization and Genetic Algorithms. In Proceedings of the 2020 IEEE Conference on Technologies for Sustainability (SusTech), Santa Ana, CA, USA, 23–25 April 2020; IEEE: Piscataway, NJ, USA, 2020; pp. 1–6. [Google Scholar]
  39. Águila-León, J.; Chiñas-Palacios, C.D.; Vargas-Salgado, C.; Hurtado-Perez, E.; García, E.X. Particle Swarm Optimization, Genetic Algorithm and Grey Wolf Optimizer Algorithms Performance Comparative for a DC-DC Boost Converter PID Controller. Adv. Sci. Technol. Eng. Syst. J. 2021, 6, 619–625. [Google Scholar] [CrossRef]
  40. Inoue, T.; Taniguchi, H. Development of Standard Models and Parametervalnes of Thermal Power Plants for Power System Dynamics Analysis; Central Research Institute of Electric Power Industry (CRIEPI): Chiyoda City, Japan, 1991; Available online: https://criepi.denken.or.jp/hokokusho/pb/reportDetail?reportNoUkCode=T91007 (accessed on 12 April 2022).
  41. Qoria, T.; Gruson, F.; Colas, F.; Kestelyn, X.; Guillaud, X. Current limiting algorithms and transient stability analysis of grid-forming VSCs. Electr. Power Syst. Res. 2020, 189, 106726. [Google Scholar] [CrossRef]
  42. Gkountaras, A.; Dieckerhoff, S.; Sezi, T. Evaluation of current limiting methods for grid forming inverters in medium voltage microgrids. In Proceedings of the 2015 IEEE Energy Conversion Congress and Exposition (ECCE), Montreal, QC, Canada, 20–24 September 2015; pp. 1223–1230. [Google Scholar]
  43. Huang, L.; Xin, H.; Wang, Z.; Zhang, L.; Wu, K.; Hu, J. Transient stability analysis and control design of droop-controlled voltage source converters considering current limitation. IEEE Trans. Smart Grid 2017, 10, 578–591. [Google Scholar] [CrossRef]
  44. Bottrell, N.; Green, T.C. Comparison of current-limiting strategies during fault ride-through of inverters to prevent latch-up and wind-up. IEEE Trans. Power Electron. 2013, 29, 3786–3797. [Google Scholar] [CrossRef]
  45. Paquette, A.D.; Divan, D.M. Virtual impedance current limiting for inverters in microgrids with synchronous generators. IEEE Trans. Ind. Appl. 2014, 51, 1630–1638. [Google Scholar] [CrossRef]
  46. Orihara, D.; Taoka, H.; Kikusato, H.; Hashimoto, J.; Otani, K.; Takamatsu, T.; Oozeki, T.; Matsuura, T.; Miyazaki, S.; Hamada, H.; et al. Internal Induced Voltage Modification for Current Limitation in Virtual Synchronous Machine. Energies 2022, 15, 901. [Google Scholar] [CrossRef]
  47. Zhu, Y.; Wen, H.; Chu, G. Active power control for grid-connected photovoltaic system: A review. In Proceedings of the 2020 IEEE/IAS Industrial and Commercial Power System Asia (I&CPS Asia), Weihai, China, 13–15 July 2020; pp. 1506–1511. [Google Scholar]
  48. Li, X. Maximum Power Point Tracking and Power Reserve Control for Photovoltaic System. Ph.D. Thesis, The University of Liverpool, Liverpool, UK, 2019. [Google Scholar]
  49. Hoke, A.; Muljadi, E.; Maksimovic, D. Real-time photovoltaic plant maximum power point estimation for use in grid frequency stabilization. In Proceedings of the 2015 IEEE 16th workshop on Control and Modeling for Power Electronics (COMPEL), Vancouver, BC, Canada, 12–15 July 2015; pp. 1–7. [Google Scholar]
  50. Hoke, A.F.; Shirazi, M.; Chakraborty, S.; Muljadi, E.; Maksimovic, D. Rapid active power control of photovoltaic systems for grid frequency support. IEEE J. Emerg. Sel. Top. Power Electron. 2017, 5, 1154–1163. [Google Scholar] [CrossRef]
  51. Sangwongwanich, A.; Yang, Y.; Blaabjerg, F. A sensorless power reserve control strategy for two-stage grid-connected PV systems. IEEE Trans. Power Electron. 2017, 32, 8559–8569. [Google Scholar] [CrossRef]
  52. Sangwongwanich, A.; Yang, Y.; Blaabjerg, F.; Sera, D. Delta power control strategy for multistring grid-connected PV inverters. IEEE Trans. Ind. Appl. 2017, 53, 3862–3870. [Google Scholar] [CrossRef]
  53. Batzelis, E.I.; Kampitsis, G.E.; Papathanassiou, S.A. Power reserves control for PV systems with real-time MPP estimation via curve fitting. IEEE Trans. Sustain. Energy 2017, 8, 1269–1280. [Google Scholar] [CrossRef]
  54. Batzelis, E.I.; Papathanassiou, S.A.; Pal, B.C. PV system control to provide active power reserves under partial shading conditions. IEEE Trans. Power Electron. 2018, 33, 9163–9175. [Google Scholar] [CrossRef]
  55. Li, X.; Wen, H.; Zhu, Y.; Jiang, L.; Hu, Y.; Xiao, W. A novel sensorless photovoltaic power reserve control with simple real-time MPP estimation. IEEE Trans. Power Electron. 2018, 34, 7521–7531. [Google Scholar] [CrossRef]
Figure 1. Power source composition plan of Japan 2030 in the Sixth Strategic Energy Plan. The large share of PV power sources among renewable energy sources is a distinctive feature. The graph is created from [4,5].
Energies 15 05921 g001
Figure 2. Circuit diagram of the two-stage PV-VSM.
Energies 15 05921 g002
Figure 3. Control scheme of the VSM algorithm.
Energies 15 05921 g003
Figure 4. Control Scheme of the secondary side constant voltage control of the DC converter.
Energies 15 05921 g004
Figure 5. Schematic of the two generator system model.
Energies 15 05921 g005
Figure 6. Turbine and governor model of the synchronous generator. This figure was created from [40]. The speed of the valve is mechanically limited and cannot be controlled at a fast response such as an IBR.
Energies 15 05921 g006
Figure 7. Active power flow of the grid and the frequency of the generator (G1).
Energies 15 05921 g007
Figure 8. Active power flow and the capacitors’ voltage of the DC/DC converter. VC1 implies PV side voltage, and VC2 implies the inverter side voltage.
Energies 15 05921 g008
Figure 9. Active power flow of the DC/DC converter in the unstable cases: Case1, Case3, and Case5. The figures in the bottom row shows a zoomed-in view of the instant of load fluctuation.
Energies 15 05921 g009
Figure 10. Voltage and current of PV.
Energies 15 05921 g010
Figure 11. Block diagram of the control system with the output power limiter. The highlighted orange indicates the added mechanism to limit the current of the VSM.
Energies 15 05921 g011
Figure 12. Scheme of the available power reserve (upper limit control) system. The headroom is estimated by the maximum power estimator, which maps the correspondence between solar irradiance and PV maximum power, and the estimate is passed to the controller to ensure stable operation of the PV-VSM.
Energies 15 05921 g012
Figure 13. The change in available power and inverter output before and after the ramp change. The output of the inverter without ESS should be limited to the available power, and when the upper limit falls below the initial output before the ramp, the limiter control should be activated to suppress the output.
Energies 15 05921 g013
Figure 14. Stability result of the ramp changing irradiance PV-VSM with limiter control. In this figure, a–g corresponds to the labels of the simulation case. ∘ and × mean stable and unstable results.
Energies 15 05921 g014
Figure 15. Stability result of the ramp changing irradiance PV-VSM without limiter control. In this figure, a–g corresponds to the labels of the simulation case. ∘ and × mean stable and unstable results.
Energies 15 05921 g015
Figure 16. Active power flow of the grid and the generator frequency in the simulation of the solar power fluctuation.
Energies 15 05921 g016
Figure 17. Nadir frequency and RoCoF of the load fluctuation with the limiter control system.
Energies 15 05921 g017
Table 1. Circuit parameters of the two-stage PV-VSM.
Boost converter
Primary side capacitor C 1 1.0 × 10 4 [ μ F ]
Secondary side capacitor C 2 1.0 × 10 4 [ μ F ]
InductorL250 [ μ H ]
Primary side voltage V C 1 340 [ V ] (Rated voltage)
Secondary side voltage V C 2 680 [ V ] (Rated voltage)
PV Source
Series resistance per cell R s 0.02 [ Ω ]
Shunt resistance per cell R sh 1000 [ Ω ]
Number of cell connected in series N s PV-L : 455PV-S : 495
Number of cell connected in parallel N p PV-L : 136PV-S : 83
Maximum power P max PV-L : 98.2 [kW]PV-S : 65.5 [kW]
Voltage at maximum power point V mpp PV-L : 316 [V]PV-S : 337 [V]
Short circuit current I sc PV-L : 340 [A]PV-S : 207 [A]
Open circuit voltage V op PV-L : 380 [V]PV-S : 413 [V]
Table 2. Stability of PV-VSM for each DC-side control strategy. ∘ means stable result and × means unstable result.
MPPT ControlConstant Voltage Control
Primary SideSecondary Side
××
Table 3. Parameters of the two-generator system model.
Synchronous generator (G1)
Rated line voltage V LG 1 100 [kV]
Base power (Rated power) S G 1 Variable [MVA]
Inertia constant H G 1 3.5 [s]
Governor gain D G 1 25 [p.u.]
Synchronous reactance (d-axis) X dG 1 1.72 [p.u.]
Synchronous reactance (q-axis) X qG 1 1.66 [p.u.]
Initial power output P 0 G 1 Variable [p.u.]
Transmission line
Rated line voltage V LTL 500 [kV]
Base power S TL 1000 [MVA]
Resistance of Π -section lines R TL 2.52 × 10 3 [p.u.]
Reactance of Π -section lines X TL 7.56 × 10 2 [p.u.]
Susceptance of Π -section lines B TL 7.32 × 10 2 [p.u.]
Inverter base resources (G2)
Rated line voltage V LG 2 100 [kV]
Base power S G 2 Variable [MVA]
Virtual inertia constant H G 2 25 [s]
Virtual governor gain D G 2 100 [p.u.]
Virtual synchronous reactance X sG 2 1.36 × 10 1 [p.u.]
Initial power output P 0 G 2 Variable [p.u.]
Load
Rated line voltage V LL 500 [kV]
Base power S L 2000 [MVA]
Initial power consumption P 0 L 0.6 [p.u.]
Load power fluctuation Δ P L Variable [p.u.]
Table 4. Simulation parameters of the step changing load power fluctuation cases. The cases increasing load power can be regarded as simulating contingency. For each case, two simulation patterns with different PV module capacities are performed.
S G 1 [MVA] P 0 G 1 [p.u.] S G 2 [MVA] P 0 G 2 [p.u.] Δ P L [p.u.]
Case115000.65000.6 + 0.01
Case215000.65000.6 0.01
Case310000.610000.6 + 0.01
Case410000.610000.6 0.01
Case55000.615000.6 + 0.01
Case65000.615000.6 0.01
Table 5. Simulation parameters of the ramp changing solar irradiance fluctuation with the limiter control system.
S G 1 [MVA] P 0 G 1 [p.u.] S G 2 [MVA] P 0 G 2 [p.u.] Δ P L [p.u.]
Case a15000.535000.80
Case b15000.65000.60
Case c15000.75000.30
Case d10000.410000.80
Case e10000.610000.60
Case f10000.910000.30
Case g5000.615000.60
Table 6. Simulation parameters of the load fluctuation with the limiter control system.
S G 1 [MVA] P 0 G 1 [p.u.] S G 2 [MVA] P 0 G 2 [p.u.] Δ P L [p.u.]
Case a115000.535000.8 + 0.01
Case a215000.535000.8 + 0.02
Case a315000.535000.8 + 0.03
Case d110000.410000.8 + 0.01
Case d210000.410000.8 + 0.02
Case d310000.410000.8 + 0.03
Publisher’s Note: MDPI stays neutral with regard to jurisdictional claims in published maps and institutional affiliations.

