Article

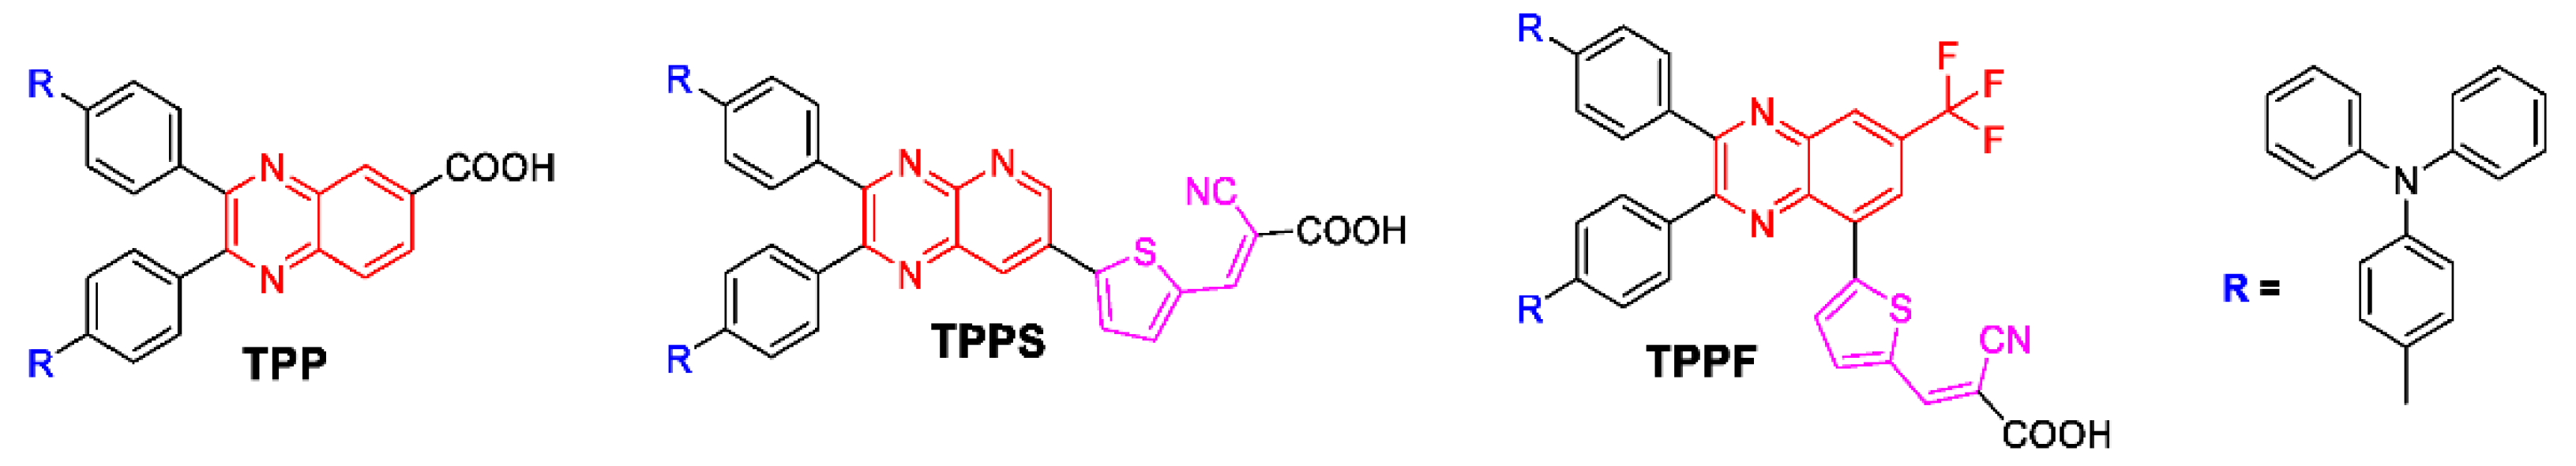
Syntheses and Photovoltaic Properties of New Pyrazine-Based Organic Photosensitizers for Dye-Sensitized Solar Cells

1
Department of Chemistry, Pukyong National University, Busan 48513, Korea
2
Division of Chemical Engineering and Materials Science, Ewha Womans University, Seoul 03760, Korea
3
Department of Physics, Pukyong National University, Busan 48513, Korea
4
Department of Optics and Mechatronics Engineering, Pusan National University, Busan 46241, Korea
5
Industry 4.0 Convergence Bionics Engineering, Pukyong National University, Busan 48513, Korea
*
Author to whom correspondence should be addressed.
Energies 2022, 15(16), 5938; https://doi.org/10.3390/en15165938
Submission received: 21 July 2022 / Revised: 12 August 2022 / Accepted: 14 August 2022 / Published: 16 August 2022
(This article belongs to the Section A2: Solar Energy and Photovoltaic Systems)

Abstract

:
Three novel pyrazine-based organic photosensitizers denoted as TPP, TPPS, and TPPF were synthesized for dye-sensitized solar cell (DSSC) studies. Chemical structures of the pyrazine-based photosensitizers were designed with pyrazine derivatives as acceptors, triphenylamine groups as donors, and the thiophene–cyanoacryl group as an auxiliary heterocyclic linkers-acceptor. Using UV-vis spectrophotometry, cyclic voltammetry, and density functional theory calculations, optical and electrochemical characteristics of these pyrazine-based photosensitizers were examined and explored in relation to photovoltaic parameters. The effects of the molecular structures of these photosensitizers on the performances of DSSCs were also investigated. The overall conversion efficiencies of DSSCs based on pyrazine-based photosensitizers were 1.31~2.64% under AM 1.5 irradiation of 100 mW/cm2. To confirm the effect of interfacial charge transfer on photovoltaic performances of DSSC based on pyrazine-based photosensitizers, interfacial charge transfer resistances were investigated by electrical impedance spectroscopy (EIS) measurements.

1. Introduction

Dye-sensitized solar cells (DSSCs) are considered to be promising alternatives to conventional silicon solar cells because of their low production cost, simple structure, and easy production [1,2,3,4,5]. These materials possess various advantages, including tunable material properties, light weight, compatibility with flexible substrates, and low temperature high-throughput manufacturing processes. In the past decade, the performances of DSSC devices have been radically developed in terms of efficiency and durability by many researchers. For the design of high-performance DSSC devices, it is important to understand the key materials constituting DSSC devices.
DSSCs are composed of a nanoporous titanium oxide electrode, a dye (or photosensitizer), an electrolyte, a counter electrode, and a transparent conducting substrate. The photosensitizer serves as a solar energy absorber in DSSCs. Its proprieties have a significant effect on light harvesting efficiency and overall solar-to-electricity conversion efficiency of DSSCs [6,7,8].
An ideal sensitizer has to fulfill the following criteria [9,10]: (1) TiO2 has the lowest unoccupied molecular orbital (LUMO) energy level high enough for efficient electron injection into TiO2 and the highest occupied molecular orbital (HOMO) energy level low enough for efficient regeneration of the oxidation state; (2) it absorbs solar radiation strongly, with the absorption band in the visible region extending to near infrared (near IR); and (3) it possesses enough spatial separation between the positive charge density on the photosensitizer and electrons injected.
In particular, organic photosensitizers have many advantages over inorganic photosensitizers. Organic photosensitizers have the advantage of being able to chemically design various structures and have a higher molar extinction coefficient. However, it also has a disadvantage in that it does not have a broad absorption band in the visible light region. They also have a π-stacked aggregation on the TiO2 surface and a low stability. The π-stacked aggregation of organic photosensitizers can decrease the overall solar-to-electricity conversion efficiency. To obtain an optimal performance, aggregation of photosensitizers should be avoided through structural modification or addition of co-adsorbents [11,12].
In general, organic photosensitizers have a D-π-A structure that includes an electron donor (D), a π-conjugated bridge (π) and an electron acceptor (A), and they also have one or two anchoring groups to be adsorbed onto the TiO2 surface. In these organic photosensitizers, the movements of electrons are due to intramolecular charge transfer (ICT) [11,12,13].
The electron donating moieties are generally composed of aryl amines (e.g., dipheylamine, triphenylamine, and carbazole) due to their good photoconductivity. In addition, thiophenes or phenazines may be used as electron donating moieties. The electron acceptor moieties consist of heterocyclic compounds such as pyridine, triazole, and benzonitrile. Trifluoromethyl benzene, benzoic acid, and triazine may be also used as electron acceptor moieties [14,15,16,17,18]. Among many heterocyclic compounds, pyrazine, with its highly electron-deficient aromatic properties, is a candidate for electron-attracting in the push–pull scaffold ICT mechanism [19,20]. In particular, pyrido[3,4-b]pyrazine (PP) exhibits a well-known electron-withdrawing effect due to its two symmetrical unsaturated nitrogen atoms and pyridine N atoms. Therefore, in designing the structure of organic photosensitizers, various approaches were taken using pyrazine derivatives, which are very attractive approaches in terms of their strong electron-deficient properties.
Studies on organic photosensitizers for DSSCs have been continuously studied based on new structural designs of organic photosensitizers by many researchers. Most of the organic photosensitizers could not absorb the overall visible light spectrum with structural limitations, unlike conventional commercial dyes (N719, N3, etc.). The organic photosensitizers in this study could absorb up to 520 nm through the study of an acceptor and an auxiliary acceptor based on a pyrazine derivative, in particular, a DSSC device using a TPPF photosensitizer showed a current density of 5.69 mA/cm2 and a power conversion efficiency of 2.64% in AM 1.5. Therefore, through new attempts and continuous studies by designing molecular structures, efforts are required to attain higher efficiencies and improved DSSC device performance.
In 2008, metal-free organic photosensitizers containing two triphenylamine (TPA) groups were fabricated, and DSSC devices based on TPA were reported at 2.3% of power conversion efficiency [21]. DSSC devices based on coumarin were reported at 5.6% of power conversion efficiency [22]. Organic photosensitizers containing phenothiazine (PTZ) or carbazole (CBZ) groups were synthesized, and their photovoltaic performances were obtained as 5.5% and 6.02%, respectively [23,24].
This work aims to investigate how variation of the acceptor structure (benzopyrazine, pyrido[3,4-b]pyrazine, and trifluoromethylbenzopyrazine) and/or the auxiliary heterocyclic linkers-acceptor (thiophene–cyanoacrylic group) can impact the overall photoconversion efficiency of DSSCs based on these photosensitizers. The most popular methods of structural modification for fine-tuning HOMO and LUMO energy levels of photosensitizers are by varying acceptor fragments and/or conjugating the auxiliary heterocyclic linkers-acceptor judiciously.
We developed a series of new organic D-π-A type and D-π-A-π’-A’ type photosensitizers (TPP, TPPS, and TPPF, as shown in Figure 1) based on pyrazine derivatives as acceptors (A), triphenylamine groups as donors (D), and phenyl groups as linkers (π). The thiophene–cyanoacryl group was applied as the auxiliary heterocyclic linkers-acceptor (π’-A’). The optical and electrochemical properties of TPP, TPPS, and TPPF were investigated. The photovoltaic performances of DSSCs based on these organic D-π-A-(π’-A’) type photosensitizers were evaluated.

2. Materials and Methods

2.1. Materials and Regents

Fluorine-doped SnO2 glass (FTO glass, sheet resistance 15 Ω/square) was purchased from Solaronix SA (Aubonne, Switzerland). Ti-Nanoxide BL/SP (compact TiO2 paste), Ti-Nanoxide T/SP (transparent TiO2 paste), Ti-Nanoxide D/SP (dispersed TiO2 paste), Iodolyte HI-30, N719 dye, and Surlyn (SX1170-25) were purchased from Solaronix SA (Aubonne, Switzerland). All reagents and solvents were obtained from Aldrich and TCI (Seoul, Korea). They were of analytical grade and used as received without further purification.

2.2. Measurements

1H NMR and 13C NMR spectra were measured on a Bruker Avance 400 MHz spectrometer (Terre Haute, IN, USA) with CDCl3 and DMSO-d6 as a d-solvent. Ultra High Resolution Q-TOF LC MS (HRMS) spectra were obtained on a maXis-HD (Bruker, Billerica, MA, USA) spectrometer in a positive ion mode. UV–vis absorption and fluorescence emission spectra were obtained on a V-730 UV-Visible Spectrophotometer (Jasco, TS Science Co., Ltd., Seoul, Korea) and an F-7000 Fluorescence Spectrophotometer (Hitachi High-Tech, Hitachi High-Tech Korea Co., Ltd., Seoul, Korea) at ambient temperature, respectively. Morphologies and thickness of nanoporous TiO2 layers were observed by a Field Emission Scanning Electron Microscope (FE-SEM) (TESCAN, MIRA 3 LMH In-Beam Detector) (TESCAN Korea, Seoul, Korea). Electrochemical redox potentials were obtained by cyclic voltammetry (CV) using three electrode cells and an electrochemical analyzer (CHI600E, CH Instruments, Austin, TX, USA). Irradiated current density-voltage (J-V) curves were tested using a Keithley 2400 under air mass 1.5 global (AM 1.5 G) irradiation (100 mW/cm2) (Tektronix Korea, Seoul, Korea). The light intensity was calibrated using an NREL-Si solar cell. External quantum efficiency (EQE) was measured under monochromatic light using a Xenon lamp (Dongwoo Optron, Kyeonggido, Korea). Electrical Impedance Spectroscopy (EIS) measurements were performed using an Ivium compact Stat.h electrochemical analyzer (AR Eindhoven, The Netherlands). EIS data were obtained with an impedance analyzer in the frequency range of 0.1~1 MHz at room temperature using FTO/TiO2/Photosensitizer/Electrolyte/Pt/FTO cells.

2.3. Synthesis of Photosensitizers

Synthesis of 2,3-bis(4′-(diphenylamino)-[1,1′-biphenyl]-4-yl)quinoxaline-6-carboxylic acid (TPP) and sub-materials (2a, 2b, 3a, and 3b) is described in Supporting Information.
Synthesis of (E)-3-(5-(2,3-bis(4′-(diphenylamino)-[1,1′-biphenyl]-4-yl)pyrido[2,3-b]pyrazin-7-yl)thiophen-2-yl)-2-cyanoacrylic acid (TPPS) and (E)-3-(5-(2,3-bis(4′-(diphenylamino)-[1,1′-biphenyl]-4-yl)-7-(trifluoromethyl)quinoxalin-5-yl)thiophen-2-yl)-2-cyanoacrylic acid (TPPF): A mixture of 3a (or 3b), 2-cyanoacetic acid (1.1 eq) and ammonium acetate was refluxed in acetic acid for six hours. After that, it was poured into cooling deionized water. The precipitate was collected by filtration, washed by water, and then purified by silica gel column chromatography (MC/MeOH: 95/5) to obtain the products (85~90%).

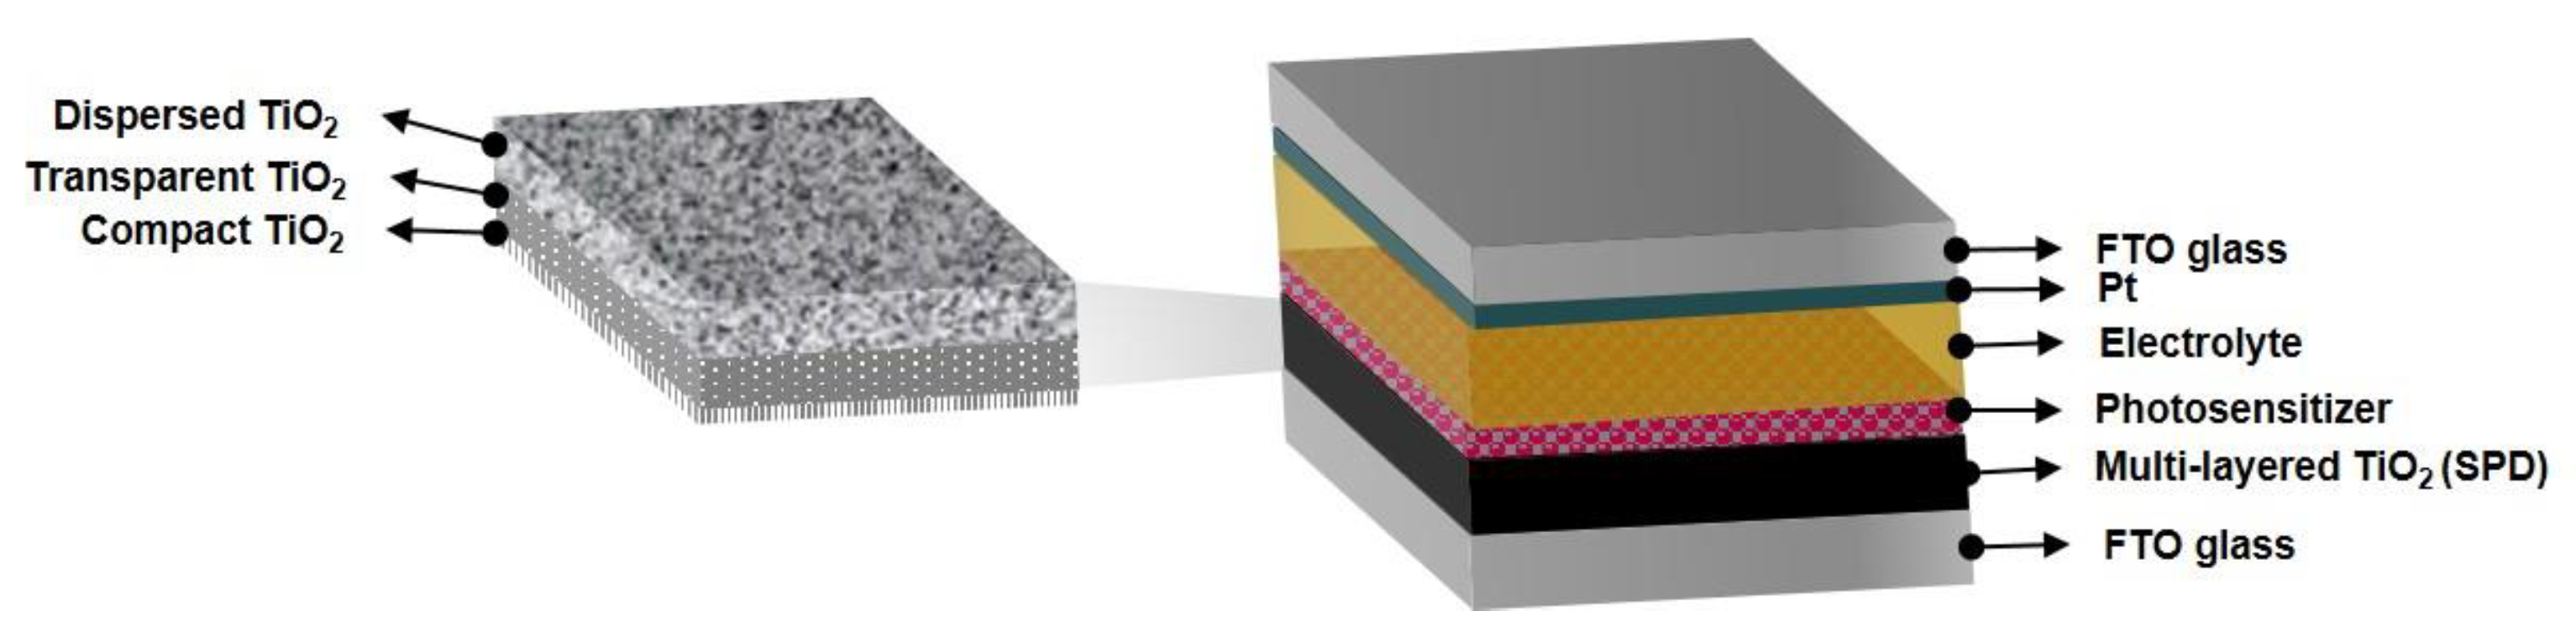
2.4. Fabrications of DSSC Devices

The fabrication process of the multi-layered TiO2 electrodes (SPD) for DSSC devices in this study was described in Supporting Information. In Figure 2, the structure of the DSSC device is illustrated.
The thickness of the multi-layered TiO2 electrode (SPD) measured from the SEM cross-section image was approximately 20 μm. The multi-layered TiO2 electrodes (SPD) were dipped in a 0.5 mM solution of organic photosensitizers and left to stand at room temperature for 48 h. The solvent was CHCl3 for organic photosensitizers (TPP, TPPS, and TPPF) and absolute ethanol for N719. The electrolyte used was Iodolyte HI-30, consisting of 30 mM iodide/tri-iodide in acetonitrile. The fabrication of the Pt counter electrode and DSSC device assembly were according to references [25]. To prevent inflated photocurrents arising from stray light, a black mask surrounded the active area. The active area of the DSSC device was 0.40 cm2.

3. Results and Discussion

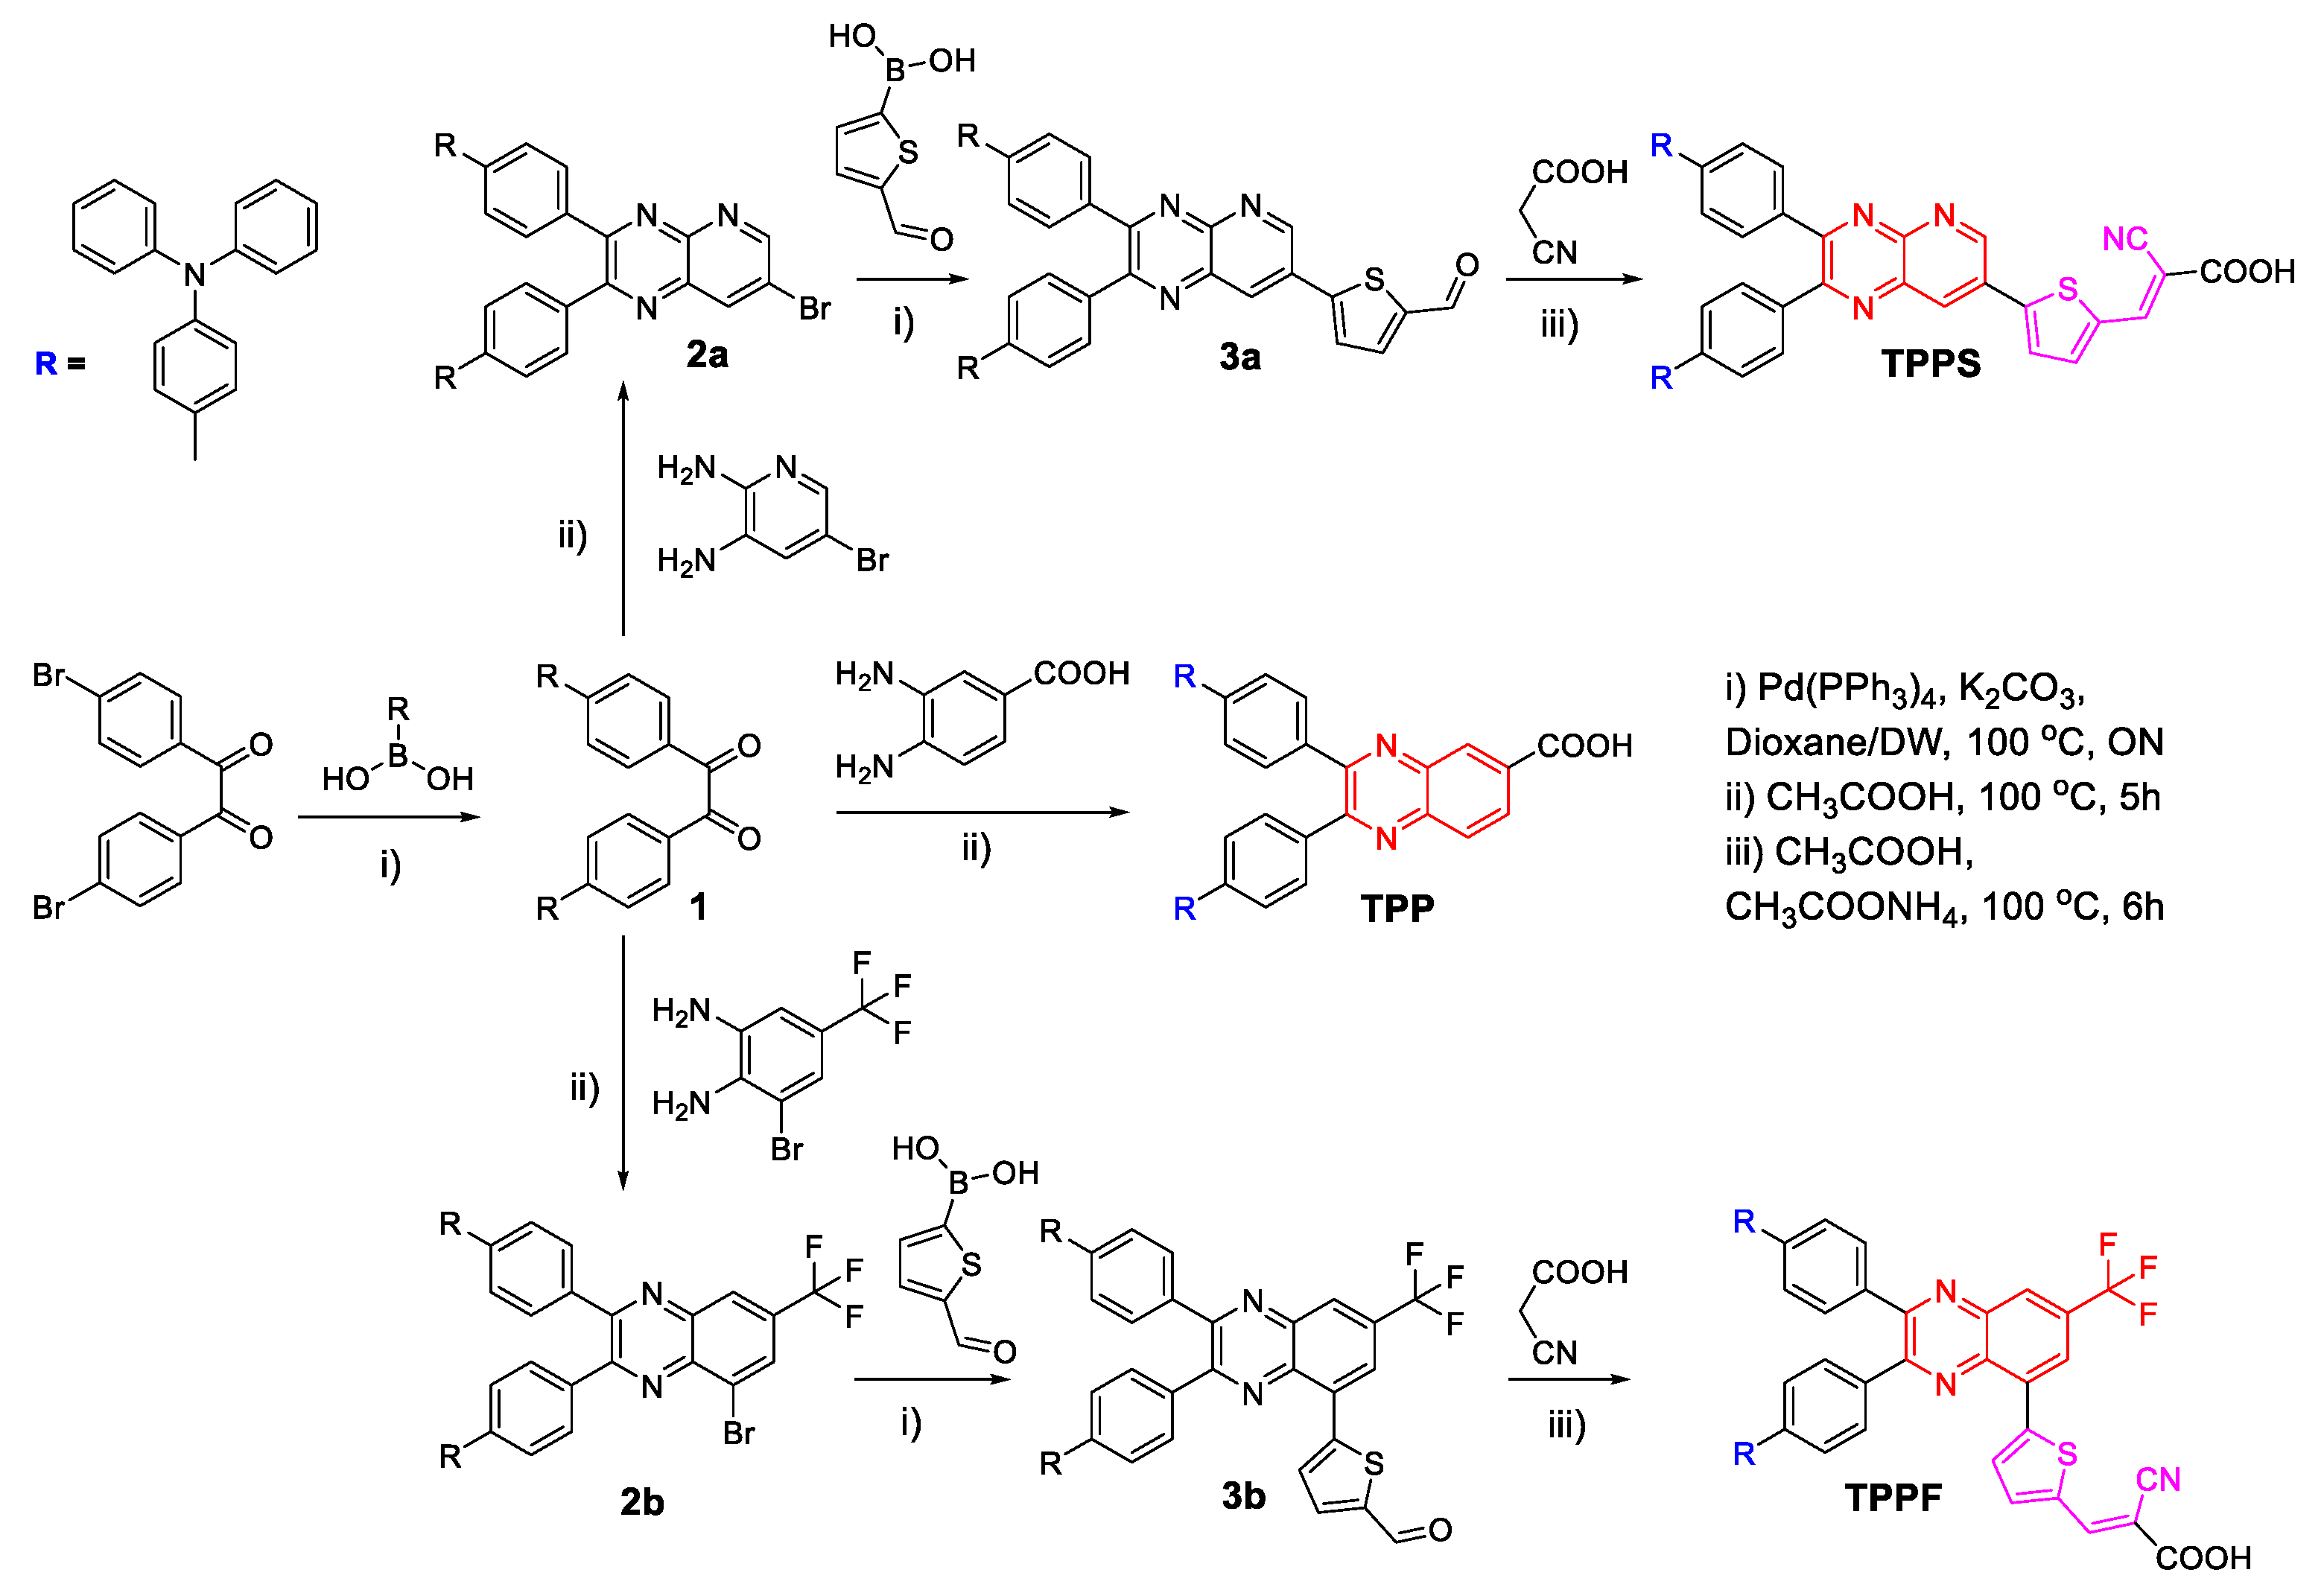
3.1. Synthesis of Photosensitizers

The synthetic process of photosensitizers (TPP, TPPS, and TPPF) was described in Scheme 1. Product 1 was performed via Suzuki–Miyaura coupling between 4,4′-dibromobenzil and two triphenylamine group. After that, product 1 reacted with 2,3-diamino-5-bromopyridine, 3-bromo-5-(trifluoromethyl)benzene-1,2-diamine, and 3,4-diaminobenzoic acid to form 2a, 2b, and TPP, respectively. Then, 3a and 3b were synthesized by the introduction of the thiophenecarboxaldehyde group to 2a and 2b via Suzuki–Miyaura coupling, respectively. Finally, TPPS and TPPF were produced by Wittig reaction of 3a and 3b with 2-cyanoacetic acid in galactic acetic acid.
The characteristics of synthesized products were analyzed by 1H NMR, 13C NMR, and LC-MS spectroscopy. The 1H NMR, 13C NMR, and LC-MS spectra of the sub materials TPP, TPPS, and TPPF are shown in Figures S1–S6. These spectra agree well with the proposed molecular structures of the sub materials TPP, TPPS, and TPPF.
TPP: 1H NMR (400 MHz, CDCl3) δ 8.99 (d, J = 1.9 Hz, 1H), 8.40 (dd, J = 8.7, 1.9 Hz, 1H), 8.23 (d, J = 8.7 Hz, 1H), 7.71–7.45 (m, 12H), 7.25 (t, J = 7.8 Hz, 9H), 7.12 (d, J = 7.9 Hz, 12H), 7.02 (t, J = 7.3 Hz, 4H); 13C NMR (101 MHz, CDCl3) δ 147.63, 137.00, 130.53, 130.45, 129.42, 127.82, 126.57, 124.65, 123.81, 123.77, 123.21; ESI HRMS m/z = 768.3253 [M-COO]+, calcd. for C57H40N4O2 = 812.32.
TPPS: 1H NMR (400 MHz, CDCl3) δ 9.47 (s, 1H), 8.77 (d, J = 16.3 Hz, 1H), 8.39 (s, 1H), 7.91 (d, J = 4.1 Hz, 1H), 7.80–7.65 (m, 6H), 7.64–7.55 (m, 5H), 7.50 (d, J = 8.2 Hz, 5H), 7.27 (s, 2H), 7.11 (d, J = 7.8 Hz, 15H), 7.03 (t, J = 7.4 Hz, 5H); 13C NMR (101 MHz, CDCl3) δ 147.59, 132.40, 131.00, 129.42, 128.92, 127.81, 124.66, 123.25; ESI HRMS m/z = 945.3013 [M-H]+, calcd. for C63H42N6O2S = 946.31.
TPPF: 1H NMR (400 MHz, DMSO-d6) δ 8.76–8.15 (m, 3H), 8.02–7.47 (m, 13H), 7.45–6.72 (m, 24H); 13C NMR (101 MHz, DMSO-d6) δ 147.74, 147.42, 130.15, 128.17, 126.53, 126.23, 124.82, 123.94, 123.91, 123.53, 123.49, 123.48; ESI HRMS m/z = 969.3110 [M-COO]+, calcd. for C65H42F3N5O2S = 1013.30.

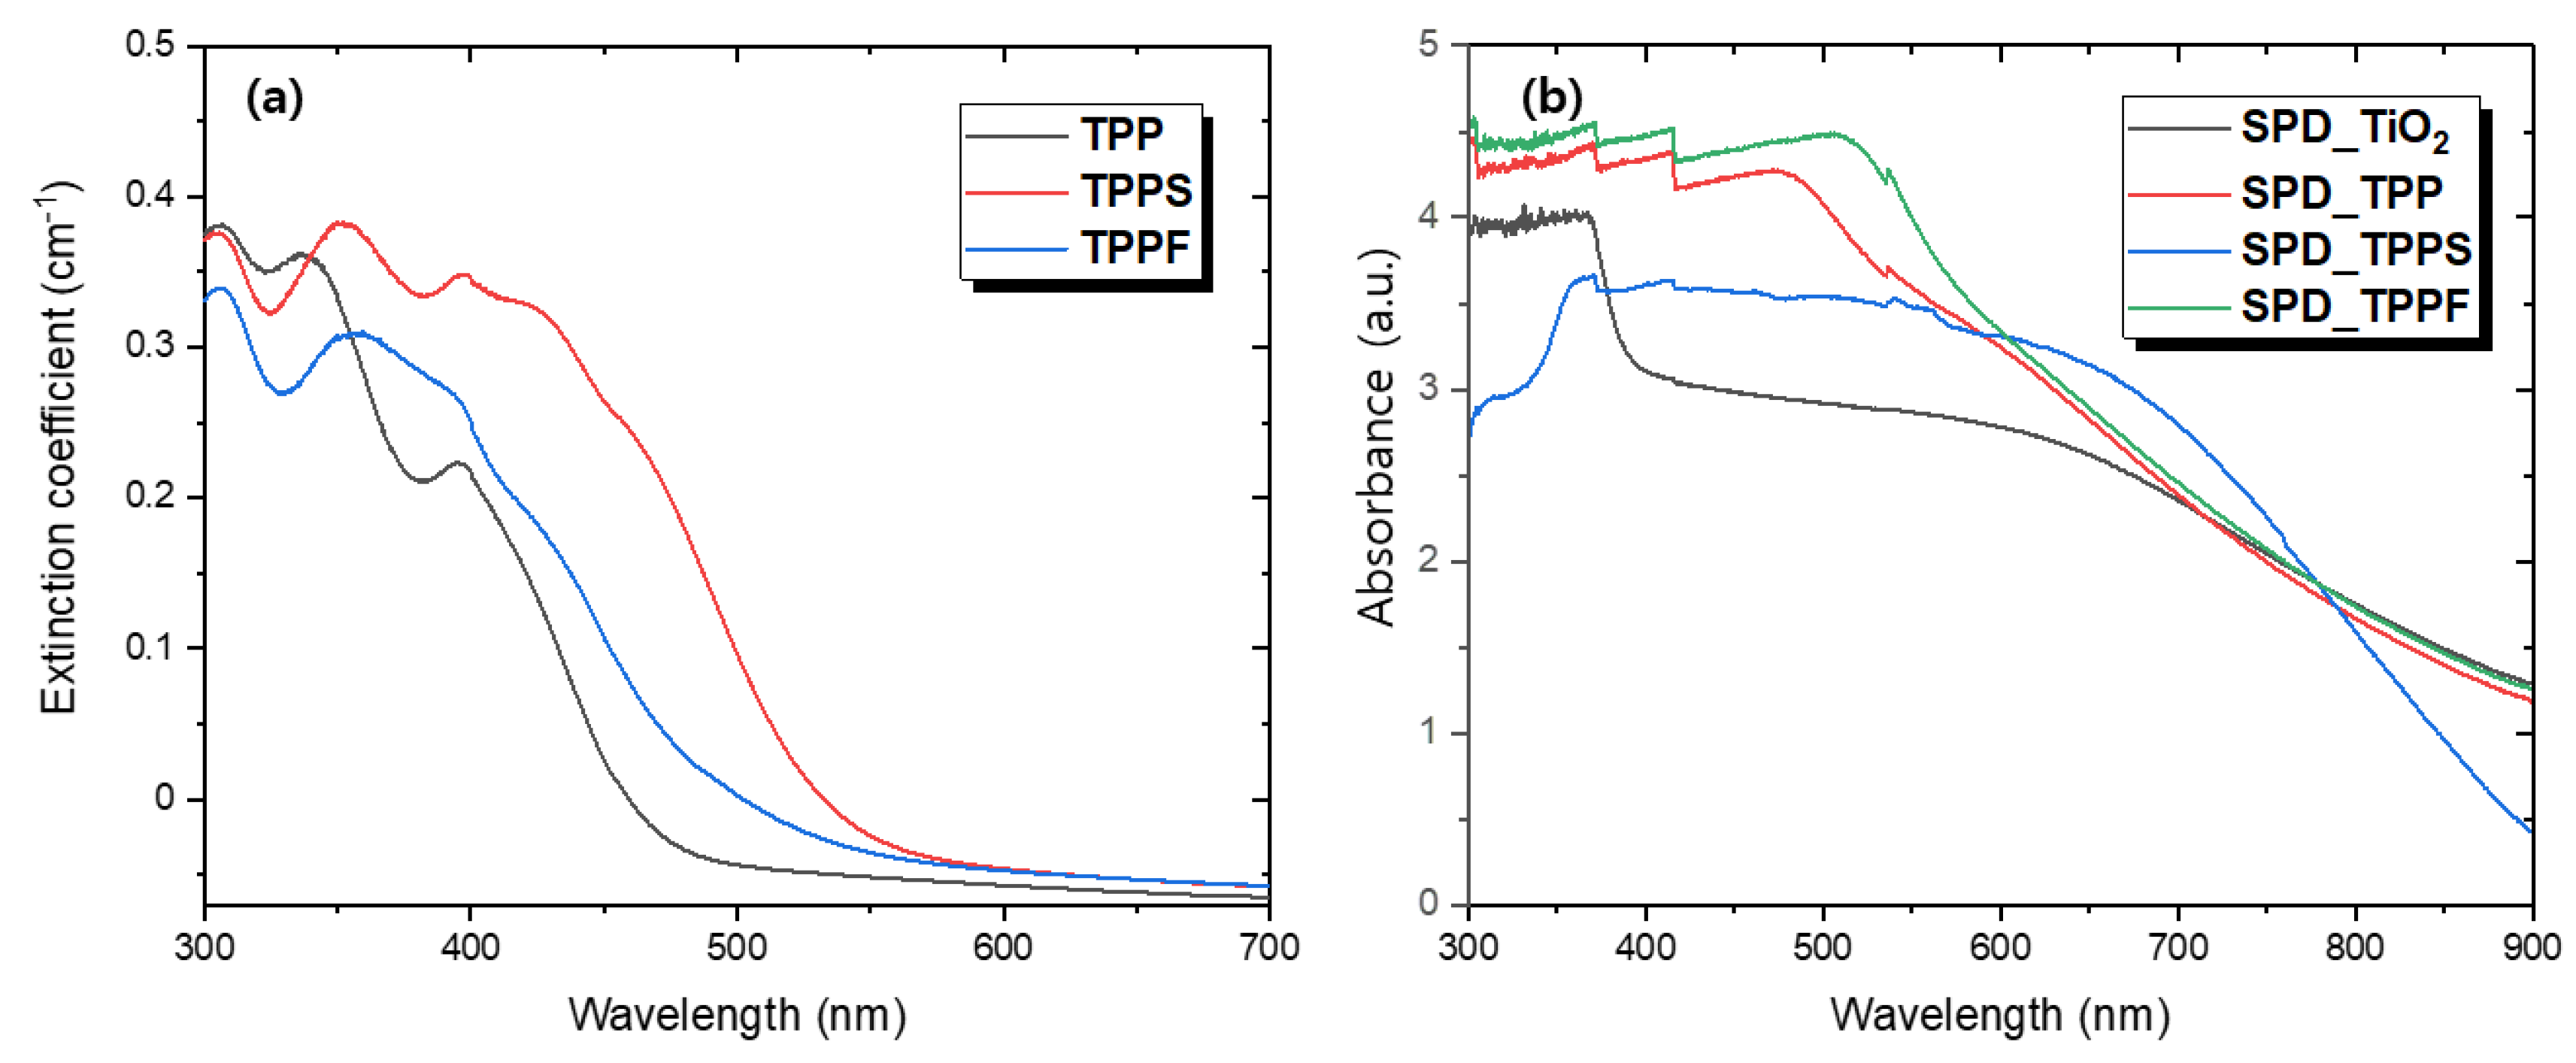
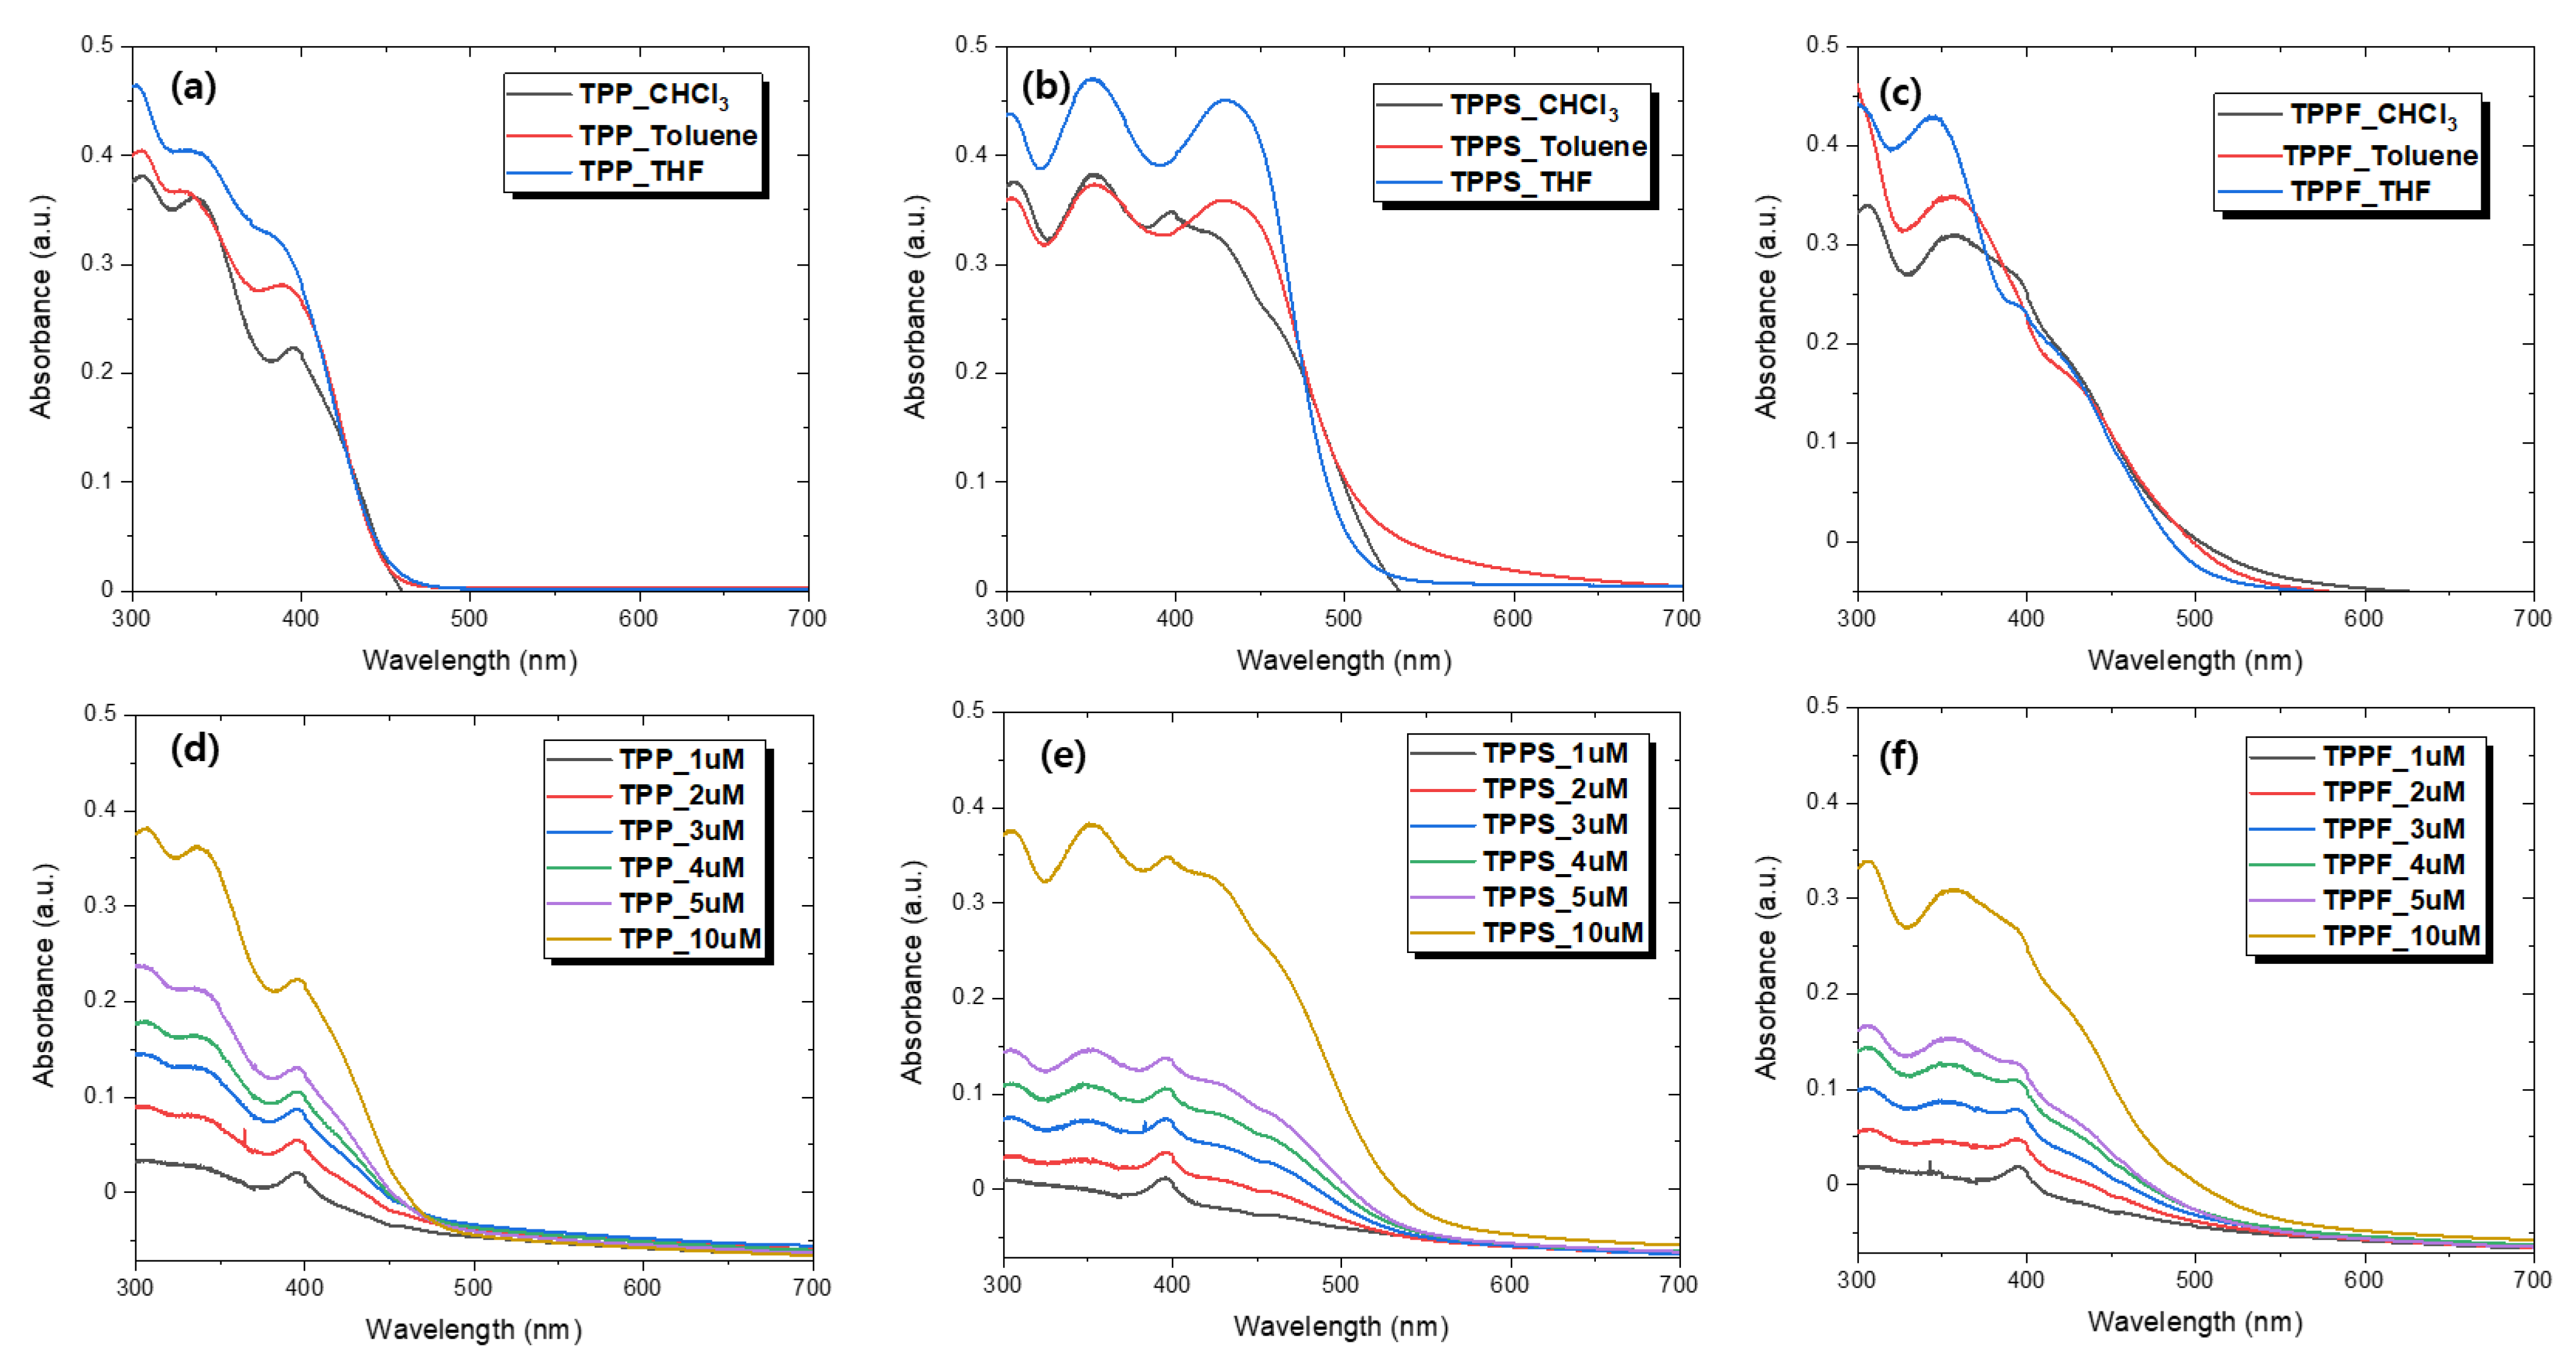
3.2. Optical Properties

The UV-vis absorption spectra of the TPP, TPPS, and TPPF in CHCl3 (10 μM) and the TPP, TPPS, and TPPF adsorbed on the SPD type TiO2 electrodes are shown in Figure 3. In the CHCl3 solution, TPP, TPPS, and TPPF showed two distinct absorption peaks of 338/396, 350/398, and 358/396 nm, respectively. The absorption maximum (λmax) at 338 (TPP), 349 (TPPS), and 358 (TPPF) nm correspond to the π-π* electron transition. This result shows that the red shift of the λmax was due to the expansion of the π-electron conjugation caused by the introduction of the thiophene as conjugated bridges in TPPS and TPPF. The absorption peak at 396 (TPP) nm corresponds to the ICT between the triphenylamine donating unit and the acetic acid anchoring moiety. Additionally, absorption peaks at 398 (TPPS) and 396 (TPPF) nm correspond to the ICT between the triphenylamine donating unit and the cyanoacrylic acid anchoring moiety. Their absorption peaks were broadly extended over 500 nm.
In Figure 3b, when TPP, TPPS, and TPPF were adsorbed on the SPD type TiO2 surface, their absorption maxima were red-shifted by 75, 62, and 112 nm in comparison to those in CHCl3 solution, respectively, due to interaction of the anchoring group with the surface titanium oxide anions [26] and partial formation of J-type aggregates [27,28]. These spectral changes might be related to intermolecular interactions of photosensitizer molecules on nanoporous TiO2 surfaces. It has been well documented that the face-to-face, H-type aggregation of π-molecules can generate a blue shift of the absorption band, whereas the tilted (or head-to-tail), J-type aggregation results in a red shift. Moreover, when TPP, TPPS, and TPPF were adsorbed on the SPD type TiO2 surface, their absorptions broadened over 800 nm in the visible wavelength due to predominating light scattering effects of the multi-layered TiO2 (SPD) layer. The absorbance remarkably improved the absorption in the range from visible to near IR because of light scattering by additional scattering layers comprised of larger nanoparticles.
Figure 4a–c show comparisons of the absorption spectra of TPP, TPPS, and TPPF in different solvents at a concentration of 10 μM. Corresponding data are listed in Table 1. The synthesized three photosensitizers (TPP, TPPS, and TPPF) were insoluble in alcohol solvents; however, they were well soluble in solvents such as CHCl3, THF, and toluene. UV-vis absorption and fluorescence emission of TPP, TPPS, and TPPF were evaluated according to three different solvents as shown in Figure 4a–c and Figure 5. All the photosensitizers showed the relatively higher absorption properties in THF solvent. However, when DSSC devices using three photosensitizers adsorbed according to three solvents were fabricated, it was difficult to confirm the reproducibility of photovoltaic performances except CHCl3 solvent. Therefore, to obtain stable DSSC results, we used CHCl3 as a solvent for photosensitizer solutions. In Figure 4d–f, absorption spectra of the TPP, TPPS, and TPPF in CHCl3 solution at various concentrations (1~10 μM) were used to calculate the molar extinction coefficient (ε, M−1cm−1) with concentration plots in Figure S7. These concentrations (μM unit) were very low to wholly adsorb the TiO2 surface. In general, 0.1~0.5 mM solution of photosensitizers is required to adsorb the TiO2 surface sufficiently. As expected, the absorbance increased as the concentration increased. The molar extinction coefficient (ε, M−1cm−1) was calculated using the slope of the absorbance vs. the concentration plot in Figure S7. Molar extinction coefficients of TPP, TPPS, and TPPF at λmax of absorption were 21,770 M−1cm−1, 37,700 M−1cm−1, and 27,510 M−1cm−1, respectively.
Fluorescence emission spectra of TPP, TPPS, and TPPF in different solvents at a concentration of 10 μM are shown in Figure 5. Corresponding data are also summarized in Table 1. When TPP, TPPS, and TPPF were excited within π-π* bands, they exhibited very weak luminescence maxima at 529, 628, and 620 nm in CHCl3, and 568, 629, and 655 nm in tetrahydrofuran (THF), respectively. On the other hand, TPP, TPPS, and TPPF exhibited relatively strong luminescence maxima at 505, 575, and 598 nm in toluene, respectively. This phenomenon might be because synthesized TPP, TPPS, and TPPF photosensitizers were relatively less entangled with molecules in the toluene solvent.

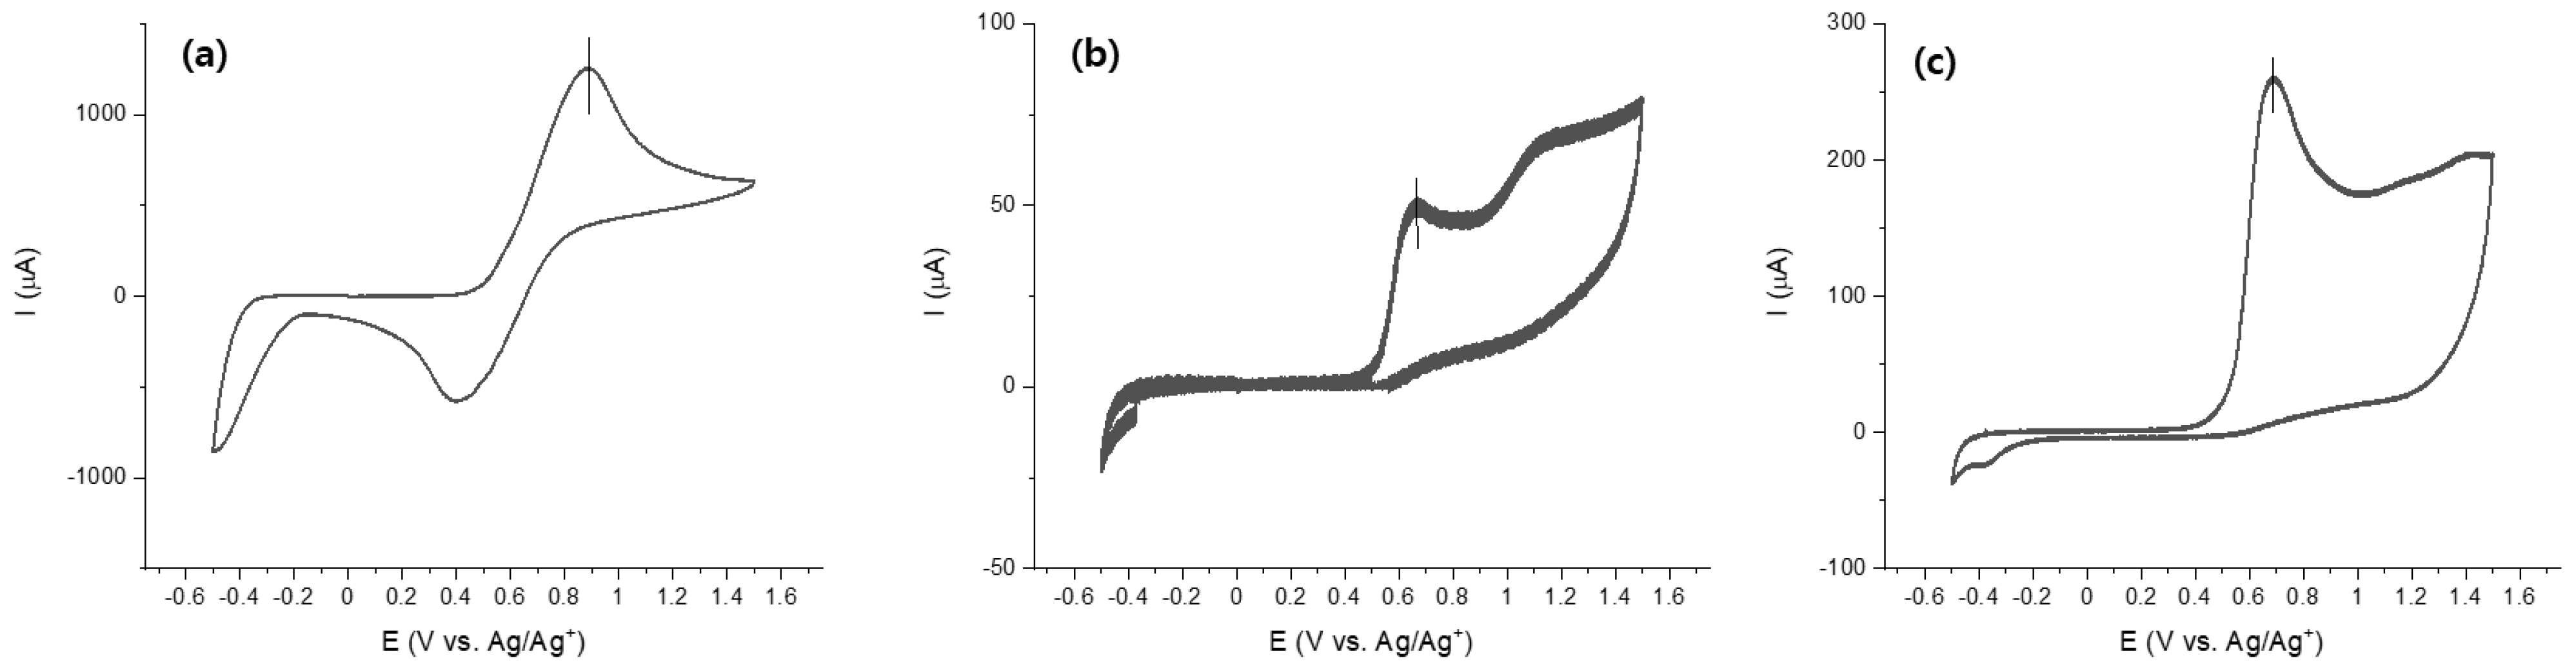
3.3. Electrochemical Properties

The electrochemical properties of TPP, TPPS, and TPPF adsorbed on TiO2 electrodes were investigated by cyclic voltammetry (CV) analysis. To obtain CVs of photosensitizer compounds adsorbed on TiO2 electrodes, photosensitizer-coated TiO2 electrodes were coated as working electrodes. An Ag/AgNO3 electrode and a Pt wire were used as a reference electrode and a counter electrode, respectively. The supporting electrolyte was 0.1 M tetrabutylammonium hexafluoroborate (TBATFB) in acetonitrile. A CV of ferrocene was obtained, and the ferrocenium/ferrocene (Fc+/Fc) redox couple was used as a potential reference. The potentials of the photosensitizer vs. a normal hydrogen electrode (NHE) were calibrated by the potentials vs. Fc+/Fc.
Cyclic voltammograms of TPP, TPPS, and TPPF adsorbed on TiO2 electrodes are shown in Figure 6, and the corresponding data are summarized in Table 1. Cyclic voltammogram of TPP, TPPS, and TPPF adsorbed on TiO2 electrodes showed oxidation waves in the region of 0.89, 0.65, and 0.68 V, respectively, which belonged to the triphenylamine unit in Figure 6. The optical band gap estimated from the absorption edge of the absorption spectra of the photosensitizer adsorbed on the TiO2 electrode is shown in Figure S8. The LUMO was calculated from the HOMO value and the optical band gap. In TPPS and TPPF, LUMOs were mainly localized in the thiophene–cyanoacrylic acid unit through the pyrazine derivative group; however, the LUMOs of TPP were mainly localized in the pyrazine derivative group. Thus, the HOMO–LUMO excitation induced by irradiation could shift electron density from the triphenylamine to the pyrazine derivative group or the cyanoacrylic acid group. This will ensure an efficient electron injection into the TiO2 layer after light absorption by the photosensitizers. Furthermore, comparison of the computed HOMO and LUMO energies with the edge of the conduction band of TiO2 and the potential of the redox couple (Figure 7) showed that they all had more negative HOMO energies than the I3/I redox couple (−4.8 eV vs. vacuum) [30], leading to a fast regeneration of oxidized photosensitizers. The more positive LUMO energies relative to the conduction band of TiO2 (−4.0 eV vs. vacuum) [31] ensured an effective injection of excited electrons.

3.4. Molecular Orbital Calculations

The density functional theory (DFT) calculations were performed for organic photosensitizers using the Gaussian 09 program package, and frontier molecular orbitals of HOMO and LUMO of TPP, TPPS, and TPPF photosensitizers are illustrated in Figure 7. Detailed descriptions were provided in Supporting Information.

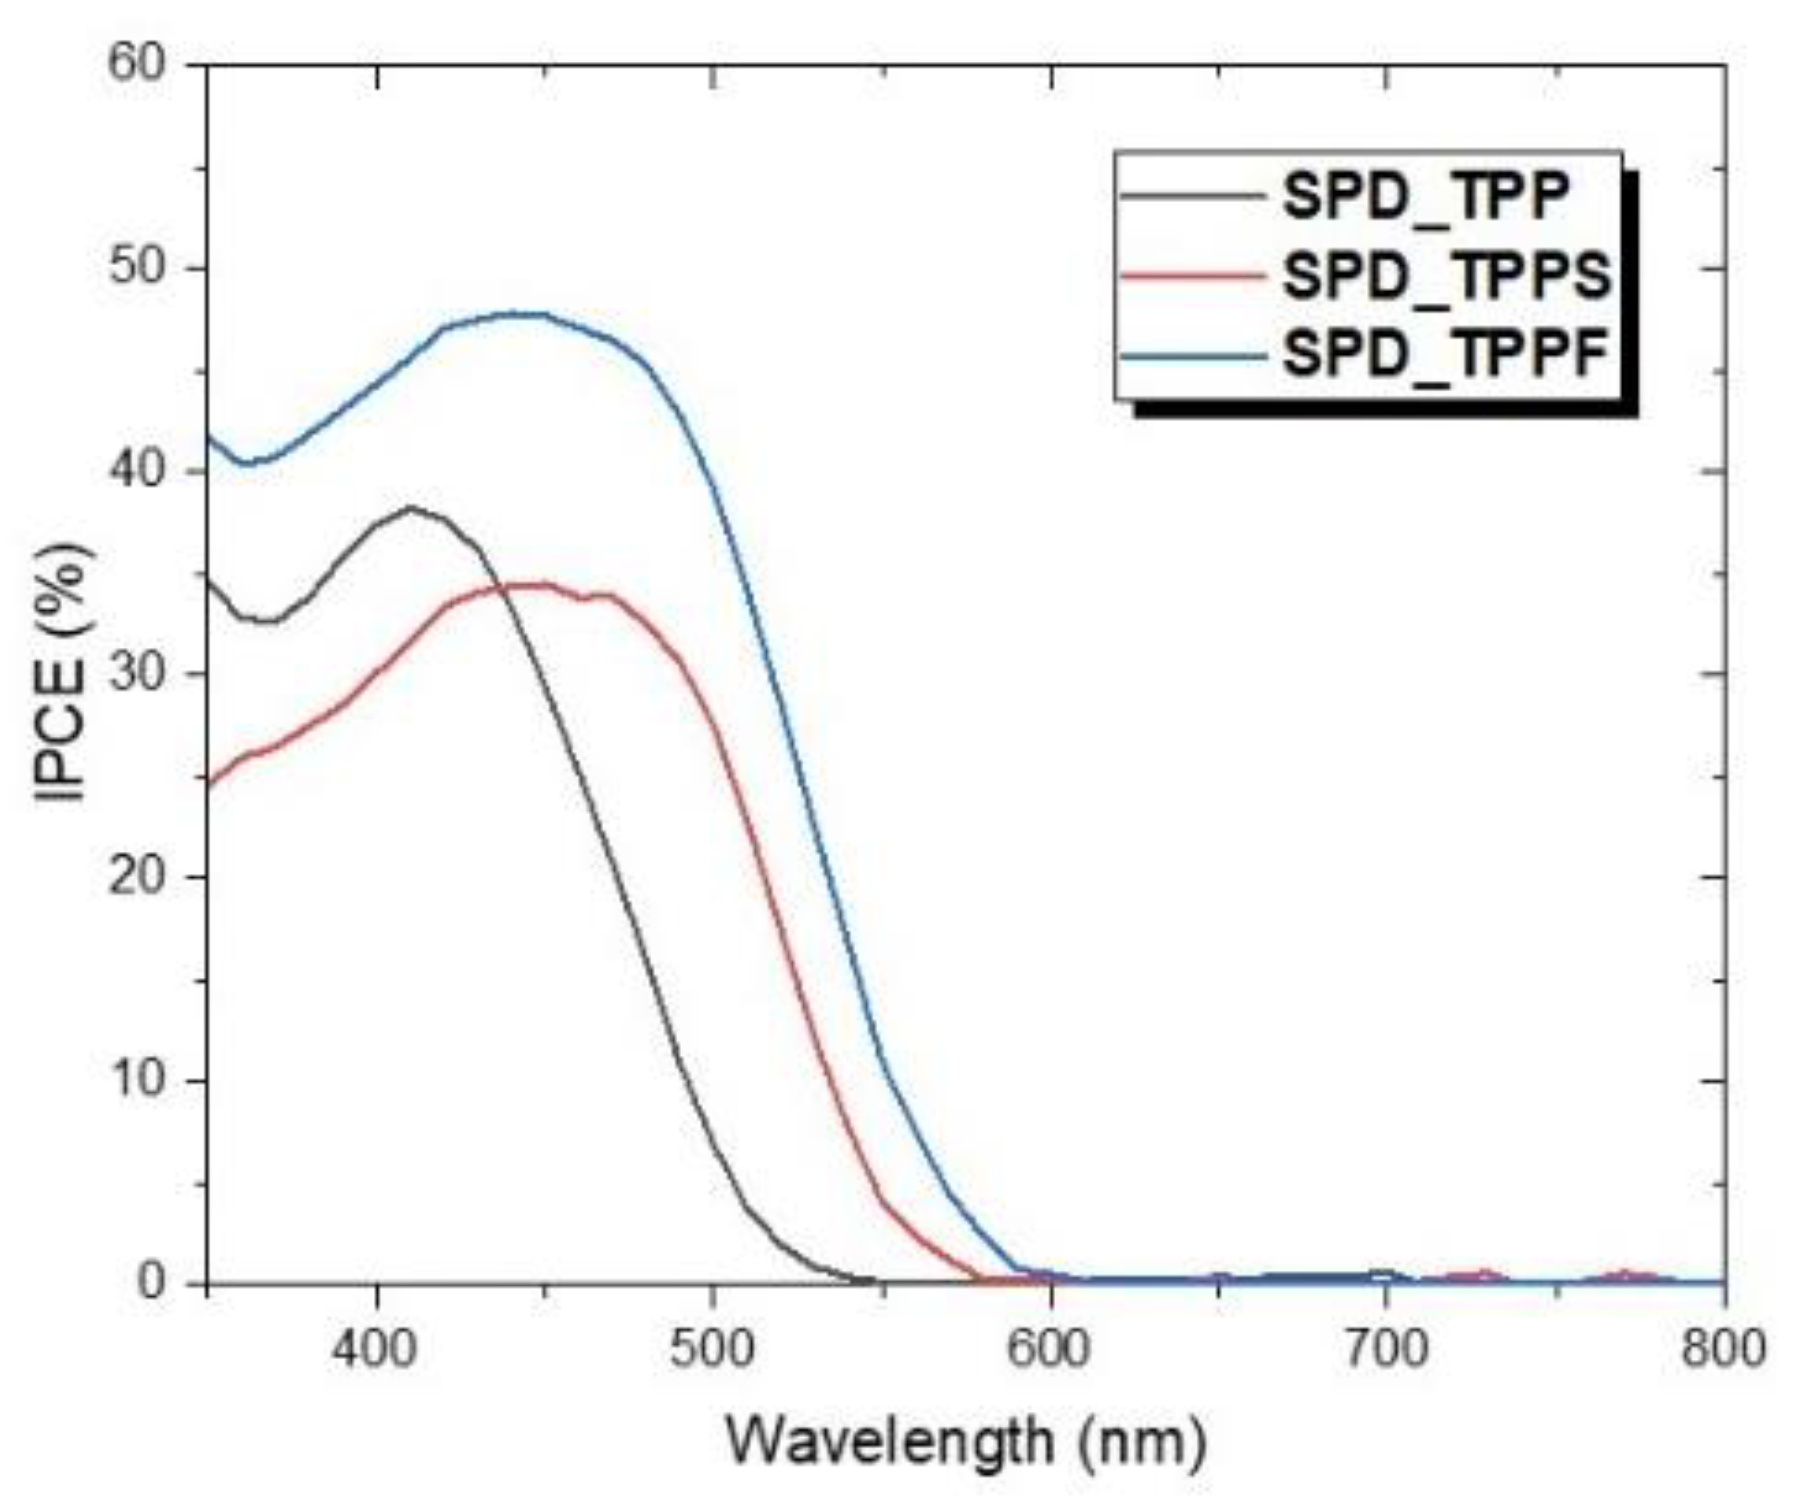
3.5. Photovoltaic Performance of DSSC Devices

DSSC devices using TPP, TPPS, and TPPF as photosensitizers were fabricated with a nanoporous TiO2 electrode, the electrolyte, and a Pt counter electrode. Figure 2 shows a multi-layered type nanoporous TiO2 electrode (SPD) consisting of compact TiO2 as a blocking layer, transparent TiO2, and dispersed TiO2 as a scattering layer. In the SEM surface images of nanoporous TiO2 electrodes (Figure 8), small grains with a dense structure and good surface coverage were observed. The thickness calculated from cross-section images of SPD type TiO2 electrodes was approximately 20 μm, containing 0.8 μm of compact TiO2. The formation of a dense bottom layer and a porous top layer in SPD type TiO2 electrodes was observed. As shown in Figure 8a, in the bottom layer by compact TiO2, the formation of densely and uniformly formed thin films was probably due to the small particle size of TiO2. In Figure 8b–d, SPD type TiO2 electrodes showed small aggregates and large particles due to the top layer of dispersed TiO2; however, they showed a relatively good surface coverage. It could be sufficient for the effect of light scattering to be observed in these multi-layered TiO2 electrodes. The bright part in these images was titania, while the dark part that dispersed around titania was the impregnated photosensitizer. In order to improve the performances of DSSC devices, it is necessary to understand the relationship between the pore size and the surface area of nanoporous TiO2. In order to penetrate the iodide ions of electrolytes into the pores of nanoporous TiO2, the pore size should be large enough; on the other hand, the surface area of nanoporous TiO2 should be large enough to adsorb many photosensitizers. By controlling the pore size and surface area of nanoporous TiO2, the power conversion efficiency of the DSSC device can be maximized.
Incident monochromatic photon-to-current conversion efficiency (IPCE) spectra of DSSC devices based on TPP, TPPS, and TPPF photosensitizers are presented in Figure 9, and corresponding data are listed in Table 2. The IPCE were calculated according to equation (S1) in Supporting Information. Figure 9 shows that the TPP, TPPS, and TPPF can efficiently convert visible light to photocurrents in the region from about 350 nm to 600 nm. DSSCs based on TPP, TPPS, and TPPF photosensitizers produced maximum IPCE values of 38.19% at 410 nm, 34.48% at 450 nm, and 47.80% at 440 nm, respectively. In the case of the N719 dye at the same conditions, the maximum IPCE is 47.35% at 500 nm. The IPCE spectrum of DSSC based on N719 dye showed a widely longer wavelength over 600 nm in Figure S9. These results showed that the red shift of the maximum IPCE was due to expansion of the π-electron conjugation, consistent with absorption spectra of these three organic photosensitizers.
The power conversion efficiency and photovoltaic performance parameters of the DSSC devices were calculated according to Equations (S2) and (S3) in Supporting Information. Figure 10 shows J-V curves of DSSC devices using TPP, TPPS, and TPPF photosensitizers. Cells with an active area of 0.40 cm2 were fabricated and DSSC devices were fabricated with three different photosensitizers (TPP, TPPS, and TPPF) and SPD type TiO2 electrodes. We simultaneously fabricated three DSSC devices for each of the photosensitizers (TPP, TPPS, and TPPF) and tested them at the same conditions. To satisfy the reliability of the test results, three or more experiments in all DSSC devices were repeatedly performed at the same conditions. The photovoltaic performances in Table 2 are summarized as the best results among all the results under AM 1.5 illumination. At the same conditions, Figure S10 shows the J-V curve of the DSSC device using N719 photosensitizer and photovoltaic parameters (Jsc: 14.39 mA/cm2, Voc: 0.73 V, FF: 0.52, η: 5.50%). As shown in Figure 10 and Table 2, the TPPF sensitized cell showed the highest η of 2.64% (Jsc: 5.69 mA/cm2, Voc: 0.69 V, FF: 0.67). Depending on photosensitizers, the power conversion efficiencies of these DSSCs were in the order of TPPF (2.64%) > TPP (1.80%) > TPPS (1.31%).
Measured Jsc (TPP: 3.84 mA/cm2, TPPS: 4.01 mA/cm2, TPPF: 5.69 mA/cm2) values of DSSC devices based on the three photosensitizers corresponded to IPCE spectra (Figure 9). The larger Jsc of these DSSC devices demonstrated the influence of the red-shifted absorption spectra of the TiO2 electrode and the broadening of the IPCE spectra in the order of TPPF > TPPS > TPP. The D-π-A-π’-A’ type TPPF and TPPS containing the thiophene-cyanoacryl group as the auxiliary linkers-acceptor (π’-A’) showed enhanced Jsc compared to the D-π-A type TPP containing no π’-A’unit due to extended conjugation groups.
Many factors can influence the Voc of DSSC devices [32]. First, Voc (TPP: 0.72 V, TPPS: 0.59 V, TPPF: 0.69 V) might be influenced by the amounts of photosensitizers adsorbed on the TiO2 electrode. The amounts of TPP, TPPS, and TPPF adsorbed on the TiO2 electrode were 0.58, 0.46, and 0.98 mmol/cm3, respectively. The amounts of the photosensitizers adsorbed on the TiO2 electrode were estimated by desorbing photosensitizers in a 50 mM NaOH solution. The uncovered TiO2 areas increased with decreasing amounts of photosensitizers adsorbed on the TiO2 electrode. This increase in the uncovered TiO2 area increased the possibility of redox species to access the TiO2 surface, allowing electron recombination with I3 acceptor species at the TiO2 surface. Therefore, although TPPS and TPPF had the same theoretical bandgap (2.13 eV) and similar optical bandgap, they showed a large difference in Voc. It was found that Voc increased with increasing amount of photosensitizers adsorbed on the TiO2 electrode. In addition, the chemical structure of the TPPF substituted trifluoromethyl group could prevent intermolecular aggregation, thus increasing the amount of TPPF adsorption on the TiO2 electrode. TPPF with this chemical structure increased not only the Voc value, but also the Jsc value, which eventually increased the overall efficiency. Second, the bandgap and HOMO/LUMO level of photosensitizers could influence the Voc. As shown in Table 1, the theoretical bandgap of TPP, TPPS, and TPPF are 2.73 eV, 2.43 eV, and 2.44 eV, respectively. Optical bandgaps calculated based on the energy of the absorption spectra of TPP, TPPS, and TPPF were 2.69 eV, 2.36 eV, and 2.38 eV, respectively. The Voc values of TPP (0.72 V) were higher than that of TPPS (0.59 V) or TPPF (0.69 V) due to the greater calculated bandgaps of TPP. However, the optical band gap of TPPF obtained from the absorbance spectra of the photosensitizer adsorbed onto TiO2 electrode was slightly higher than that of TPPS, although TPPS and TPPF have the same theoretical bandgap of 2.13 eV. As mentioned above, it could be affected by the amount of molar adsorption and the chemical structure of photosensitizers.

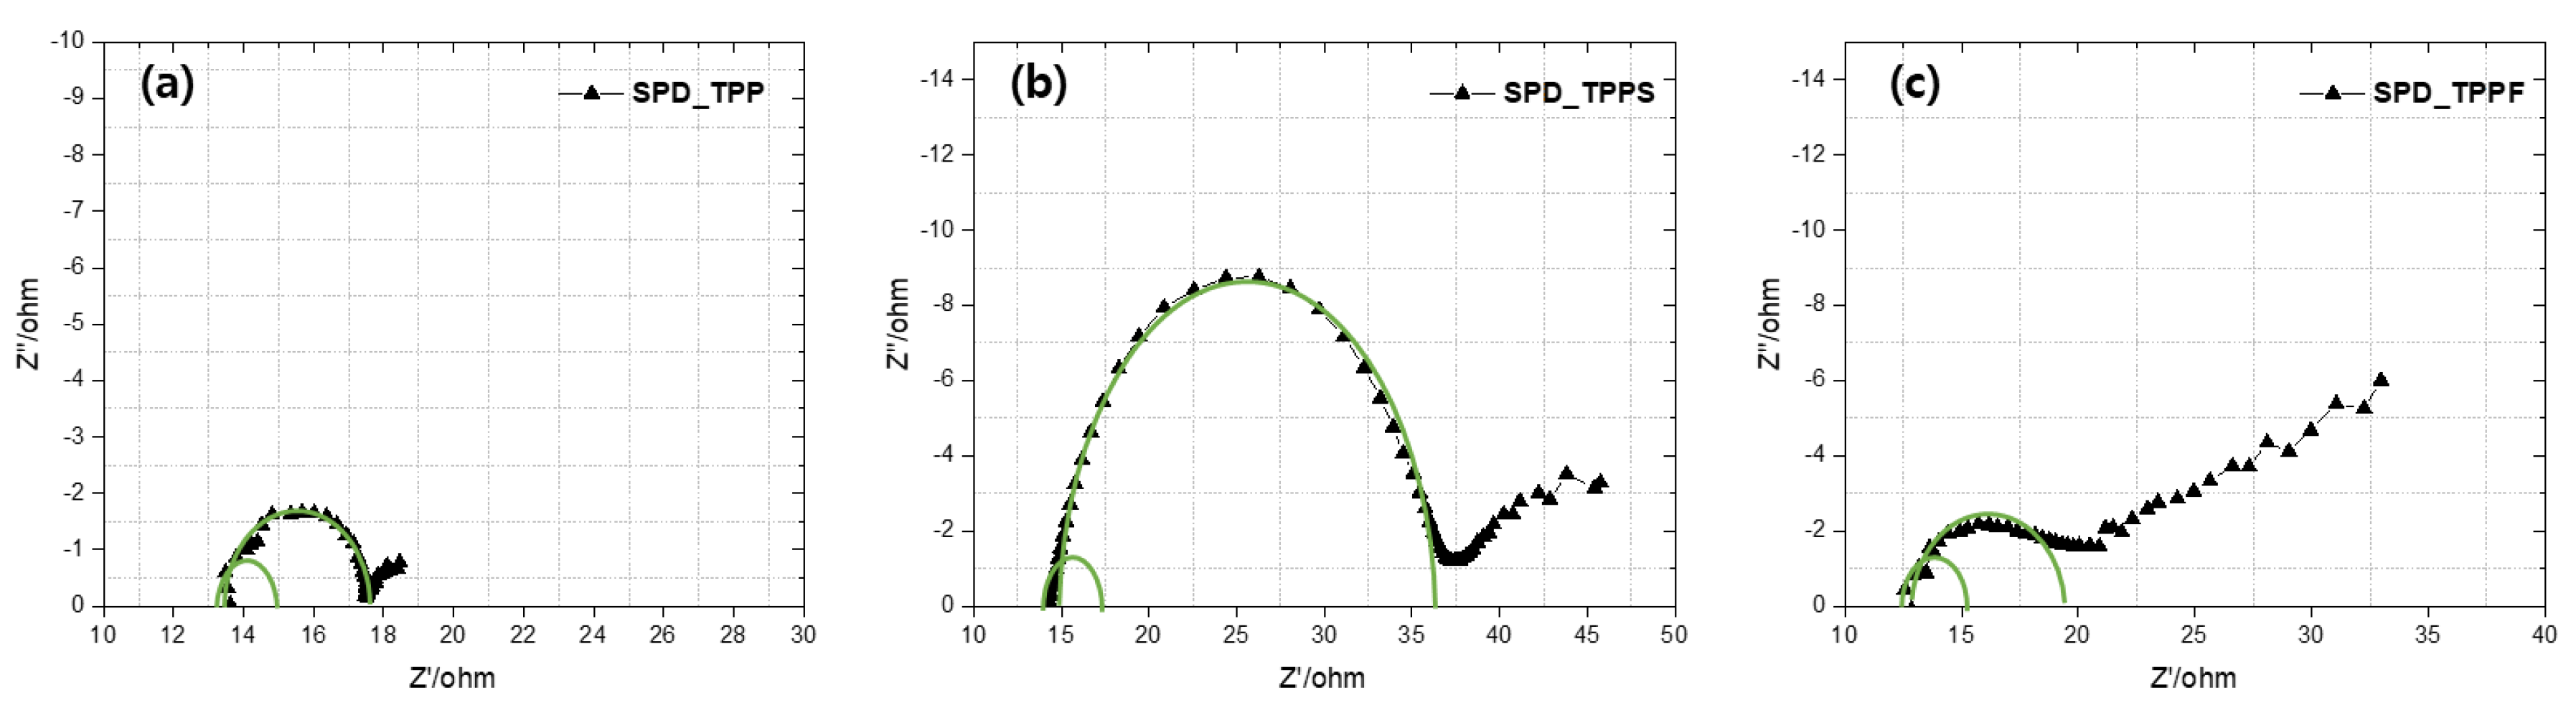
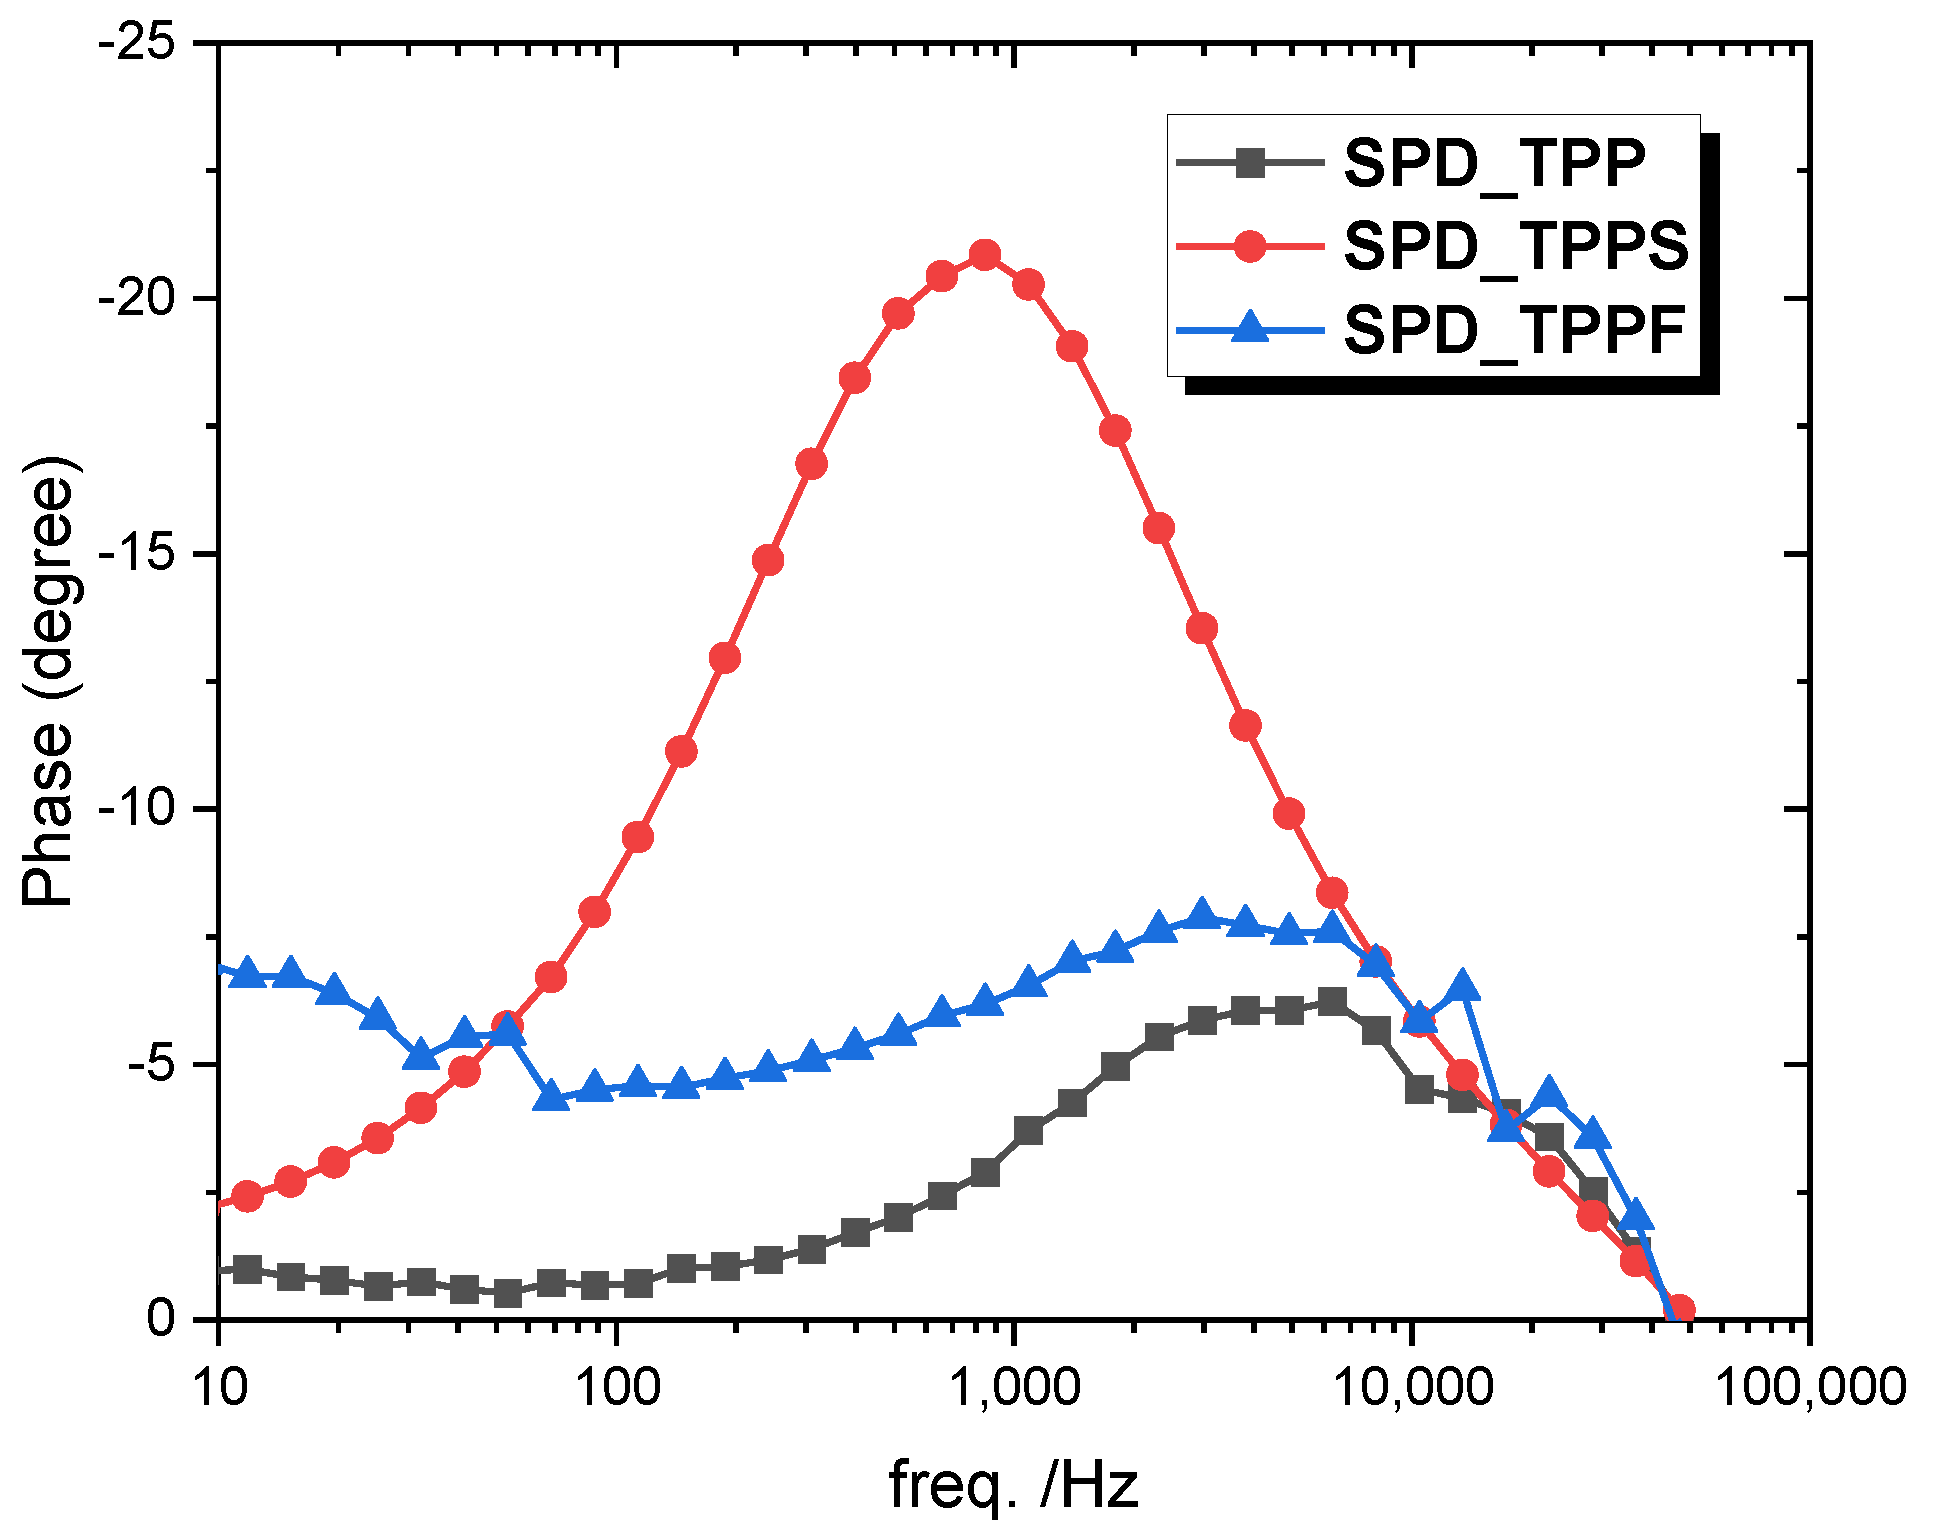
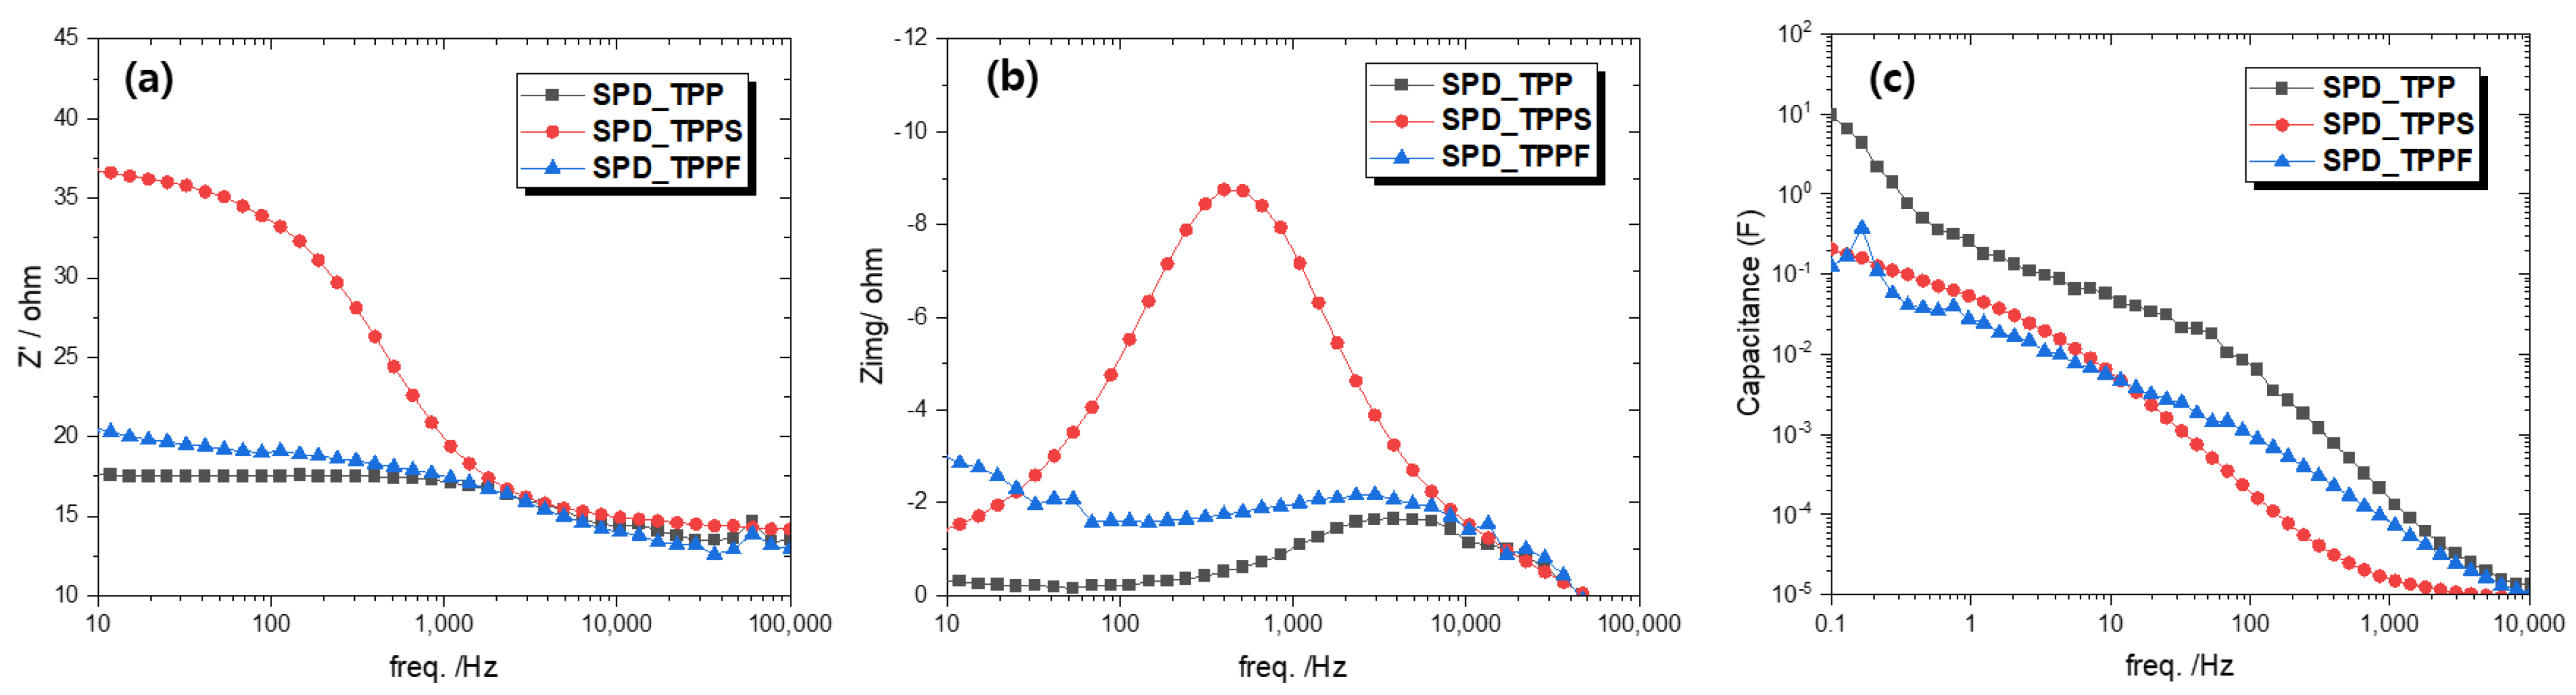
3.6. Electrochemical Impedance Spectroscopy

To confirm the effect of the interfacial charge transfer on photovoltaic performances of DSSC devices, interfacial charge transfer resistances were investigated by EIS measurements. EIS measurements of DSSC devices were recorded in the dark at −0.60 V (i.e., equivalent to the approximate Voc of the DSSC) at a frequency range of 0.1 Hz to 1 MHz. We simultaneously fabricated three DSSC devices for each of the photosensitizers (TPP, TPPS, and TPPF) at the same conditions, and the best of each of the three DSSC devices was tested by EIS measurements. To satisfy the reliability of the test results, three experiments were repeatedly performed at the same conditions. Nyquist plots and Bodes plots of DSSC devices using TPP, TPPS, and TPPF photosensitizers are shown in Figure 11 and Figure 12, respectively. Corresponding RS, R1CT, and R2CT data are summarized in Table 3, and the equivalent circuit is shown in Figure S9. The RS, R1CT, and R2CT are series resistance, charge transfer resistance of the Pt/electrolyte interface, and charge transfer resistance of the TiO2/photosensitizer/electrolyte interface, respectively [33]. There was no significant difference in RS and R1CT values of these DSSC devices based on the three kinds of organic photosensitizers. However, the R2CT of the DSSC device based on TPPS had a particularly high value of 22.56 Ω. It was more than four times higher than those of TPP and TPPF. The high R2CT caused poor results of FF in DSSC device-based TPPS, which in turn reduced all performances of this device. The cause of the low FF in TPPS was found in the interfacial problem of the TiO2/photosensitizer/electrolyte interface inside the DSSC device. From R2CT and FF results of TPPS and TPPF, it was confirmed that the bulky trifluoromethyl group of TPPF could help decrease the interfacial charge transfer resistance between the photosensitizer and the electrolyte in the DSSC system, which resulted in increasing the FF and the power conversion efficiency.
Electron lifetime (τe) values derived from peak frequency (fpeak) in the frequency region corresponding to the TiO2/photosensitizer/electrolyte interface are shown in the Bode plot (Figure 12), according to τe = 1/2πfpeak. Electron lifetime values of TPP, TPPS, and TPPF from curve fitting were 0.032, 0.188, and 0.042 ms, respectively. A longer electron lifetime indicates a more effective suppression of the back recombination reaction of the injected electrons with I3 in the electrolyte [34]. Electron lifetime values of these synthesized TPP, TPPS, and TPPF photosensitizers were too low to be considered to affect performances of DSSC devices.
To further explore electrical dynamics of carriers through DSSC based on TPP, TPPS, and TPPF, the variation of the real part of impedance (Z′) with frequency is shown in Figure 13a. It provides some important characteristics of the TiO2-adsorbed photosensitizer, such as (i) the appearance of the peak point at a certain frequency of the spectrum and (ii) coinciding the imaginary part of impedance curves with each other at high frequency. In Figure 13a, Z′ is plotted against operating frequency from 10 Hz to 1 × 10⁵ Hz. At the low frequency of 10 Hz, the values of Z′ were 17.6 Ω for TPP, 36.6 Ω for TPPS, and 20.3 Ω for TPPF, showing the highest Z′ value in TPP. The value of Z′ shows a frequency-independent behavior in the low frequency region, and shows a gradual tendency to decrease as the frequency increased. This phenomenon occurs because the interfacial charge carriers at low frequencies are trapped at the boundary of the TiO2-adsorbed photosensitizers, and can be easily relaxed when an electric field is applied. In addition, this can lead to an excess of the capacitance dependent on the time constant and frequency of the interfacial states, thus contributing to the conduction of the TiO2-adsorbed photosensitizers. At the middle frequency, the value of Z′ depends on the frequency, and as the frequency increases, it can be confirmed that the conductivity of the TiO2-adsorbed photosensitizers increases. Finally, at a higher frequency, all three photosensitizers show very low Z′ values, and space charge polarization can appear at the interface of the TiO2-adsorbed photosensitizers due to the reduced barrier properties of TiO2. The presence of space charge polarization in the sample is predicted based on the high Z′ values observed at lower frequencies [35,36]. Moreover, at higher frequencies (1 KHz), the values of Z′ merge together and are found to be frequency-independent, suggesting the release for space charge [37,38]. The space charge (or interfacial) polarization occurs when there is an accumulation of charge at an interface between two materials (TiO2-adsorbed the photosensitizer/Electrolyte) or between two regions (TiO2/photosensitizer) within a material (TiO2-adsorbed the photosensitizer) because of an external field. This can occur when there is a compound dielectric, or when there are two electrodes connected to a dielectric material.
The variation of the imaginary part of impedance (Z″) with the frequency is shown in Figure 13b. This behavior shows the presence of space charge in the system [36,37]. As the frequency increases, the value of Z″ increases, reaching a peak maximum. Then, as the frequency continues to increase, the Z″ gradually decreases. It can be seen that the region to the left of the peak maxima value represents the long range movement, and the region to the right represents the localized movement of charge carriers. Peak frequencies of TPP, TPPS, and TPPF were 4910 Hz, 512 Hz, and 3820 Hz, respectively. Positions of Z″ peaks mark values relaxation frequency (fmax). The relaxation time can then be estimated with the following relation: τ = 1/2πfmax. The relaxation time of TPP, TPPS, and TPPF shows 32 μs, 311 μs, and 41 μs, respectively. As shown in Figure 13b, all curves merged at a specific frequency in the higher frequency region. This could be due to the reduction in space charge polarization at a higher frequency [38].
The real part of capacitance change with frequency is shown in Figure 13c. From the change in capacitance with frequency, we confirmed the penetration of electrolyte ions into the pores of nanoporous TiO2 at a particular frequency. Ions in the electrolyte could access the deep pores inside the nanoporous TiO2 at lower frequencies. Therefore, the capacitance of TPP, TPPS, and TPPF increased at lower frequencies. Conversely, at high frequencies, electrolyte ions could not access the pores inside the nanoporous TiO2 and could only access the surface of the TiO2 pores. Therefore, the capacitance decreased. At very high frequencies, it behaved like a resistor and the capacitance became independent of frequency. Therefore, the value of the real part of the capacitance at low frequencies could be regarded as a measure of the capacitance stored in the system.

4. Conclusions

We successfully synthesized and characterized a series of new organic photosensitizers based on pyrazine derivatives (TPP, TPPS, and TPPF) to investigate the influence of the nature of the acceptor and the auxiliary heterocyclic linkers-acceptor. Their optical and electrochemical properties were explored and identified in relation to photovoltaic parameters. We investigated the effects of molecular structures of photosensitizers on performances of DSSCs. The D-π-A-π’-A’ type TPPS and TPPF containing the thiophene–cyanoacryl group as the auxiliary linkers-acceptor (π’-A’) showed enhanced Jsc compared to D-π-A type TPP due to extended conjugation groups. When the photosensitizer had the same donor (D) group and the same auxiliary linkers-acceptor (π’-A’) group, the trifluoromethyl-substituted benzopyrazine photosensitizer (TPPF) showed better Voc, FF, and overall conversion efficiency values than an unsubstituted benzopyrazine photosensitizer (TPPS). It was found that the bulky trifluoromethyl structure of TPPF prevented aggregations of photosensitizers. Accordingly, the molar adsorption amount of TPPF increased compared to TPPS with a similar structure. This affected the improvement of the Voc and the overall performances of the DSSC device based on TPPF. Overall conversion efficiencies of DSSCs based on the three kinds of photosensitizers were 1.31~2.64% in comparison with 5.5% for a DSSC based on the N719 dye under AM 1.5 irradiation (100 mW/cm2). Frequency dependences of the real and imaginary parts of impedance analysis were interpreted as interfacial behaviors of TiO2-adsorbed photosensitizers and electrolyte.

Supplementary Materials

The following supporting information can be downloaded at: https://www.mdpi.com/article/10.3390/en15165938/s1, Figure S1: 1H-NMR, 13C-NMR and HRMS spectra of TPP; Figure S2: 1H-NMR, 13C-NMR and HRMS spectra of TPPS; Figure S3: 1H-NMR, 13C-NMR and HRMS spectra of TPPF; Figure S4: 1H-NMR, 13C-NMR and HRMS spectra of 2b; Figure S5: 1H-NMR, 13C-NMR and HRMS spectra of 3a; Figure S6: 1H-NMR, 13C-NMR and HRMS spectra of 3b; Figure S7: The slope of the absorbance vs. concentration plot of (a) TPP, (b) TPPS, and (c) TPPF in CHCl3; Figure S8: Optical band gap (Eg) calculated by the (ahv)2-energy of the absorption spectra of (a) TPP, (b) TPPS, and (c) TPPF adsorbed on TiO2 electrode. Optical band gap (Eg) with Tauc equation by the use of baseline approach were determined; Figure S9: IPCE spectrum of DSSC device based on N719; Figure S10: J-V curve of the DSSC device based on N719; Figure S11: An equivalent circuit for EIS for DSSCs based on TPP, TPPS, and TPPF photosensitizers; Rs: series resistance; R1CT: charge transfer resistance of Pt/electrolyte interface; R2CT: charge transfer resistance of TiO2/photosensitizer/electrolyte interface; Q1 and Q2: constant phase element.

Author Contributions

Conceptualization and writing—original draft preparation, M.-R.K.; synthesis and writing—original draft preparation, T.C.P.; formal analysis, Y.C. and S.Y.; photovoltaic analysis, H.-S.Y.; electrochemical analysis, M.K.; supervision, S.L. and S.H.P. All authors have read and agreed to the published version of the manuscript.

Funding

This work was supported by the National Research Foundation of Korea (NRF) grant funded by the Korea government (MSIT) (No. 2022R1C1C1007740 and No. 2022R1A5A8023404) for S.L.

Institutional Review Board Statement

Not applicable.

Informed Consent Statement

Not applicable.

Data Availability Statement

Not applicable.

Conflicts of Interest

The authors declare no conflict of interest.

References

  1. O’Regan, B.; Gratzel, M. A low-cost, high-efficiency solar cell based on dye-sensitized colloidal TiO2 films. Nature 1991, 353, 737–740. [Google Scholar] [CrossRef]
  2. Sharma, K.; Sharma, V.; Sharma, S.S. Dye-sensitized solar cells: Fundamentals and current status. Nanoscale Res. Lett. 2018, 13, 381–427. [Google Scholar] [CrossRef]
  3. Nazeeruddin, K.; Baranoff, E.; Gratzel, M. Dye-sensitized solar cells: A brief overview. Sol. Energy 2011, 85, 1172–1178. [Google Scholar] [CrossRef]
  4. Altobello, S.; Bignozzi, C.A.; Caramori, S.; Larramona, G.; Quici, S.; Marzanni, G.; Lakhmiri, R. Sensitization of TiO2 with ruthenium complexes containing boronic acid functions. J. Photochem. Photobiol. A Chem. 2004, 166, 91–98. [Google Scholar] [CrossRef]
  5. Kunzmann, A.; Valero, S.E.; Sepúlveda, A.; Rico-Santacruz, M.; Lalinde, E.R.; Berenguer, J.; García-Martínez, J.M.; Guldi, D.; Serrano, E.D.; Costa, R. Hybrid dye-titania nanoparticles for superior low-temperature dye-sensitized solar cells. Adv. Energy Mater. 2018, 8, 121–212. [Google Scholar] [CrossRef]
  6. Chung, I.; Lee, B.; He, J.; Chang, R.P.H.; Kanatzidis, M.G. All-solid-state dye-sensitized solar cells with high efficiency. Nature 2012, 485, 486–489. [Google Scholar] [CrossRef]
  7. Tsai, M.C.; Wang, C.L.; Chang, C.W.; Hsu, C.W.; Hsiao, Y.H.; Liu, C.L.; Wang, C.C.; Lin, S.Y.; Lin, C.Y. A large, ultra-black, efficient and cost-effective dye-sensitized solar module approaching 12% overall efficiency under 1000 lux indoor light. Mater. Chem. A 2018, 6, 1995–2003. [Google Scholar] [CrossRef]
  8. Naim, W.; Novelli, V.; Nikolinakos, I.; Barbero, N.; Dzeba, I.; Grifoni, F.; Ren, Y.; Alnasser, T.; Velardo, A.; Borrelli, R.; et al. Transparent and colorless dye-sensitized solar cells exceeding 75% average visible transmittance. J. Am. Chem. Soc. 2021, 1, 409–426. [Google Scholar] [CrossRef]
  9. Velusamy, M.; Thomas, K.R.J.; Lin, J.T.; Hsu, Y.C.; Ho, K.C. Organic dyes incorporating low-band-gap chromophores for dye-sensitized solar cells. Org. Lett. 2005, 7, 1899–1902. [Google Scholar] [CrossRef]
  10. Cai, L.; Tsao, H.N.; Zhang, W.; Wang, L.; Xue, Z.; Gratzel, M.; Liu, B. Organic sensitizers with bridged triphenylamine donor units for efficient dye-sensitized solar cells. Adv. Energy Mater. 2013, 3, 200–205. [Google Scholar] [CrossRef]
  11. Yu, J.; Shen, T.L.; Weng, W.H.; Huang, Y.C.; Huang, C.I.; Su, W.F.; Rwei, S.P.; Ho, K.C.; Wang, L. Molecular design of interfacial modifiers for polymer-inorganic hybrid solar cells. Adv. Energy Mater. 2012, 2, 245–252. [Google Scholar] [CrossRef]
  12. Xiao, Y.; Su, X.; Lydia, S.V.; Lacaze, E.; Heinrich, B.; Donnio, B.; Kreher, D.; Mathevet, F.; Attias, A.J. Chemical engineering of donor–acceptor liquid crystalline dyads and triads for the controlled nanostructuration of organic semiconductors. Cryst. Eng. Commun. 2016, 18, 4787–4798. [Google Scholar] [CrossRef]
  13. Park, H.-H.; Meti, P.; Gong, Y.-D. Effect of conjugation on the optoelectronic properties of pyrazine-based push-pull chromophores: Aggregation-induced emission, solvatochromism, and acidochromism. Dyes Pigments 2021, 190, 109320. [Google Scholar] [CrossRef]
  14. Chalkias, D.A.; Charalampopoulos, C.; Aivali, S.; Andreopoulou, A.K.; Karavioti, A.; Stathatos, E. A di-carbazole-based dye as a potential sensitizer for greenhouse-integrated dye-sensitized solar cells. Energies 2021, 14, 1159. [Google Scholar] [CrossRef]
  15. Kim, S.H.; Choi, J.; Sakong, C.; Namgoong, J.W.; Lee, W.; Kim, D.H.; Kim, B.; Ko, M.J.; Kim, J.P. The effect of the number, position, and shape of methoxy groups in triphenylamine donors on the performance of dye-sensitized solar cells. Dyes Pigments 2015, 113, 390–401. [Google Scholar] [CrossRef]
  16. Tigreros, A.; Dhas, V.; Ortiz, A.; Insuasty, B.; Martín, N.; Echegoyen, L. Influence of acetylene-linked π-spacers on triphenylamine–fluorene dye sensitized solar cells performance. Sol. Energy Mater. Sol. Cells 2014, 121, 61–68. [Google Scholar] [CrossRef]
  17. Baheti, A.; Gajjela, S.R.; Balaya, P.; Thomas, K.R.J. Synthesis, optical, electrochemical and photovoltaic properties of organic dyes containing trifluorenylamine donors. Dyes Pigments 2015, 113, 78–86. [Google Scholar] [CrossRef]
  18. Misra, R.; Maragani, R.; Patelb, K.R.; Sharma, G.D. Synthesis, optical and electrochemical properties of new ferrocenyl substituted triphenylamine based donor–acceptor dyes for dye sensitized solar cells. RSC Adv. 2014, 4, 34904–34911. [Google Scholar] [CrossRef]
  19. Ying, W.; Yang, J.; Wielopolski, M.; Moehl, T.; Moser, J.E.; Comte, P.; Hua, J.; Zakeeruddin, S.M.; Tiana, H.; Gratzel, M. New pyrido[3,4-b]pyrazine-based sensitizers for efficient and stable dye-sensitized solar cells. Chem. Sci. 2014, 5, 206–214. [Google Scholar] [CrossRef]
  20. Meti, P.; Park, H.-H.; Gong, Y.-D. Recent developments in pyrazine functionalized p-conjugated materials for optoelectronic applications. J. Mater. Chem. C 2020, 8, 352–379. [Google Scholar] [CrossRef]
  21. Tian, H.; Yang, X.; Pan, J.; Chen, R.; Liu, M.; Zhang, Q.; Hagfeldt, A.; Sun, L. A Triphenylamine Dye Model for the Study of Intramolecular Energy Transfer and Charge Transfer in Dye-Sensitized Solar Cells. Adv. Funct. Mater. 2008, 18, 3461–3468. [Google Scholar] [CrossRef]
  22. Hara, K.; Sayama, K.; Ohga, Y.; Shinpo, A.; Sugab, S.; Arakawa, H. A coumarin-derivative dye sensitized nanocrystalline TiO2 solar cell having a high solar-energy conversion efficiency up to 5.6%. Chem. Commun. 2001, 6, 569–570. [Google Scholar] [CrossRef]
  23. Tian, H.; Yang, X.; Chen, R.; Pan, Y.; Li, L.; Hagfeldt, A.; Sun, L. Phenothiazine derivatives for efficient organic dye-sensitized solar cells. J. Chem. Commun. 2007, 36, 3741–3743. [Google Scholar] [CrossRef]
  24. Ning, Z.; Zhang, Q.; Wu, W.; Pei, H.; Liu, B.; Tian, H. Starburst Triarylamine Based Dyes for Efficient Dye-Sensitized Solar Cells. J. Org. Chem. 2008, 73, 3791–3797. [Google Scholar] [CrossRef]
  25. Kim, K.H.; Lee, S.M.; Seo, M.H.; Cho, S.E.; Hwang, W.P.; Park, S.H.; Kim, Y.G.; Lee, J.K.; Kim, M.R. Syntheses of organic dyes based on phenothiazine as photosensitizers and effects of their π-conjugated bridges on the photovoltaic performances of dye-sensitized solar cells. Macromol. Res. 2012, 20, 128–137. [Google Scholar] [CrossRef]
  26. Jung, I.; Lee, J.K.; Song, K.H.; Song, K.; Kang, S.O.; Ko, J.J. Synthesis and photovoltaic properties of efficient organic dyes containing the benzo[b]furan moiety for solar cells. J. Org. Chem. 2007, 72, 3652–3658. [Google Scholar] [CrossRef]
  27. Sayama, K.; Tsukagoshi, S.; Mori, T.; Hara, K.; Ohga, Y.; Shinpou, A.; Abe, Y.; Suga, S.; Arakawa, H. Efficient sensitization of nanocrystalline TiO2 films with cyanine and merocyanine organic dyes. Sol. Energy Mater. Sol. Cells 2003, 80, 47–71. [Google Scholar] [CrossRef]
  28. Horiuchi, T.; Miura, H.; Uchida, S. Highly efficient metal-free organic dyes for dye-sensitized solar cells. J. Photochem. Photobiol. A 2004, 164, 29–32. [Google Scholar] [CrossRef]
  29. Patrycja, M.; Michał, P.; Wojciech, M. How to Correctly Determine the Band Gap Energy of Modified Semiconductor Photocatalysts Based on UV–Vis Spectra. J. Phys. Chem. Lett. 2018, 9, 6814–6817. [Google Scholar]
  30. Hagfeldt, A.; Grätzel, M. Light-induced redox reactions in nanocrystalline systems. Chem. Rev. 1995, 95, 49–68. [Google Scholar] [CrossRef]
  31. Asbury, J.B.; Wang, Y.-Q.; Hao, E.; Ghosh, H.N.; Lian, T. Evidences of hot excited state electron injection from sensitizer molecules to TiO2 nanocrystalline thin films. Res. Chem. Intermed. 2001, 27, 393–406. [Google Scholar] [CrossRef]
  32. Borbon, S.; Lugo, S.; Pourjafari, D.; Aguilar, N.P.; Oskam, G.; López, I. Open-circuit voltage (Voc) enhancement in TiO2-based DSSCs: Incorporation of ZnO nanoflowers and Au nanoparticles. ACS Omega 2020, 5, 10977–10986. [Google Scholar] [CrossRef] [PubMed]
  33. Kern, R.; Sastrawan, R.; Ferber, J.; Stangl, R.; Luther, J. Modeling and interpretation of electrical impedance spectra of dye solar cells operated under open-circuit conditions. Electrochim. Acta 2002, 47, 4213–4225. [Google Scholar] [CrossRef]
  34. Kuang, D.; Uchida, S.; Humphry-Baker, R.; Zakeeruddin, S.M.; Grätzel, M. Organic dye-sensitized ionic liquid based solar cells: Remarkable enhancement in performance through molecular design of indoline sensitizers. Angew. Chem. Int. Ed. 2008, 47, 1923–1927. [Google Scholar] [CrossRef] [PubMed]
  35. Jonscher, K. The ‘universal’ dielectric response. Nature 1977, 267, 673–679. [Google Scholar] [CrossRef]
  36. Singh, B.K.; Kumar, B. Impedance analysis and high temperature conduction mechanism of flux grown Pb(Zn1/3Nb2/3)0.91Ti0.09O3 single crystal. Cryst. Res. Technol. 2010, 45, 1003–1011. [Google Scholar] [CrossRef]
  37. Maier, J. Defect chemistry and ion transport in nanostructured materials: Part II. Aspects of nanoionics. Solid State Ion. 2003, 157, 327–334. [Google Scholar] [CrossRef]
  38. Sinclair, D.C.; West, A.R. Effect of atmosphere on the PTCR properties of BaTiO3 ceramics. J. Mater. Sci. 1994, 29, 6061–6068. [Google Scholar] [CrossRef]
Figure 1. Chemical structures of a series of new organic D-π-A type photosensitizers (TPP) and D-π-A-π’-A’ type photosensitizers (TPPS and TPPF).
Energies 15 05938 g001
Figure 2. Structures of DSSC devices and multi-layered TiO2 electrode (SPD) composited of compact TiO2, transparent TiO2, and dispersed TiO2.
Energies 15 05938 g002
Scheme 1. Synthetic process of photosensitizers.
Energies 15 05938 sch001
Figure 3. Absorption spectra of TPP, TPPS, and TPPF (a) in CHCl3 (10 μM) and (b) adsorbed on SPD type TiO2 electrodes. FTO glass was used as a reference in absorption spectra of (b).
Energies 15 05938 g003
Figure 4. Absorption spectra of the TPP, TPPS, and TPPF in different solvents at a concentration of 10 μM (ac) and in CHCl3 at various concentrations (1~10 μM) (df).
Energies 15 05938 g004
Figure 5. Fluorescence emission spectra of TPP, TPPS, and TPPF (10 μM) in different solvents. (a) TPP; (b) TPPS; (c) TPPF.
Energies 15 05938 g005
Figure 6. Cyclic voltammograms of (a) TPP, (b) TPPS, and (c) TPPF adsorbed on TiO2 electrodes in tetrabutylammonium hexafluoroborate (TBATFB) in acetonitrile recorded at a scan rate of 100 mV s−1.
Energies 15 05938 g006
Figure 7. Frontier molecular orbitals of TPP, TPPS, and TPPF optimized with DFT at the B3LYP/6-31G(d) level in vacuum. Electron densities of the highest occupied molecular orbitals (HOMO) and the lowest unoccupied molecular orbitals (LUMO) resulting from B3LYP/6-31G(d) geometry optimization of all photosensitizers are shown.
Energies 15 05938 g007
Figure 8. FE-SEM images. (a,a-1): surface and cross-section images of compact TiO2 (blocking layer); (b,b-1): surface and cross-section images of TPP adsorbed SPD type TiO2 electrode; (c,c-1): surface and cross-section images of TPPS adsorbed SPD type TiO2 electrode; (d,d-1): surface and cross-section images of TPPF adsorbed SPD type TiO2 electrode; and (e,e-1): surface and cross-section images of Pt counter electrode.
Energies 15 05938 g008
Figure 9. IPCE spectra of DSSC devices based on TPP, TPPS, and TPPF photosensitizers.
Energies 15 05938 g009
Figure 10. J-V curves of the DSSC devices based on TPP, TPPS, and TPPF photosensitizers.
Energies 15 05938 g010
Figure 11. Nyquist plots of the DSSC devices based on (a) TPP, (b) TPPS, and (c) TPPF photosensitizers.
Energies 15 05938 g011
Figure 12. Bode plots of the DSSC devices based on TPP, TPPS, and TPPF photosensitizers.
Energies 15 05938 g012
Figure 13. Real and imaginary impedance and capacitance spectra vs. frequency measured in open-circuit conditions for DSSC devices based on TPP, TPPS, and TPPF photosensitizers. (a) real part of impedance vs. frequency; (b) imaginary part of impedance vs. frequency; (c) capacitance vs. frequency.
Energies 15 05938 g013
Table 1. Photophysical and electrochemical data of TPP, TPPS, and TPPF.
Compoundλmax (nm)Emission (nm)E a (M−1cm−1)Eoxid (V)HOMO b/LUMO c (eV)Optical Band Gap d (eV)Theoretical Band Gap e (eV)
TPP338 f
336 g
338 h
590 f
505 g
568 h
21,7700.89−5.91/−3.182.732.78
TPPS350 f
350 g
352 h
628 f
575 g
629 h
37,7000.65−5.67/−3.242.432.13
TPPF358 f
358 g
357 h
620 f
598 g
655 h
27,5100.68−5.70/−3.262.442.13
a Molar extinction coefficients (ε). b The formal oxidation potentials (versus NHE) were internally calibrated with ferrocene and taken as the HOMO. c LUMO was calculated by HOMO + Optical band gap. d Optical band gap calculated by the (ahv)2-energy of the absorption spectra of photosensitizers adsorbed on TiO2 electrode in Figure S8 [29]. Readapted with permission from Ref. [29]. Copyright 2018, American Chemical Society. e Theoretical values at the B3LYP/6-31G(d) level. f Compound was measured in 10 μM of CHCl3. g Compound was measured in 10 μM of Toluene. h Compound was measured in 10 μM of THF.
Table 2. Maximum IPCE data and photovoltaic performances of DSSCs based on TPP, TPPS, and TPPF photosensitizers.
Maximum IPCE (%)Wavelength (nm)Voc (V)Jsc (mA/cm2)Fill FactorEfficiency (%)
SPD_TPP38.194100.723.840.651.8
SPD_TPPS34.484500.594.010.551.31
SPD_TPPF47.84400.695.690.672.64
Table 3. Series resistances (RS), charge transfer resistances of Pt/Electrolyte (R1CT), and charge transfer resistances of TiO2/Photosensitizer/Electrolyte (R2CT), and electron lifetime of DSSC devices based on TPP, TPPS, and TPPF photosensitizers.
RS (Ω)R1CT (Ω)R2CT (Ω)τe (ms) a
SPD_TPP13.622.085.90.032
SPD_TPPS14.365.6622.560.188
SPD_TPPF12.582.536.730.042
a The electron lifetime (τe) of injected electrons in the TiO2 films determining the frequency fpeak of the middle frequency peak using following equation, τe = 1/(2π fpeak) [34]. Readapted with permission from Ref. [34]. Copyright 2008, WILEY-VCH Verlag GmbH & Co. KGaA, Weinheim.
Publisher’s Note: MDPI stays neutral with regard to jurisdictional claims in published maps and institutional affiliations.

