Article

Ultra-Lean Premixed Turbulent Combustion: Challenges of RANS Modelling

ICE Group—Energy Department, Politecnico di Milano, Via R. Lambruschini 4a, 20156 Milano, Italy
*
Author to whom correspondence should be addressed.
Energies 2022, 15(16), 5947; https://doi.org/10.3390/en15165947
Submission received: 26 July 2022 / Revised: 10 August 2022 / Accepted: 13 August 2022 / Published: 17 August 2022

Abstract

:
The main challenge of improving spark ignition (SI) engines to achieve ever increasing thermal efficiencies and near-zero pollutant emissions today concerns developing turbulent combustion under homogeneous ultra-lean premixed mixtures (HULP). This continuous shift of the lean operation limit entails questions on the applicability limits of the combustion models used to date for SI engine design and optimization. In this work, an assessment of flamelet-based models, widely used in RANS SI engines simulations of premixed turbulent combustion, is carried out using an open-source 3D-CFD platform to clarify the applicability limits on HULP mixtures. Two different consolidated approaches are selected: the Coherent Flame Model (CFM) and the Flame Area Model (FAM). Both methodologies are embedded by the authors into the same numerical structure and compared against measurements over a simplified and controlled flame configuration, which is representative of engine-like conditions. The experimental steady-state flame of type “A” of the Darmstadt Turbulent Stratified Flame (TSF) burner is selected for the assessment. This configuration is characterized by flame measurements over a strong shear and mixing layer between the central high-speed CH 4 -air jet and the surrounding slow air co-flow, hence, it represents an interesting controlled condition to study turbulent HULP mixtures. A comparison between computed results and experimental data on trends of mean flow velocity, turbulence, temperature and mixture stratification was carried out. This enabled us to assess that the investigated flamelet-based combustion models failed in providing accurate and reliable results when the flame approaches turbulent HULP mixture conditions, demonstrating the urgency to develop models able to fill this gap.

1. Introduction

The rapid evolution of the transport sector towards complete environmental sustainability represents one of the major challenges that need to be overcome in the next decades. The goal of achieving a climate neutral world by mid-century is laid out in the Paris Agreement (PA), with the transport sector playing a leading role. In fact, several countries have already deployed dedicated packages of proposals to reduce greenhouse gas (GHG) emissions from the transport sector [1,2,3,4].
The spark-ignition (SI) engine represents one of the most interesting and feasible solutions in powertrain technologies to meet such ambitious targets. Currently, SI engines are under continuous improvement to achieve ever increasing thermal efficiencies as well as near-zero pollutant emissions [5,6,7]. In this framework, the major challenge is to operate the engine with homogeneous ultra-lean premixed (HULP) mixtures, which have the potential to minimize thermal losses, avoid soot formation and cut NO x emissions, paving the way for a further reduction in size and costs of the after-treatment system [8,9]. Recently, some innovative solutions, such as the prechamber turbulent jet ignition (TJI), have shown reduced combustion duration and increased lean operation limits when applied to HULP mixtures [10,11,12].
This continuous shift in the lean operation limit towards extremely high relative air/fuel ratios (e.g., λ > 2 for methane–air mixtures [13]) entails questions on the applicability limits of the numerical models used for SI engine design and optimization. In this context, 3D-CFD RANS approaches are extensively used, thanks to their compromise between limited computational efforts and accuracy of results [14,15]. The modeling of the turbulent premixed combustion usually relies on the flamelet assumption [16,17,18,19,20,21]. This hypothesis provides a great advantage from the modelling point of view because the reacting problem can be fully separated from the flame–turbulence interaction prediction. Concerning this last topic, several strategies are commonly applied for SI engines simulations: the Coherent Flame Model (CFM) proposed by Marble [16] and then developed by several authors [18,22], Weller’s Flame Area Model (FAM) [19,23] and the G-equation model from Peters [20,24].
However, a suitable assessment on HULP mixtures from the above flamelet-based approaches need to be carried out in simpler experimental configurations than SI engines. This is essential to detach the turbulent flame phenomenon from transient effects and/or external influences (e.g., the wall temperature effect) characterizing an internal combustion engine. Burners designed to stabilize premixed turbulent steady-state flames are suited for this goal, and from the literature, we know that several configurations are available. The turbulent stratified flame (TSF) burner of TU Darmstadt, characterised by three concentric pipes operating at ambient conditions, allows us to study several premixed flame types with unlimited optical access (open flame) and under controlled conditions [25]. The Cambridge stratified swirl burner (SwB) provides a more complex configuration. Its open-flame design, characterized by a central bluff-body together with a variable swirling flow, tries to emulate the flow complexity and flame stabilization methods seen in practical combustion systems [26,27].
In this work, an assessment of flamelet-based models used in RANS 3D-CFD simulations for premixed turbulent combustion is carried out to clarify their applicability limits for HULP mixtures. Two different consolidated approaches are selected: the Coherent Flame Model (CFM) and the Flame Area Model (FAM). To ensure a consistent comparison, both models are embedded into the same numerical structure used for SI engine simulations and implemented by the authors in the LibICE code. LibICE is a set of solvers and libraries based on the OpenFOAM® technology and recently applied for the simulation of the spark-ignition combustion process in gasoline and natural gas engines [28,29].
The model assessment is carried out on the steady-state open flame type “A” operated on the TSF burner (TSF-A) [25]. Despite the TSF-A configuration having been designed for flames interacting with a limited fuel stratification without flow shear, the actual experimental flame undergoes a relative air–fuel ratio varying from λ 1.1 to infinite (pure air). This gradual stratification is also characterized by a significant turbulence intensity level u induced by the interaction between the central high-speed premixed CH 4 -air flow (≈10 m/s) with the surrounding slow air co-flow (≈0.1 m/s). Therefore, through a numerical–experimental comparison in terms of mean flow velocity, turbulence, temperature and mixture stratification, the TSF-A configuration lets us clarify the limit of any RANS flamelet-based approach in predicting the existence of a flame front with respect to local levels of λ and u .

2. Approaches for Premixed Turbulent Combustion Modelling

2.1. The Coherent Flame Model

According to the available literature [18,22], the general architecture of the Coherent Flame Model (CFM) is characterised by a normalised progress variable c equation [22]:
ρ c ˜ t + · ρ U ˜ c ˜ · μ t c ˜ = ρ u S ˜ u Σ
which simulates the flame propagation process, coupled with the following transport equation for Σ [18,22]:
ρ Σ ˜ t + · ρ U ˜ Σ ˜ · μ t ρ Σ ρ + · U ˜ ρ Σ = S ρ Σ D ρ Σ 2
to model the flame–turbulence interaction.
In this work, the production S and destruction D terms of Equation (2) are modelled according to a general approach. First, the Choi–Huh strategy [22] of different closures for S and D between laminar and turbulent stages is selected. The applied formulations are:
  • Laminar stage
    S l a m = 2 ρ u / ρ b S u / r k D l a m = 0
  • Turbulent stage
    S t u r b = Γ K ¯ u / l t c D t u r b = S u + C k 1 / 2 / b 1 b
For the laminar stage, the expression proposed in [22] is employed, with the early flame kernel radius r k computed according to the 0-D model used in [29]. For fully turbulent conditions, D t u r b formula comes from the CFM-2b model version reported by Duclos [18], while the production term S t u r b is achieved by introducing the ITNFS model [18,30] on the Choi–Huh CFM-2 source term [22]. Then, Equations (3) and (4) are blended into a single general expression to model the laminar-to-turbulent flame transition:
S = α 1 f S l a m + f S t u r b + A i k U ˜ k / x i D = β 1 f D l a m + f D t u r b
where α and β are model constants that need a suitable calibration.
The averaging parameter 0 f 1 is used to model the flame evolution from laminar ( f = 0 ) to turbulent ( f 1 ) features, and it is computed according to [29]. The term A i k U ˜ k / x i is introduced to consider the Σ production from the flame stretch caused by mean flow gradients [18,31]. In case of isotropic turbulence, for the sake of simplicity, the same constant value can be assumed for each A i k term after a proper calibration.
Simplified ignition approaches [29], as well as more detailed methodologies [32,33,34], can be included into the numerical model structure implemented by the authors. However, the ignition model details are not discussed here because the present work is focused on steady-state flames.
The correlation proposed by Gulder [35] is selected for the unstrained laminar flame speed S u estimation. Even though this semi-empirical correlation is restricted by the validity limits of pressure, temperature and equivalence ratio, its application to open flames (ambient conditions) in the context of HULP mixtures could artificially extend the lean operation limit. Figure 1 shows a comparison between Gulder’s correlation and the tabulation approach based on a GRI-Mech 3.0 kinetic mechanism [36,37] for the laminar flame speed estimation at ambient conditions of CH 4 -air mixtures. As can be observed, close to the flammability limit ( ϕ < 0.4), the correlation proposed by Gulder overestimates the S u value with respect to tabulation strategy, yielding an artificial extension of the lean operation limit.
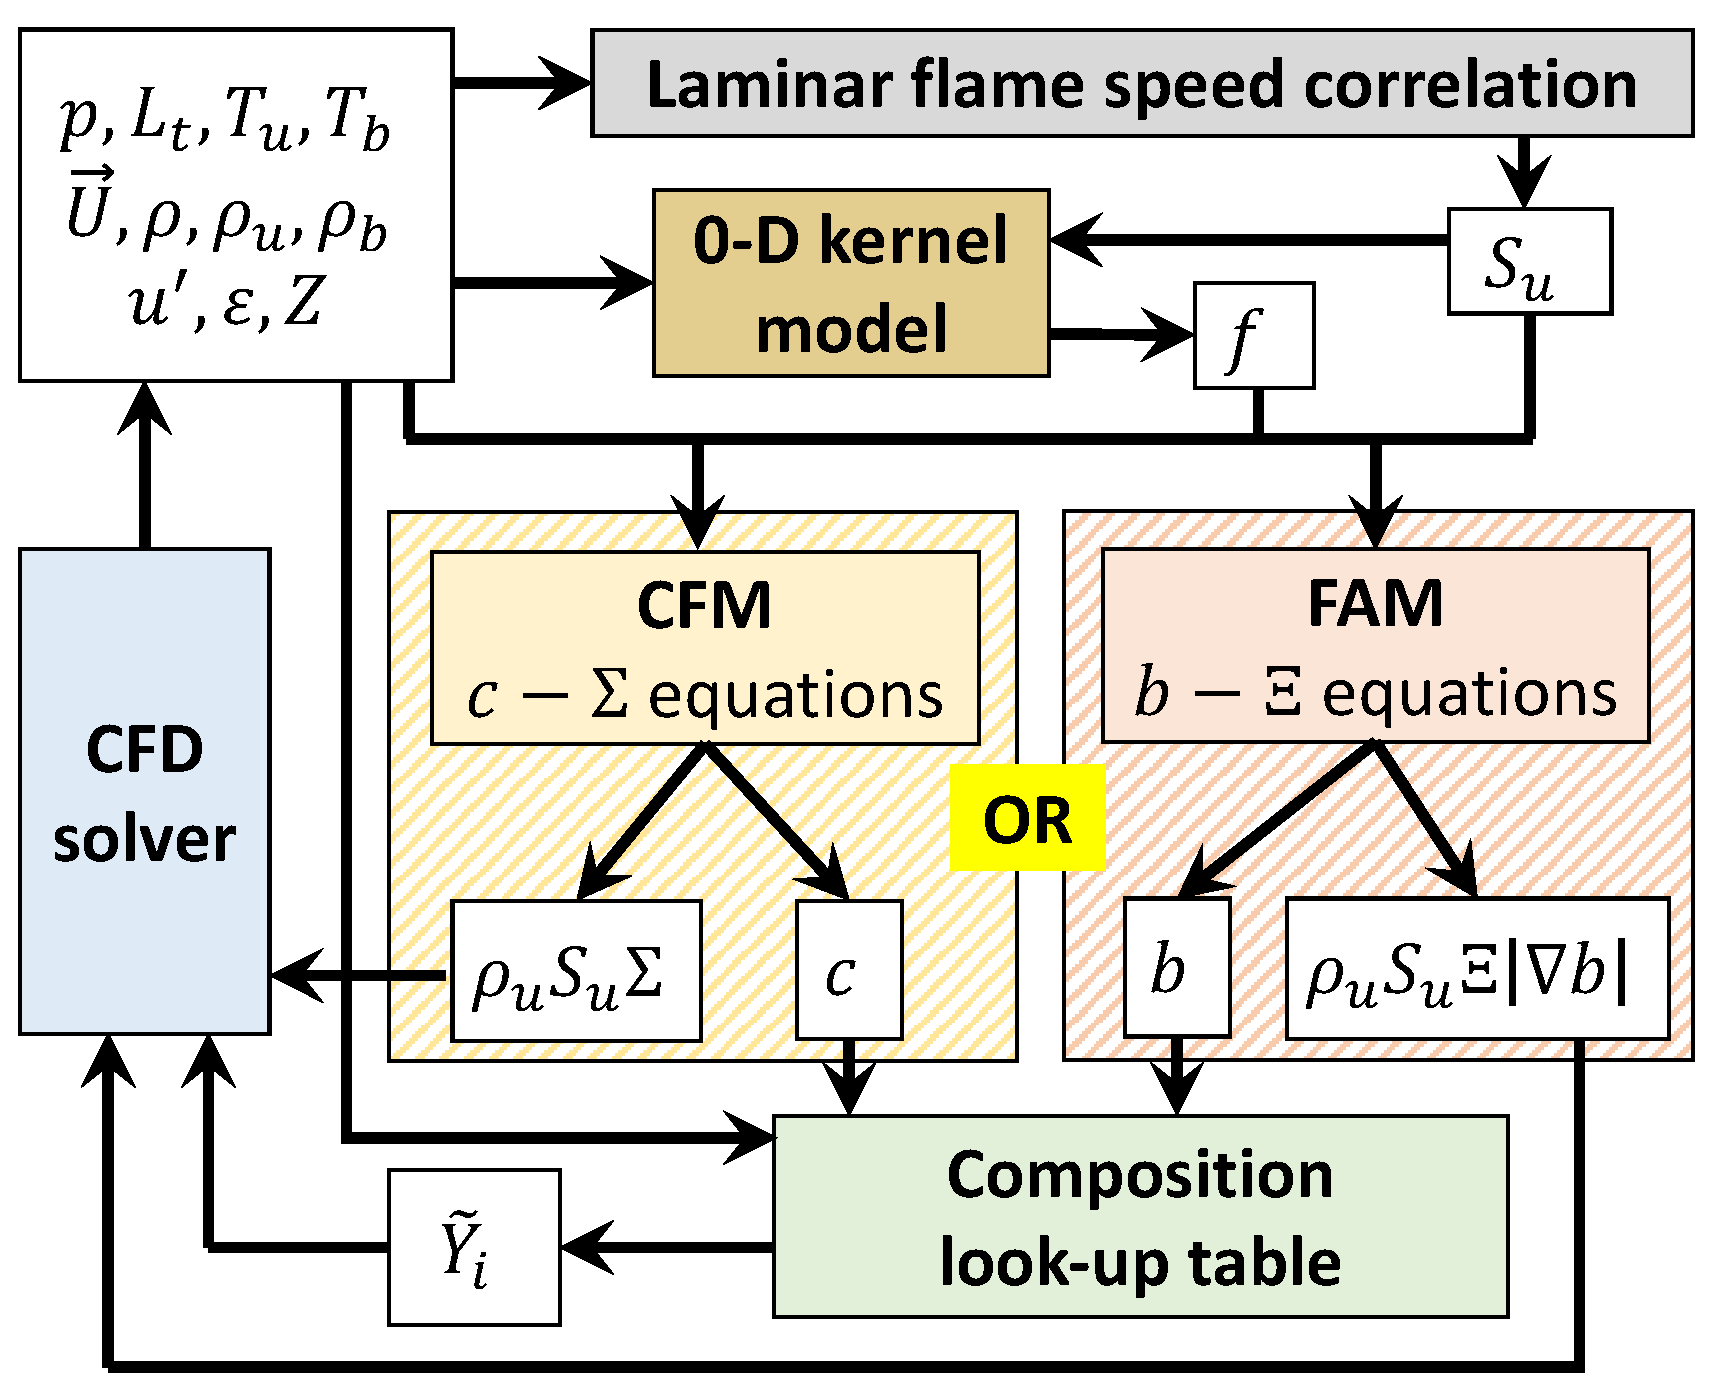
The tabulated kinetics approach proposed in [36] is chosen to compute the chemical composition of the reacting fuel–air mixture. Similar to [29], only the chemical composition of burned and unburned gases is retrieved from the lookup table at equilibrium conditions because the reaction rate from premixed combustion comes from Equation (1). Then, the actual composition of the reacting mixture is achieved by weighting the previous two compositions on the normalized progress variable c. The final structure of the implemented model is represented in Figure 2, where the red dashed box is disabled when the CFM is used.

2.2. The Flame Area Model

The Flame Area Model proposed by Weller [19,23] is based on the resolution of a regress variable b equation [19,23]:
ρ b ˜ t + · ρ U ˜ b ˜ · μ t b ˜ = ρ u S ˜ u Ξ ˜ | b ˜ | + ω ˙ i g n
while the flame–turbulence interaction is modelled by solving a transport equation for the flame wrinkle parameter Ξ [19]:
ρ Ξ ˜ t + ρ U ^ s · Ξ ˜ = ρ G Ξ ρ R Ξ 1
In Equation (7), coefficients G and R are estimated as [19]
G = R Ξ a * 1 Ξ a * and R = 0.28 τ η Ξ a * Ξ a * 1
in which Ξ a * is modelled according to [29]
Ξ a * = 1 + f Ξ e q * 1
to mimic the transition from laminar ( Ξ a * = 1 ) to fully turbulent conditions ( Ξ a * = Ξ e q * ) through the averaging parameter f. More details about f computation can be found in [29]. In this work, Ξ e q * is modelled according to Gulder [38]:
Ξ e q * = 1 + Ξ c o e f u S u R η
where R η is the Kolmogorov Reynolds number. The interpolation of many sets of experimental data suggested that Ξ c o e f should be 0.62 [38], but fine-tuning of this parameter is allowed.
Regarding the prediction of both the laminar flame speed and the mixture chemical composition, the same methodologies described in Section 2.1 were used. The model schematic is shown by Figure 2, where the yellow dashed box is disabled when the FAM is used.

3. Experimental Configuration and Numerical Setup

3.1. The Darmstadt Stratified Burner: Features and Investigated Cases

The experimental rig of the Darmstadt TSF burner is characterised by three staged co-flow concentric tubes [25]. The central tube is the pilot from which hot burned products are released to ignite the surrounding fresh mixture. The pilot wall is made of ceramic material, but it is not perfectly insulated [39]. However, as a first step in this work, it is assumed adiabatic, leaving the study of the heat losses to a future analysis. The other two annular tubes (called slots 1 and 2) supply a fresh and turbulent fuel–air mixture. The burner is placed inside a 600 mm-wide air co-flow to shield the flame from the surrounding environment. Further details about the applied experimental measurement techniques can be found in [25].
Between the available flame configurations [25], the CH 4 -air flame of type A is selected. In particular, the isothermal flow case A-i2 and the reactive case A-r are investigated in this work; their main features are summarised in Table 1. The isothermal non-reacting case A-i2 is used to evaluate the capability of the chosen numerical methodology in predicting the flow field features where the combustion will occur, assessing the mesh quality performance. Then, the reacting case A-r is selected to clarify the applicability limits of the selected flamelet-based approaches (CFM and FAM) on HULP mixtures. In fact, the interaction between the high-speed lean mixture from slot 2 (10 m/s, ϕ = 0.6) and the external slow air co-flow (0.1 m/s) generates a region where the combined effects of shear and mixture stratification can be used to clarify the limit of flamelet-based approaches towards turbulent HULP mixtures.

3.2. Numerical Setup

The flamelet-based approaches investigated in this study are implemented by the authors in the LibICE code and embedded into the same numerical structure used for SI engine simulations. LibICE is a set of solvers and libraries based on the OpenFOAM® technology, which is an open-source platform involving a 3-D finite volume discretization. The conservation equations of mass, momentum, chemical species and energy are solved with the RANS approach using the standard k- ϵ model for turbulence.
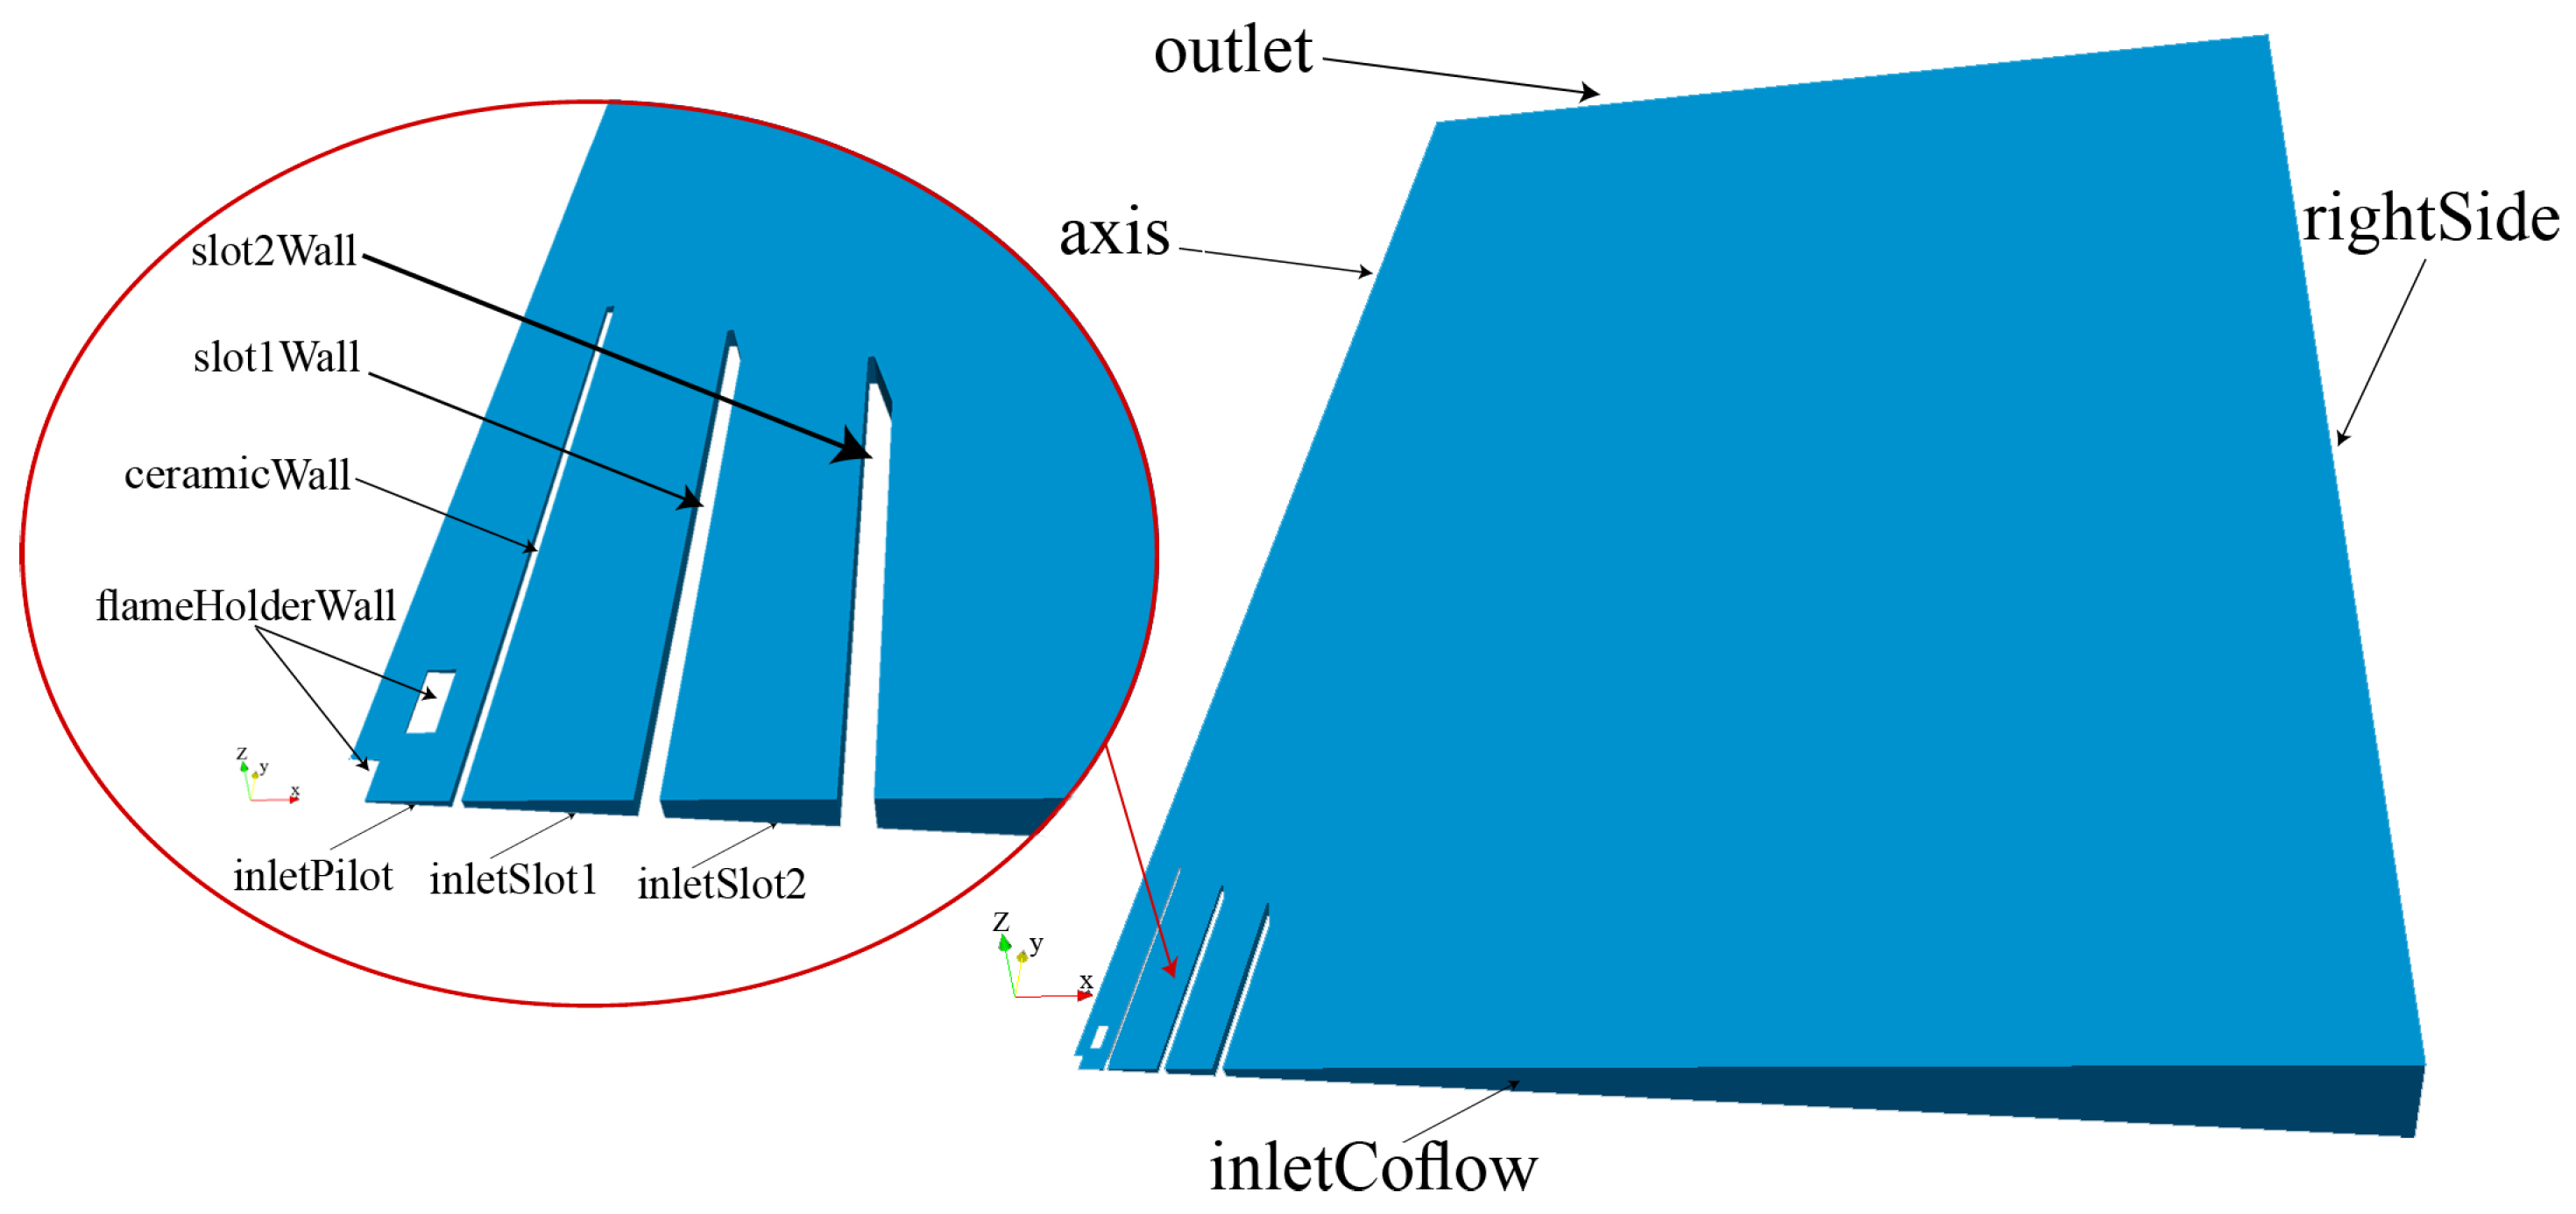
Concerning the adopted computational domain, a 3-D axisymmetric analysis of the Darmstadt TSF burner is considered. This choice is motivated by the symmetrical features of the burner geometry, which is characterized by three concentric tubes. Therefore, a 3-D wedge domain of 5 degrees is considered, as depicted in Figure 3. The flow effects on the third dimension (z-axis, namely the tangential direction) are therefore considered, thanks to a suitable boundary condition applied on the wedge sides.
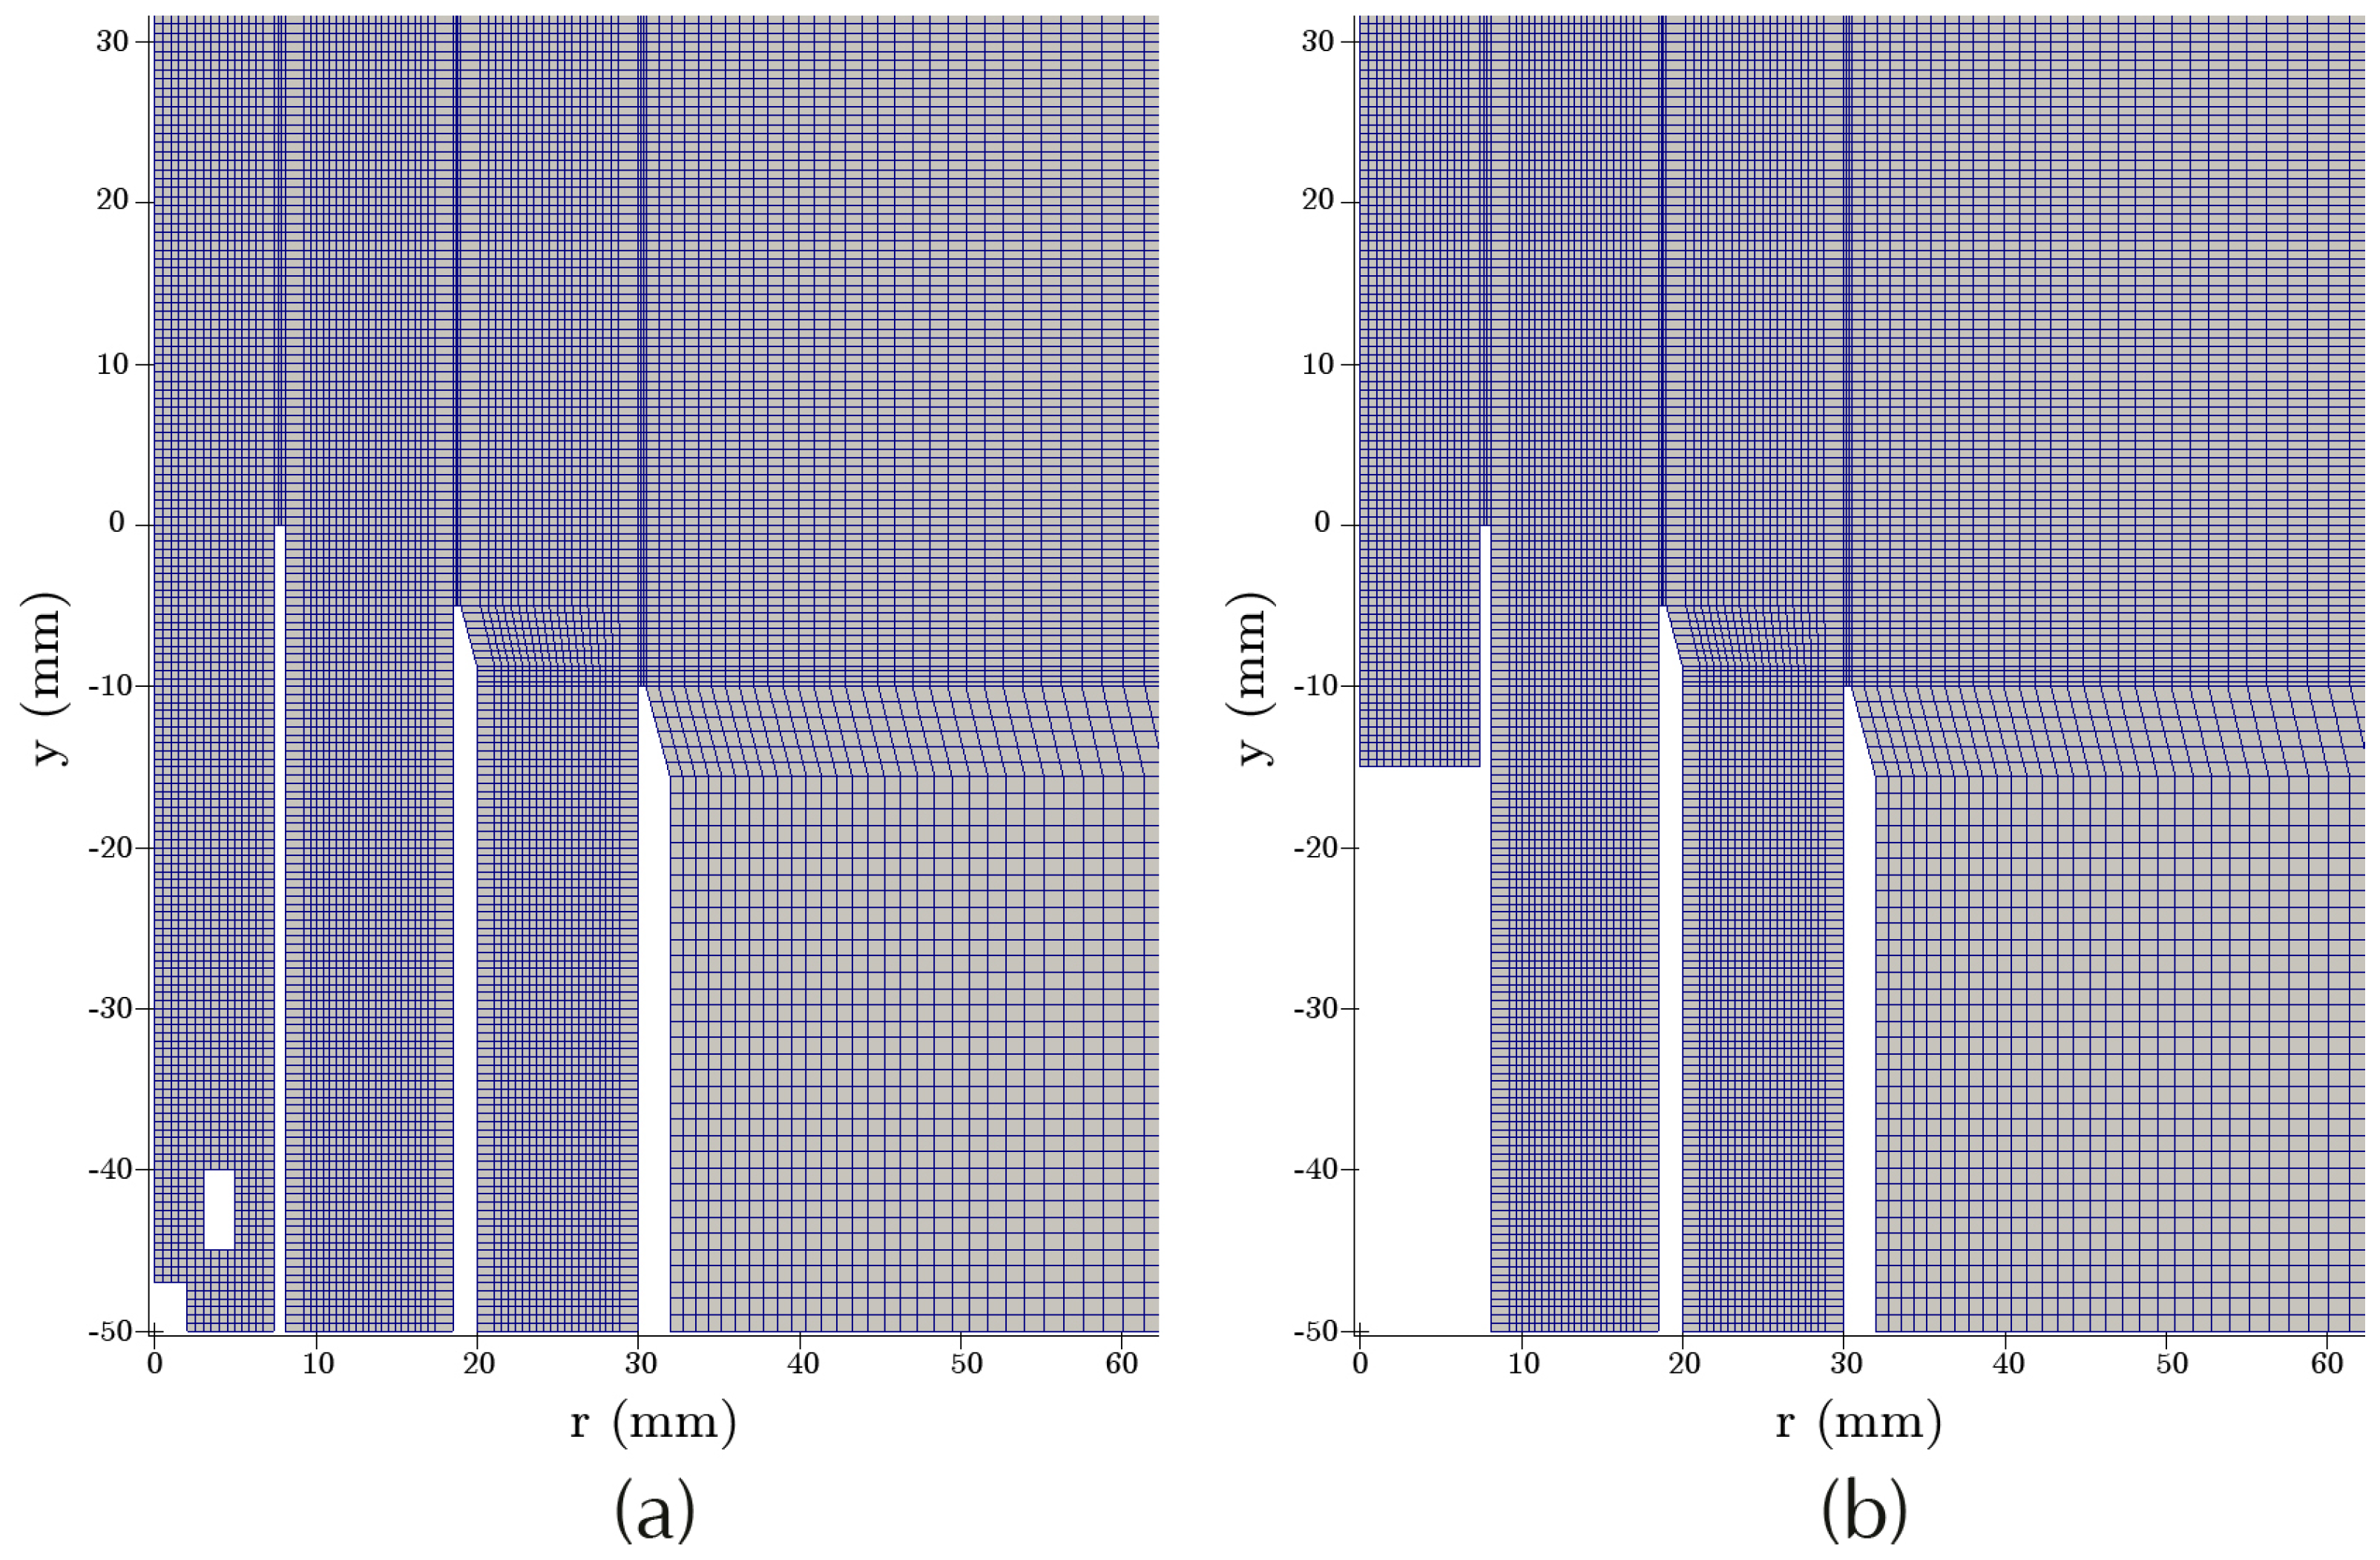
The jet injection direction (pipes axis) is defined as y coordinate, whereas the radial direction is defined as r (or x).Because experimental measurements were performed until 200 mm downstream from the pilot exit section [25], whose axial position is defined as y = 0 mm (see Figure 4), the computational domain was extended until y = 300 mm to avoid possible numerical effects of the outlet boundary on the region of interest. In the radial direction, the domain was extended up to 250 mm (Figure 3, the right side), while to simulate the effect of the flame holder, a mesh was generated up to 50 mm upstream from the pilot exit section.
Figure 4 shows the structured grid of cubic hexahedra employed for the numerical investigation. An average cell dimension of 0.5 mm is used inside the burner and where the flame is stabilized, while the mesh is gradually coarsened until 1 mm close to the side boundary. At pipes walls, the cell side is calibrated to achieve y+ values greater than 30, allowing a correct application of wall functions for the k- ϵ turbulence model. To optimize the total mesh dimension in terms of cells number, a sensitivity analysis is carried out on both non-reacting A-i2 and reacting A-r cases. In light of this investigation, available in Appendix A, a mesh of 80k cells is selected for all numerical simulations.
Similar to [40], the flame holder geometry is not included in reacting case A-r simulations; hence, for the sake of simplicity, only 15 mm of the domain upstream from the pilot exit section are considered, as shown in Figure 4b.
Concerning boundaries, no-slip adiabatic conditions are used at walls, whereas slip conditions are employed for the lateral confinement of the air co-flow. A fully-turbulent flow velocity profile is imposed at slot 1 and 2 inlet because the considered computational domain is shorter than the actual pipe length. A uniform velocity profile of 0.1 m/s is applied, instead, at the inlet of the coflow. For the reacting case A-r only, a fully burned mixture (c = 1) and a uniform bulk flow velocity of about 10 m/s are imposed at the pilot inlet because no experimental measurements are available inside the pilot pipe.
The values of the constants belonging to the investigated flamelet-based models are specified in Table 2, where all parameters are chosen after a suitable fine calibration. Concerning the prediction of chemical composition, the lookup table used for this purpose is generated by using the GRI-Mech 3.0 kinetic model [37].

4. Results and Discussions

4.1. Non-Reacting Case A-i2

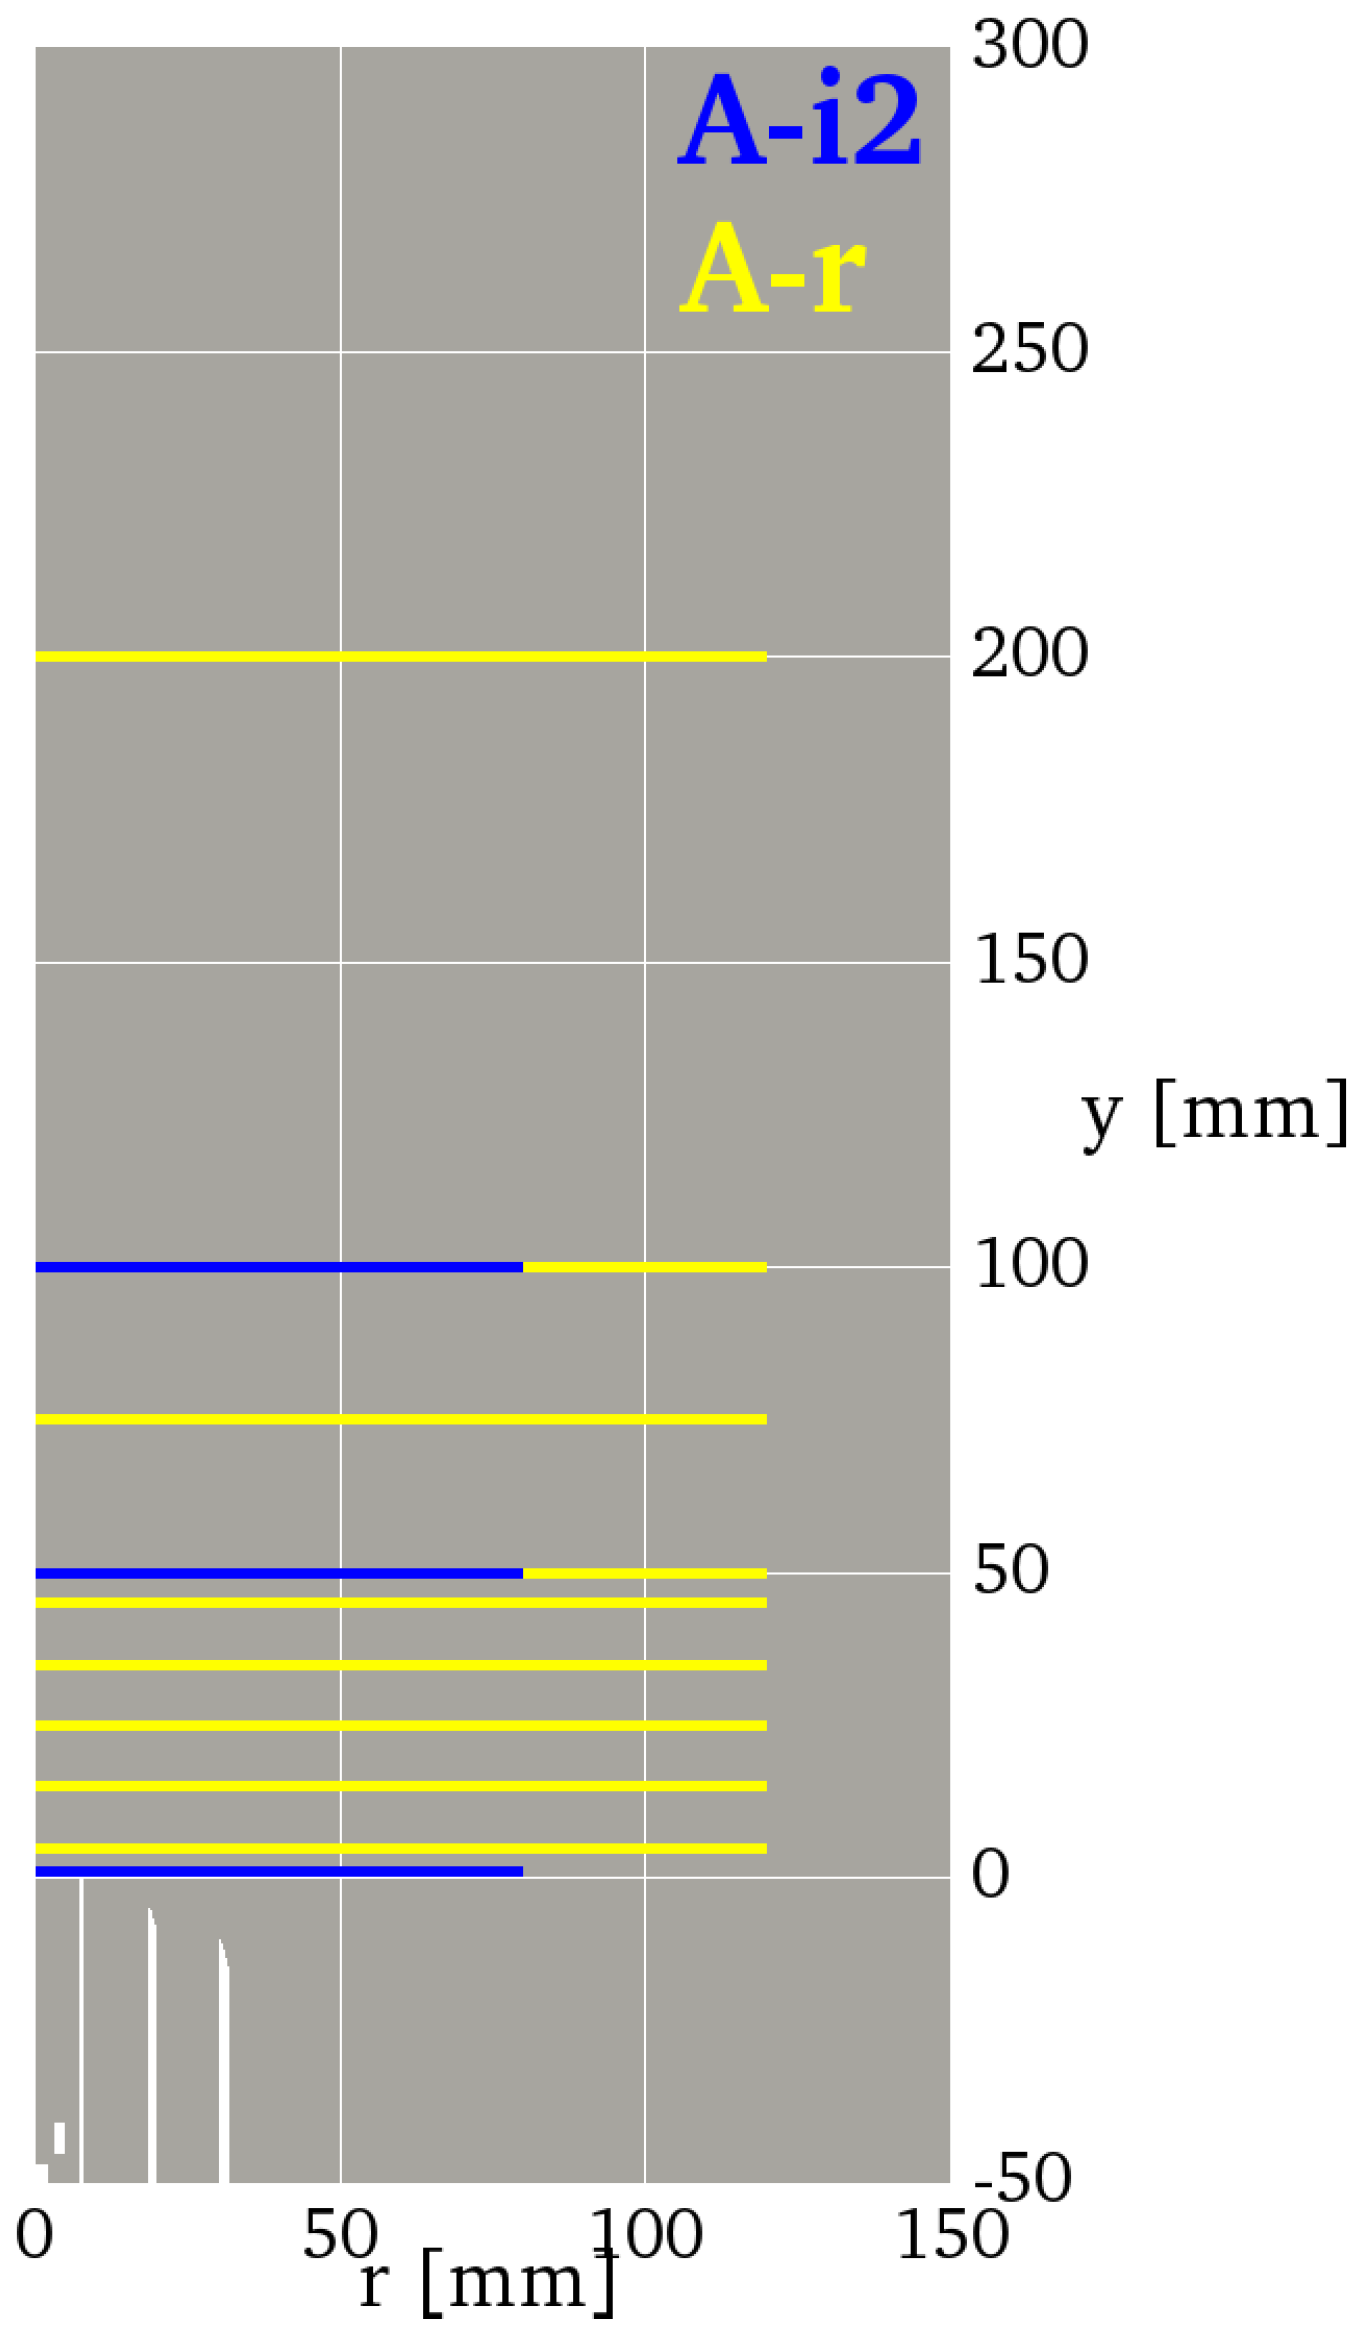
The non-reacting case A-i2 is basically used to assess the numerical setup and the mesh quality before advancing to the reactive cases. No combustion modelling is required because of the nature of the case (pure air flows out from all pipes, see Table 1). The numerical–experimental comparison is carried out only at three different axial distances from the pilot exit section because measurements on condition A-i2 are available only at y = 1, 50 and 100 mm, as shown by Figure 5.
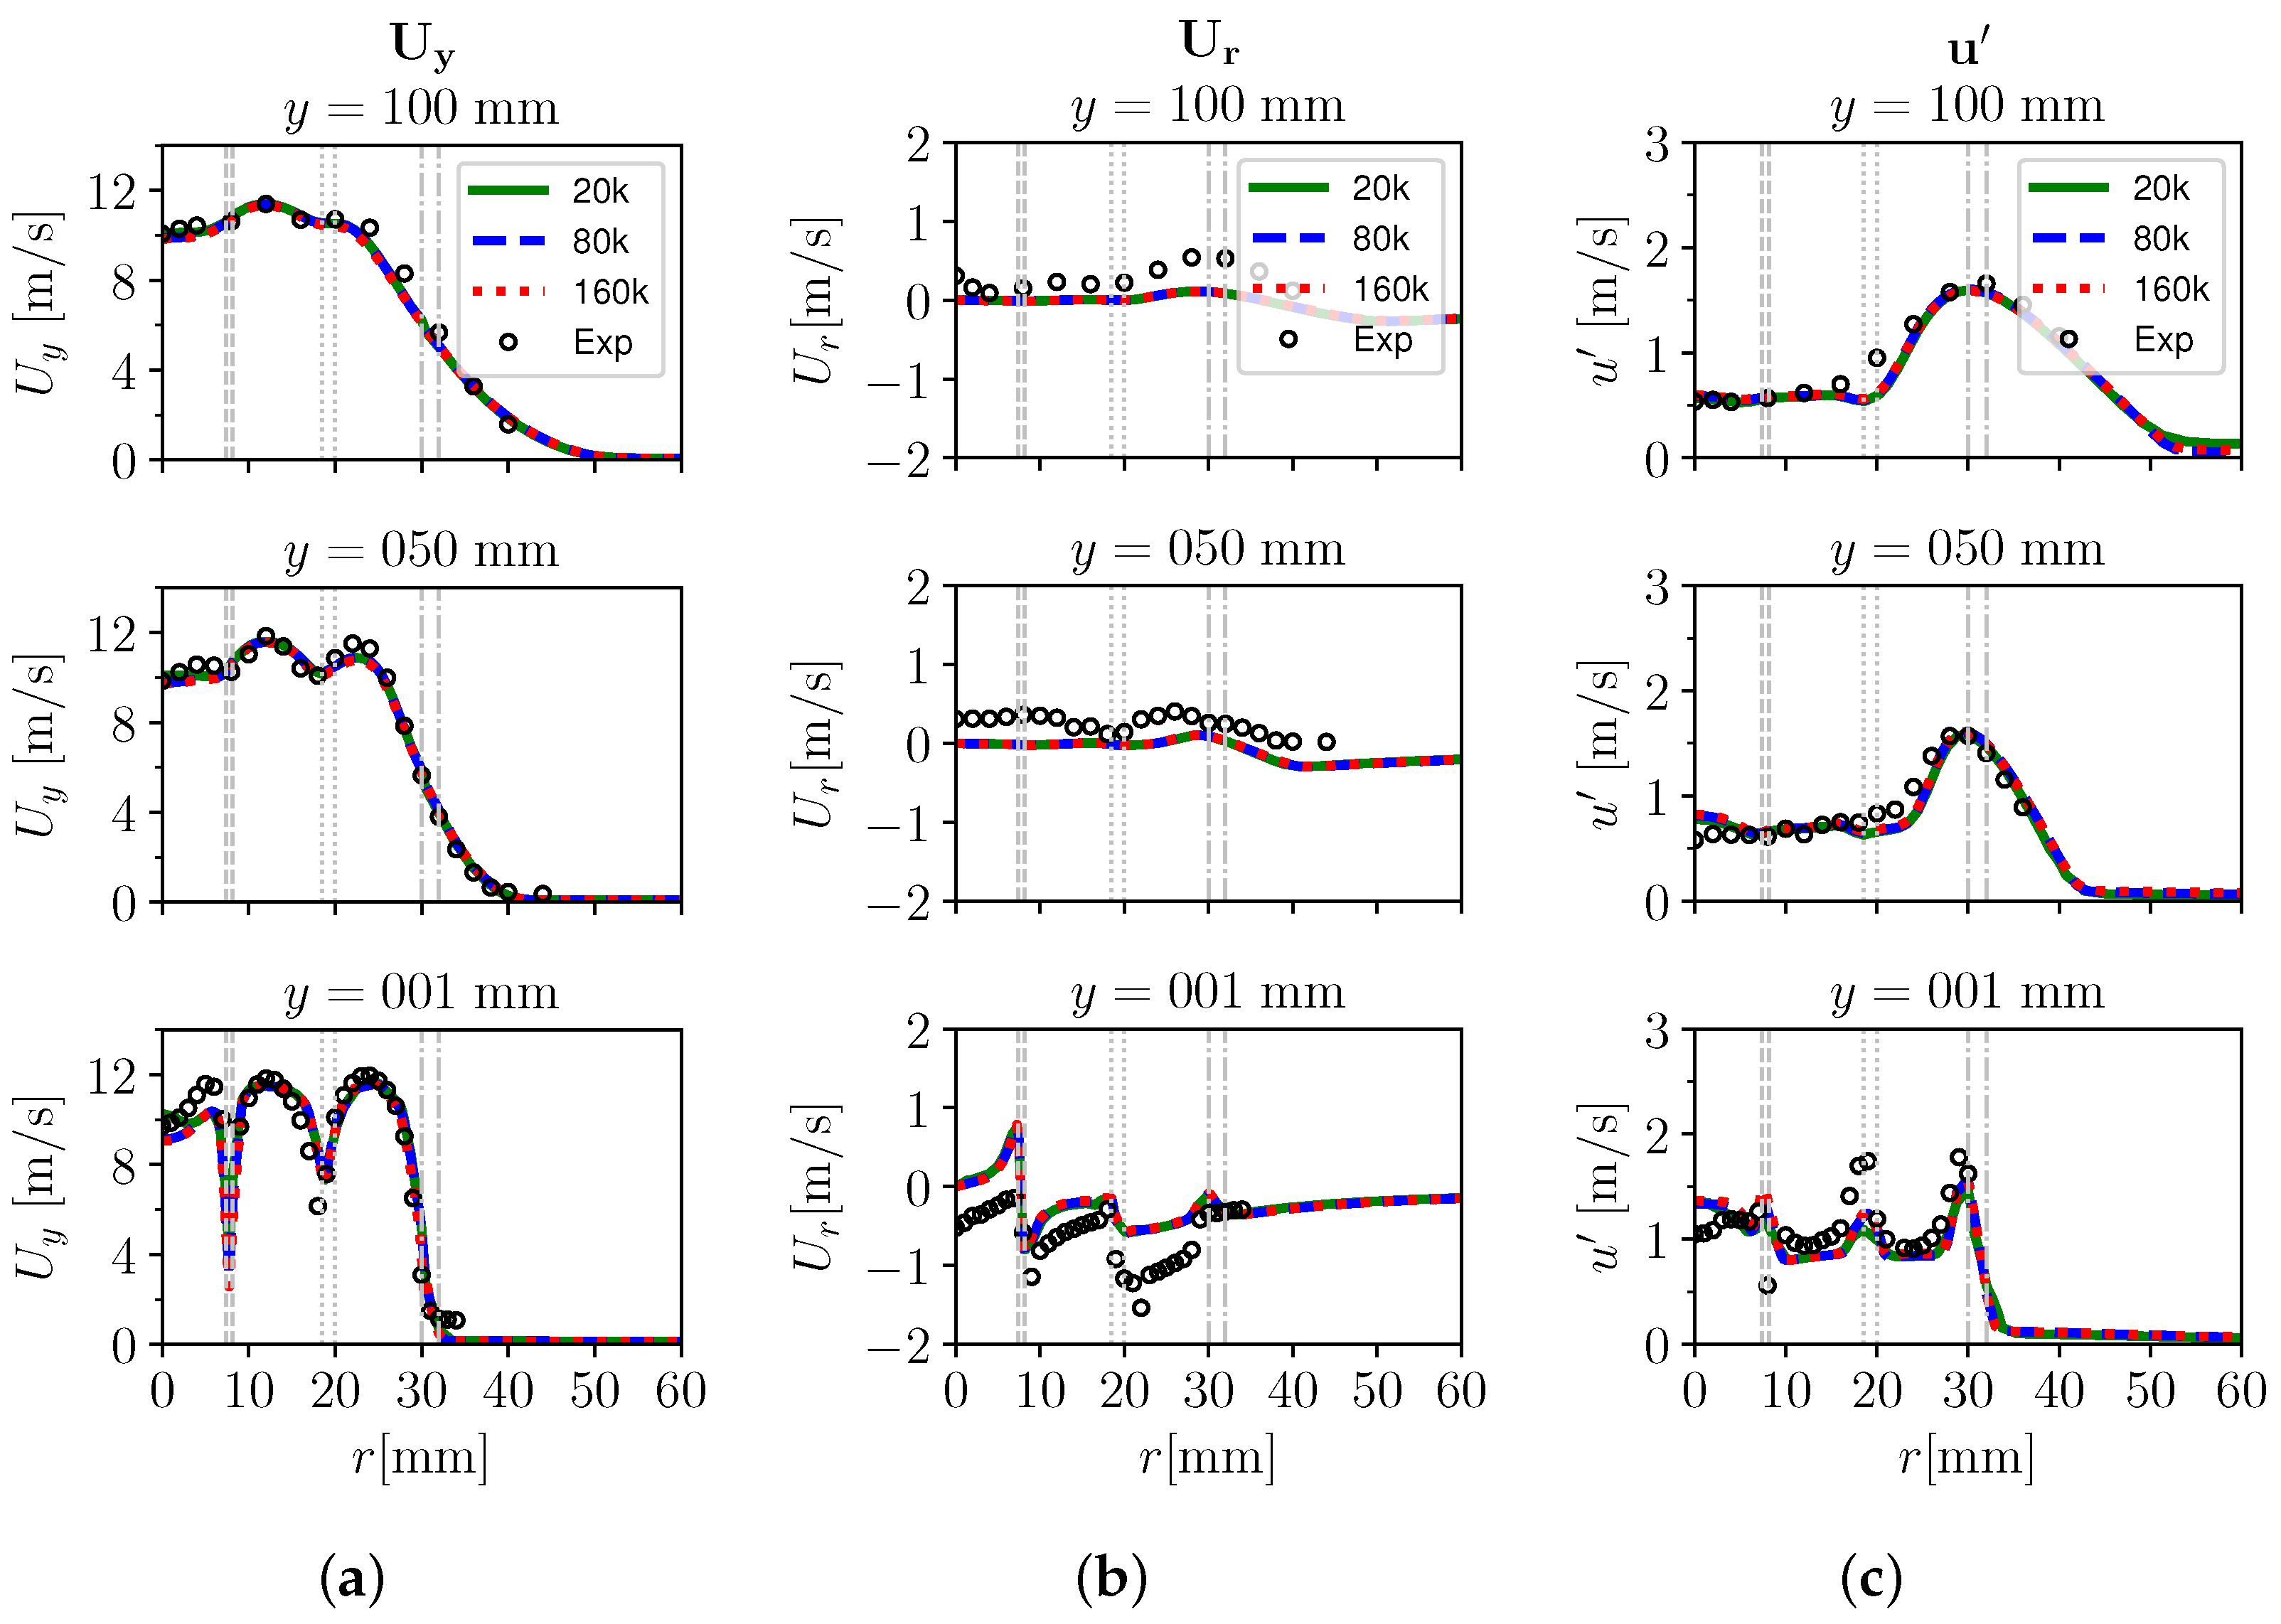
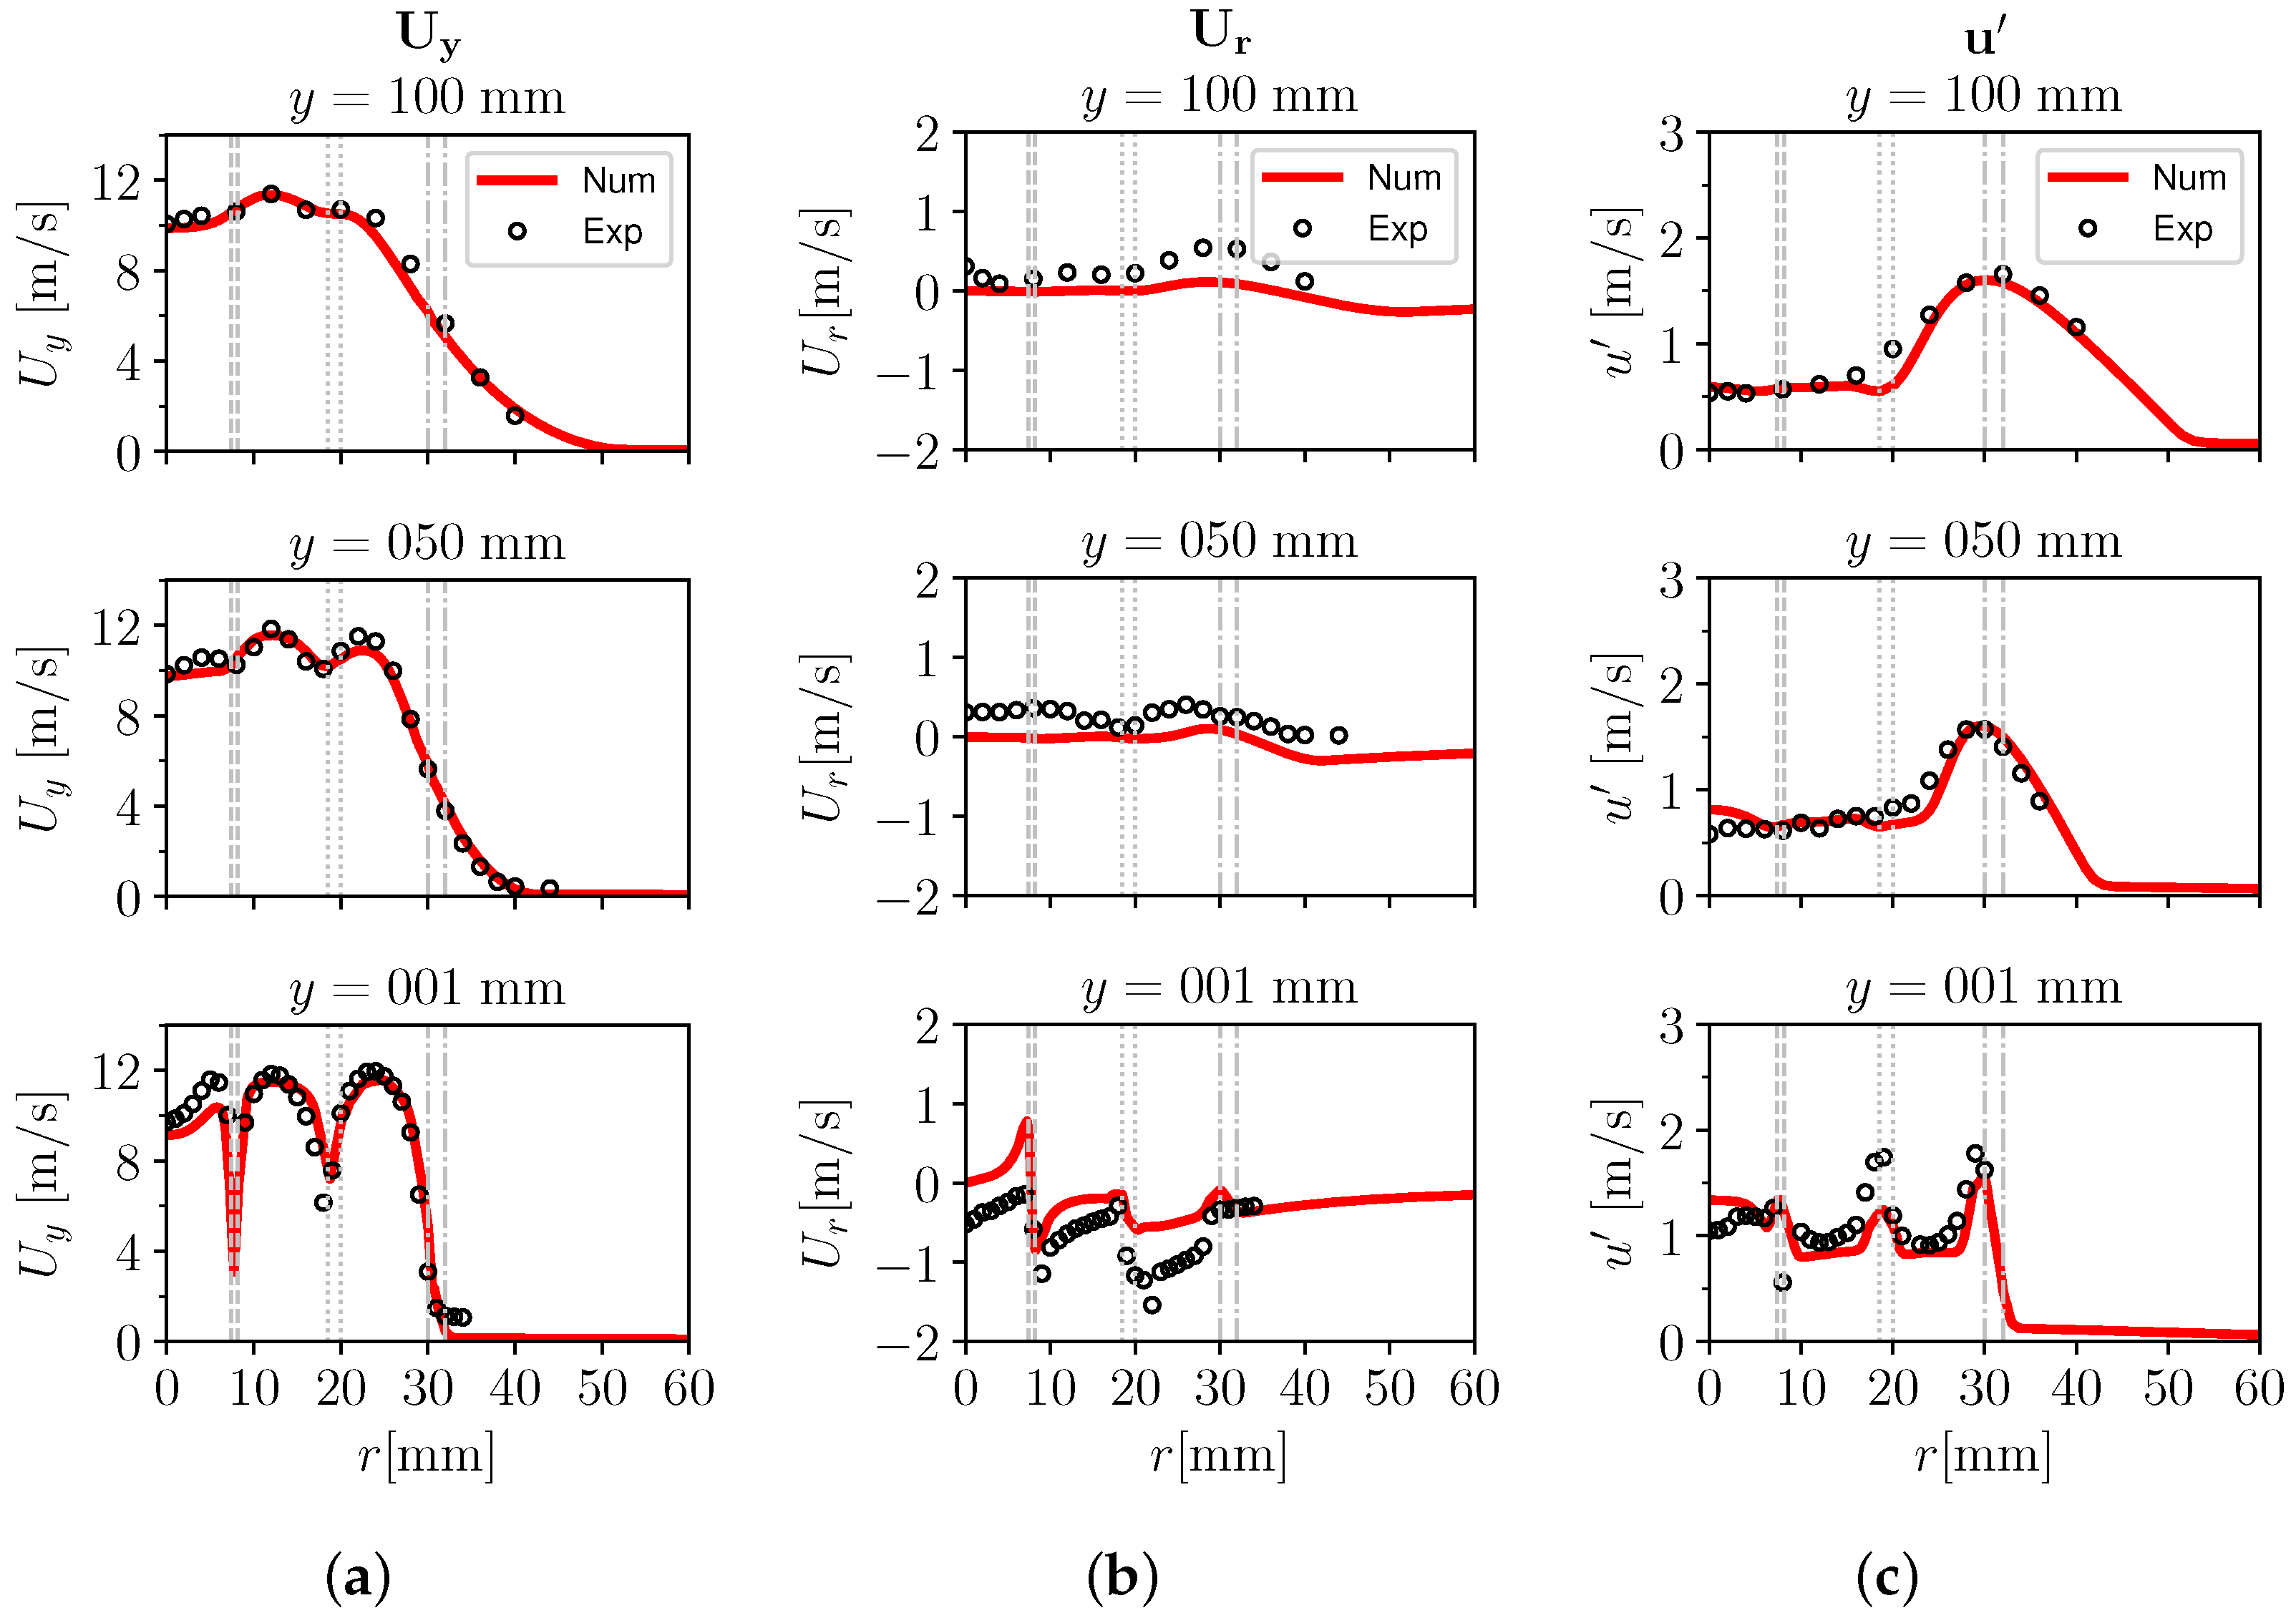
In Figure 6, the computed axial U y and radial U r velocity distributions, as well as the predicted turbulence intensity u trend, are compared with the experimental measurements. At the lowest axial position (y = 1 mm), namely close to the burner exit, the trend shows three hump-shaped axial velocity profiles because of the wake regions generated above the concentric pipe walls by the three high-velocity outflow jets. Further downstream, the velocity humps smear out due to the flow mixing. The numerical results of axial velocity show a satisfactory agreement with experimental measurements despite a slight under-prediction at y = 1 mm in the wake of the flame holder. In addition, the agreement between computed and measured radial velocity distributions is rather satisfactory, in particular at y = 50 mm and y = 100 mm.
Concerning turbulence intensity, as expected three peaks are found at y = 1 mm due to the presence of mixing shear layers in the wake regions above the concentric pipes walls. Further downstream from the burner, the flow seems mixed; hence only one peak appears due to the velocity gradient between the high-velocity jet flows and the slower co-flow. As can be also observed, the k- ϵ turbulence model performs well, especially far from the burner exit (y = 50 mm and y = 100 mm) where the flow velocity gradients are smoother (compare to left and central columns of Figure 6), producing anyway a reasonable prediction of the complex flow field at y = 1 mm. The good agreement between the numerical results and experimental measurements on the non-reacting case A-i2 indicates that the numerical setup in terms of mesh quality, way of imposing the boundary conditions and turbulence model are suitable to numerically study the TSF burner and advance to the combustion case.

4.2. Reacting Case A-r

4.2.1. Flame Regimes

With the purpose to verify the applicability limits of the flamelet concept, an assessment on the combustion regimes experienced by the TSF burner flame at various positions after the pilot exit section was performed on the investigated condition A-r. However, as confirmed by an a priori analysis based on Figure 6, it is expected that at high axial positions y, the flame will interact with a broad shear layer generated by the surrounding slow co-flow of air, hence with a region characterized also by a strong mixture stratification.Therefore, to provide a deeper understanding of this phenomenon, at each investigated axial distance from pilot the flame regime was evaluated at several positions inside the flame brush, especially at low c values where there is an high probability of detecting fresh, as well as lean, mixture conditions.
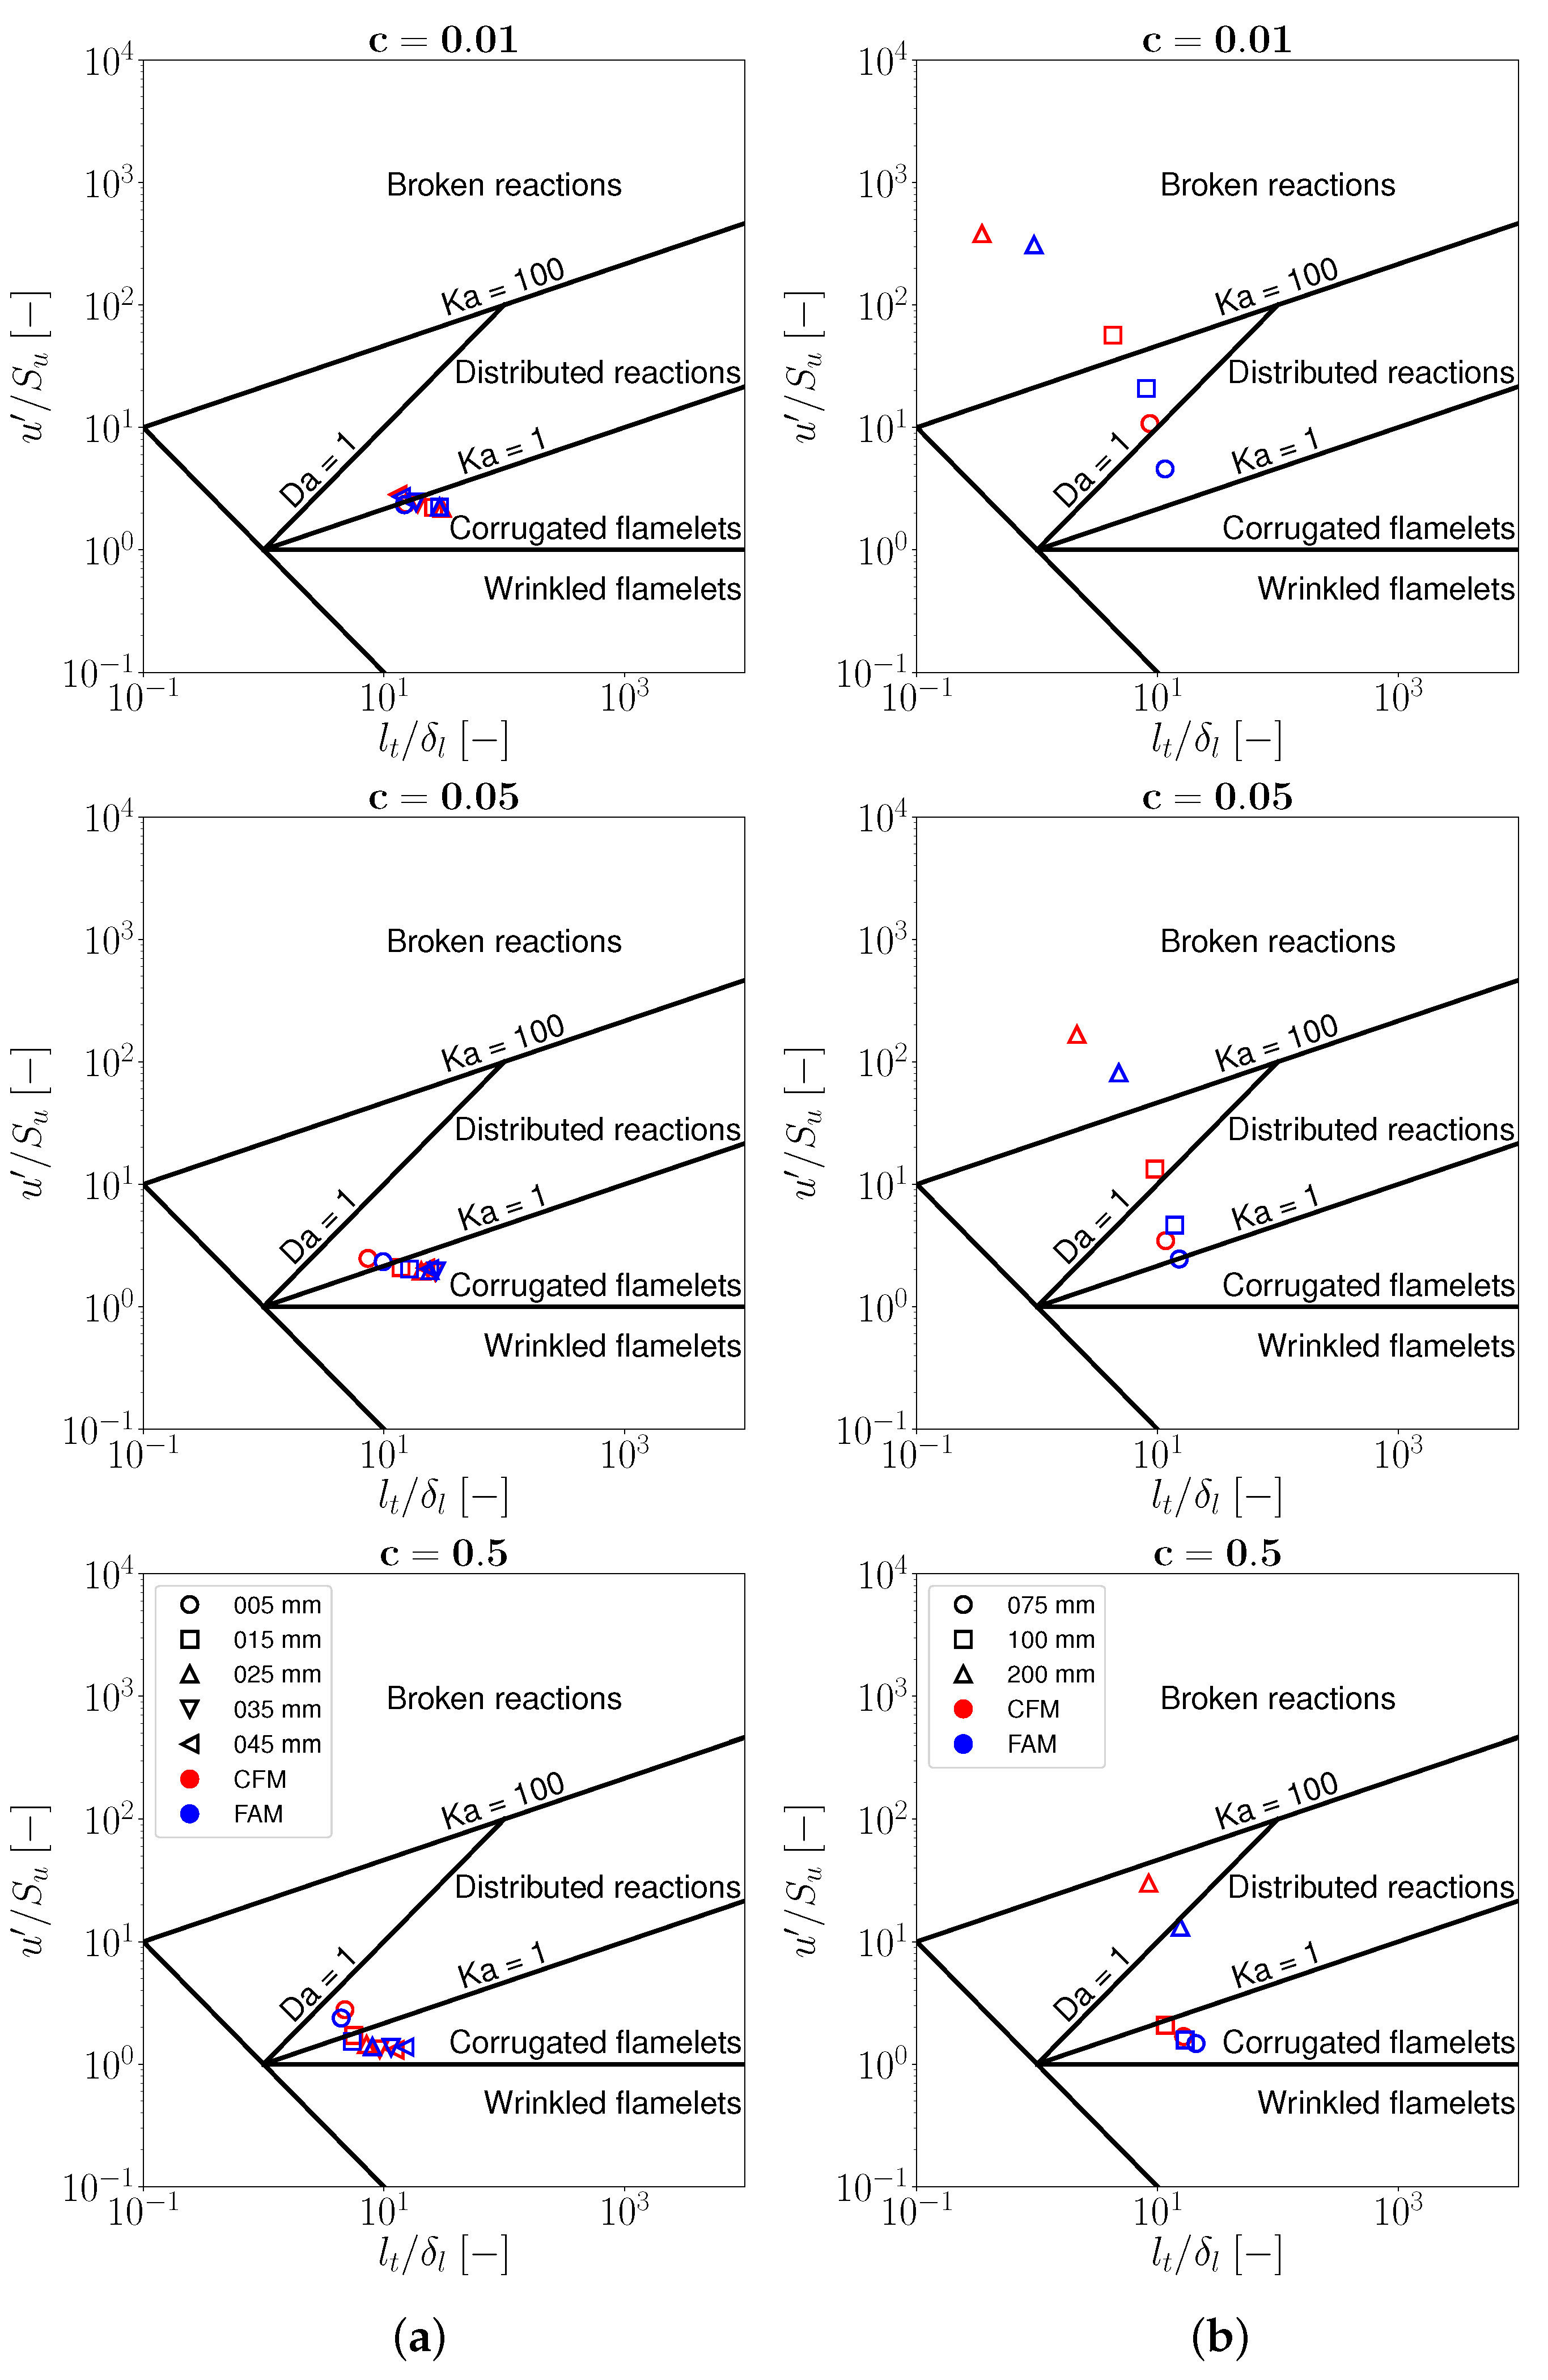
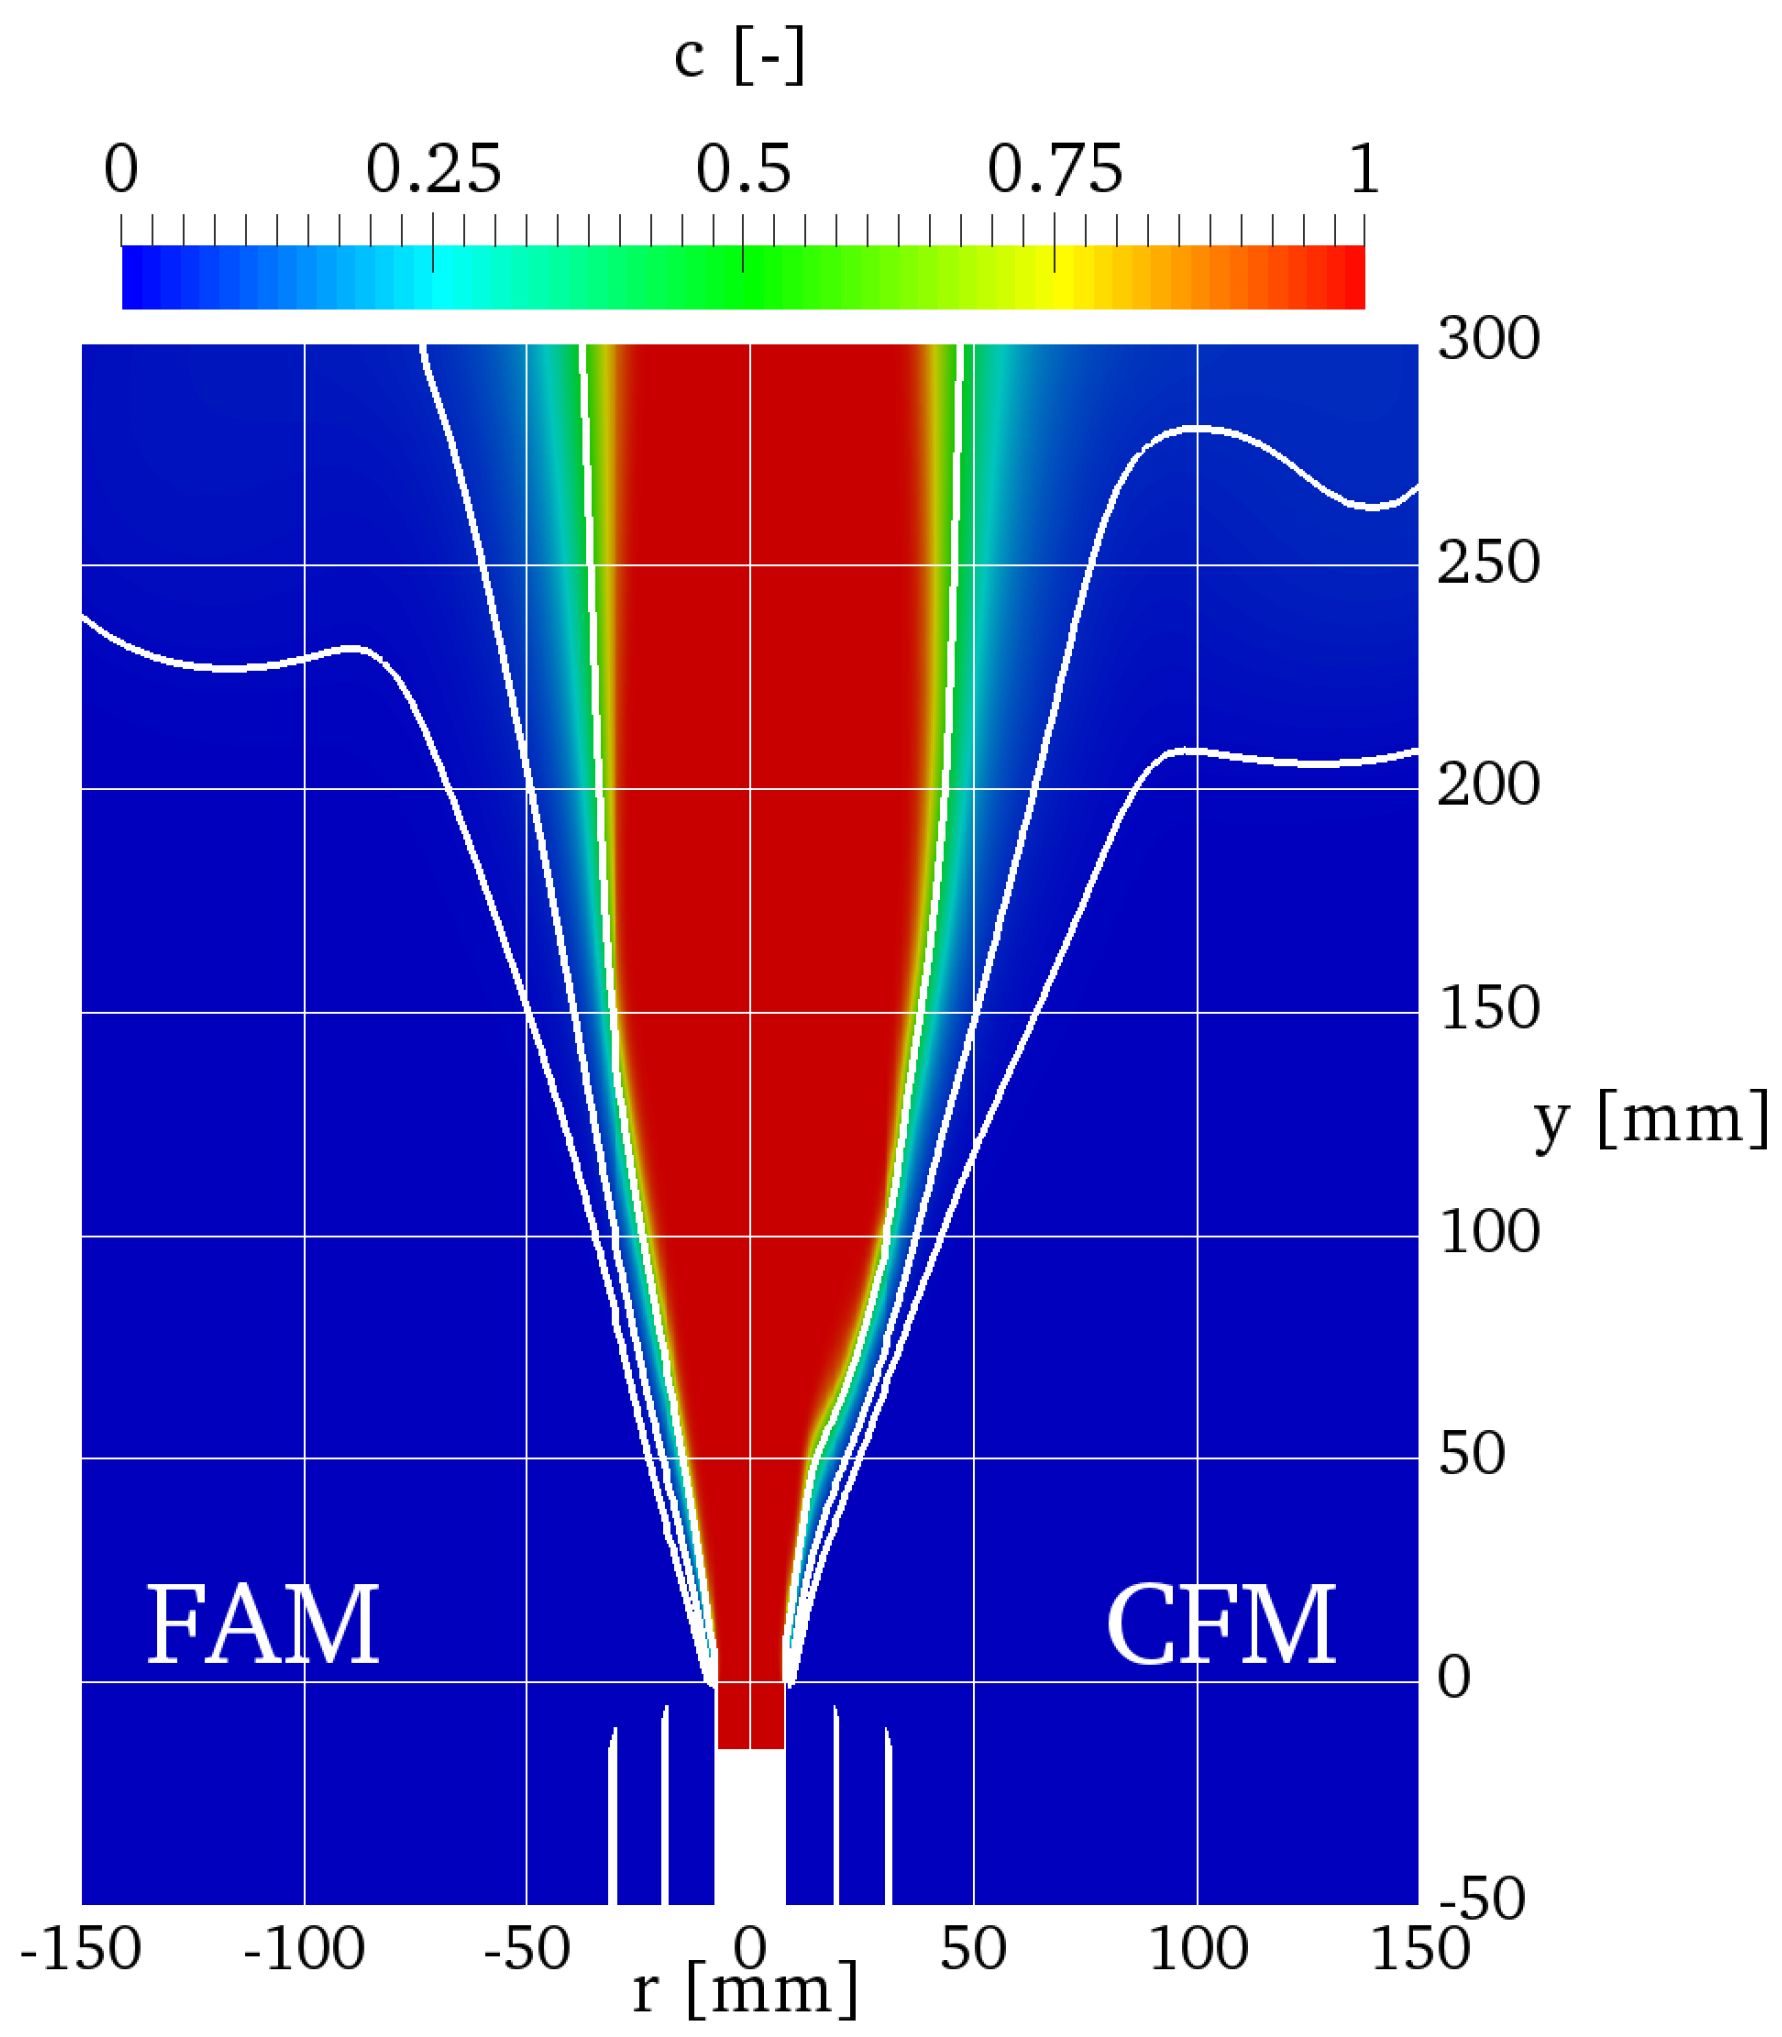
Figure 7 shows a comparison on the the Borghi–Peters diagram [20,41] between the combustion regimes achieved with CFM and FAM combustion models, represented in red and blue colours, respectively, at all axial locations where measurements of reacting scalars are available. Three different c values were selected for the investigation. The first is c = 0.5 (Figure 7 bottom row), where the probability to find fresh or burnt mixture is the same. The other two are c = 0.05 and 0.01 (Figure 7 central and top row) because the regions are very close to the “cold-tail” of the flame brush. Axial positions up to y = 45 mm are shown in Figure 7a column, while the furthest locations are represented in Figure 7b column. A graphical representation of the investigated flame brushes and the related c iso-values is provided by Figure 8.
As can be observed in Figure 7a column, at all axial positions closer to the pilot exit section a corrugated flamelet can be detected through the whole flame brush, with a slight shift towards the distributed reaction region as the c value decreases. A small exception is represented by the y = 5 mm position, where the trend seems opposite; however, its flame regimes at all c values are very close to a unitary Karlovitz number. Therefore, up to y = 45 mm, the flamelet assumption can be considered valid over the whole flame brush for both adopted combustion models.
Different conclusions can be drawn for the furthest axial locations investigated by Figure 7b column. As can be seen, at each y position the flame regime tends to move from the corrugated flamelet towards the broken reaction condition as the “cold-tail” of the flame brush is approached (from bottom to top row). This behaviour is observed with both combustion models, with the CFM always more shifted towards the broken reaction condition. A sensitivity with respect to y value can be also noticed. In particular, the y = 200 mm position represents the worst case in terms of flamelet assumption validity. Here, both CFM and FAM models predict a broken reaction combustion regime over at least half of the flame brush (0.01 c 0.5). Therefore, from y = 75 mm onward, the flamelet assumption cannot be considered valid over the whole flame brush for both adopted combustion models. This limit affects higher and higher values of c as much as the axial distance from the pilot increases.

4.2.2. Numerical–Experimental Comparison

A comparison between the available experimental measurements and the numerical results achieved with both CFM and FAM models was carried out to clarify the impact of what we observed in Section 4.2.1 about flame regimes.
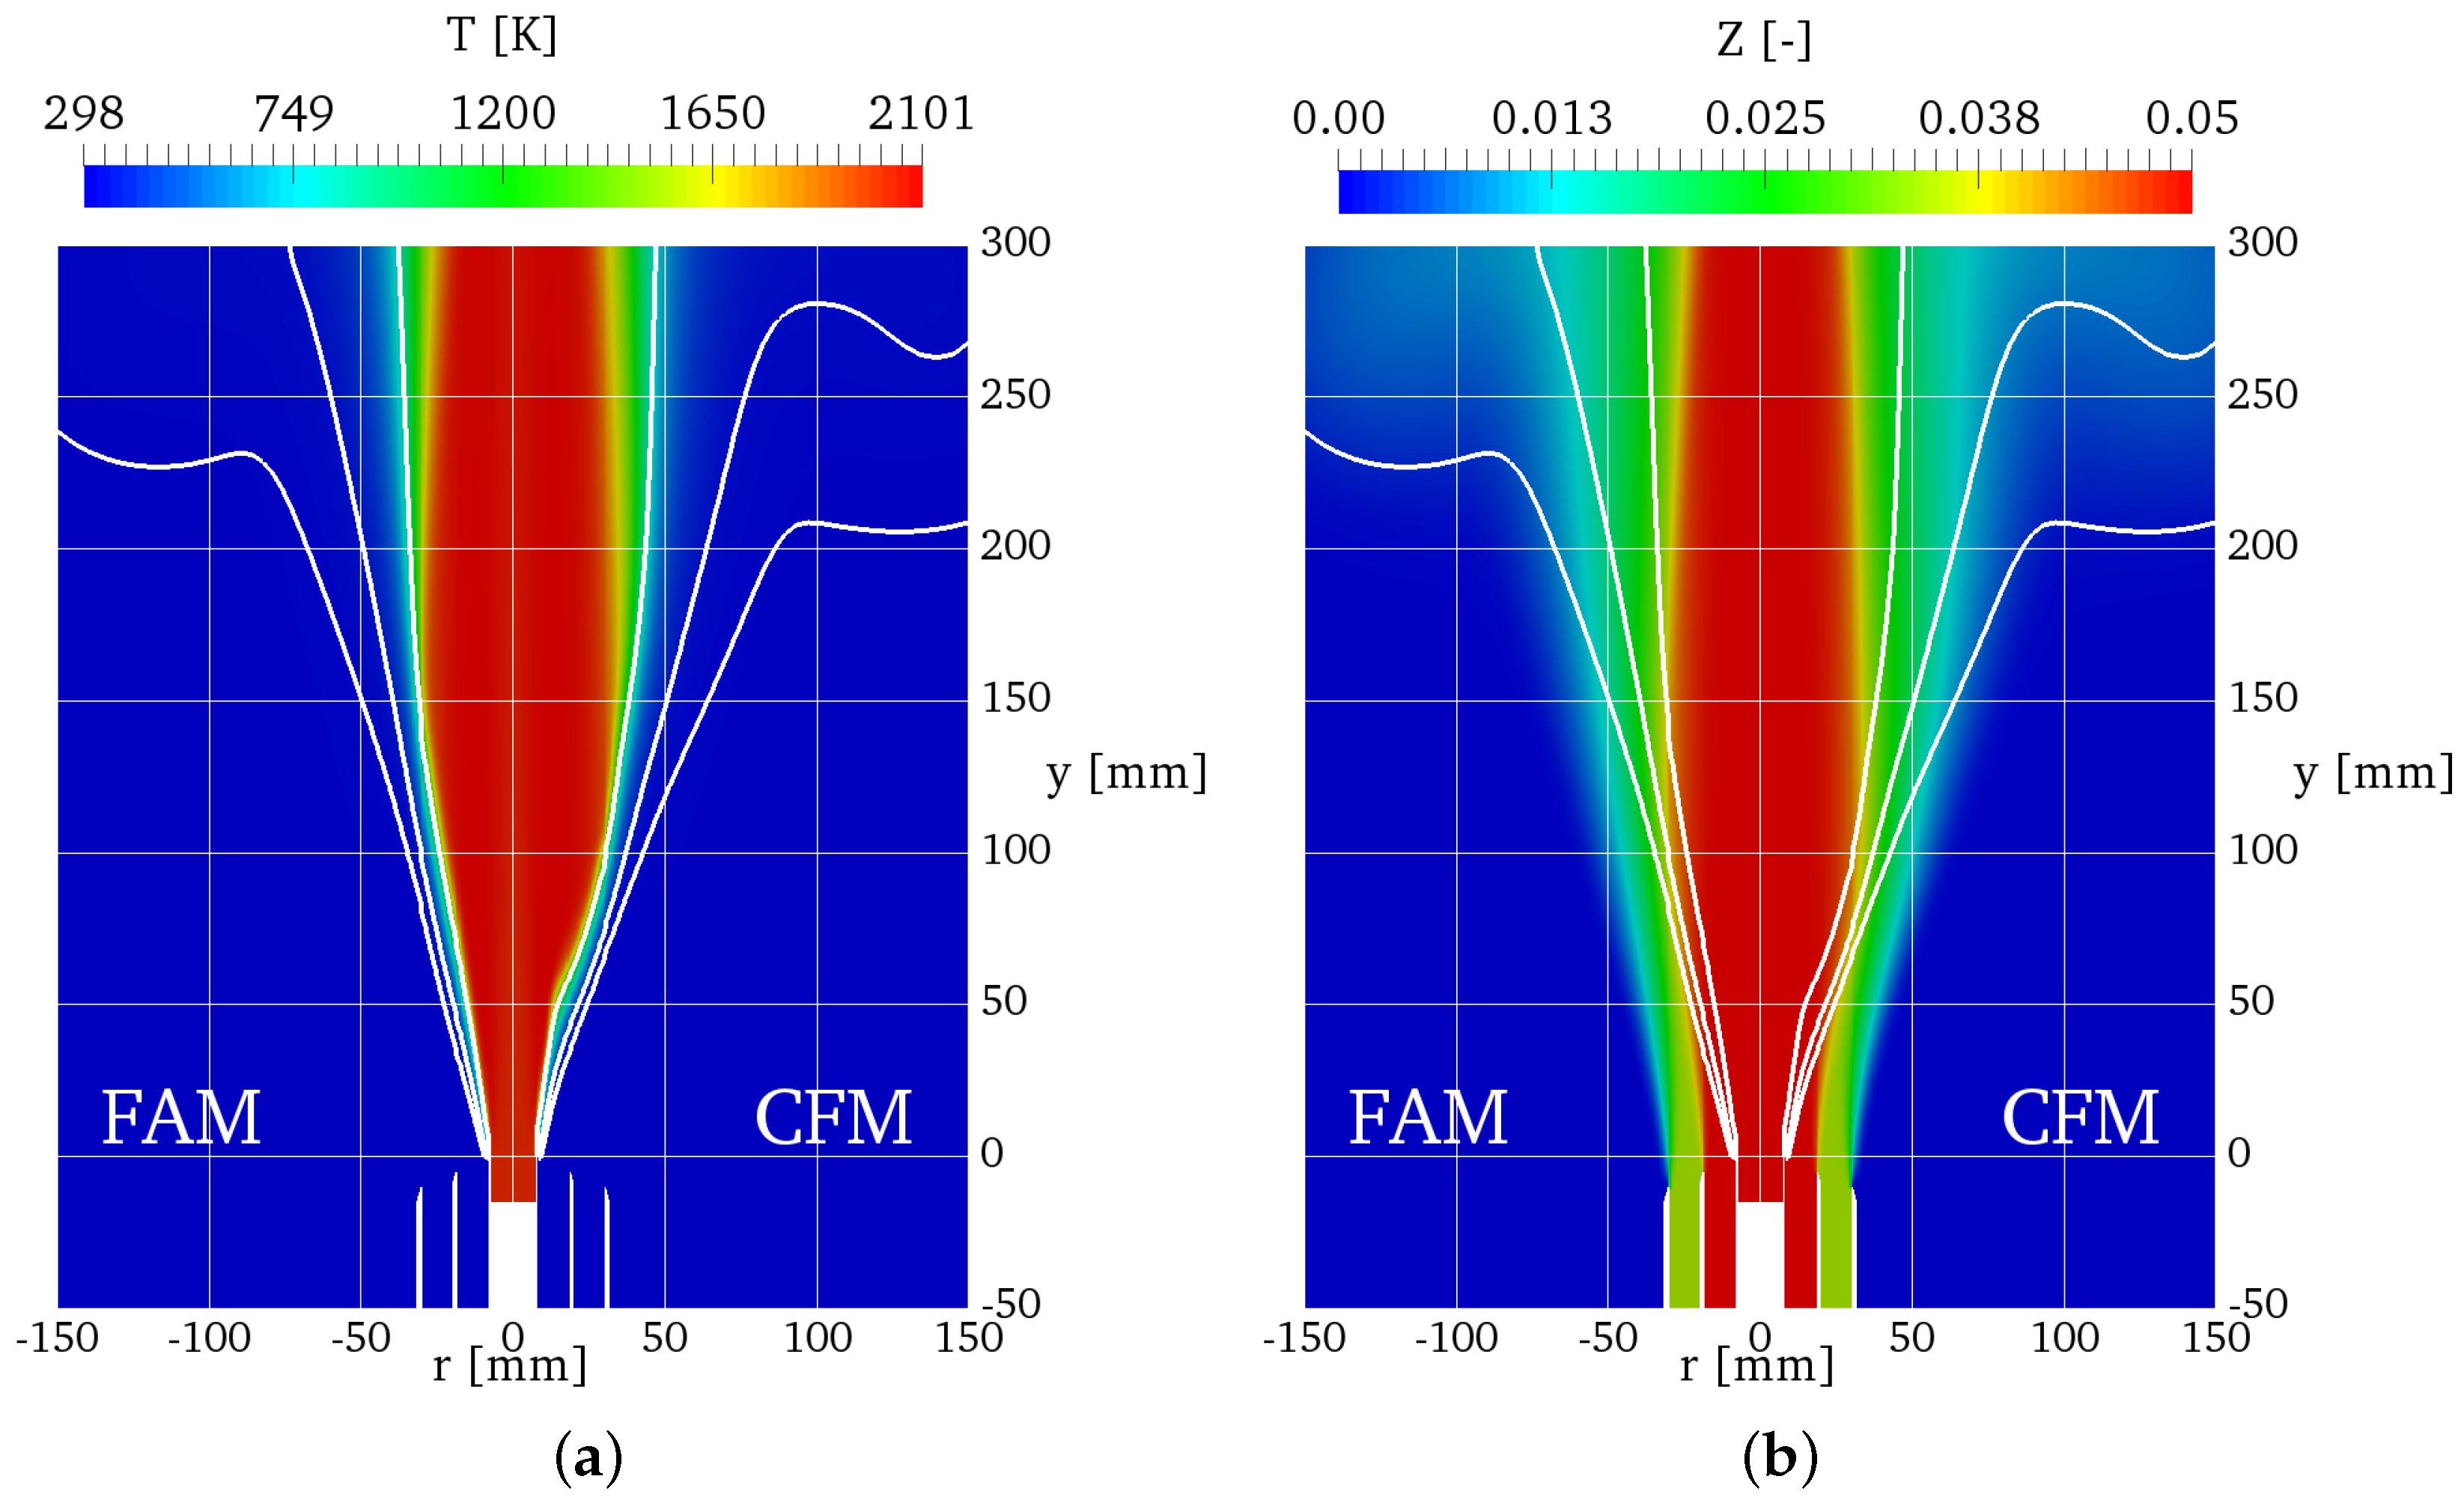
Figure 9 compares numerical and experimental radial trends of mean temperature T ((a) column) and mixture fraction Z ((b) column) for axial positions up to y = 45 mm. Here, the validity of the flamelet assumption for numerical results was verified (Figure 7a column), and a graphical representation of computed T and Z fields, including the c iso-values used for the flame regime investigation, is provided by Figure 10. As can be observed from Figure 9a column, all numerical approaches seem to provide a rather good estimation of the flame brush position and evolution in terms of T distribution. This is true despite two issues: an overestimation of the temperature above the pilot pipe (r < 7 mm), especially close to the exit section (y = 5 mm), and the tendency to slightly underestimate the flame position as the y value increases (y > 25 mm). Both aspects can be explained by the adiabatic condition applied to the pilot wall, which is not fully consistent with the measured heat losses [39,40,42]. In fact, because the fine-tuning of numerical models coefficients was performed close to the pilot wall (y = 5 mm), a slight underestimation of the flame speed has to be expected where heat loss effects become negligible (y > 25 mm).
The satisfactory behaviour of both CFM and FAM models is also confirmed by the radial evolution of Z (Figure 9b column), which is almost perfectly captured. Nevertheless, it is worth mentioning that nonphysical values of Z were measured close to the burner axis from y = 25 mm and above, causing an overestimation of its real value. This can be attributed to improper background corrections at low number densities of CO and CH 4 [42].
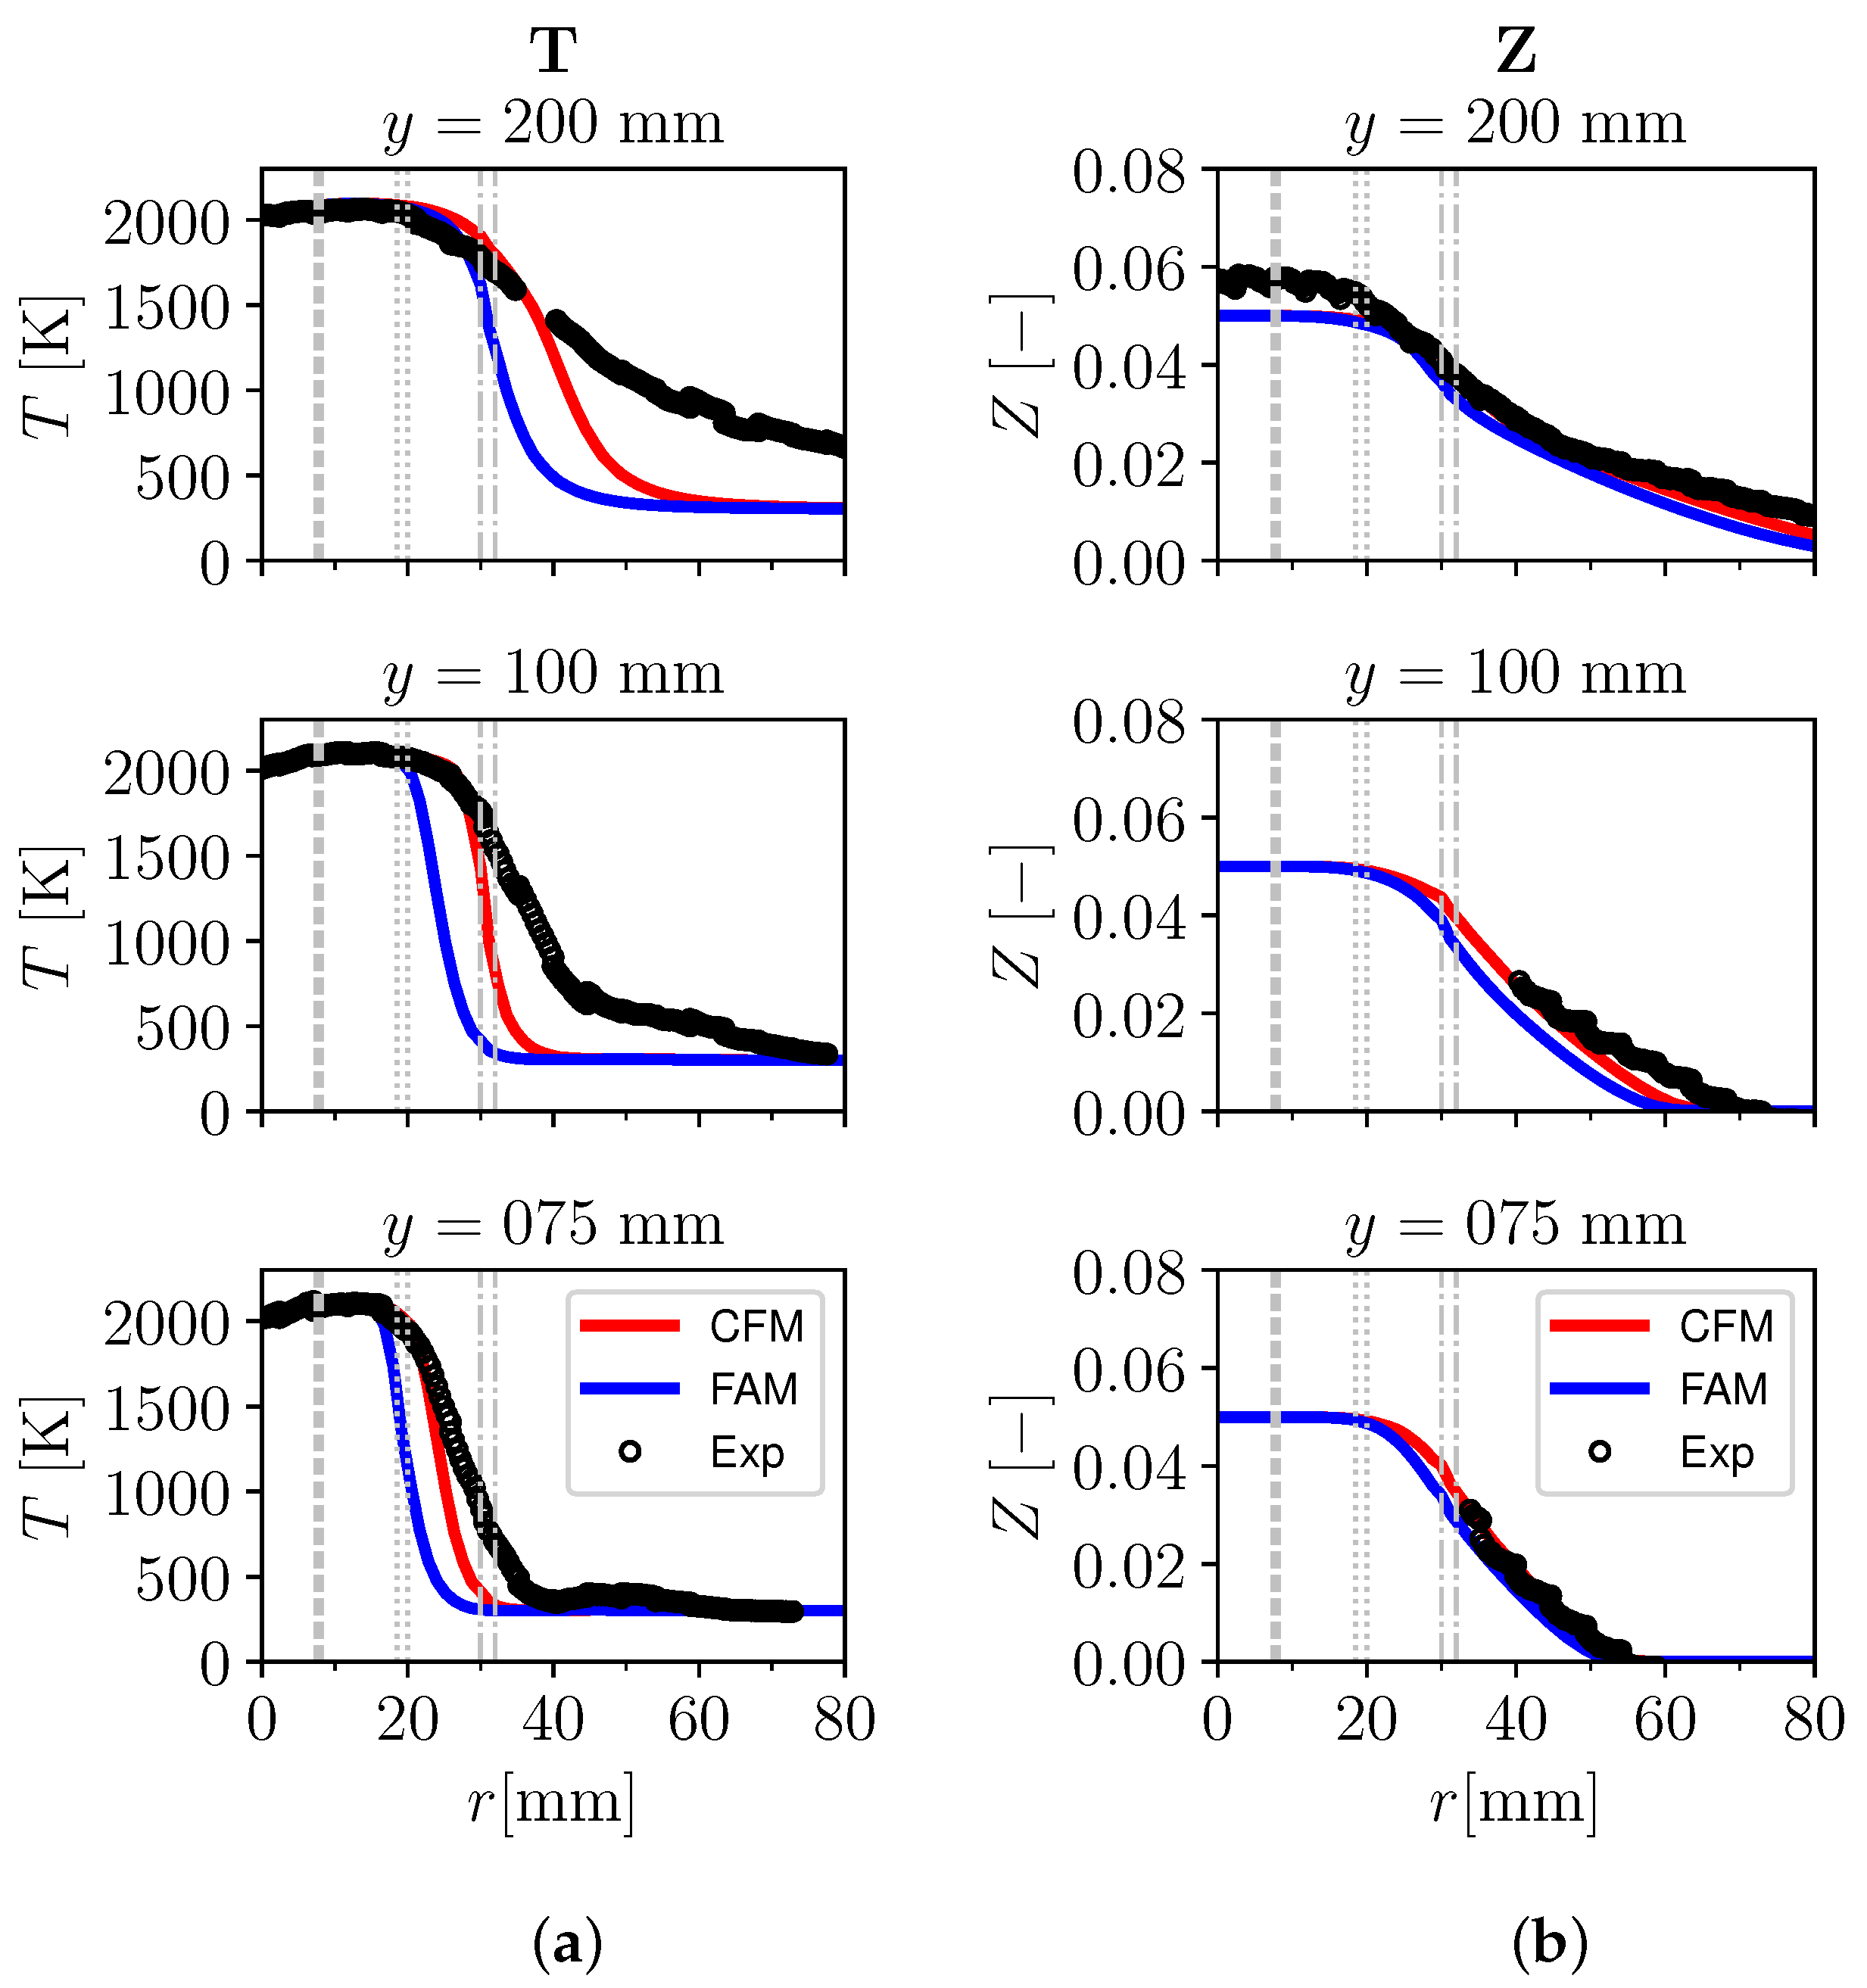
Focusing, instead, on the farthest region from the pilot exit section, different observations can be made. Figure 11 compares numerical and experimental radial trends of mean temperature T ((a) column) and mixture fraction Z ((b) column) for axial positions y ≥ 75 mm. Here, the flamelet assumption cannot be considered valid over the whole flame brush for both CFM and FAM models (Figure 7b column). A graphical representation of computed T and Z fields is still provided by Figure 10. By looking at Figure 11a column, a significant difference between computed and measured results in terms of T distribution can be observed. All numerical flame brushes are narrower than the experimental one, with a difference that increases with the y value. This phenomenon can be explained by the limitation of the flamelet assumption on which both CFM and FAM approaches rely when approaching turbulent HULP mixtures (increasingly low Z values and u > 0.5 m/s). In particular, because this limitation involves higher c values as the axial distance from the pilot increases, a growing underestimation of the measured T close to the “cold-tail” of the flame brush is observed as y increases (Figure 11a column). This misprediction of the combustion process also affects the computed Z distribution. In fact, as shown by Figure 11b column, increasing under-predictions of the experimental findings are observed, especially at high radial values.
To further support the thesis that limitations of the flamelet assumption cause significant discrepancies between numerical results and experimental measurements when the flame approaches turbulent HULP mixtures (Figure 11), a possible misalignment between the mixing and reaction layers can be neglected, as demonstrated by a previous study on the TSF A-r condition [43].
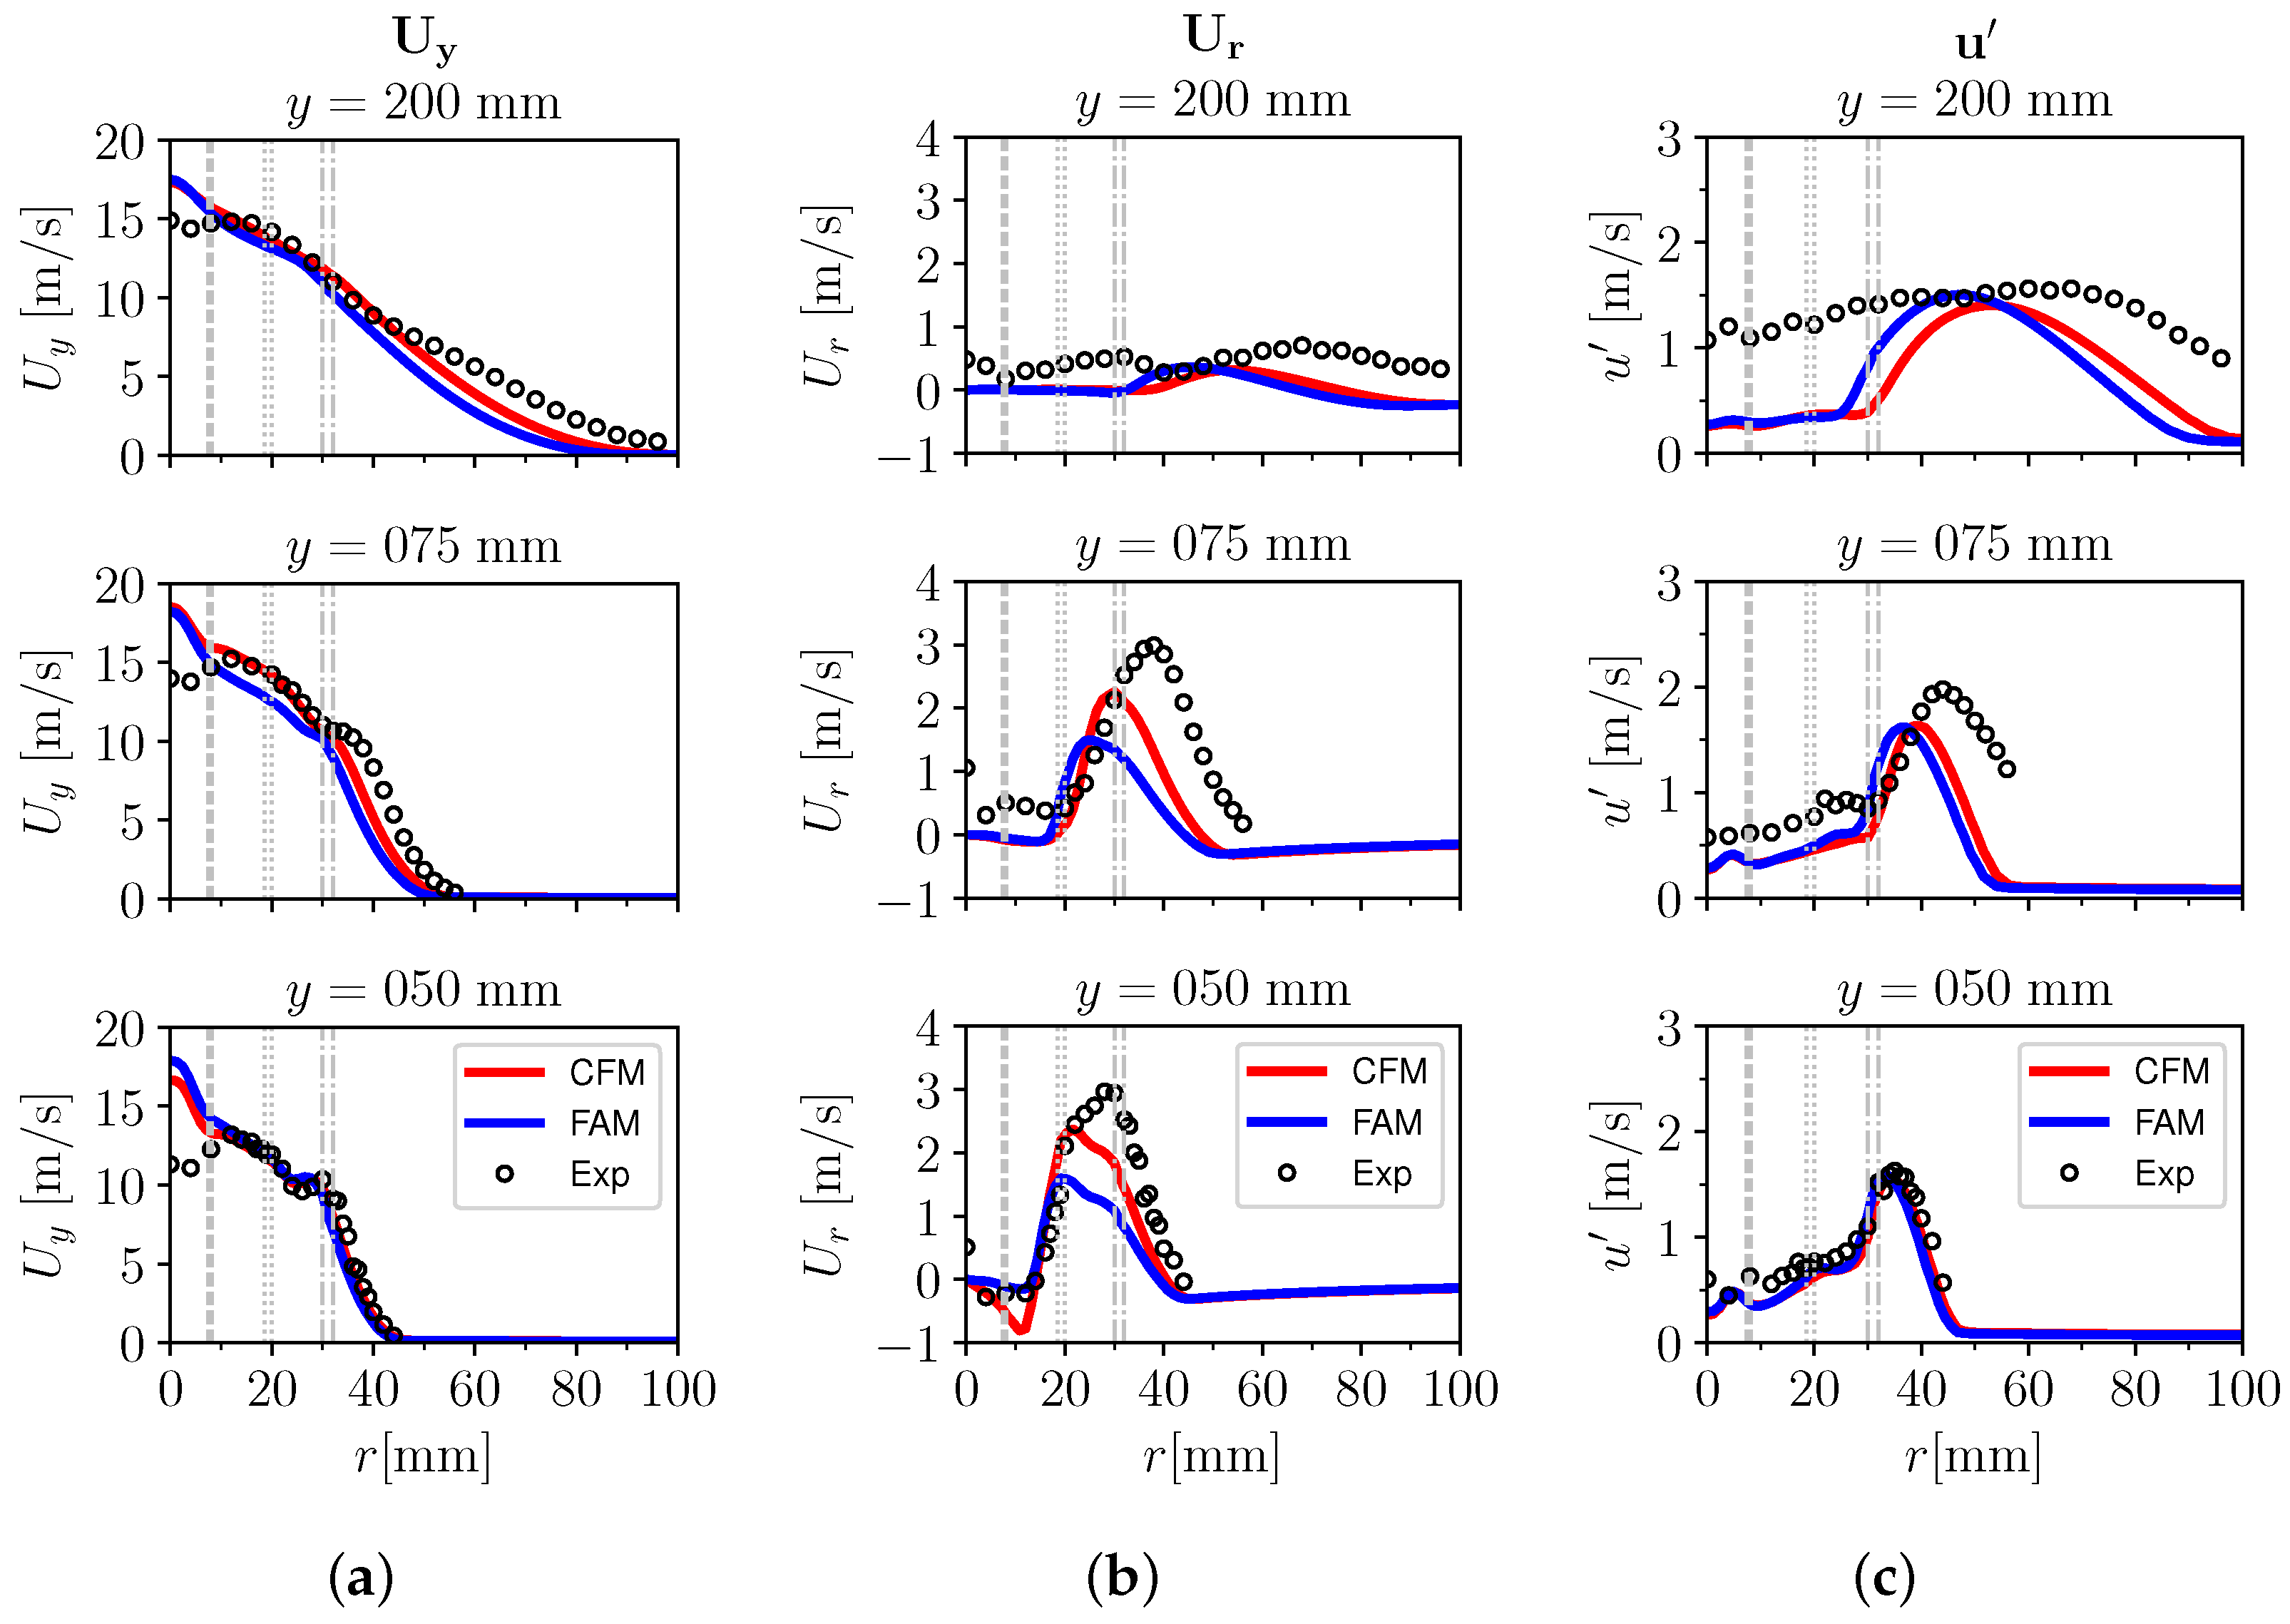
The effects produced by the limitation of the flamelet assumption on both CFM and FAM models, observed when y ≥ 75 mm, also impact the flow velocity and turbulence prediction. Figure 12 compares numerical and experimental radial trends of mean axial U y ((a) column) and radial U r ((b) column) velocities, as well as the turbulence intensity u ((c) column), at three different axial positions: y = 50, 75 and 200 mm (from bottom to top row). As can be observed, a satisfactory numerical–experimental agreement is achieved when the combustion phenomenon is properly captured (Figure 12, bottom row). In fact, near y = 50 mm the flamelet assumption is still valid over the whole flame brush (Figure 7a column). Nevertheless, the adiabatic assumption imposed at the pilot wall still has some consequences inside the flame core at this distance. The first is the U y over-prediction close to the burner axis (Figure 12a column, bottom row). The second is the underestimation of the U r imposed by the flame to the mixture above slot 2 (Figure 12b column, bottom row, 20 mm < r < 30 mm). Concerning the furthest axial locations y = 75 and 200 mm, from the central and top rows of Figure 12 significant discrepancies are observed between numerical results and experimental measurements for all investigated magnitudes. This is consistent with the observed limitation of the flamelet assumption on both CFM and FAM models in these regions.
A final observation can be made by comparing CFM and FAM model behaviour. By looking at Figure 11 and Figure 12, it can noticed how the flame predicted by the FAM approach seems more limited by the validity range of the flamelet assumption than the CFM strategy. In fact, if the flame surface density model is able to predict a wider and more shifted flame brush towards the air co-flow, this seems not true for the flame area approach.

4.2.3. The Combustion Effects: Case A-i2 vs. Case A-r

Despite the limits observed when approaching turbulent HULP mixtures, this section provides a deeper insight into the capabilities of the selected modelling approaches (CFM and FAM) in predicting the combustion effects on the flow field of the TSF burner. A comparison between the isothermal (A-i2) and the reacting (A-r) configurations of condition A is carried out.
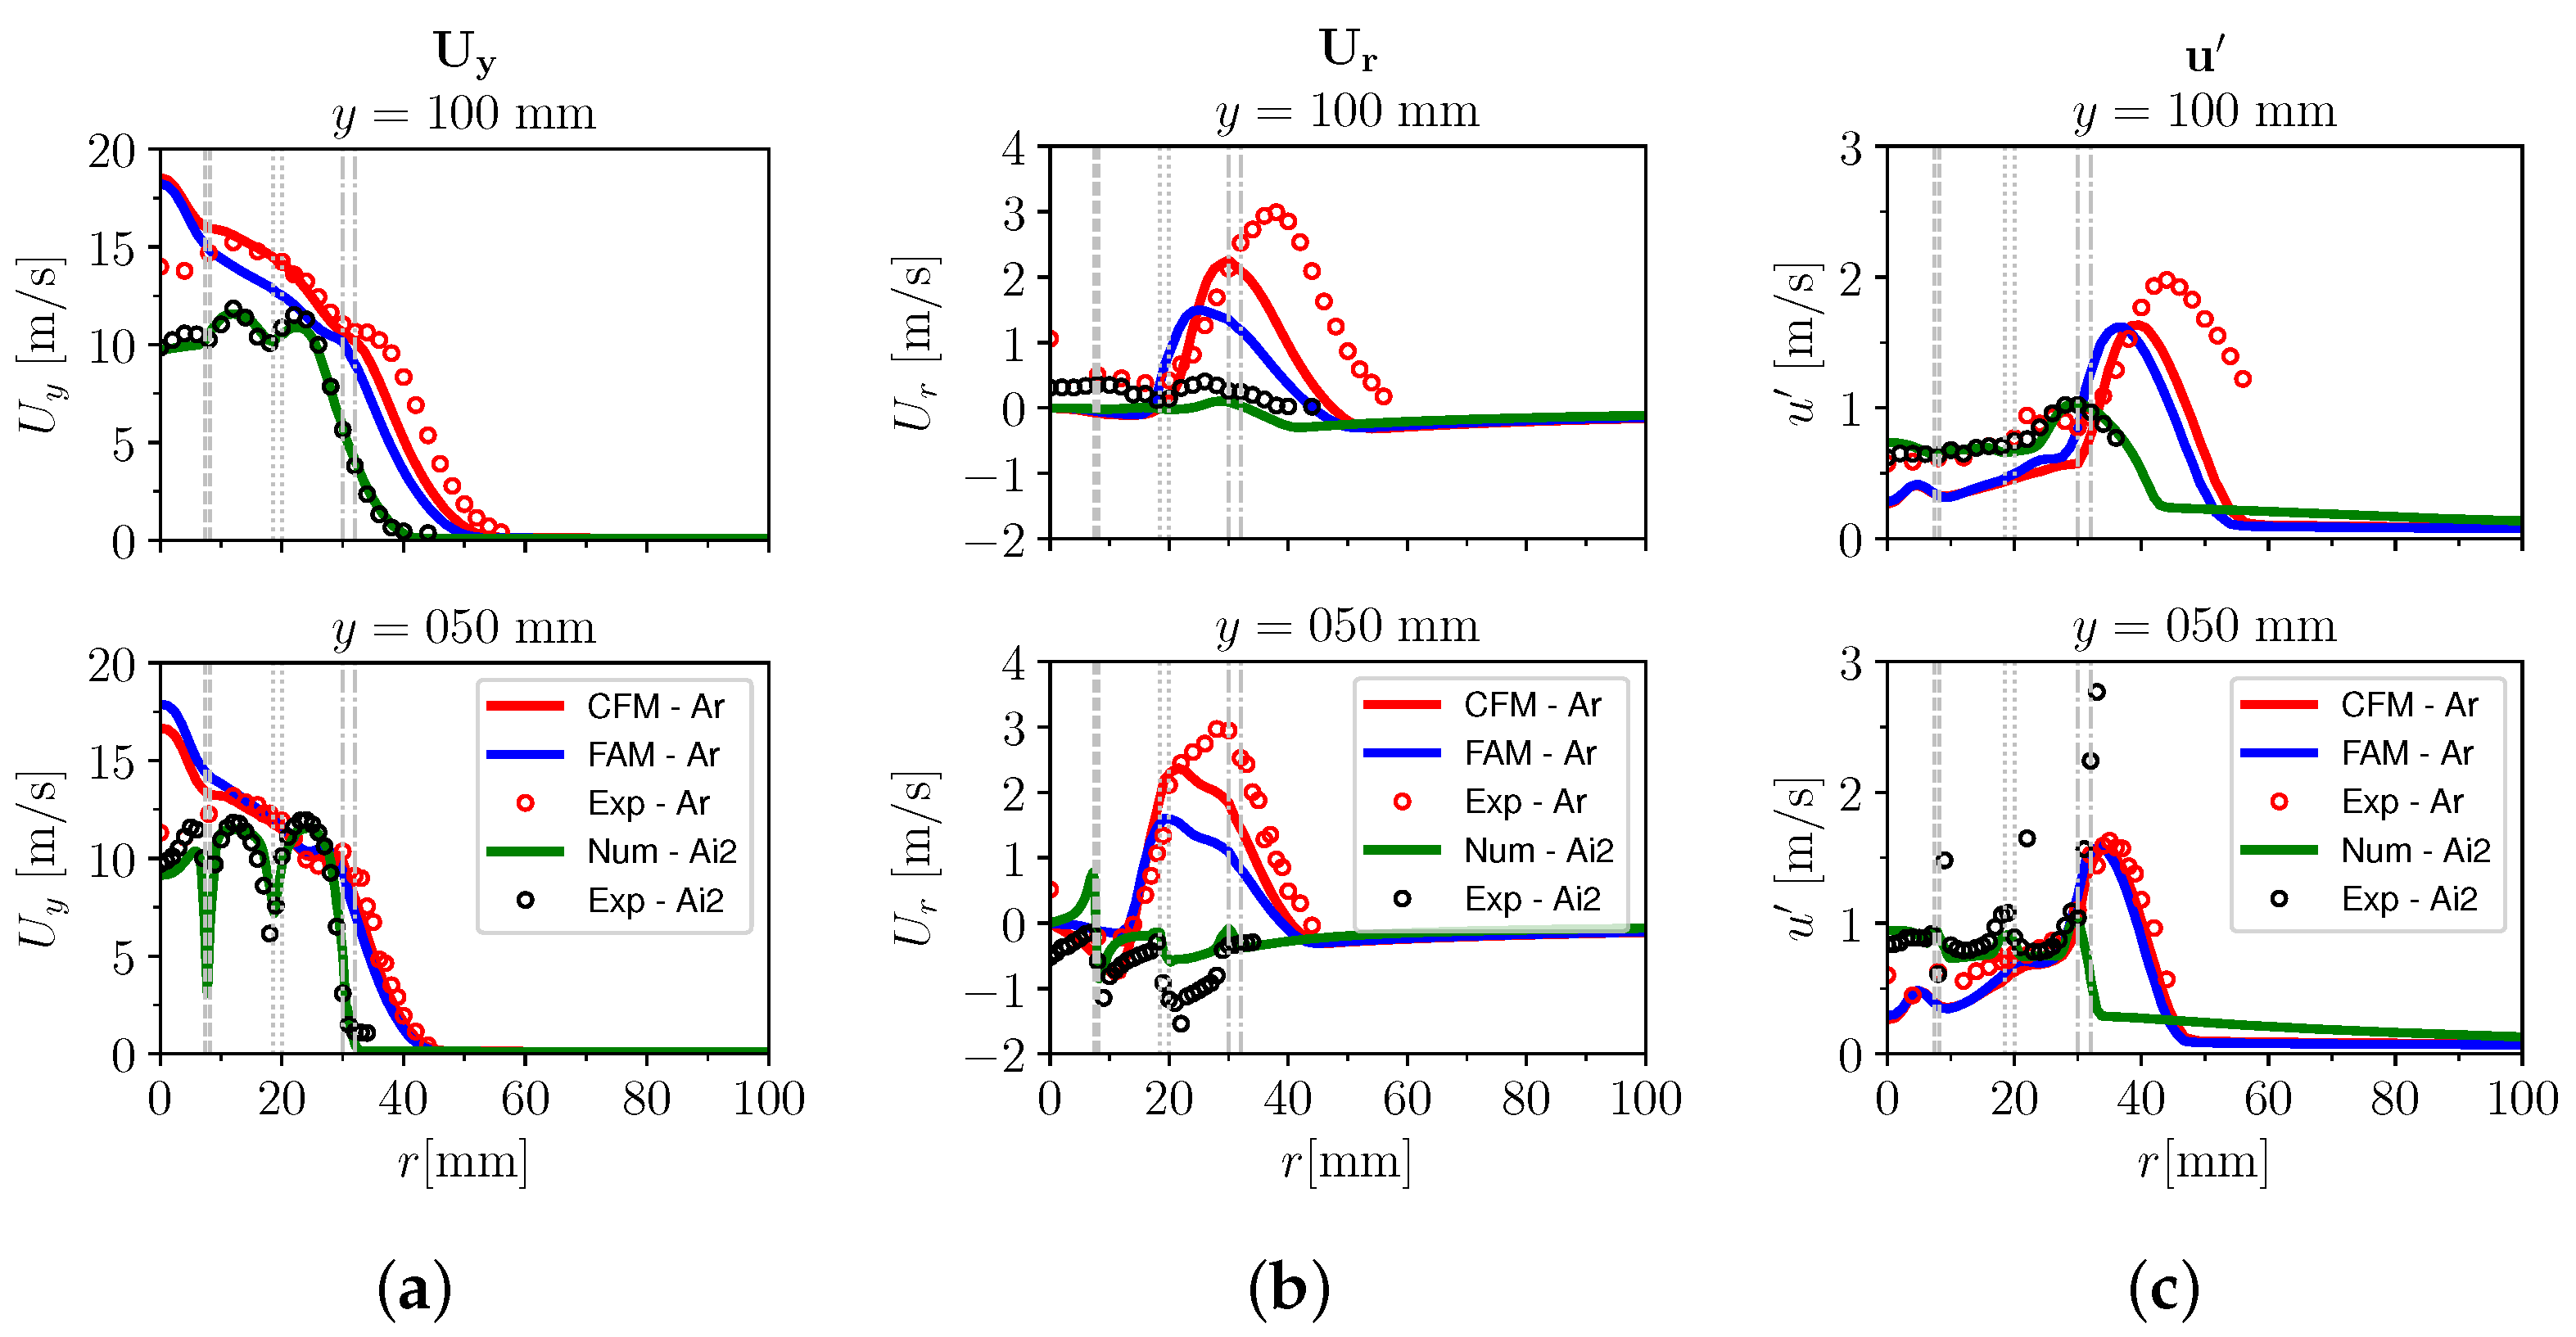
Figure 13 shows the effects of the combustion event on the radial profiles of axial velocity U y ((a) column), radial velocity U r ((b) column) and turbulence intensity u ((c) column). Here, the experimental findings are plotted, together with all achieved numerical results, to assess the models capabilities in predicting the measured trends. At both available axial positions, all numerical approaches seem able to estimate the combustion effects on the flow field of case A, such as the wider radial distribution of U y ((a) column), the radial acceleration of the fresh mixture ((b) column) and the shift towards higher radii of the shear layer with the air co-flow ((c) column). Analyzing each axial position, at y = 50 mm the results are rather nice, and small discrepancies can be observed. As already discussed, they are caused by the adiabatic assumption adopted in this study on the pilot wall (see Section 4.2.2). For what concerns the other axial distance (y = 100 mm), the investigated combustion models fail in providing accurate and reliable results. Only a rough estimation of the reacting process is achieved due to the limitation of the flamelet assumption detected at this position and the related mispredictions on the “cold-tail” of the flame brush (see Section 4.2.1 and Section 4.2.2). Therefore, this demonstrates how tricky this limitation of flamelet-based models on turbulent HULP mixtures is, particularly when modelling more complex configurations (e.g., SI engines). In fact, in such cases, the presence of many additional uncertainties affecting the numerical results, as well as the apparently satisfactory numerical trend, make the detection of this source of error almost impossible.

5. Conclusions

An assessment of two different flamelet-based models, the Coherent Flame Model (CFM) and the Flame Area Model (FAM), is carried out to clarify their applicability limits on homogeneous ultra-lean premixed (HULP) mixtures. The experimental steady-state, open flame type “A” of the Darmstadt TSF burner, is selected for the assessment.
In light of the achieved results, it can be stated that both CFM and FAM approaches are able to predict the combustion evolution with reasonable accuracy only when “classical” flamelet configurations are detected. This was observed in the vicinity of the burner exit (y ≤ 45 mm) where the flamelet assumption is fully valid because an homogeneous and shear-less CH 4 -air mixture, with a λ 1.1 , is burned.
On the other hand, when typical conditions of turbulent HULP mixtures are observed, the investigated models failed to provide accurate and reliable results because the combustion regime is significantly outside the flamelet applicability limits ( K a > 100). Only a rough estimation of the reacting process is achieved in such conditions, as observed at the furthest axial locations (y ≥ 75 mm). In fact, as y increases, turbulent HULP mixtures conditions ( λ and u = 1.5 ÷ 2 m/s) gradually affect the experimental flame features. As a consequence, the flamelet assumption starts to fail. This happens, first, at the “cold-tail” of the flame brush ( c 0.01), then higher c values are affected as y increases. Accordingly, all numerical predictions of the measured flame position become increasingly worse.
However, if more complex experimental rigs are investigated (e.g., SI engines) instead of simplified flame configurations (e.g., TSF flame A), the aforementioned numerical–experimental discrepancies could be ascribed to other uncertainties. This explains why such numerical models can also be applied to novel SI engine configurations operated with increasingly lean mixtures.
Nevertheless, considering that the current pathway of SI engine design and optimization is characterized by a continuous shift of the lean operation limit towards extremely high relative air/fuel ratios (turbulent HULP mixtures), these flamelet-based models need to be extended or modified to significantly improve 3D-CFD simulations of such extreme combustion modes.

Author Contributions

Conceptualization, L.S. and T.L.; methodology, L.S. and T.L.; software, L.S. and S.A.; validation, S.A. and L.S.; formal analysis, L.S. and S.A.; resources, T.L. and A.O.; data curation, L.S. and S.A.; writing—original draft preparation, L.S. and S.A.; writing—review and editing, L.S., T.L. and A.O.; supervision, T.L.; project administration, A.O. All authors have read and agreed to the published version of the manuscript.

Funding

This research received no external funding.

Institutional Review Board Statement

Not applicable.

Informed Consent Statement

Not applicable.

Data Availability Statement

The original numerical results presented in this study are openly available in OSF at https://osf.io/wndus/, accessed on 9 August 2022.

Acknowledgments

The authors thank A. Dreizler (TU Darmstadt, Germany) for providing the experimental measurements of the Darmstadt TSF burner.

Conflicts of Interest

The authors declare no conflict of interest.

Nomenclature

The following nomenclature is used in this manuscript:
A i k tensor describing flame orientation factors
bregress variable (unburned mass fraction)
cnormalised progress variable (burned mass fraction)
CCFM model constant for destruction term
C S ignition strength parameter
d i g n ignition diameter
Dflame surface density destruction term
D l a m flame surface density destruction term for laminar-only regime
D t u r b flame surface density destruction term for fully-turbulent regime
fparameter for laminar-to-turbulent flame transition (laminar: f = 0 ; turbulent: f 1 )
Gcoefficient of flame wrinkling generation term
kturbulent kinetic energy
l t integral length scale
l t c length scale (introduced for dimensional reasons and set according to [22])
l δ flame inner layer thickness
n flame surface normal direction towards fresh mixture
ppressure
p r e f reference pressure
r i g n ignition radius
r k early flame kernel radius
Rcoefficient of flame wrinkling reduction term
R η Kolmogorov Reynolds number
Sflame surface density production term
S k e r n e l kernel flame surface imposed by the ignition process
S l a m flame surface density production term for laminar-only regime
S t u r b flame surface density production term for fully-turbulent regime
S u unstrained laminar flame speed
S u , r e f unstrained laminar flame speed at reference conditions ( T r e f , p r e f )
S Ξ coefficient for flame wrinkling distribution across the flame
ttime
Ttemperature
T r e f reference temperature
u turbulence intensity
U flow velocity vector
U i flow velocity component
U ^ s surface-filtered flame velocity
V c e l l volume of the cell including the ignition position
Wcoefficient for reference unstrained laminar flame speed computation
x i Cartesian coordinate
Y b , i chemical species mass fraction in burned mixture
Y c not normalised progress variable
Y i chemical species mass fraction
Y u , i chemical species mass fraction in unburned mixture
Zmixture mass fraction
α coefficient of CFM model production term S;
temperature ratio exponent for unstrained laminar flame speed computation;
alignment angle between progress variable Y c (or c ) and mixture fraction Z gradients
β coefficient of CFM model destruction term D;
pressure ratio exponent for unstrained laminar flame speed computation
Γ K ¯ ITNFS (Intermittent Turbulent Flame Stretch) model function, according to [18,30]
δ l laminar flame thickness
Δ t i g n ignition duration
ε turbulent kinetic energy dissipation rate
η Kolmogorov length scale;
Equivalence ratio exponent for reference unstrained laminar flame speed computation
μ t turbulent dynamic viscosity
μ u dynamic viscosity of unburned mixture
ξ exponent for reference unstrained laminar flame speed computation
Ξ flame wrinkling
Ξ a algebraic model of flame wrinkling distribution
Ξ a * algebraic model of flame wrinkling distribution at equilibrium conditions
Ξ c o e f calibration coefficient of algebraic flame wrinkling
Ξ e q * algebraic model of flame wrinkling distribution at fully turbulent equilibrium conditions
ρ mixture density
ρ u unburned mixture density
Σ flame surface density
Σ k flame surface density of the mesh cell including the ignition position
τ η Kolmogorov time scale
ϕ equivalence ratio
ω ˙ i g n ignition source term
partial derivative
nabla operator

Appendix A. Mesh Sensitivity Analysis
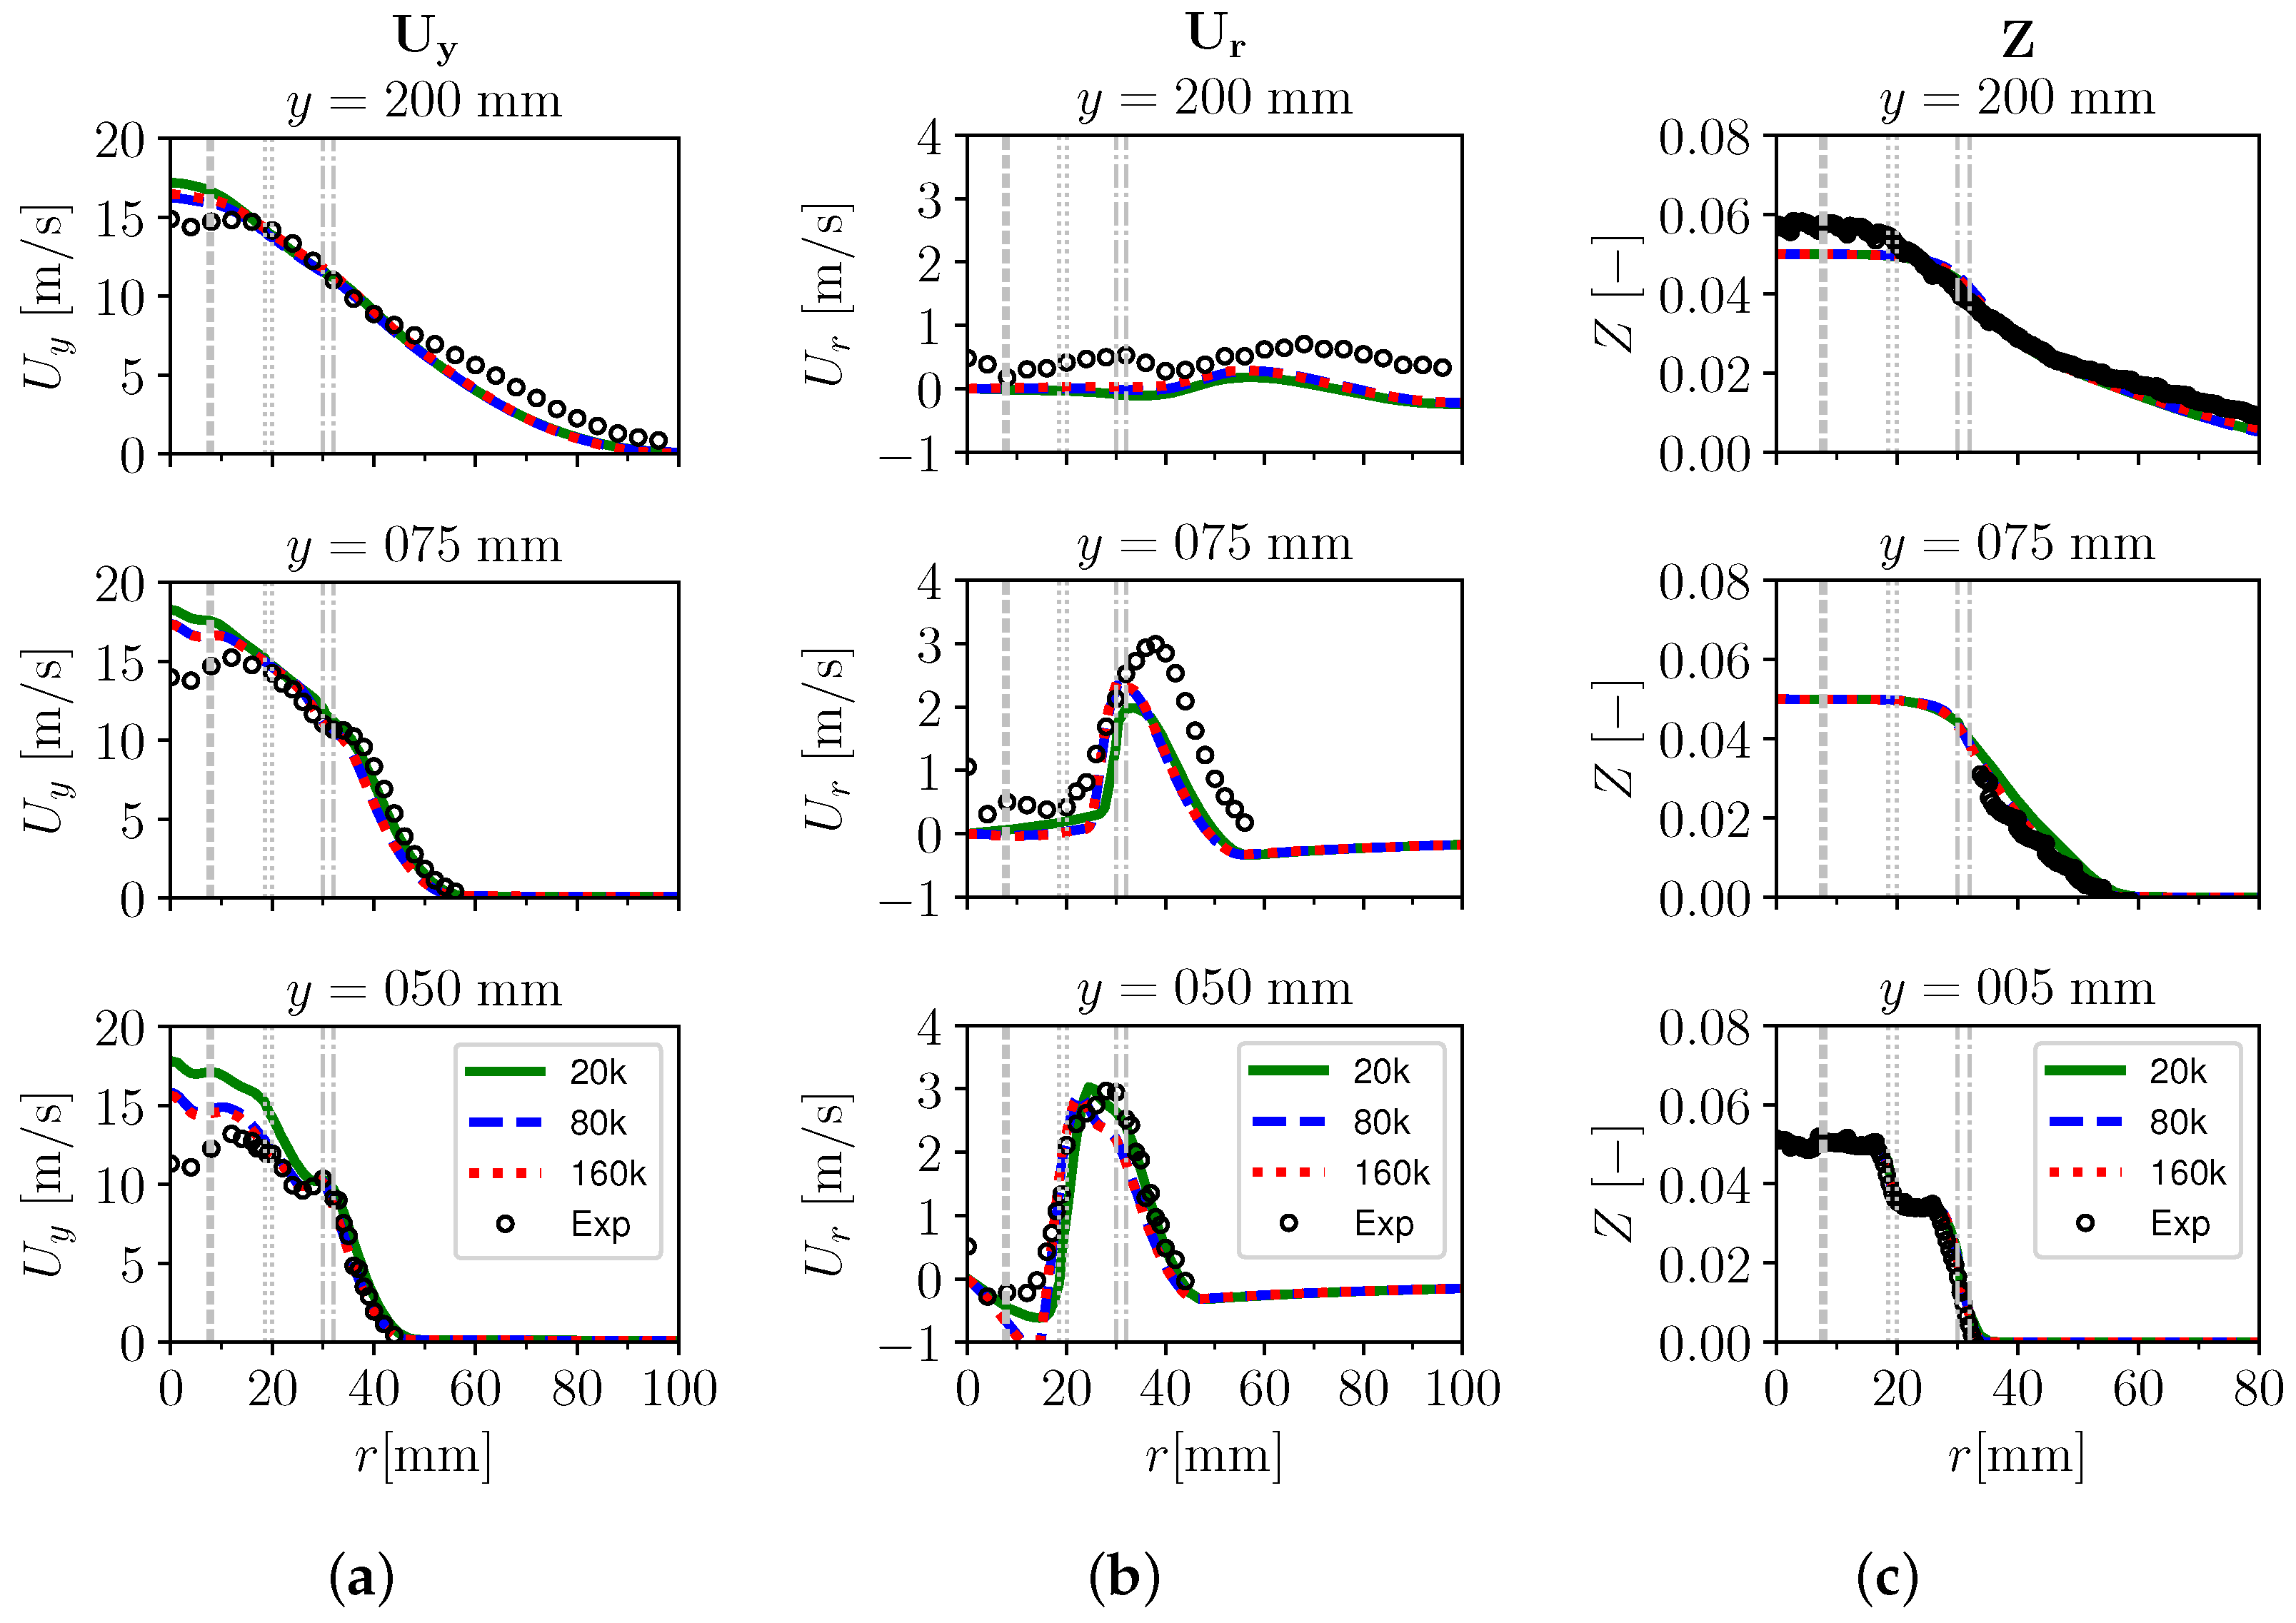
The optimization of the computational grid is carried out on both non-reacting (A-i2) and reacting (A-r) investigated cases, to minimize the computational costs without grid-biased numerical results. The mean axial U y and radial U r velocities, as well as the mixture fraction Z, are selected as reference parameters to understand when numerical results are independent from mesh refinement. Three different mesh dimensions are tested: 20k, 80k and 160k cells.
As it can be evinced from Figure A1 and Figure A2, in which also the non-reacting u distributions are reported (Figure A1 (c) column), the convergence of all numerical results is achieved at a mesh dimension of 80k cells. Therefore, this mesh type is chosen as the best trade-off between computational time and accuracy of results. A detail of this mesh near burner walls can be observed in Figure 4 and it spans from cubic cells of about 0.5 mm in the most refined regions to cells of 1 mm side far from the burning area, as mentioned in Section 3.2.
Figure A1. Case A-i2: radial distributions of mean axial velocity U y (a), mean radial velocity U r (b) and mean turbulence intensity u (c) computed at various axial positions (y = 1, 50 and 100 mm) with different mesh resolutions (20k, 80k and 160k cells) in comparison with experimental data.
Energies 15 05947 g0a1
Figure A2. Case A-r: radial distributions of mean axial velocity U y (a), mean radial velocity U r (b) and mean mixture fraction Z (c) computed at various axial positions (y = 50, 75 and 200 mm) with different mesh resolutions (20k, 80k and 160k cells) in comparison with experimental data.
Energies 15 05947 g0a2

References

  1. The European Commission. The European Green Deal; The European Commission: Brussels, Belgium, 2019.
  2. The European Commission. ’Fit for 55’: Delivering the EU’s 2030 Climate Target on the Way to Climate Neutrality; The European Commission: Brussels, Belgium, 2021.
  3. The European Commission. Regulation of the European Parliament and of the Council amending Regulation (EU) 2019/631 as Regards Strengthening the CO2 Emission Performance Standards for New Passenger Cars and New LIGHT commercial Vehicles in Line with the Union’s Increased Climate Ambition; The European Commission: Brussels, Belgium, 2021.
  4. US Department of Energy. The United States’ Nationally Determined Contribution; US Department of Energy: Washington, DC, USA, 2021.
  5. Guido, C.; Napolitano, P.; Alfuso, S.; Corsetti, C.; Beatrice, C. How engine design improvement impacts on particle emissions from an HD SI natural gas engine. Energy 2021, 231, 120748. [Google Scholar] [CrossRef]
  6. Liu, Z.; Sun, P.; Du, Y.; Yu, X.; Dong, W.; Zhou, J. Improvement of combustion and emission by combined combustion of ethanol premix and gasoline direct injection in SI engine. Fuel 2021, 292, 120403. [Google Scholar] [CrossRef]
  7. Solomon, A.; Battiston, P.; Sczomak, D. Lean-Stratified Combustion System with Miller Cycle for Downsized Boosted Application—Part I. In Proceedings of the SAE WCX Digital Summit, Virtual, 12–15 April 2021. [Google Scholar] [CrossRef]
  8. Attard, W.; Parsons, P. A normally aspirated spark initiated combustion system capable of high load, high efficiency and near Zero NOx emissions in a modern vehicle powertrain. SAE Int. J. Engines 2010, 3, 269–287. [Google Scholar] [CrossRef]
  9. Toulson, E.; Watson, H.; Attard, W. Gas Assisted Jet Ignition of Ultra-Lean LPG in a Spark Ignition Engine; SAE Technical Papers; SAE International: Warrendale, PA, USA, 2009. [Google Scholar]
  10. Shah, A.; Tunestal, P.; Johansson, B. Effect of Pre-Chamber Volume and Nozzle Diameter on Pre-Chamber Ignition in Heavy Duty Natural Gas Engines; SAE Technical Papers; SAE International: Warrendale, PA, USA, 2009. [Google Scholar]
  11. Toulson, E.; Huisjen, A.; Chen, X.; Squibb, C.; Zhu, G.; Schock, H.; Attard, W. Visualization of Propane and Natural Gas Spark Ignition and Turbulent Jet Ignition Combustion. SAE Int. J. Engines 2012, 5, 1821–1835. [Google Scholar] [CrossRef]
  12. Zhu, S.; Akehurst, S.; Lewis, A.; Yuan, H. A review of the pre-chamber ignition system applied on future low-carbon spark ignition engines. Renew. Sustain. Energy Rev. 2022, 154, 111872. [Google Scholar] [CrossRef]
  13. Zhou, L.; Liu, P.; Zhong, L.; Feng, Z.; Wei, H. Experimental observation of lean flammability limits using turbulent jet ignition with auxiliary hydrogen and methane in pre-chamber. Fuel 2021, 305, 121570. [Google Scholar] [CrossRef]
  14. Kim, J.; Scarcelli, R.; Som, S.; Shah, A.; Biruduganti, M.; Longman, D. Numerical investigation of a fueled pre-chamber spark-ignition natural gas engine. Int. J. Engine Res. 2021. [Google Scholar] [CrossRef]
  15. Kim, J.; Scarcelli, R.; Som, S.; Shah, A.; Biruduganti, M.; Longman, D. Assessment of turbulent combustion models for simulating prechamber ignition in a natural gas engine. J. Eng. Gas Turbines Power 2021, 143, 091004. [Google Scholar] [CrossRef]
  16. Marble, F.E.; Broadwell, J.E. The Coherent Flame Model for Turbulent Chemical Reactions; Technical Report; TRW Defense and Space Systems Group: New York, NY, USA, 1977.
  17. Boudier, P.; Henriot, S.; Poinsot, T.; Baritaud, T. A model for turbulent flame ignition and propagation in spark ignition engines. Symp. Int. Combust. 1992, 24, 503–510. [Google Scholar] [CrossRef]
  18. Duclos, J.; Veynante, D.; Poinsot, T. A comparison of flamelet models for premixed turbulent combustion. Combust. Flame 1993, 95, 101–117. [Google Scholar] [CrossRef]
  19. Weller, H.G.; Tabor, G.; Gosman, A.D.; Fureby, C. Application of a Flame Wrinkling LES Combustion Model to a Turbulent Mixing Layer. In Proceedings of the Twenty-Seventh Symposium on Combustion, Boulder, CO, USA, 2–7 August 1998; pp. 899–907. [Google Scholar]
  20. Peters, N. Turbulent Combustion; Cambridge University Press: Cambridge, UK, 2000. [Google Scholar]
  21. Herrmann, M. Refined Level Set Grid Method for Tracking Interfaces. In Annual Research Briefs 2005; Center for Turbulence Research: Stanford, CA, USA, 2005; pp. 3–18. [Google Scholar]
  22. Choi, C.R.; Huh, K.Y. Development of a Coherent Flamelet Model for a Spark-Ignited Turbulent Premixed Flame in a Closed Vessel. Combust. Flame 1998, 114, 336–348. [Google Scholar] [CrossRef]
  23. Weller, H.G. The Development of a New Flame Area Combustion Model Using Conditional Averaging; Thermo-Fluids Section Report TF 9307; Imperial College of Science, Technology and Medicine: London, UK, 1993. [Google Scholar]
  24. Ewald, J.; Peters, N. A Level Set Based Flamelet Model for the Prediction of Combustion in Spark-Ignition Engines. In Proceedings of the 15th International Multidimensional Engine Modeling User’s Group Meeting, Detroit, MI, USA, 20 April 2005. [Google Scholar]
  25. Seffrin, F.; Fuest, F.; Geyer, D.; Dreizler, A. Flow field studies of a new series of turbulent premixed stratified flames. Combust. Flame 2010, 157, 384–396. [Google Scholar] [CrossRef]
  26. Sweeney, M.S.; Hochgreb, S.; Dunn, M.J.; Barlow, R.S. The structure of turbulent stratified and premixed methane/air flames I: Non-swirling flows. Combust. Flame 2012, 159, 2896–2911. [Google Scholar] [CrossRef]
  27. Sweeney, M.S.; Hochgreb, S.; Dunn, M.J.; Barlow, R.S. The structure of turbulent stratified and premixed methane/air flames II: Swirling flows. Combust. Flame 2012, 159, 2912–2929. [Google Scholar] [CrossRef]
  28. Lucchini, T.; D’Errico, G.; Paredi, D.; Sforza, L.; Onorati, A. CFD Modeling of Gas Exchange, Fuel-Air Mixing and Combustion in Gasoline Direct-Injection Engines; SAE Technical Papers; SAE International: Warrendale, PA, USA, 2019. [Google Scholar]
  29. Sforza, L.; Lucchini, T.; Gianetti, G.; D’Errico, G. Development and Validation of SI Combustion Models for Natural-Gas Heavy-Duty Engines; SAE Technical Papers; SAE International: Warrendale, PA, USA, 2019. [Google Scholar] [CrossRef]
  30. Meneveau, C.; Poinsot, T. Stretching and quenching of flamelets in premixed turbulent combustion. Combust. Flame 1991, 86, 311–332. [Google Scholar] [CrossRef]
  31. Prasad, R.; Gore, J. An evaluation of flame surface density models for turbulent premixed jet flames. Combust. Flame 1999, 116, 1–14. [Google Scholar] [CrossRef]
  32. Lucchini, T.; Cornolti, L.; Montenegro, G.; D’Errico, G.; Fiocco, M.; Teraji, A.; Shiraishi, T. A Comprehensive Model to Predict the Initial Stage of Combustion in SI Engines; SAE Paper 2013-01-1087; SAE International: Warrendale, PA, USA, 2013. [Google Scholar]
  33. Zhu, X.; Sforza, L.; Ranadive, T.; Zhang, A.; Lee, S.Y.; Naber, J.; Lucchini, T.; Onorati, A.; Anbarasu, M.; Zeng, Y. Experimental and Numerical Study of Flame Kernel Formation Processes of Propane-Air Mixture in a Pressurized Combustion Vessel. SAE Int. J. Engines 2016, 9, 1494–1511. [Google Scholar] [CrossRef]
  34. Sforza, L.; Lucchini, T.; Onorati, A.; Zhu, X.; Lee, S. Modeling Ignition and Premixed Combustion Including Flame Stretch Effects. In Proceedings of the WCX™ 17: SAE World Congress Experience; SAE International: Warrendale, PA, USA, 2017. [Google Scholar] [CrossRef]
  35. Gulder, O.L. Correlations of Laminar Combustion Data for Alternative S.I. Engine Fuels; SAE Technical Paper; SAE International: Warrendale, PA, USA, 1984. [Google Scholar] [CrossRef]
  36. Lucchini, T.; D’Errico, G.; Onorati, A.; Frassoldati, A.; Gilles Hardy, A.S. Modeling Non-Premixed Combustion Using Tabulated Kinetics and Different Flame Structure Assumptions. SAE Int. J. Engines 2017, 2, 593–607. [Google Scholar] [CrossRef]
  37. Smith, G.P.; Golden, D.M.; Frenklach, M.; Moriarty, N.W.; Eiteneer, B.; Goldenberg, M.; Bowman, C.T.; Hanson, R.K.; Song, S.; Gardiner, J.; et al. GRI-Mech 3.0. Available online: http://www.me.berkeley.edu/gri_mech/ (accessed on 25 October 2019).
  38. Gulder, O.L. Turbulent Premixed Flame Propagation Models for Different Combustion Regimes. In Proceedings of the the Twenty-Third Syposium on Combustion (International), Orleans, France, 22–27 July 1990; pp. 743–750. [Google Scholar]
  39. Kuenne, G.; Euler, M.; Ketelheun, A.; Avdić, A.; Dreizler, A.; Janicka, J. A Numerical Study of the Flame Stabilization Mechanism Being Determined by Chemical Reaction Rates Submitted to Heat Transfer Processes. Z. Phys. Chem. 2015, 229, 643–662. [Google Scholar] [CrossRef]
  40. Mercier, R.; Auzillon, P.; Moureau, V.; Darabiha, N.; Gicquel, O.; Veynante, D.; Fiorina, B. LES Modeling of the Impact of Heat Losses and Differential Diffusion on Turbulent Stratified Flame Propagation: Application to the TU Darmstadt Stratified Flame. Flow Turbul. Combust. 2014, 93, 349–381. [Google Scholar] [CrossRef]
  41. Borghi, R. On the Structure and Morphology of Turbulent Premixed Flames. In Recent Advances in the Aerospace Sciences: In Honor of Luigi Crocco on His Seventy-Fifth Birthday; Casci, C., Bruno, C., Eds.; Springer: Boston, MA, USA, 1985; pp. 117–138. [Google Scholar] [CrossRef]
  42. Kuenne, G.; Seffrin, F.; Fuest, F.; Stahler, T.; Ketelheun, A.; Geyer, D.; Janicka, J.; Dreizler, A. Experimental and numerical analysis of a lean premixed stratified burner using 1D Raman/Rayleigh scattering and large eddy simulation. Combust. Flame 2012, 159, 2669–2689, Special Issue on Turbulent Combustion. [Google Scholar] [CrossRef]
  43. Sforza, L. Development of a Comprehensive CFD Model for Spark-Ignition Engine Combustion. Ph.D. Thesis, Politecnico di Milano, Milan, Italy, 2018. [Google Scholar]
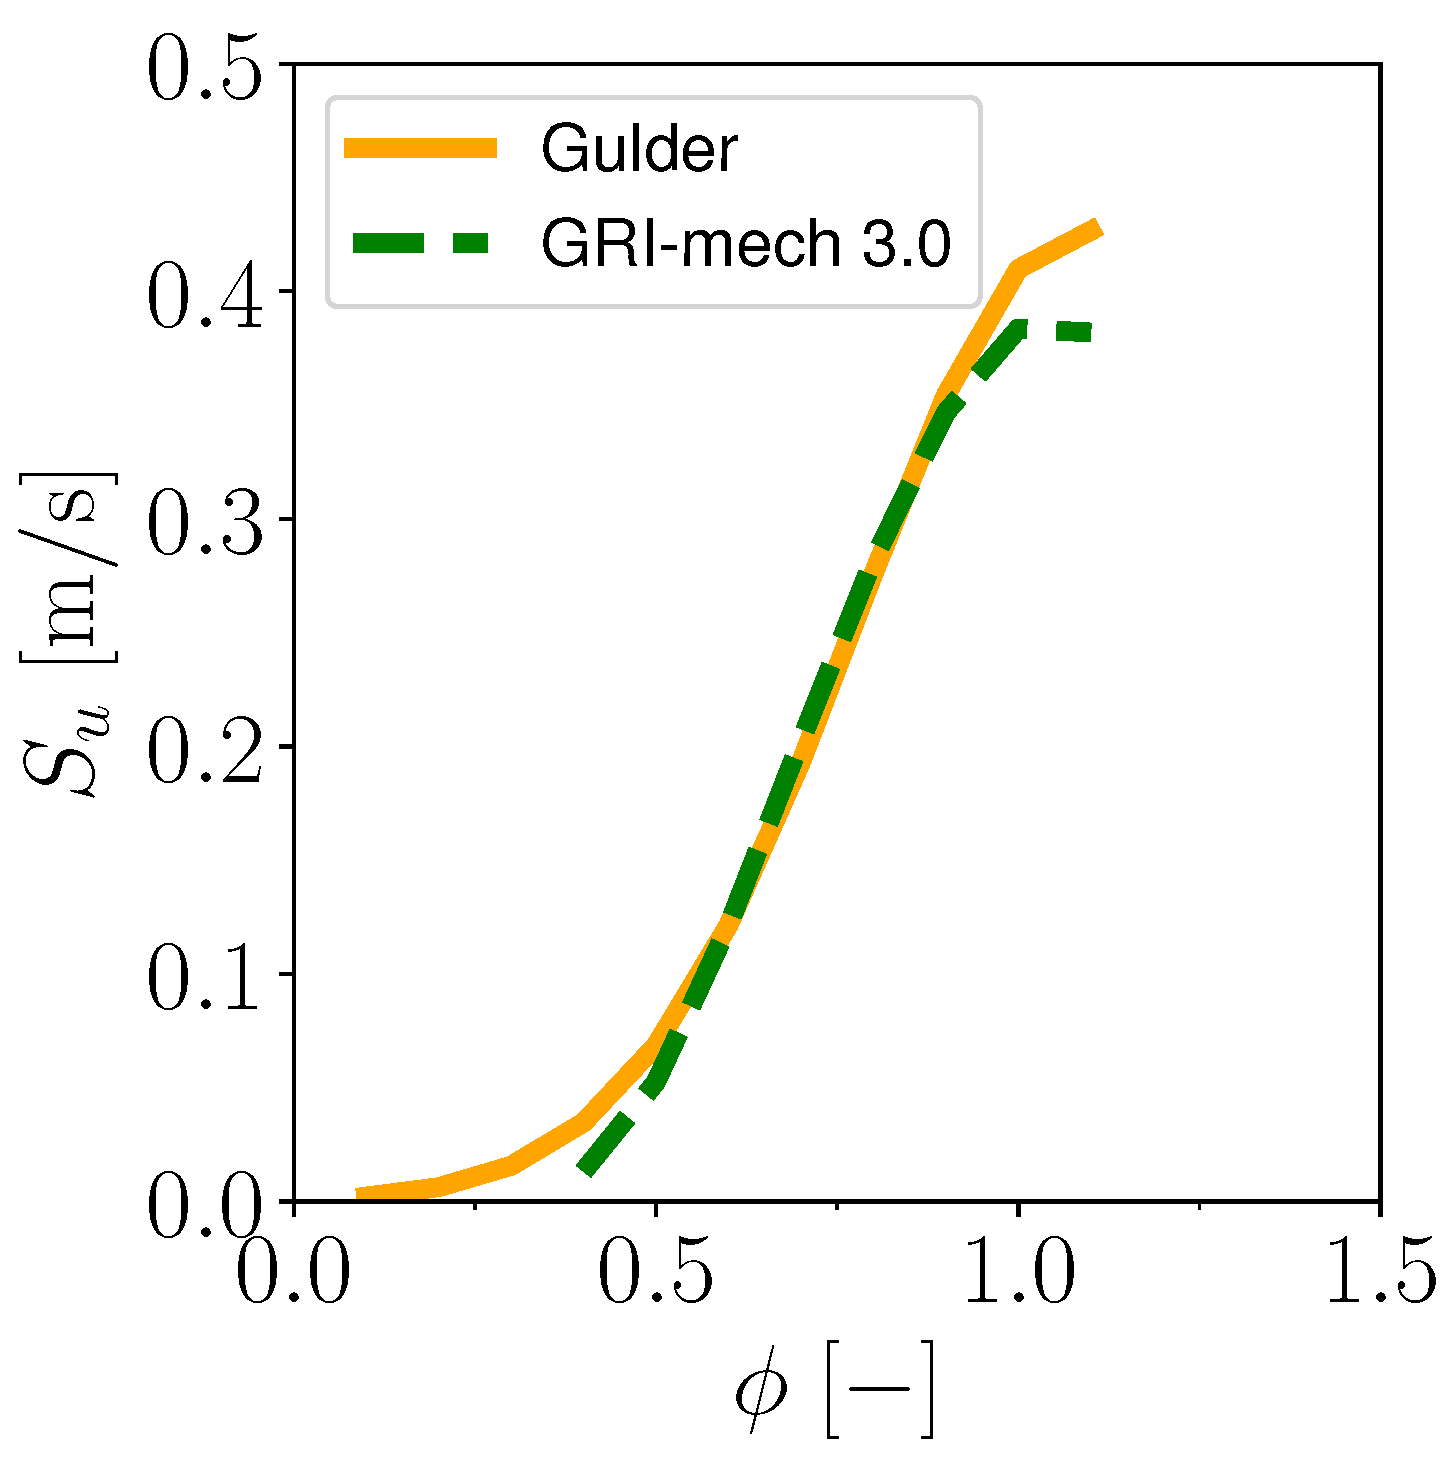
Figure 1. Estimation of the laminar flame speed S u value as a function of the fresh CH 4 -air mixture equivalence ratio ϕ at ambient conditions (p = 1.01325 bar; T = 300 K): comparison between Gulder’s correlation and a tabulation approach with the GRI-mech 3.0 mechanism.
Energies 15 05947 g001
Figure 2. Schematic of the CFM and FAM combustion models embedded into the same numerical structure.
Energies 15 05947 g002
Figure 3. 3-D axisymmetric wedge domain for the numerical investigation of the Darmstadt TSF burner.
Energies 15 05947 g003
Figure 4. The computational mesh in the vicinity of the burner exit region for: (a) the non−reacting case A-i2; and (b) the reacting case A-r.
Energies 15 05947 g004
Figure 5. Axial locations where experimental measurements of conditions A-i2 (blue) and A-r (yellow) of Table 1 are available.
Energies 15 05947 g005
Figure 6. Case A-i2: radial distributions of mean axial velocity U y (a); mean radial velocity U r (b); and mean turbulence intensity u (c); computed at various axial positions y in comparison with experimental data. Hereafter, following the increase of r, the vertical grey dashed, dotted and dashed-dotted lines correspond to the radial positions of the inner and outer walls of the pilot, slot 1 and slot 2, respectively.
Energies 15 05947 g006
Figure 7. Case A-r: numerical flame regimes achieved with CFM (red) and FAM (blue) at different axial positions y, evaluated at three values of normalized progress variable: c = 0.5, c = 0.05 and c = 0.01, from bottom to top line. Column (a): 5 mm y 45 mm; column (b): 75 mm y 200 mm.
Energies 15 05947 g007
Figure 8. Case A-r: comparison between normalized progress variable c fields achieved with FAM (left half) and CFM (right half) models, including iso−lines (solid white) of c = 0.5, c = 0.05 and c = 0.01 (from burner axis towards increasing radii, respectively).
Energies 15 05947 g008
Figure 9. Case A-r: radial profiles of mean temperature T (a); and mean mixture fraction Z (b); computed with different models at axial positions 5 mm y 45 mm in comparison with experimental data.
Energies 15 05947 g009
Figure 10. Case A-r: comparison between mean temperature T (a); and mean mixture fraction Z (b); fields achieved with FAM and CFM models, including iso-lines (solid white) of c = 0.5, c = 0.05 and c = 0.01 (from burner axis towards increasing radii, respectively).
Energies 15 05947 g010
Figure 11. Case A-r: radial profiles of mean temperature T (a); and mean mixture fraction Z (b); computed with different models at axial positions 75 mm y 200 mm in comparison with experimental data.
Energies 15 05947 g011
Figure 12. Case A-r: radial profiles of mean axial velocity U y (a); mean radial velocity U r (b); and mean turbulence intensity u (c); computed with different models at axial positions y = 50, 75 and 200 mm in comparison with experimental data.
Energies 15 05947 g012
Figure 13. Radial distributions of mean axial velocity U y (a); mean radial velocity U r (b); and mean turbulence intensity u (c); computed at y = 50 and 100 mm from the pilot exit section, in comparison with the experimental data, for both the non-reacting (A-i2) and reacting (A-r) cases of condition A. For case A-i2, the single non-reacting result is included (Figure 6), while for case A-r both CFM and FAM models are considered (Figure 12).
Energies 15 05947 g013
Table 1. Flow parameters of the two investigated conditions.
Case ϕ pilot ϕ slot 1 ϕ slot 2 u pilot u slot 1 u slot 2 Re pilot Re slot 1 Re slot 2 u coflow
A-i2000101010980013,80013,3000.1
A-r0.90.90.61101098013,80013,3000.1
Equivalence ratios ϕ (−); calculated bulk velocities from unburned gas properties u (m/s); Reynolds numbers Re (−) (based on the bulk velocity and hydraulic diameter).
Table 2. Model constants used in this work.
ConstantCFMFAM
α 2.0 -
l t c 1.26 × 10 3 -
A i k 1.5 -
β 1.2 -
C 0.7 -
Ξ c o e f - 0.1
CFM: CFM model (Section 2.1); FAM: FAM model (Section 2.2). For the sake of clarity, α and β coefficients belong to Equation (5)
Publisher’s Note: MDPI stays neutral with regard to jurisdictional claims in published maps and institutional affiliations.