Abstract
This research investigates the relationships among renewable energy consumption, economic growth, and financial development in five sub-Saharan African nations utilizing panel data from 2000 to 2020. Econometric methods are used to ascertain the existence or absence of cross-sectional dependence and the short-run and long-run connections between the following factors: Pesaran cross-sectional dependence (CD) and cross-sectionally augmented IPS (CIPS) unit root tests, pooled mean group (PMG), and dynamic ordinary least squares (DOLS) estimations. The presence of cross-sectional dependence is found and represented with the CIPS unit root test. No significant short-run relationship is found between the variables of the study, yet a significant long-run relationship is present among them. A positive relationship exists between CO2 emissions and financial development, while financial development and renewable energy consumption are found to have negative relationships with CO2 emissions. The study also supports the scale effect of the environmental Kuznets curve hypothesis. Additionally, no causality is found among the variables, and impulse response and variance decomposition estimation are carried out to recommend future effects. Policy implications of findings are discussed, with accompanying suggestions.
1. Introduction
Global warming is arguably among the most pressing problems affecting almost all countries of the world—developed, emerging, or developing alike [1]—due to its deleterious consequences on the environment [2]. Global warming has often been attributed to carbon dioxide (CO2) emissions onto the atmosphere, which has seen an astronomical increase in the last century. This increase [3] in CO2 emissions from the 19th century to the 20th century is more than 30%. From 1990 to 2014 [4], countries in the Asia-Pacific region were the largest emitters of CO2 globally, while Europe and other Eurasian countries played significant roles in the same period in CO2 abatement. Developing countries also play a significant role in the level of CO2 emissions globally [5], given their dependence on fossil fuels as sources of energy most of the time, which expose their environment to pollution [6]. Ref. [7] argue that the grave consequences of CO2 emissions on the environment are the reasons several emerging studies in the energy-growth environmental sustainability literature focus on uncovering the determinants of CO2 emissions. Ref. [8] believe that economic growth and energy consumption are the primary factors influencing the severity of CO2 emissions in a country. Ref. [9] also corroborate the argument with their submission that about 1.4% of global emissions in 2011 were due to massive economic growth recorded globally that same year. These emissions spilled over to 2012, reaching a total of 34.5 billion tons. The maturity of the financial market, also referred to as financial development, is another important factor in CO2 emission discourse [10], because it is a pointer to a country’s investment into alternative energy sources—renewable energy for instance, that can enhance CO2 abatement—or lack thereof.
This study is an attempt to explore the contribution of these factors—economic growth, renewable energy consumption, and financial development—to the level of CO2 emissions in the five largest economies of sub-Saharan Africa based on nominal GDP: Nigeria, South Africa, Kenya, Ethiopia, and Ghana [11]. These countries record high levels of economic activity due to their vast natural resources. For instance, Nigeria has the highest natural gas reserves and the second highest crude oil reserves in Africa. South Africa by far has the highest coal reserves in Africa. Ghana has the highest gold and timber reserves in the continent, while Kenya and Ethiopia have the highest installed renewable energy capacity in the continent as well. Overall, they contribute a large proportion of all CO2 emissions from the region and shape the dynamics of the renewable energy industry in the region; thus, the rationale for choosing them as cases for this study. Ref. [12] corroborate this by asserting that the gas flaring within the Nigerian oil and gas industry contributes strongly to Africa’s overall CO2 emissions. Given the increasing levels of CO2 emissions in sub-Saharan Africa by these countries due to their energy consumption patterns, one would expect that many studies contributing to the energy-growth environmental discourse in the last 5 years have examined the significance of renewable energy consumption in reducing carbon emissions in sub-Saharan Africa. However, many of the existing studies [13,14,15] have, at best, described the evolution of renewable energy consumption and CO2 emissions in Africa. Thus, the extent of RE contributions to sustainability remains vague.
Overall, studies in the extant literature have reported varying and somewhat conflicting findings on the relationships among energy consumption, financial development, CO2 emissions, and economic growth. Several studies also ignored the challenge of cross-sectional dependence, despite countries in the panel being most probably heterogeneous and cross-sectionally dependent.
A larger proportion of the existing studies emphasized energy consumption more, without disaggregating the discussion in line with energy sources (i.e., fossil-based energy consumption or renewable energy consumption). This leaves a gap in understanding how renewable energy consumption affects CO2 emission in both the short run and long run in sub-Saharan Africa. Also, the types of relationships existing among energy consumption, economic growth, financial development, and CO2 emissions in the context of sub-Saharan Africa are rarely investigated.
This study, therefore, explores the short-run and long-run relationships among economic growth, financial development, renewable energy consumption, and CO2 emissions in sub-Saharan Africa and empirically investigates the causality between economic growth, renewable energy consumption, carbon dioxide emissions, and financial development. This study considers the heterogeneity of case-study countries, given that the few panel studies within the extant literature mostly ignored the issue of cross-sectional dependence. This is despite the fact that nations in the panel are most probably heterogeneous and cross-sectionally dependent.
This research adds to knowledge in at least two ways: (i) homing in on the five largest economies in sub-Saharan Africa and discussing workable ways of improving environmental sustainability in the region, and (ii) contributing with an in-depth multiple econometric approaches-based analysis of the short-run and long-run linkages existing among these variables and the robustness of the relationships.
Subsequent sections of the paper include a literature review, model and methods, results, discussion and conclusions, policy implications, and policy recommendations.
2. Literature Review
2.1. Theoretical Model of Economic Growth and Carbon Dioxide Emissions
Research on the short-run and long-run connections between energy or electricity consumption, economic growth, financial development, and CO2 emissions abound in the literature. While some of them are panel data analysis, others adopt time-series data. Few are even qualitative studies. These studies also have wide regional representations and varying outcomes—sometimes, outright conflicting results—about the relationship between economic growth and carbon dioxide emissions. These variations in findings have commonly been referred to as growth–CO2 hypotheses. One of the most notable works in economic growth–CO2 emissions literature is the environmental Kuznets curve (EKC), named after the Economics Nobel Laureate Simon Kuznets [16], who hypothesized that the relationship between the level of income and a measure of inequality in the distribution of income is an inverted U-shaped curve. However, the concept of EKC was fully developed in the 1990s by [17,18,19,20].
A bell-shaped relationship between inequality (proxied by the Gini index) and economic growth is explained by the EKC, which—as [21] also opine—is a hypothesized relationship between several parameters of per capita income and environmental degradation [22]. The effective association of environmental degradation with Kuznet’s work was made by [17,18,19], who also argued that the inverted U-shaped relationship between environmental degradation and economic growth could be explained under three distinct channels: composition effect, scale effect, and technique effect. Based on the composition effect, economic growth has a positive effect on the environment, thus decreasing carbon dioxide emissions. Other things remaining constant, at the early stages of a country’s economic development, environmental pollution increases, as the economic structure is mainly built around agricultural production and more resource-intensive heavy manufacturing industries. However, later stages of economic development are heralded by a decrease in pollution as the structure moves toward service and light manufacturing industries. For the scale effect, economic growth leads to a negative impact on the environment because increased production will lead to increased pollution or emissions and environmental degradation. Finally, the technique effect argues that economic growth is usually characterized by the replacement of old and dirty technologies with cleaner ones that enhance the quality of the environment [22]. Thus [21], basing his argument on the EKC, opines that the negative impacts of scale effects on the environment seem to be the major influence in the early stages of economic growth, while the positive impacts of composition and technique effects tend to reduce emission levels prevalent in the later stages of an economy.
We adopt the EKC as the theoretical model in this study because of its increasing importance and prediction that economic growth may be very crucial in solving the environmental problems of the future in the presence or absence of sound policy interventions [21].
2.2. Empirical Evidence on Economic Growth, Renewable Energy Consumption, Financial Development, and Carbon Dioxide Emissions
Ref. [22] investigated the effects of financial development, economic growth, and electricity consumption on CO2 emissions in Kuwait, employing the autoregressive distributed lag (ARDL) bounds testing approach and the VECM Granger causality analysis. Their findings indicate that both short-run and long-run connections exist among the series. Additionally, the study reveals a unidirectional causality from economic growth and electricity consumption to CO2 emissions and argues that increased deployment of renewable energy will reduce carbon emissions in Kuwait. Similar findings by [23] for the Turkish economy reveal that economic growth, financial development, and urbanization significantly and positively affect CO2 emissions. The study also suggests that renewable energy consumption could reduce CO2 emissions in the country if intensified. Again, their findings support the EKC hypothesis in Turkey.
A similar study by [24] buttresses the argument that in the long run, the major determinants of CO2 emissions in Turkey are trade openness, energy consumption, financial development, and economic growth. Their study further validates the EKC hypothesis in the country and suggests a long-run unidirectional causal relationship from financial development, energy consumption, economic growth, and trade openness to CO2 emissions. These findings on the Turkish economy are consistent with [25], who investigated the moderating role of economic growth and renewable energy consumption on CO2 emissions. Ref. [26] adopted a nonlinear and asymmetric analysis to investigate the linkages between energy use, financial development, CO2 emissions, and economic growth in Saudi Arabia. Their findings show that both positive and negative shocks in economic growth increase emissions in the long run. Further, both negative shocks in financial development and positive shocks in energy consumption raise the CO2 emissions level in the long run. In the short run, their study also suggests that increasing economic growth is positively related to environmental pollution, while any reduction in economic growth would improve environmental quality.
According to [25], economic growth increases CO2 emissions in Pakistan, while renewable energy consumption decreases it. Additionally, their study does not provide support for the EKC hypothesis. Ref. [27] agree that economic growth positively impacts CO2 emissions in Pakistan but consider energy consumption as a whole (mostly coal, oil, and gas consumption) to be capable of increasing CO2 emissions in Pakistan as well. Ref. [28] suggest the promotion of renewable energy sources for energy in Pakistan.
A study by [29] on the Pakistani economy from 1990 to 2017 suggests a significant long-run positive interconnection between CO2 emissions and gross domestic product (GDP) per capita. Their findings also indicate that energy use, fossil fuel energy consumption, and renewable energy consumption have negative effects on GDP per capita. While their distinction of renewable energy consumption and fossil fuel energy consumption is essential in explaining the energy consumption pattern that drives the economy the most, they failed to clearly explain why energy use is also categorized separately. They also argue that the effects of the series on GDP per capita are more significant in the long run than in the short run.
Ref. [10] explore the connection between energy consumption, financial development, CO2 emissions, and economic growth in China from 1982 to 2017. The research applies the VECM and the innovative accounting approach (IAA). Their findings reveal a long-run connection between the four series. The study findings also indicate that energy consumption and financial development are significantly and positively related to CO2 emissions, while economic growth increase could reduce CO2 emissions in the long run. Ref. [30] also find a long-run connection between financial development, economic growth, and renewable energy consumption in India. Their DOLS estimation results further show that economic growth and financial development have significant positive effects on renewable energy consumption. Additionally, they argue that a bidirectional causal relationship exists between economic growth and renewable energy consumption in India. For Indonesia, Ref. [31] report that primary energy consumption, the growth rate of population, and economic growth increase CO2 emissions, while renewable energy consumption reduces it.
Ref. [32] investigated the drivers of CO2 emission in Tunisia using the ARDL bounds test, FMOLS, variance decomposition analysis, and principal component analysis. Their findings reveal that the interaction of financial development and urbanization reduces CO2 emissions. The study also indicates that electricity consumption, primary energy use, and fossil fuel consumption positively affect CO2 emissions, while electricity production from natural gas and flammable renewables and waste negatively impact CO2 emissions. Ref. [33] also examined the link between CO2 emissions, ICT, financial development, total factor productivity, energy consumption, and trade in Tunisia using the ARDL from 1975 to 2014. Their findings, like [32], reveal that energy consumption positively impacts CO2 emissions. Additionally, they report trade and financial development to impact negatively on the environment, while ICT has no significant effect on CO2 emissions in the north African country. Still, in Africa, Ref. [1] find similar evidence in their study of financial development and CO2 emissions in Nigeria. Their findings indicate that financial development energy consumption and economic growth positively and significantly influence CO2 emissions in the country. They further find a long-run interconnection among all the variables from 1971 to 2011, using the ARDL bound testing econometric approach. Similarly, Ref. [34] reports a unidirectional causal link from energy use to economic growth in South Africa, but also believes that at increased levels of economic development, energy consumption becomes less intensive in the country.
A global study of the relationship between CO2 emissions, financial development, and renewable energy consumption was conducted by [27]. With a sample of 192 countries and panel quartile regression technique, the results suggest that renewable energy consumption negatively affects CO2 emissions, while financial development positively affects them. Additionally, they believe that a positive relationship exists between financial development and renewable energy consumption and that CO2 emissions reduce renewable energy consumption, a potentially contestable submission. CO2 emissions and the attendant negative impacts on the environment can be a motivating factor for the increased deployment of renewable energy, which, over time, begins to crowd out fossil fuel usage, which arguably causes the bulk of CO2 emissions. A similar study of a panel of 122 countries by [35] explored the impacts of energy consumption, economic growth, and financial development on carbon emissions. Their research opines that financial development and economic growth reduce CO2 emissions in developed countries within the sample, but increase the same in middle- and low-income countries. The study further reveals that energy consumption increases CO2 emissions in the full sample.
In a study of the next 11 (N-11) countries, Ref. [36] examine the nexus between carbon emissions, renewable energy consumption, and financial development. Their findings suggest that financial development and carbon emissions are positively related, both of which could propel economic growth forward. In contrast, their study reveals a negative connection between carbon emissions and renewable energy consumption, implying that more utilization of renewable energy means fewer emissions and a movement towards achieving the objectives of the Paris Agreement. A similar study for the South Asian region by [37] argues that globalization contributes positively to CO2 emissions. Adopting a fully modified ordinary least squares (FMOLS) estimation technique, the research also indicates a positive interconnection between nonrenewable energy consumption and environmental pollution, thus confirming the environmental Kuznets curve (EKC) hypothesis for the region for the period 1985–2018. Ref. [38] investigated the effects of financial development, economic growth, urbanization, and renewable energy on pollution in a sample of 23 European countries from 1990 to 2013. The panel data estimates and Pedroni cointegration results reveal a long-run interconnection between the variables. Also, the findings indicate that economic growth, financial development, and urbanization increase CO2 emissions in these countries.
In the Gulf Cooperation Council (GCC) countries also, Ref. [39] believe that economic growth and electricity consumption are positively related to CO2 emissions in the long run. Their findings also indicate a two-way causal link between economic growth and CO2 emissions and a unidirectional causal relationship from electricity consumption to economic growth. Additionally, their findings reveal no causal link between CO2 emissions and financial development. Ref. [40] add that the most dominant energy–growth relationship in GCC countries supports the feedback hypothesis, i.e., a bidirectional causal link between energy consumption and economic growth. Ref. [41] examined the causality and long-run connection between economic growth, CO2 emissions, nonrenewable and renewable energy consumption, and financial liberalization in a panel of the Commonwealth of Independent States (CIS) region from 1992 to 2015. Their findings suggest a bidirectional long-run connection between all the series in all the member countries under CIS, save for the renewable energy consumption–economic growth nexus.
Additional findings reveal a unidirectional short-run causal relationship from financial openness and economic growth to CO2 emissions, and from nonrenewable energy consumption to renewable energy consumption. For the 12 Middle East and north Africa (MENA) countries from 1980 to 2012, Ref. [42] find a bidirectional causality between economic growth, CO2 emissions, and renewable energy consumption. The study also shows that while economic growth could degrade the environment, renewable energy consumption reduces CO2 emissions. Another study [43] of 24 countries in the MENA region using the panel vector autoregressive model (PVAR), impulse response function, and variance decomposition analysis suggests that renewable energy consumption and financial development have only mild impacts on economic growth and CO2 emissions. The study further argues that financial markets and the renewable energy sector in the region are still nascent in having sizeable impacts on economic growth and environmental quality improvements.
Ref. [44] finds a long-run relationship between information and communication technology (ICT), financial development, energy consumption, CO2 emissions, and economic growth in 12 Asian nations from 1993 to 2013. The study further argues that while economic growth and energy consumption have significant positive impacts on CO2 emissions in these countries, ICT impacts CO2 emissions negatively. Not least, there is unidirectional causality from financial development, economic growth, and energy consumption to CO2 emissions. Ref. [5] also explored the effects of renewable energy consumption and economic growth on CO2 emissions in 25 developing countries drawn from Africa (mainly), Europe, Asia, and the Americas. The study, which applies two-panel cointegrating regressions (DOLS and FMOLS) and Granger causality tests, suggests a long-run bidirectional causal relationship between CO2 emissions, renewable energy consumption, and economic growth. Additionally, the findings suggest a significant positive relationship between economic growth and CO2 emissions and that a rise in the size of renewable energy consumption reduces CO2 emissions in these countries.
A study of 25 African countries from 1985 to 2015 adopting the Granger causality test and pooled mean group (PMG) approach by [45] reveals that increased renewable energy consumption reduces CO2 emissions. Their findings further confirm the EKC hypothesis in Africa and bidirectional causality between CO2 emissions, financial development, and economic growth. Ref. [46] studied 34 emerging economies in sub-Saharan Africa to explore the connection between urbanization, economic growth, fossil fuel consumption, environmental pollution, and renewable energy consumption. The study, which adopts the system generalized method of moment (GMM), submits that urbanization and fossil fuel consumption increase CO2 emissions significantly and stimulate pollution in sub-Saharan Africa. The study further argues that EKC applies in the subregion and that increased renewable energy deployment decreases CO2 emissions, thus enhancing air quality. A similar study [47] with a sample of 19 African countries suggests that while nonrenewable energy consumption encourages CO2 emissions, renewable energy consumption reduces it. Their findings further indicate a unidirectional causal relationship from nonrenewable and renewable energy consumption to CO2 emissions. These findings by [47] are somewhat contradictory to [48], who argue that both renewable and nonrenewable energy increase CO2 emissions in 28 sub-Saharan African countries in the short run in their study covering 1980 to 2014. On another dimension, Ref. [49] suggests that energy consumption is crucial in promoting economic growth and financial development in sub-Saharan African countries. Table 1 below summarizes the demographics of the reviewed studies while highlighting their core attributes.

Table 1.
Summary of reviewed literature.
The review of literature overall shows that in-depth research has been conducted on the effects of financial development, energy consumption, and economic growth on CO2 emissions. While there are varying findings to some degree, a larger number of these studies found that these variables led to an increase in CO2 emissions in both the short run and long run. Despite the extensiveness of the extant literature, however, very few of these studies focused on how these relationships play out in the African context, on either an individual country basis or panel study basis. This suggests that more research in this area is needed for sub-Saharan Africa specifically, and Africa in general. Furthermore, most of the reviewed studies focused on energy consumption in its entirety, with little or no attention to the share of renewable energy in this consumption or the sources of the energy consumed. Indeed, some of the countries’ energy consumption is solely based on fossil fuels. This leaves a gap in understanding how renewable energy consumption, on its own, affects CO2 emissions in sub-Saharan Africa and beyond. Hence, the contributions of this study are hinged on making up for the loopholes in the literature discussed here. Another major flaw noticed in the few panel studies within the extant literature is that they mostly ignored the issue of cross-sectional dependence, despite nations in the panel being most probably heterogeneous and cross-sectionally dependent.
3. Materials and Methods
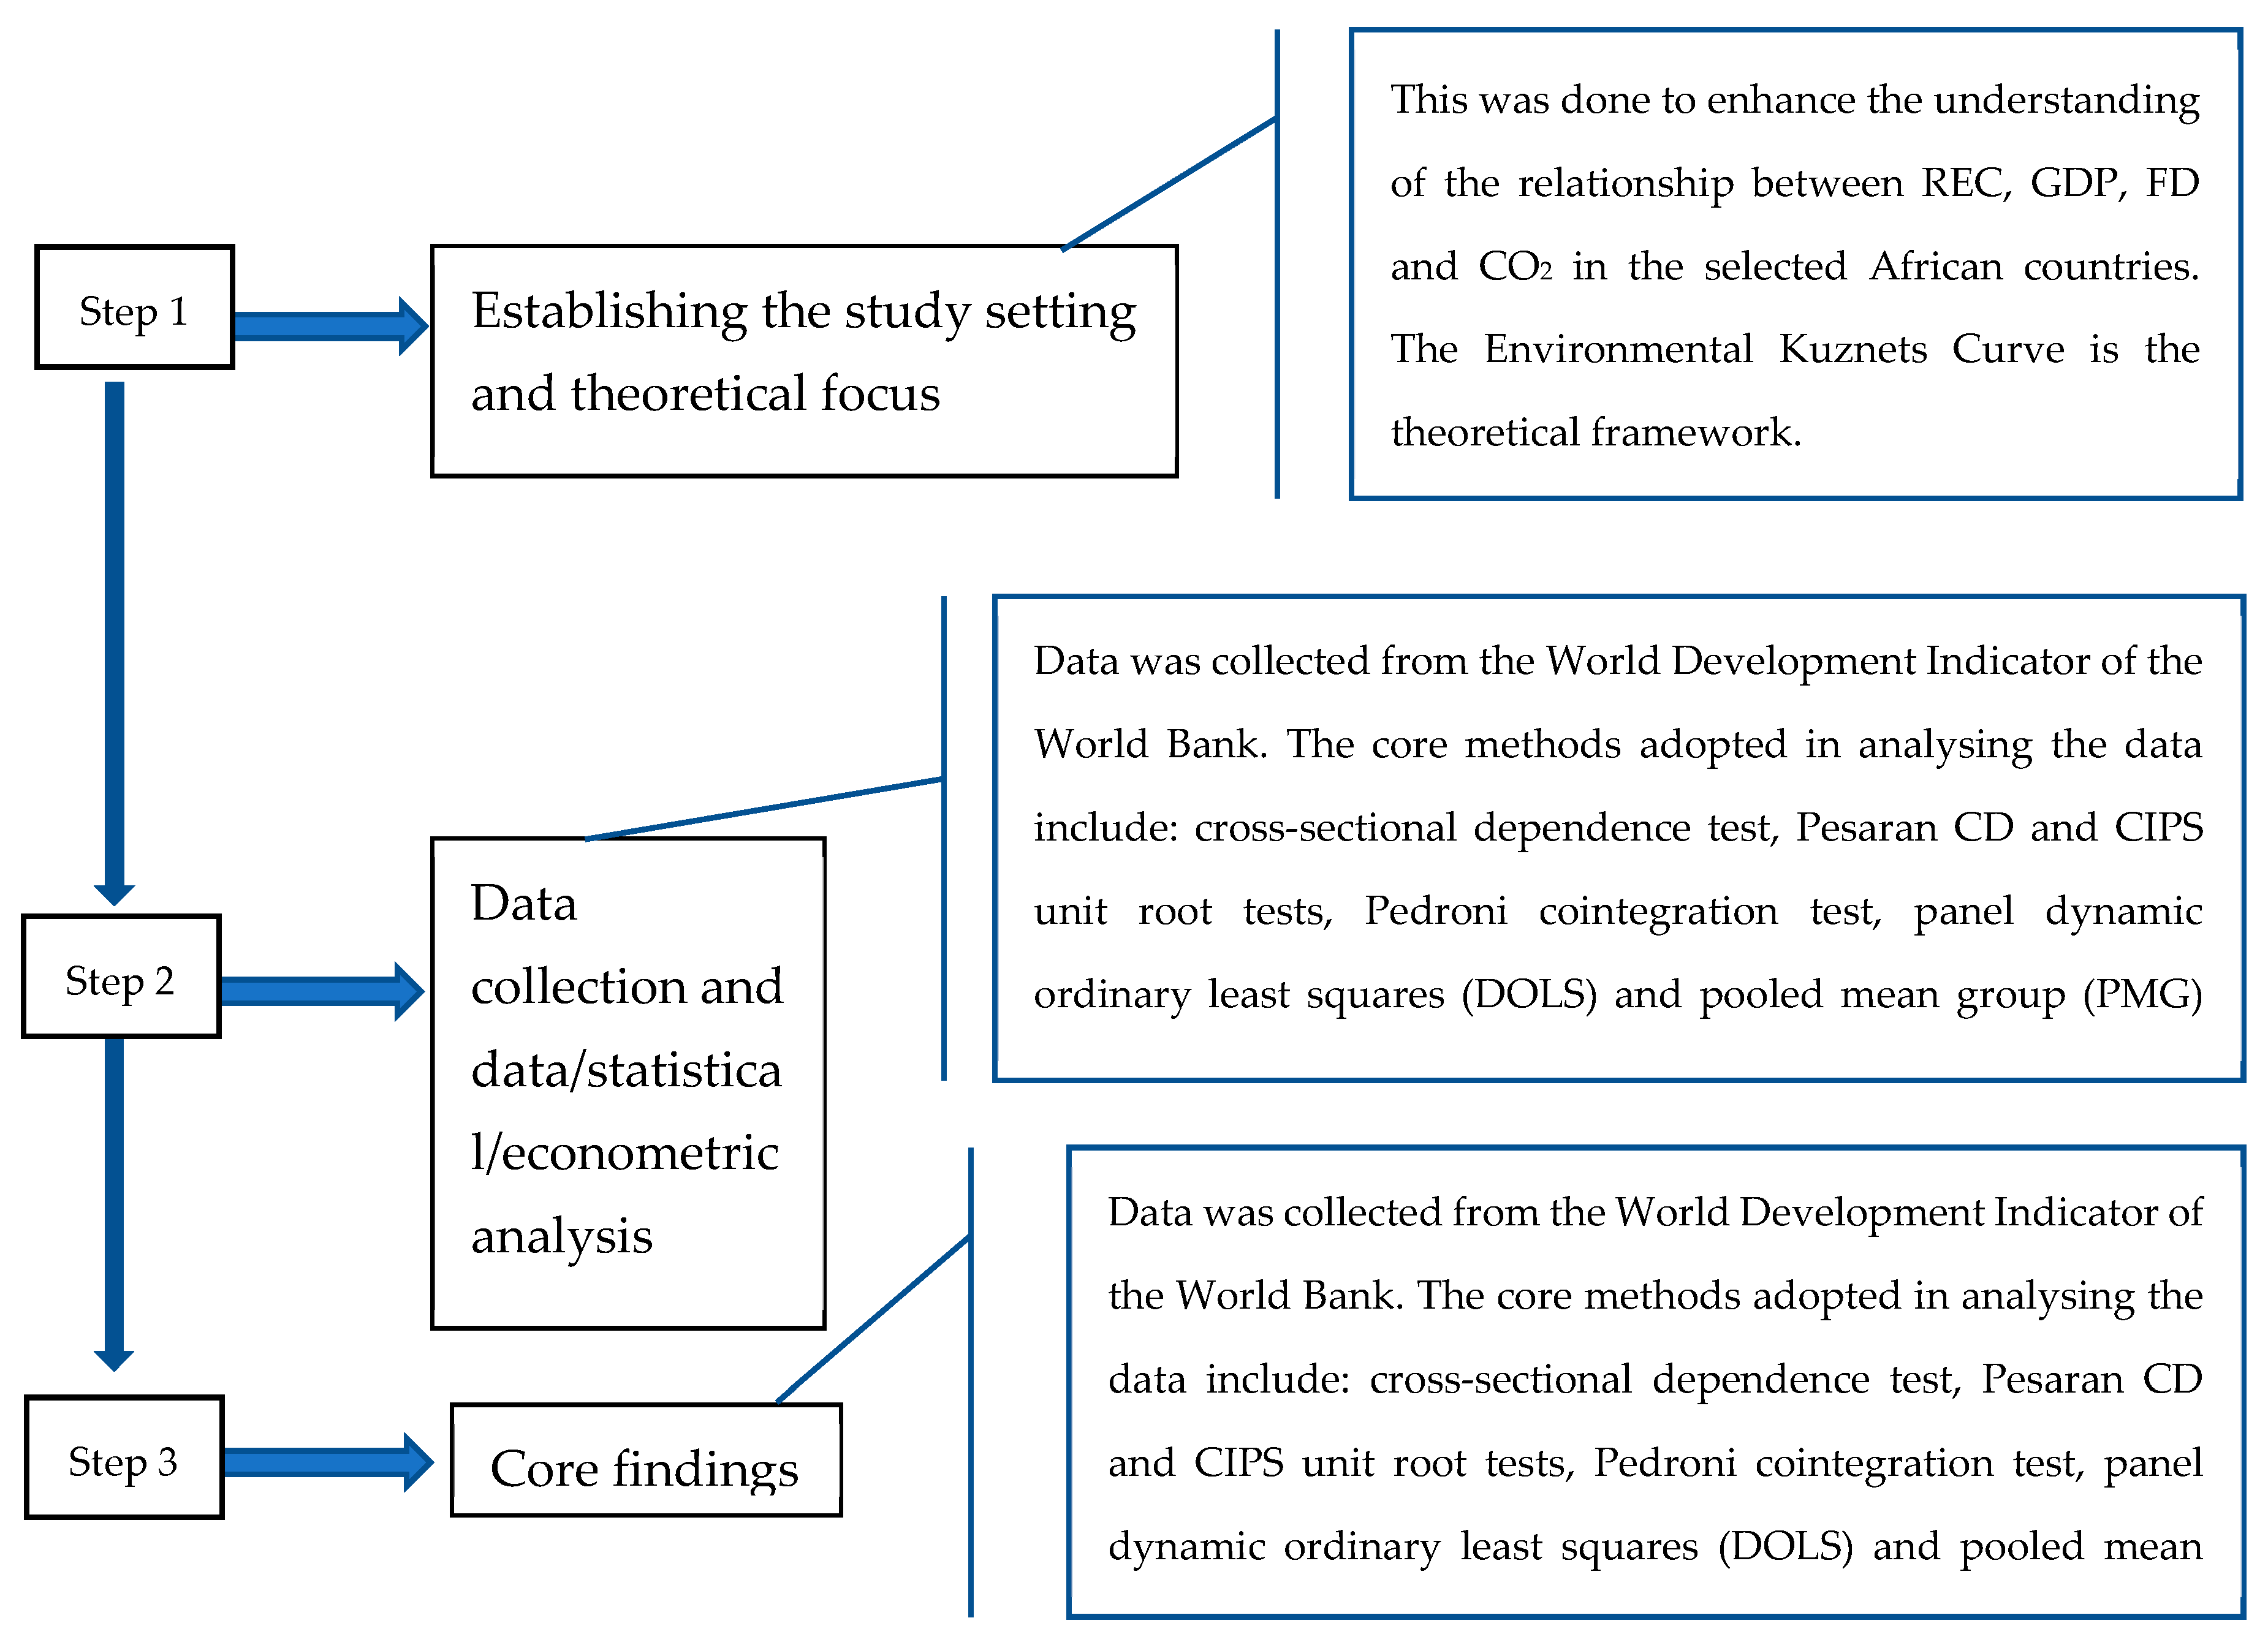
This study sought to investigate the relationship between economic growth, renewable energy consumption, financial development, and carbon dioxide emissions in selected sub-Saharan African countries: Nigeria, South Africa, Kenya, Ethiopia, and Ghana. For a better structural view of this study as we progress to the analysis, Figure 1 describes the steps and methods used in the study.
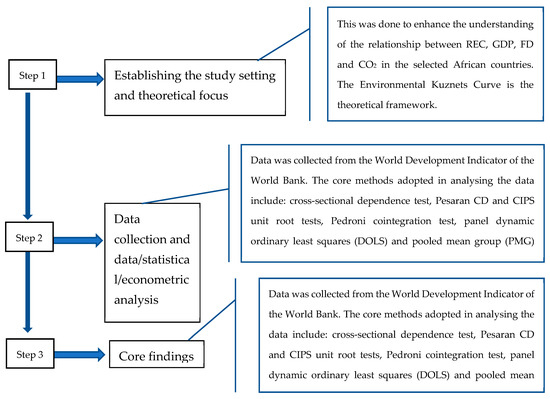
Figure 1.
Key steps of the study.
The EKC hypothesis forms our theoretical framework, and thus we begin with the general functional model:
where E represents the environmental indicator and Y2 represents income. Z covers all other economic and noneconomic explanatory variables that may impact the environment, such as financial development and renewable energy consumption. To address the objective of this study, we adopt carbon dioxide emissions (CN), presented in natural logarithmic form, as our environmental indicator and include renewable energy consumption (REC) and financial development (FD) to understand how they impact carbon dioxide emissions and hence environmental quality. Income (Y) is referred to as per capita GDP in this study. Note that the EKC hypothesis is captured by the income variable in its quadratic form, i.e., Y2.
Therefore, the estimated econometric model is given as:
where α1 represents the change in CO2 emissions concerning a percentage change in renewable energy consumption, and an inverse relationship is expected between them a priori, given the evidence in the literature, and α2 represents the elasticity measures of CO2 emissions (CN) given the value of per capita GDP, as a positive connection is also expected between per capita GDP and CO2 emissions. Financial development (FD) is also expected to positively affect CO2 emissions, given the vast evidence supporting it.
Again, this research is structured in line with Salahuddin [40], who investigated renewable energy consumption and carbon dioxide emissions in the Gulf Cooperation Council (GCC) nations. However, the emphasis here is on the five sub-Saharan African nations mentioned above with the largest nominal GDP. To estimate the model stated in Equation (2), accompanying econometric tests were taken:
- (a)
- cross-sectional dependence (CD) test, to explore if a connection (or cross-sectional dependence) in residuals exists across panel
- (b)
- with cross-sectional dependence established across the panel, the Pesaran board unit root test is conducted to find out the order of integration of the variables
- (c)
- The Pedroni cointegration test to confirm the existence or absence of a long-run relationship among the series
- (d)
- a panel DOLS estimation to quantify the long-run and short-run relationships among the parameters
- (e)
- pooled mean group (PMG) estimates to gauge both long-run and short-run linkages among the variables of the study
- (f)
- a VECM Granger causality test to investigate the presence or absence of causality among variables, and lastly
- (g)
- a check of the statistical behavior of the causal directions utilizing the innovation accounting approach (IAA), which consists of impulse response functions and variance decomposition estimation.
The choice of the highlighted econometric methods is informed by the nature of the study, i.e., panel data analysis involving five sub-Saharan African countries. The pre-diagnostic tests, DOLS and PMG estimations, and the post-diagnostic tests best mirror the overall behavior of the variables of study in both the long run and short run. The variables of interest for this study were sourced from the [50] database, and they are named below:
- -
- Per capita CO2 emissions (CN) (i.e., CO2 emission per capita, mainly a function of their nonrenewable energy consumption)
- -
- Renewable energy consumption (REC)
- -
- Per capita real gross domestic product GDP (Y)
- -
- Financial development (FD), defined as the volume of domestic credit available to the private sector—see [39,51]
REC is measured as a proportion (%) of total final energy consumption. CN was derived from the ratio of total CO2 emissions and the total population of the countries under consideration. Y is calculated at constant 2010 US$, while FD is quantified as a proportion of gross domestic product (GDP). The choice of variables aligns with the ongoing global debates on fossil fuel consumption vis-à-vis alternative renewable energy consumption. Thus, the variable CN subtly portrays fossil fuel consumption from an environmental perspective. REC mirrors the clean energy industry, which is argued to support a modern economy. FD and GDP are chosen to reflect the microeconomic and macroeconomic dynamics of the renewable and nonrenewable energy debates.
It is pertinent to highlight here that EKC has faced strong criticism in the last decade by Wagner and others [50,52,53], especially regarding its empirical formulation. Their core argument is that working with integrated and cointegrated time series, which are nonlinearly transformed (logarithmic and quadratic), leads to nonlinear cointegration. This, by extension, influences the unit root tests, cointegration, and CD performed. Thus, like many other economic hypotheses, EKC to date is still subject to key drawbacks at both the theoretical and econometric level [54]. However, these flaws barely erode its merits, which are at the core of its adoption. Such flaws also open up more opportunities for further research and better modification of the hypotheses [55].
4. Results
4.1. Descriptive Statistics
The descriptive statistics reveal the general behavior of the variables of study using such indicators as the mean, median mode, standard deviation, and others. These are also referred to as summary statistics and are presented in Table 2.
Table 2.
Descriptive statistics of the variables.
The descriptive statistics reported in Table 2 reveal that the mean values of renewable energy consumption and carbon emissions are 63.69 and −7.39, respectively, while their standard deviations are 28.40 and 1.50, respectively. The standard deviations explain the homogeneity of the data, while the Jarque–Bera values show that the skewness and the kurtosis of the data match a normal distribution.
4.2. Unit Roots Test
Determining the stationariness of macroeconomic variables before panel and time-series estimations is crucial to achieving a valid research outcome. This is also referred to as verifying the order of integration of the variables. To achieve this aim, therefore, a unit root test is usually conducted. For a study that comprises five countries from sub-Saharan Africa, we expect the existence of cross-sectional dependence among the series, since these countries possess similar economic characteristics, given their regional proximities. The presence or absence of this cross-sectional dependence or contemporaneous correlation of residuals across the panel is thus examined using a cross-sectional dependence (CD) test formulated by [56], who described the cross-sectional dependence statistic as
where
and represents the pair-wise cross-sectional correlation coefficients of residuals from the normal augmented Dickey–Fuller (ADF) regression. N and T represent the panel sizes and sample, respectively. The null hypothesis of no cross-section dependence (correlation) in residuals is stated. We reject this null hypothesis if the probability of the Pesaran CD test is less than 0.05.
To address the cross-sectional dependence across the panel, the cross-sectional ADF (CADF) regression is employed, represented mathematically [39] as
where
depicts the cross-sectional mean of yit. The inclusion of the cross-sectional mean in the equation above is justified as it addresses the problem of contemporaneous correlation among y_it. This represents the adjusted version of the IPS test [57] and is called the cross-sectionally augmented IPS (CIPS) test [55]. The null hypothesis supports a homogenous non-stationarity of the coefficients, i.e., λ_i = 0 for all i. [58] suggests a test statistic for CIPS given as
where t_i (N, T) represents the t statistic of λi in Equation (3).
Table 3 presents the results of the cross-sectional dependence (CD) test in the panel, which helps us ascertain the presence or absence of cross-sectional dependence across the panel.
Table 3.
Cross-sectional dependence (CD) test results.
The probability value of the Pesaran CD test statistic in Table 2 is less than 0.05, implying that we reject the null hypothesis of no cross-section dependence or correlation in the residuals across the panel.
The CIPS unit root test, which corrects for the presence of cross-sectional dependence, is presented in Table 3.
From Table 3, all the variables of study are integrated at order zero, i.e., I(0) under the CIPS unit root test. To further ascertain the appropriateness of the variables, we conduct the Pedroni panel cointegration test.
4.3. Panel Cointegration Test
Our results in Table 2 suggest the presence of cross-sectional dependence among the error terms of the panel, while Table 3 reveals that no variables have unit roots at level, i.e., I(0). Here, we carry out the panel cointegration test supported by [59,60]. The Pedroni panel cointegration test is justified for this study, as it addresses the problem of heterogeneity while controlling for country sizes. This enables many exogenous variables of the cointegration vector to change across several panel sections [39,60]. In this panel cointegration test also, eleven cointegration statistics for eleven tests are obtained, with eight as within-dimension tests and three as between-dimension or group statistics tests. Table 4 and Table 5 summarize the CIPS unit root and the Pedroni panel cointegration tests for this study.
Table 4.
CIPS unit root test results.
Table 5.
Pedroni panel cointegration test.
Results from Table 4 show that eight of the eleven tests do not accept the null hypothesis of no cointegration. This further suggests the presence of a long-run cointegration among the variables of the study.
Again, the Kao residual cointegration test (presented in Appendix A), which controls for both heteroscedasticity and autocorrelation in the mode, shows that the variables are cointegrated, as the p-value of the ADF is less than 0.05.
4.4. Dynamic Ordinary Least Squares (DOLS) Estimation
Given that a long-run cointegration exists among the variables, we proceed to measure the long-run parameters. The panel cointegration regression adopted for this purpose in this study is the panel dynamic ordinary least squares (DOLS) technique, which seems to provide better estimates for cointegrated panels, such as the variables of the study.
Table 6 presents the DOLS results.
Table 6.
Results of the panel dynamic ordinary least squares (DOLS) estimates.
The DOLS estimates presented in Table 6 suggest a significant negative connection between CO2 emissions and renewable energy consumption, in line with a priori expectation. A unit increase in renewable energy consumption leads to an approximated 10.8% reduction in CO2 emissions, other things remaining constant. Economic growth demonstrates a significant positive elasticity with CO2 emissions, as expected, while financial development is not significantly related to CO2 emissions in the sub-Saharan African countries under study.
4.5. Pooled Mean Group Estimation
The panel dynamic ordinary least squares (DOLS) estimation technique is often criticized for not being able to estimate short-run relationships [61]. Thus, we select an alternative method—the pooled mean group (PMG) analysis [62]—which considers varying levels of heterogeneity across countries and estimates both the long-run and the short-run impacts concurrently. It allows the short-term coefficients to differ between groups while maintaining equality of the long-term coefficients between groups. Table 6 presents the results of the PMG regression for the long run and short run.
Table 7 provides the results of the pooled mean group measurement. The long-run coefficient of CO2 emission compared to renewable energy consumption is negative and statistically significant, as expected. Thus, a 1% rise in renewable energy consumption as a percentage of total final energy consumption will reduce CO2 emissions by 0.00013%. Similar results for the long-run relationship between CO2 emissions and per capita economic growth suggest that a 1% rise in GDP per capita will increase CO2 emissions by about 0.00018%, in line with a priori expectation. Again, financial development has a significant negative relationship with CO2 emissions in the long run, against a priori expectation. The results further suggest no significant relationship between the variables and CO2 emissions in the short run.
Table 7.
Results from pooled mean group estimations.
The error-correction term in the estimation suggests that about 38.5% of the dynamics of CO2 emissions in the short run is attributable to the variations in renewable energy consumption, GDP per capita, and financial development. This further implies that CO2 emissions in the selected African countries have a high speed of adjustment to equilibrium after an error or a deviation from long-run equilibrium.
4.6. Panel Granger Causality Test
Here, we examine the presence or absence of causal relationships among the variables. Information on the nature or direction of causality assists in providing a more robust argument for policy significance of research outcomes [39]. Table 7 provides the statistical outcomes of the VECM Granger causality test.
The results in Table 8 suggest no causality between renewable energy consumption and CO2 emissions. Similarly, the findings reveal no causality between economic growth and CO2 emissions. There is no joint causality from renewable energy consumption and financial development to economic growth either.
Table 8.
Panel VECM Granger causality test.
4.7. Impulse Response and Variance Decomposition Techniques
A significant flaw of the VECM Granger causality test, also reported by [39], is its inability to produce true measures of the robustness of causality between variables outside study period. It is also criticized on the grounds that it only provides results on the direction of the association between the variables, ignoring the accompanying sign. To address these flaws, this study employs the innovation accounting approach (IAA), which comprises the Cholesky impulse response functions and variance decomposition test results. The Cholesky fractionalization impulse response analysis [63] is sensitive to the VECM order. Also, the impulse response functions show if innovation impacts have long-run or short-run implications, or if they are positive or negative. Despite the fact that the impulse response function can trace the effects of standard deviation shocks on the future and present values of the variables it fails to provide the extent of these effects. Hence, the variance decomposition technique is adopted to assess this immensity.
Ref. [62] described variance decomposition as the technique that calculates the proportional input of each innovation to h-step before the forecast error variance of the endogenous variable. It also highlights the significance of innovations in describing the changes in the endogenous variable.
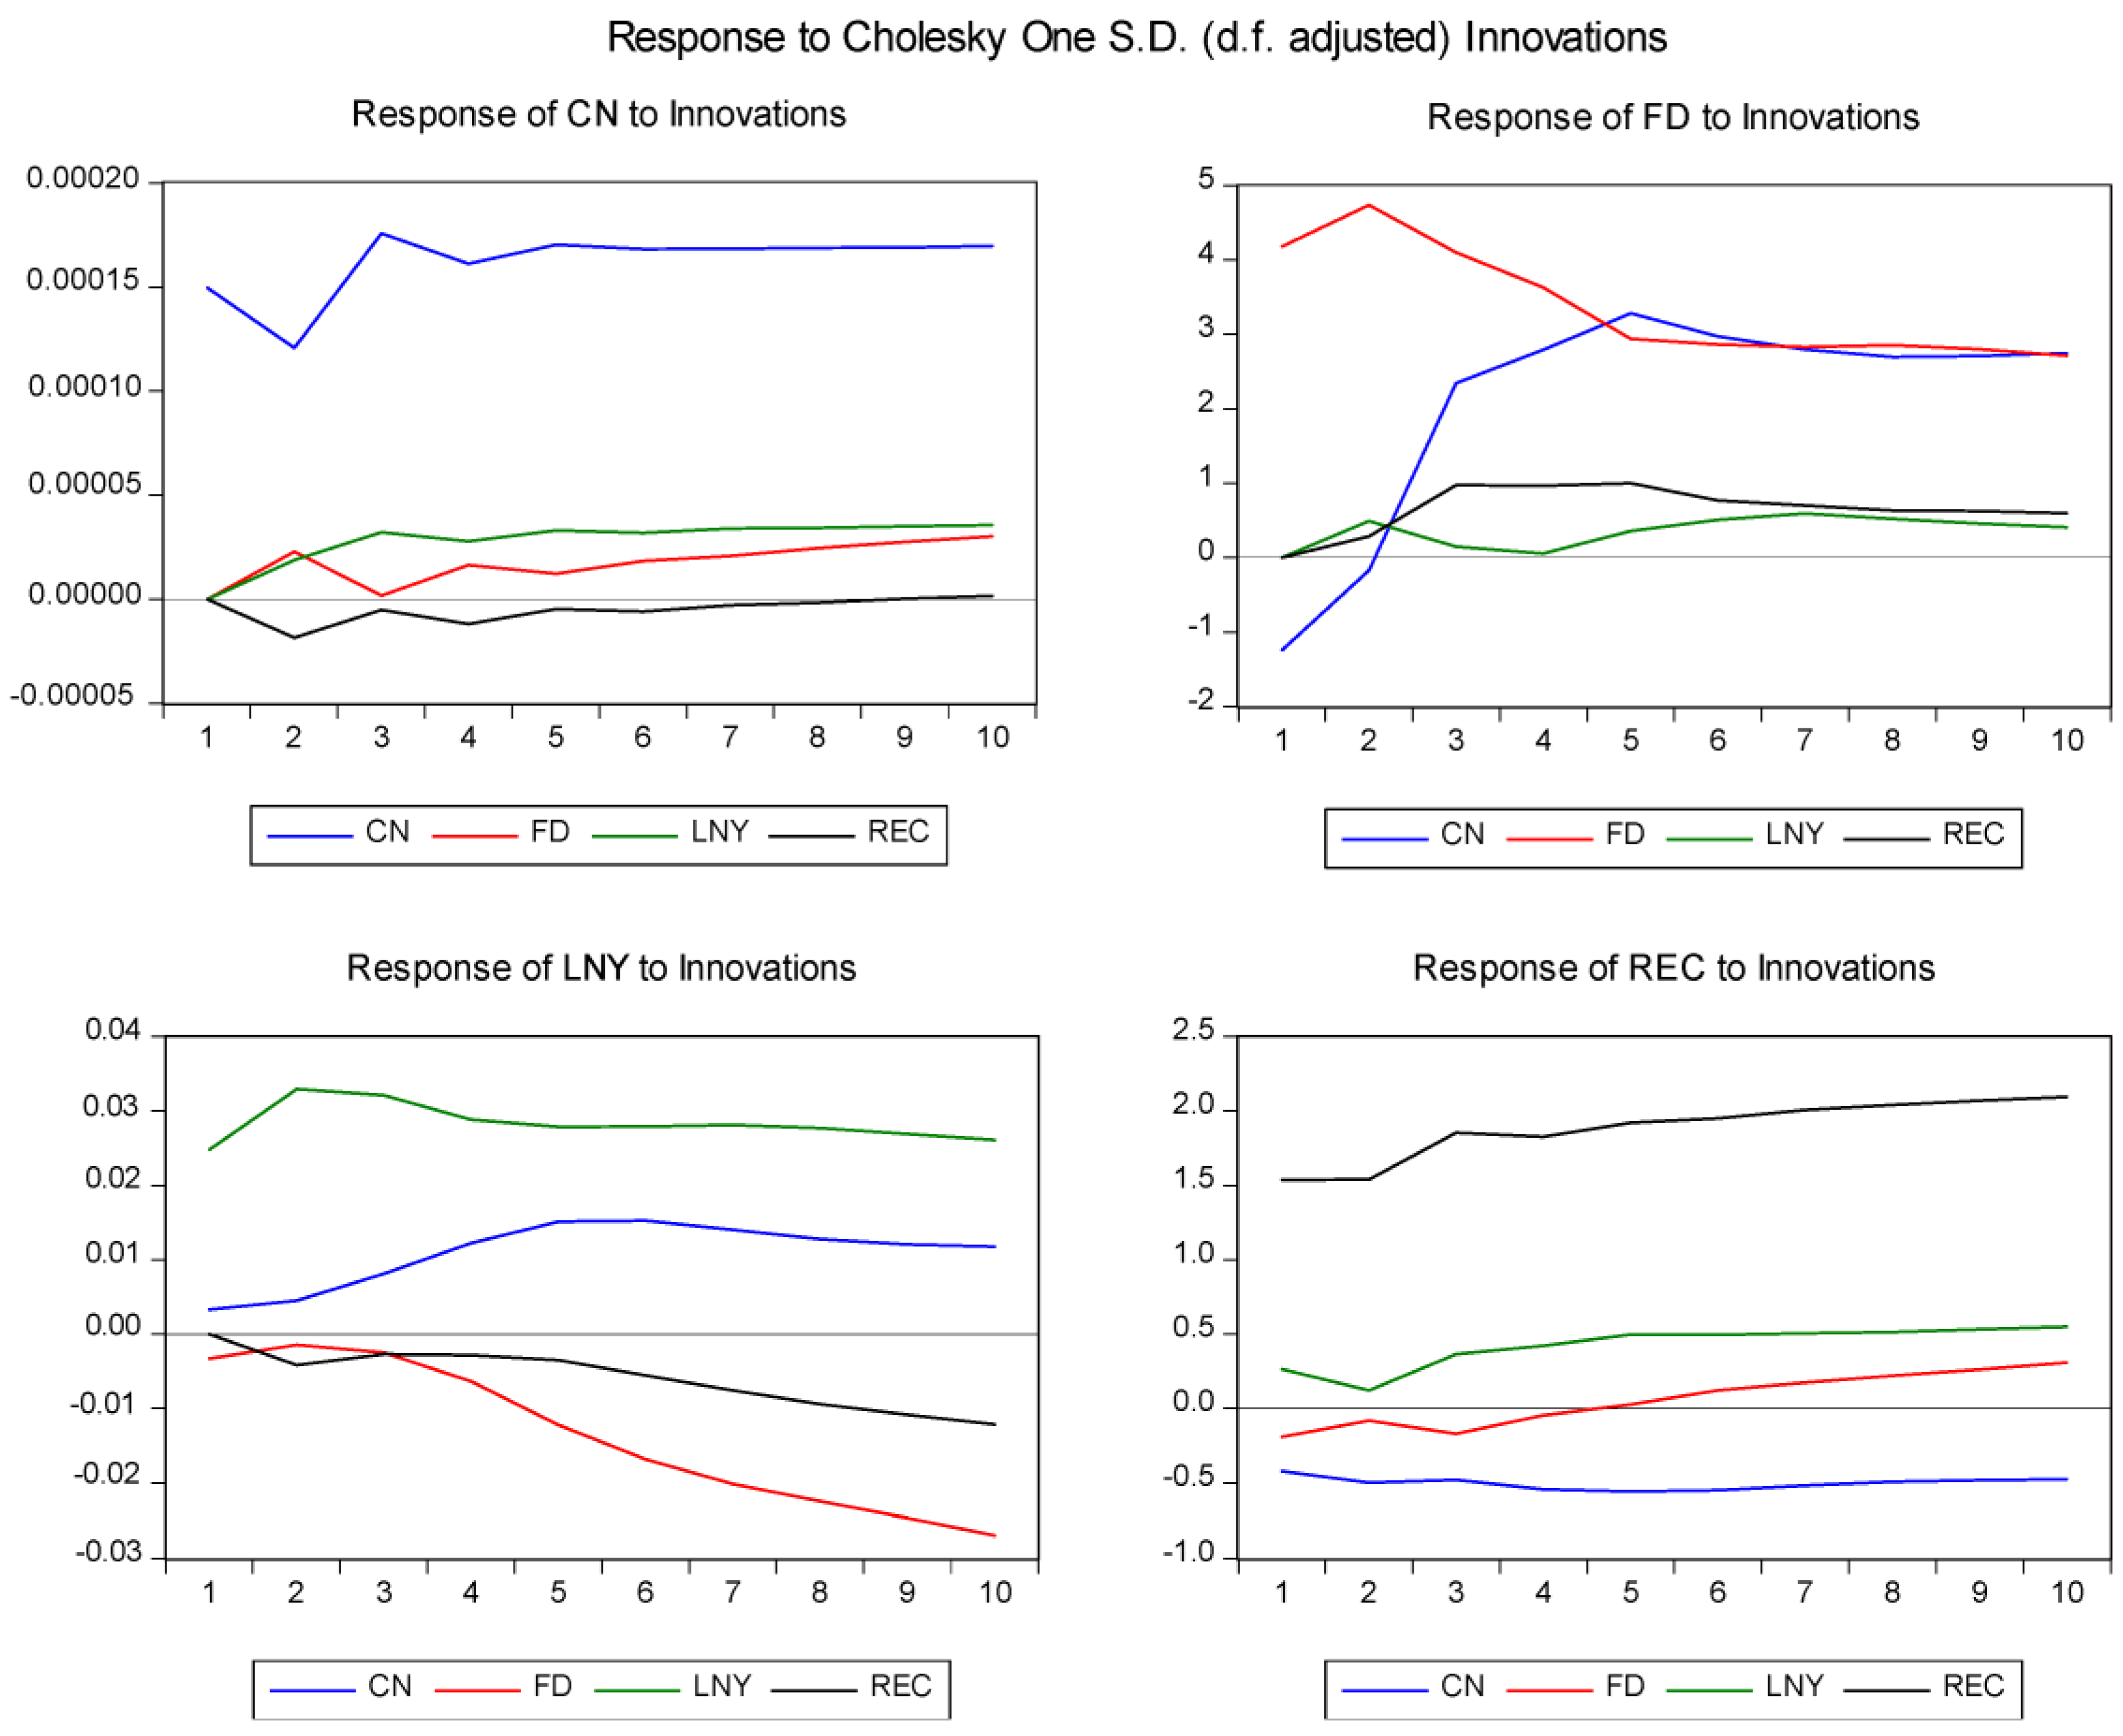
The impulse response graphs in Figure 2 reveal that the standard deviation of CO2 emissions per capita brings about a fairly fluctuating level of emissions in the near future (1 to 3 years) and a constant per capita CO2 emissions in the far future (4 years upwards). The response of CO2 emissions per capita to financial development and renewable energy consumption demonstrates a gradual increment in the future. Similar to the innovations in themselves, CO2 emissions remain constant in the future as a response to innovations in GDP per capita. On the other hand, renewable energy consumption increases in the future as a response to shocks in GDP per capita and financial development remains fairly constant as a response to innovations in CO2 emissions.
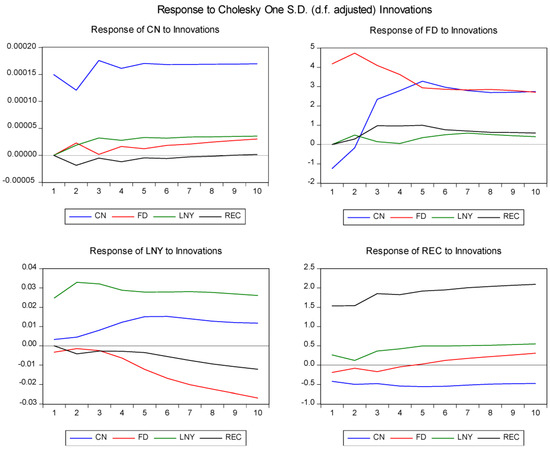
Figure 2.
Impulse response functions.
The outcomes of the variance decomposition tests are presented in Table 9.
Table 9.
Variance decomposition analysis for CO2 emissions.
The variance decomposition analysis results reveals that at the 5-year predicting ambit, about 96.3% of the one-step forecast variance in per capita CO2 emissions is explained by its shocks, while overall, 3.7% is explained by financial development, renewable energy consumption, and economic growth. In the long run, say 10-year forecasting period, the response of CO2 emissions to its innovations reduces, though insignificantly, to about 95.1%, while the response to innovations in financial development, renewable energy consumption, and per capita economic growth is expected to rise to 4.9%. Among this 4.9% of the variance, 3.3% is attributed to innovations in per capita economic growth, 1.4% is due to innovations in financial development, and a mere 0.2% is due to innovations in renewable energy consumption. These findings emphasize that the largest proportion of changes expected of CO2 in the future will be generated by itself. The forecast impacts of financial development, per capita economic growth, and especially renewable energy consumption seem to be weak.
5. Discussion
This research examined the linkage between CO2 emissions, renewable energy consumption, financial development, and economic growth in five sub-Saharan African countries with the largest nominal GDP using panel data from 2000 to 2020. The research establishes the existence of cross-sectional dependence among the variables based on the Pesaran CD test, hence the CIPS unit root test for panel data analysis was conducted. The test reveals that all the variables are integrated at order zero. The Pedroni test for cointegration further confirms that the variables are cointegrated. Group dynamic ordinary least squares (DOLS) estimation was adopted to measure the long-run relationships among the variables. The pooled mean group (PMG) estimation, on the other hand, was conducted to ascertain both the long-run and the short-run relationships existing between CO2 emissions, renewable energy consumption, financial development, and economic growth. The three independent variables were found to have significant relationships with CO2 emissions in the long run, but not in the short run. Renewable energy consumption and economic growth also have the expected signs based on the literature review, while financial development does not conform to a priori expectations. The findings of the long-run positive relationship between economic growth and CO2 emissions are corroborated by [28]. However, their findings of significant short-run interconnection between CO2 emissions and economic growth are a sharp contrast. Financial development was revealed to have a negative but significant relationship with CO2 emissions in the long run, also supported by [26]. These findings imply that since the sub-Saharan African countries of focus are still heavily dependent on fossil fuels as their major source of revenue, efforts to intensify renewable energy consumption will only be able to reduce CO2 emissions in the long run when the renewable energy industry is fully mature. Additionally, economic growth may still be accompanied by an increase in CO2 emissions even in the long run if these countries do not phase out fossil fuel utilization completely by then. For a country like Nigeria, for instance, it will probably still take decades to have a 100% transition to renewable energy utilization. Furthermore, the finding of both short-run and long-run positive relationships between economic growth and carbon dioxide emissions only support the scale effect of the EKC (though the growth rate of carbon emissions associated with an increase in production is very minimal), but not the composition or technique effects.
There is no causality between renewable energy consumption, economic growth, and CO2 emissions. This finding is in contrast with the results of [39] that a bidirectional causal link exists between CO2 emissions and economic growth. It also contrasts with [42], who found a bidirectional association between renewable energy consumption and CO2 emissions. Impulse response functions and variance decomposition analysis suggest that the impacts of renewable energy consumption, economic growth, and financial development on CO2 emissions will continue to be of little magnitude in the future. Thus, these sub-Saharan African countries will have to adopt the latest carbon technologies, like carbon capture, utilization, and storage, even as they are upscaling renewable energy consumption and cutting down fossil fuel use, to effectively manage CO2 emissions in the future. The overall results suggest that renewable energy consumption could reduce CO2 emissions, economic growth could increase CO2 emissions, and financial development could reduce CO2 emissions in Nigeria, South Africa, Kenya, Ethiopia, and Ghana in the long run.
6. Conclusions
This research has explored the impacts of renewable energy consumption, financial development, and economic growth on CO2 emissions in the five largest economies of sub-Saharan Africa using panel data spanning 2000 to 2020. The core findings of the study suggest that renewable energy consumption could reduce CO2 emissions, economic growth could increase CO2 emissions, and financial development could reduce CO2 emissions in Nigeria, South Africa, Kenya, Ethiopia, and Ghana in the long run.
These findings have very salient policy implications for these sub-Saharan African countries, known to heavily rely on fossil fuels for the largest component of their economic activities, to effectively chart a sustainable growth path while effectively dealing with climate change challenges. First, the enactment of more renewable energy policies has become more imperative than ever. This is because renewable energy upscaling will help these economies to remain in control of the seemingly ugly situations that the high level of emissions has already caused, some of which are rising sea levels and loss of aquatic life and biodiversity. In addition to increased renewable energy deployment, the promotion of energy efficiency will ensure that the existing energy supply is not wasted. The findings of the study revealed that despite an increase in renewable energy consumption, it will take a long time before the impact will be felt. Thus, there is a need for a prompt introduction of environmentally friendly carbon technologies, such as carbon capture, utilization, and storage (CCUS) while efforts are put in place to reduce dependence on fossil fuels and enhance renewable energy deployment.
Finally, the role of research and development in managing excessive CO2 emissions cannot be overemphasized. However, sub-Saharan Africa still has a lot of work to do in this area. Thus, sub-Saharan African countries need to intensify investments in research on carbon management technologies and clean energy technologies. These investments can also be attracted when there is a developed financial system. Financial institutions should be empowered to incentivize potential investors in the areas of renewable energy and carbon emission reductions (CER). These efforts would not only address current emissions problems or renewable energy upscaling targets but would also tackle other environmental issues that might arise in the post–fossil fuel future of sub-Saharan Africa. Perhaps the African Union may begin to consider redesigning some institutes of the Pan-African University to include more practically oriented renewable energy and carbon technology research components.
Author Contributions
Conceptualization, C.M.N. and H.Q.-U.; methodology, C.M.N.; software, C.M.N.; validation, H.Q.-U.; formal analysis, H.Q.-U. and C.M.N.; resources, H.Q.-U.; data curation, C.M.N.; writing—original draft preparation, C.M.N.; writing—review and editing, H.Q.-U.; visualization, C.M.N.; funding acquisition, H.Q.-U. All authors have read and agreed to the published version of the manuscript.
Funding
This research was funded by York University, Canada, grant number SSHRC-435-2015-1616 and the APC was also funded by York University, Canada.
Institutional Review Board Statement
Not applicable.
Informed Consent Statement
Not applicable.
Data Availability Statement
The data supporting the reported results can be found at https://databank.worldbank.org/source/world-development-indicators, (accessed on 19 June 2021).
Conflicts of Interest
The authors declare no conflict of interest.
Appendix A
Table A1.
Kao Residual Cointegration Test.
Table A1.
Kao Residual Cointegration Test.
| t-Statistic | Probability | |
|---|---|---|
| ADF | −5.703985 | 0.0000 |
| Residual Variance | 0.0000000251 | |
| HAC Variance | 0.0000000270 |
References
- Ali, H.S.; Law, S.H.; Lin, W.L.; Yusop, Z.; Chin, L.; Bare, U.A.A. Financial development and CO2 emissions in Nigeria: Evidence from the ARDL bounds approach. GeoJournal 2019, 84, 641–655. [Google Scholar] [CrossRef]
- Li, S.; Zhou, C.; Wang, S. Does modernization affect CO2 emissions? A panel data analysis. Sci. Total Environ. 2019, 663, 426–435. [Google Scholar] [CrossRef] [PubMed]
- Zhang, W.; Chiu, Y.B. Do country risks influence CO2 emissions? A non-linear perspective. Energy 2020, 206, 118048. [Google Scholar] [CrossRef]
- Feng, C.; Zheng, C.J.; Shan, M.L. The clarification for the features, temporal variations, and potential factors of global CO2 emissions. J. Clean. Prod. 2020, 255, 120250. [Google Scholar] [CrossRef]
- Hu, H.; Xie, N.; Fang, D.; Zhang, X. The role of renewable energy consumption and commercial services trade in CO2 reduction: Evidence from 25 developing countries. Appl. Energy 2018, 211, 1229–1244. [Google Scholar] [CrossRef]
- Chunyu, L.; Zain-ul-Abidin, S.; Majeed, W.; Raza, S.M.F.; Ahmad, I. The non-linear relationship between CO2 emissions, financial development, and energy consumption in developing European and Central Asian economies. Environ. Sci. Pollut. Res. 2021, 28, 63330–63345. [Google Scholar] [CrossRef]
- Dogan, E.; Seker, F. The influence of real output, renewable and non-renewable energy, trade, and financial development on carbon emissions in the top renewable energy countries. Renew. Sustain. Energy Rev. 2016, 60, 1074–1085. [Google Scholar] [CrossRef]
- Liu, H.; Lei, M.; Zhang, N.; Du, G. The causal nexus between energy consumption, carbon emissions, and economic growth: New evidence from China, India and G7 countries using convergent cross-mapping. PLoS ONE 2019, 14, e0217319. [Google Scholar] [CrossRef]
- Bekhet, H.A.; Matar, A.; Yasmin, T. CO2 emissions, energy consumption, economic growth, and financial development in GCC countries: Dynamic simultaneous equation models. Renew. Sustain. Energy Rev. 2017, 70, 117–132. [Google Scholar] [CrossRef]
- Jian, J.; Fan, X.; He, P.; Xiong, H.; Shen, H. The effects of energy consumption, economic growth and financial development on CO2 emissions in China: A VECM approach. Sustainability 2019, 11, 4850. [Google Scholar] [CrossRef]
- Statista, African Countries with the Highest Gross Domestic Product (GDP) in 2020; Statista: New York, NY, USA, 2020.
- Hassan, A.; Kouhy, R. Gas flaring in Nigeria: Analysis of changes in its consequent carbon emission and reporting. Account. Forum 2013, 37, 124–134. [Google Scholar] [CrossRef]
- Aïssa, M.S.B.; Jebli, M.B.; Youssef, S.B. Output, renewable energy consumption and trade in Africa. Energy Policy 2014, 66, 11–18. [Google Scholar] [CrossRef]
- Kouton, J. The impact of renewable energy consumption on inclusive growth: Panel data analysis in 44 African countries. Econ. Chang. Restruct. 2021, 54, 145–170. [Google Scholar] [CrossRef]
- Liousse, C.; Keita, S.; Granier, L.; Granier, C.; Elvidge, C.D.; Elguindi, N.; Law, K. Flaring emissions in Africa: Distribution, evolution and comparison with current inventories. Atmos. Environ. 2019, 199, 423–434. [Google Scholar]
- Kuznets, S. Economic growth and income inequality. Am. Econ. Rev. 1955, 45, 1–28. [Google Scholar]
- Shafik, N.; Bandyopadhyay, S. Economic Growth and Environmental Quality: Time-Series and Cross-Country Evidence; World Bank Publications: Washington, DC, USA, 1992; Volume 904, p. 904. [Google Scholar]
- Panayotou, T. Empirical Tests and Policy Analysis of Environmental Degradation at Different Stages of Economic Development; (No. 992927783402676); International Labour Organization: Rome, Italy, 1993. [Google Scholar]
- Grossman, G.M.; Krueger, A.B. Environmental Impacts of a North American Free-Trade Agreement; NBER Working Paper 3914; NBER: Cambridge, UK, 1991. [Google Scholar]
- Stern, D. Progress on the environmental Kuznets curve? Environ. Dev. Econ. 1998, 3, 173–196. [Google Scholar] [CrossRef]
- Stern, D. The rise and fall of the Environmental Kuznets Curve. World Dev. 2004, 32, 1419–1439. [Google Scholar] [CrossRef]
- Saboori, B.; Sulaiman, J.; Mohd, S. Economic growth and CO2 emissions in Malaysia: A cointegration analysis of the environmental Kuznets curve. Energy Policy 2012, 51, 184–191. [Google Scholar] [CrossRef]
- Makassar, A. Economic growth and CO2 emissions in Indonesia: Investigating the environmental Kuznets curve hypothesis existence. J. BPPK 2019, 20, 11. [Google Scholar]
- Salahuddin, M.; Alam, K.; Ozturk, I.; Sohag, K. The effects of electricity consumption, economic growth, financial development and foreign direct investment on CO2 emissions in Kuwait. Renew. Sustain. Energy Rev. 2018, 81, 2002–2010. [Google Scholar] [CrossRef]
- Pata, U.K. Renewable energy consumption, urbanization, financial development, income and CO2 emissions in Turkey: Testing EKC hypothesis with structural breaks. J. Clean. Prod. 2018, 187, 770–779. [Google Scholar] [CrossRef]
- Cetin, M.; Ecevit, E.; Yucel, A.G. The impact of economic growth, energy consumption, trade openness, and financial development on carbon emissions: Empirical evidence from Turkey. Environ. Sci. Pollut. Res. 2018, 25, 36589–36603. [Google Scholar] [CrossRef] [PubMed]
- Naz, S.; Sultan, R.; Zaman, K.; Aldakhil, A.M.; Nassani, A.A.; Abro, M.M.Q. Moderating and mediating role of renewable energy consumption, FDI inflows, and economic growth on CO2 emissions: Evidence from the robust least square estimator. Environ. Sci. Pollut. Res. 2018, 26, 2806–2819. [Google Scholar] [CrossRef]
- Raggad, B. Economic development, energy consumption, financial development, and CO2 emissions in Saudi Arabia: New evidence from nonlinear and asymmetric analysis. Environ. Sci. Pollut. Res. 2020, 27, 21872–21891. [Google Scholar] [CrossRef]
- Khan, M.K.; Khan, M.I.; Rehan, M. The relationship between energy consumption, economic growth, and CO2 emissions in Pakistan. Financ. Innov. 2020, 6, 1. [Google Scholar] [CrossRef]
- Khan, M.K.; Teng, J.Z.; Khan, M.I. Effect of energy consumption and economic growth on CO2 emissions in Pakistan with dynamic ARDL simulations approach. Environ. Sci. Pollut. Res. 2019, 26, 23480–23490. [Google Scholar] [CrossRef] [PubMed]
- Rehman, A.; Rauf, A.; Ahmad, M.; Chandio, A.A.; Deyuan, Z. The effect of CO2 emission and the consumption of electrical energy, fossil fuel energy, and renewable energy, on economic performance: Evidence from Pakistan. Environ. Sci. Pollut. Res. 2019, 26, 21760–21773. [Google Scholar] [CrossRef]
- Eren, B.M.; Taspinar, N.; Gokmenoglu, K.K. The impact of financial development and economic growth on renewable energy consumption: Empirical analysis of India. Sci. Total Environ. 2019, 663, 189–197. [Google Scholar] [CrossRef]
- Sasana, H.; Aminata, J. Energy subsidy, energy consumption, economic growth, and CO2 emission: Indonesian case studies. Int. J. Energy Econ. Policy 2019, 9, 117. [Google Scholar]
- Kwakwa, P.A. The long-run effects of energy use, urbanization, and financial development on CO2 emissions. Int. J. Energy Sect. Manag. 2020, 14, 6. [Google Scholar] [CrossRef]
- Amri, F. CO2 emissions, total factor productivity, ICT, trade, financial development, and energy consumption: Testing environmental Kuznets curve hypothesis for Tunisia. Environ. Sci. Pollut. Res. 2018, 25, 33691–33701. [Google Scholar] [CrossRef]
- Bekun, F.V.; Emir, F.; Sarkodie, S.A. Another look at the relationship between energy consumption, CO2 emissions, and economic growth in South Africa. Sci. Total Environ. 2019, 655, 759–765. [Google Scholar] [CrossRef] [PubMed]
- Ehigiamusoe, K.U.; Lean, H.H. Effects of energy consumption, economic growth, and financial development on carbon emissions: Evidence from heterogeneous income groups. Environ. Sci. Pollut. Res. 2019, 26, 22611–22624. [Google Scholar] [CrossRef] [PubMed]
- Wang, R.; Mirza, N.; Vasbieva, D.G.; Abbas, Q.; Xiong, D. The nexus of carbon emissions, financial development, renewable energy consumption, and technological innovation: What should be the priorities in light of COP 21 Agreements? J. Environ. Manag. 2020, 271, 111027. [Google Scholar] [CrossRef]
- Wen, J.; Mughal, N.; Zhao, J.; Shabbir, M.S.; Niedbała, G.; Jain, V.; Anwar, A. Does globalization matter for environmental degradation? Nexus among energy consumption, economic growth, and CO2 emission. Energy Policy 2021, 153, 112230. [Google Scholar] [CrossRef]
- Al-Mulali, U.; Ozturk, I.; Lean, H.H. The influence of economic growth, urbanization, trade openness, financial development, and renewable energy on pollution in Europe. Nat. Hazards 2015, 79, 621–644. [Google Scholar] [CrossRef]
- Salahuddin, M.; Gow, J.; Ozturk, I. Is the long-run relationship between economic growth, electricity consumption, CO2 emissions and financial development in Gulf Cooperation Council Countries robust? Renew. Sustain. Energy Rev. 2015, 51, 317–326. [Google Scholar] [CrossRef]
- AlKhars, M.; Miah, F.; Qudrat-Ullah, H.; Kayal, A. A systematic review of the relationship between energy consumption and economic growth in GCC countries. Sustainability 2020, 12, 3845. [Google Scholar] [CrossRef]
- Rasoulinezhad, E.; Saboori, B. Panel estimation for renewable and non-renewable energy consumption, economic growth, CO2 emissions, the composite trade intensity, and financial openness of the commonwealth of independent states. Environ. Sci. Pollut. Res. 2018, 25, 17354–17370. [Google Scholar] [CrossRef]
- Kahia, M.; Jebli, M.B.; Belloumi, M. Analysis of the impact of renewable energy consumption and economic growth on CO2 emissions in 12 MENA countries. Clean Technol. Environ. Policy 2019, 21, 871–885. [Google Scholar] [CrossRef]
- Charfeddine, L.; Kahia, M. Impact of renewable energy consumption and financial development on CO2 emissions and economic growth in the MENA region: A panel vector autoregressive (PVAR) analysis. Renew. Energy 2019, 139, 198–213. [Google Scholar] [CrossRef]
- Lu, W.C. The impacts of information and communication technology, energy consumption, financial development, and economic growth on CO2 emissions in 12 Asian countries. Mitig. Adapt. Strateg. Glob. Chang. 2018, 23, 1351–1365. [Google Scholar] [CrossRef]
- Yazdi, K.S.; Beygi, G.E. The dynamic impact of renewable energy consumption and financial development on CO2 emissions: For selected African countries. Energy Sources Part B Econ. Plan. Policy 2018, 13, 13–20. [Google Scholar] [CrossRef]
- Hanif, I. Impact of economic growth, nonrenewable and renewable energy consumption, and urbanization on carbon emissions in Sub-Saharan Africa. Environ. Sci. Pollut. Res. 2018, 25, 15057–15067. [Google Scholar] [CrossRef] [PubMed]
- Nathaniel, S.P.; Iheonu, C.O. CO2 abatement in Africa: The role of renewable and non-renewable energy consumption. Sci. Total Environ. 2019, 679, 337–345. [Google Scholar] [CrossRef] [PubMed]
- Hong, S.H.; Wagner, M. Nonlinear cointegration analysis and the environmental Kuznets curve. Reihe Okon./Econ. Ser. 2008, 224. Available online: https://www.econstor.eu/handle/10419/72720 (accessed on 9 July 2021).
- Adams, S.; Nsiah, C. Reducing CO2 emissions; Does renewable energy matter? Sci. Total Environ. 2019, 693, 133288. [Google Scholar] [CrossRef]
- Hlouskova, J.; Wagner, M. The performance of panel unit root and stationarity tests: Results from a large scale simulation study. Econom. Rev. 2006, 25, 85–116. [Google Scholar] [CrossRef]
- Stypka, O.; Wagner, M. The Phillips unit root tests for polynomials of integrated processes revisited. Econ. Lett. 2019, 176, 109–113. [Google Scholar] [CrossRef]
- Müller-Fürstenberger, G.; Wagner, M. Exploring the environmental Kuznets hypothesis: Theoretical and econometric problems. Ecol. Econ. 2007, 62, 648–660. [Google Scholar] [CrossRef]
- Caviglia-Harris, J.L.; Chambers, D.; Kahn, J.R. Taking the “U” out of Kuznets: A comprehensive analysis of the EKC and environmental degradation. Ecol. Econ. 2009, 68, 1149–1159. [Google Scholar] [CrossRef]
- Al-Mulali, U.; Sab, C.N.B.C. The impact of energy consumption and CO2 emission on the economic growth and financial development in the Sub-Saharan African countries. Energy 2012, 39, 180–186. [Google Scholar] [CrossRef]
- World Development Indicator (WDI, 2020). Available online: https://databank.worldbank.org/source/world-development-indicators (accessed on 18 June 2021).
- Al-Mulali, U.; Sab, C.N.B.C. The impact of energy consumption and CO2 emission on the economic and financial development in 19 selected countries. Renew. Sustain. Energy Rev. 2012, 16, 4365–4369. [Google Scholar] [CrossRef]
- Pesaran, M.H. General Diagnostic Tests for Cross-Section Dependence in Panels; CESifo Working Paper Series No. 1229; Cambridge Working Papers in Economics No. 435; University of Cambridge: Cambridge, UK, 2004. [Google Scholar]
- Im, K.S.; Pesaran, M.H.; Shin, Y. Testing for unit roots in heterogeneous panels. J. Econ. 2003, 115, 53–74. [Google Scholar] [CrossRef]
- Pesaran, M.H. A simple panel unit root test in the presence of cross-section dependence. J. Appl. Econ. 2007, 22, 265–312. [Google Scholar] [CrossRef]
- Pedroni, P. Panel cointegration; asymptotic and finite sample properties of pooled time series tests, with an application to the PPP hypothesis: New results. Econom. Theory 2004, 20, 597–625. [Google Scholar] [CrossRef]
- Pedroni, P. Critical values for cointegration tests in heterogeneous panels with multiple regressors. Oxf. Bull. Econ. Stat. 1999, 61, 653–670. [Google Scholar] [CrossRef]
Publisher’s Note: MDPI stays neutral with regard to jurisdictional claims in published maps and institutional affiliations. |
© 2022 by the authors. Licensee MDPI, Basel, Switzerland. This article is an open access article distributed under the terms and conditions of the Creative Commons Attribution (CC BY) license (https://creativecommons.org/licenses/by/4.0/).