
Water Losses in the Condenser Cooling System at the 905 MWe Power Unit

 ,
,  , ,
, ,
Abstract
:1. Introduction
2. Materials and Methods
2.1. Cooling Water System in 905 MW Power Unit
2.2. Water Balance of the Power Unit
2.3. Cooling Water Losses in the Steam Condenser
2.4. Evaluation of the Size of Influence of Cooling Water Flux on Water Losses and Unit Power
3. Results and Discussion
3.1. Effect of Atmospheric Conditions on Cooling Water Losses
3.2. Influence of Changes in Cooling Water Flux on the Power Unit Operation and the Amount of Water Losses
4. Conclusions
- (a)
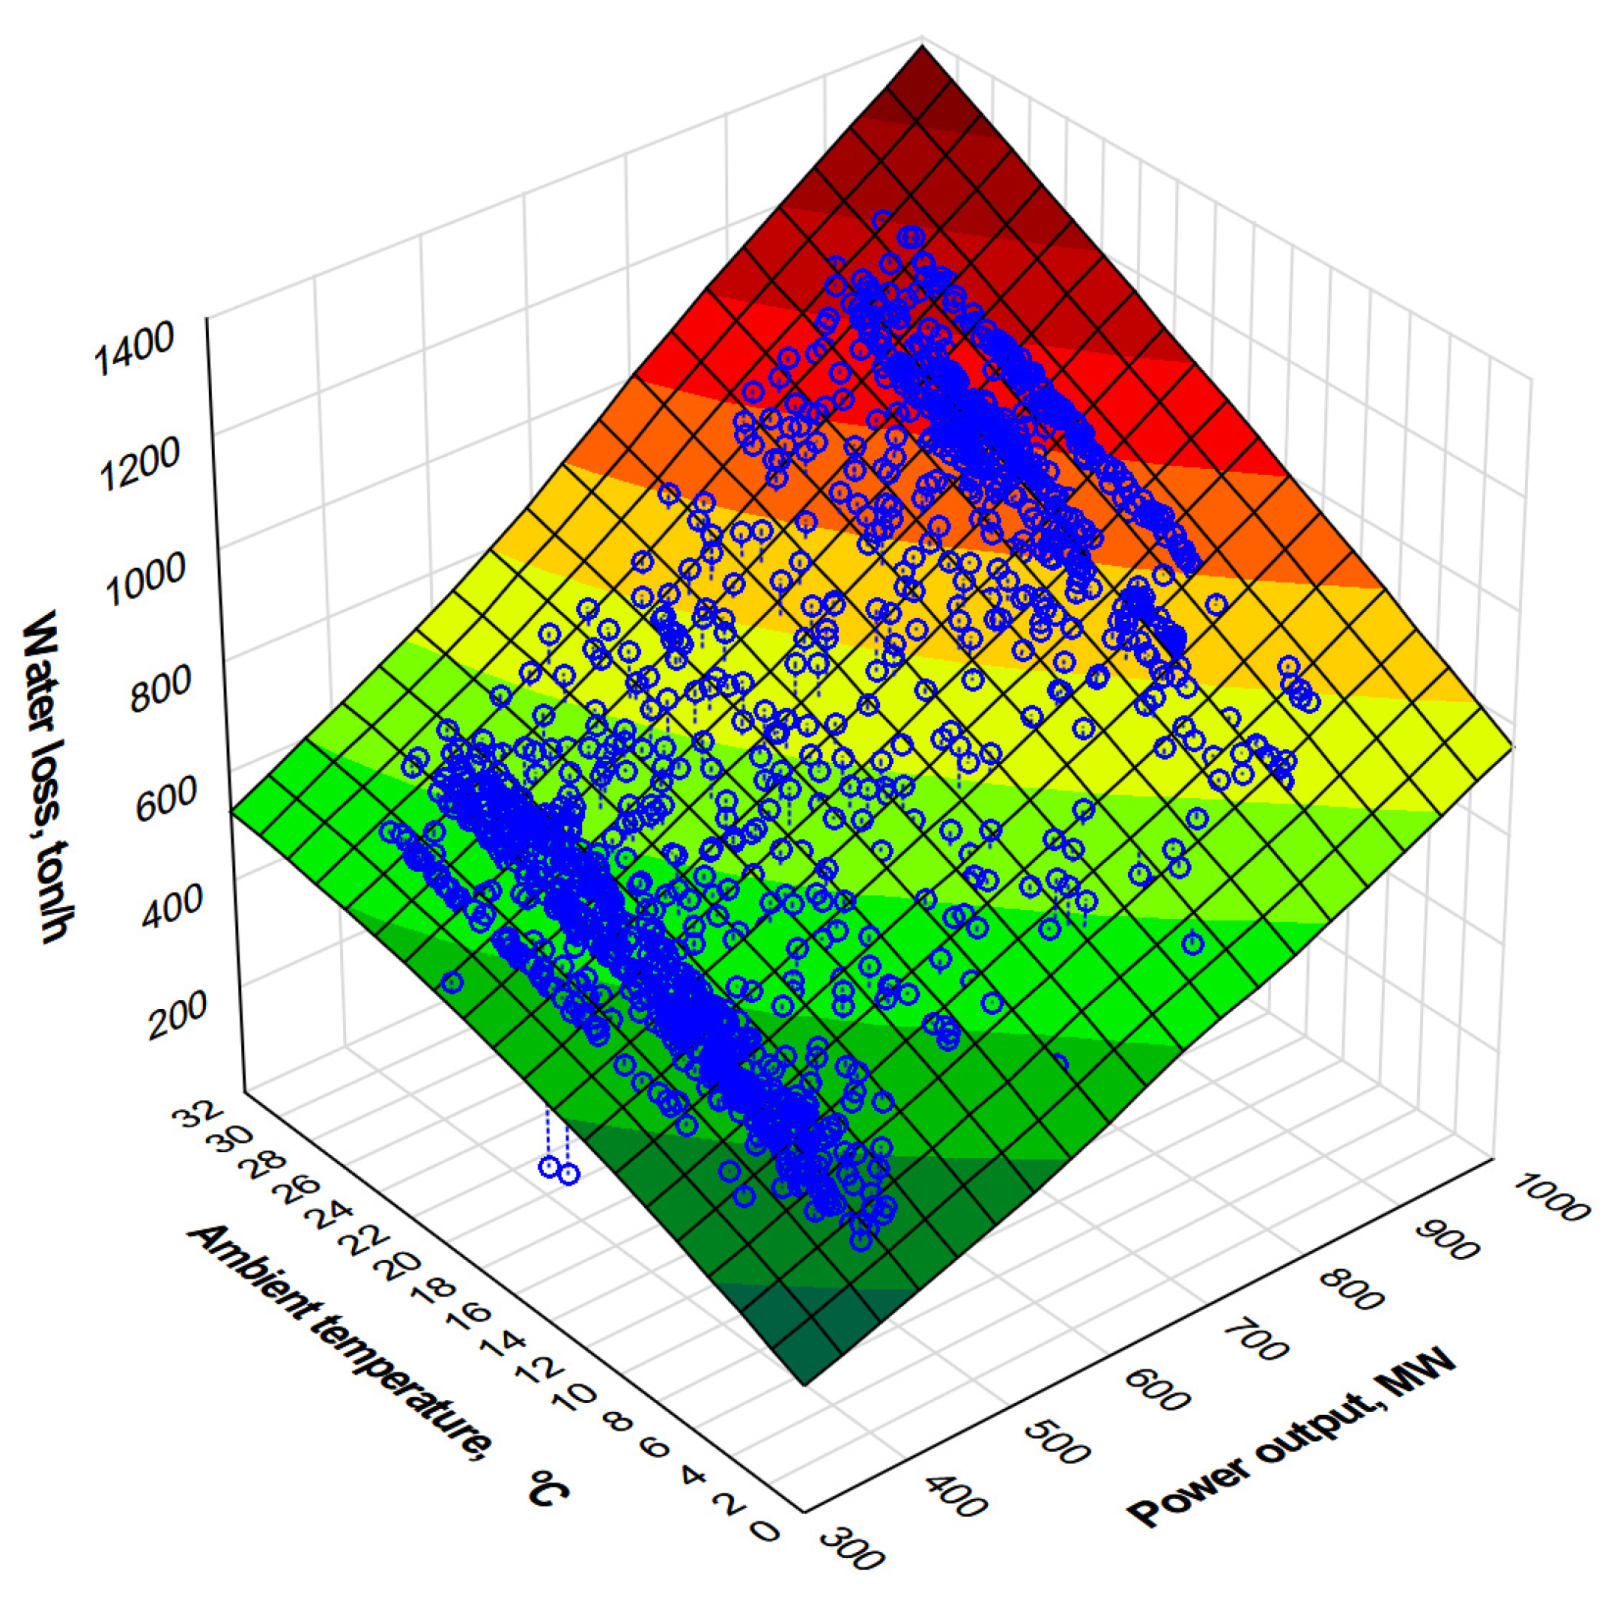
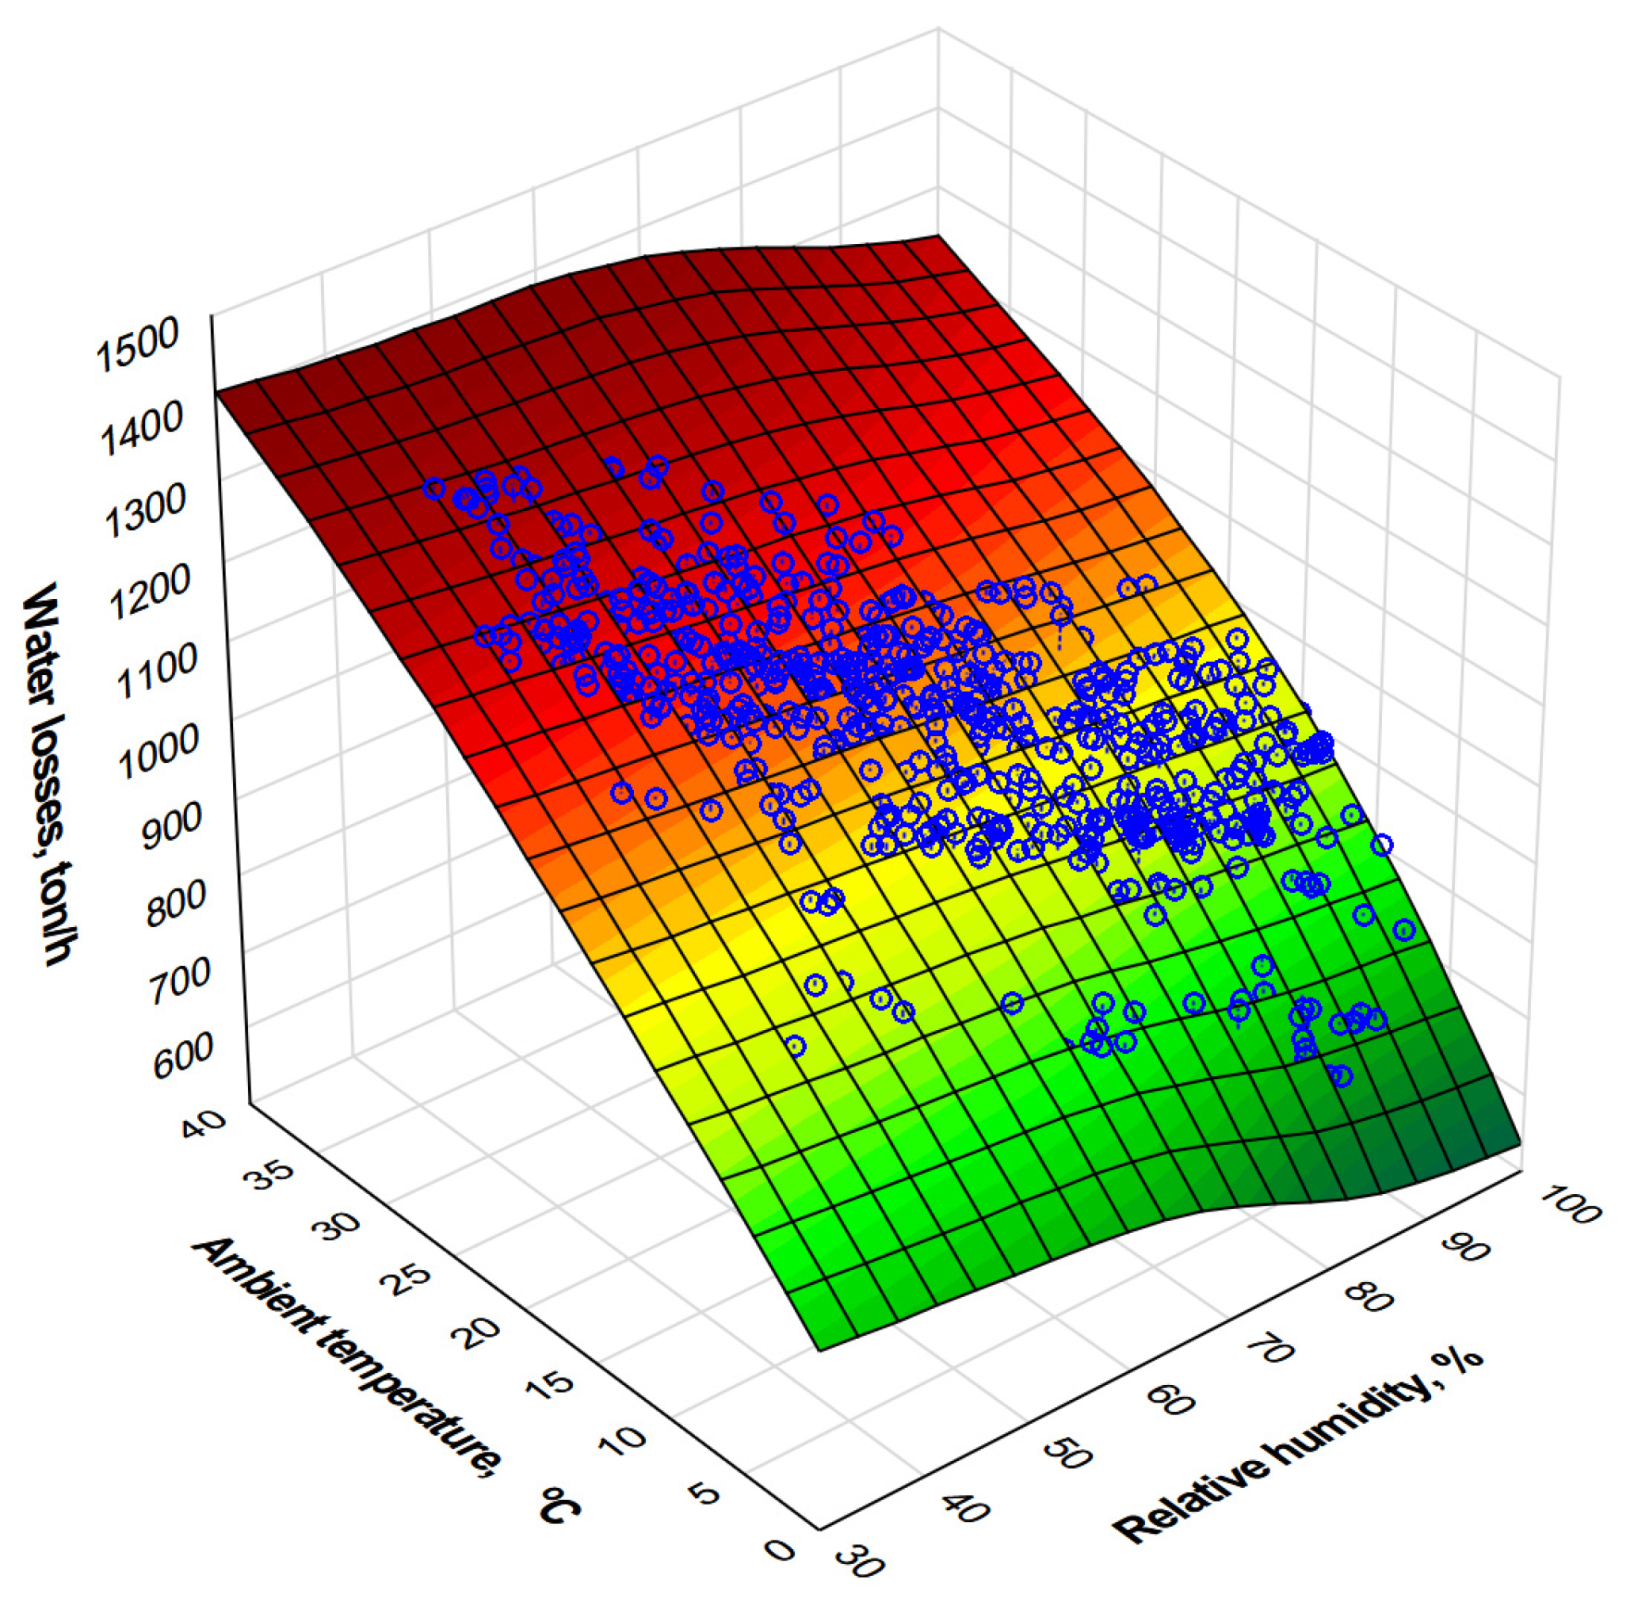
- The calculations allow to determine the water loss flux due to evaporation and to determine the effect of ambient conditions and power unit load on its value. This information is very important when the conditions in which the cooling tower operates differ from the design assumptions. This is especially true for cooling tower operation at high temperatures and humidity when the power unit is operating at maximum load. The results make it possible to formulate an approximation function defining the dependence of evaporative loss on the unit power as well as on the temperature and humidity of ambient air. The feature can be helpful in forecasting water usage within a power unit.
- (b)
- Based on the measured data, the total water loss due to evaporation and drift is determined and expressed as a function of ambient temperature and unit power. After subtracting the water loss due to evaporation, the drift loss is determined. The drift loss is found to be at 100–300 ton/h, i.e., approximately 0.125–0.375% of the cooling water flux and increases slightly with increasing ambient temperature Tamb and increasing unit power.
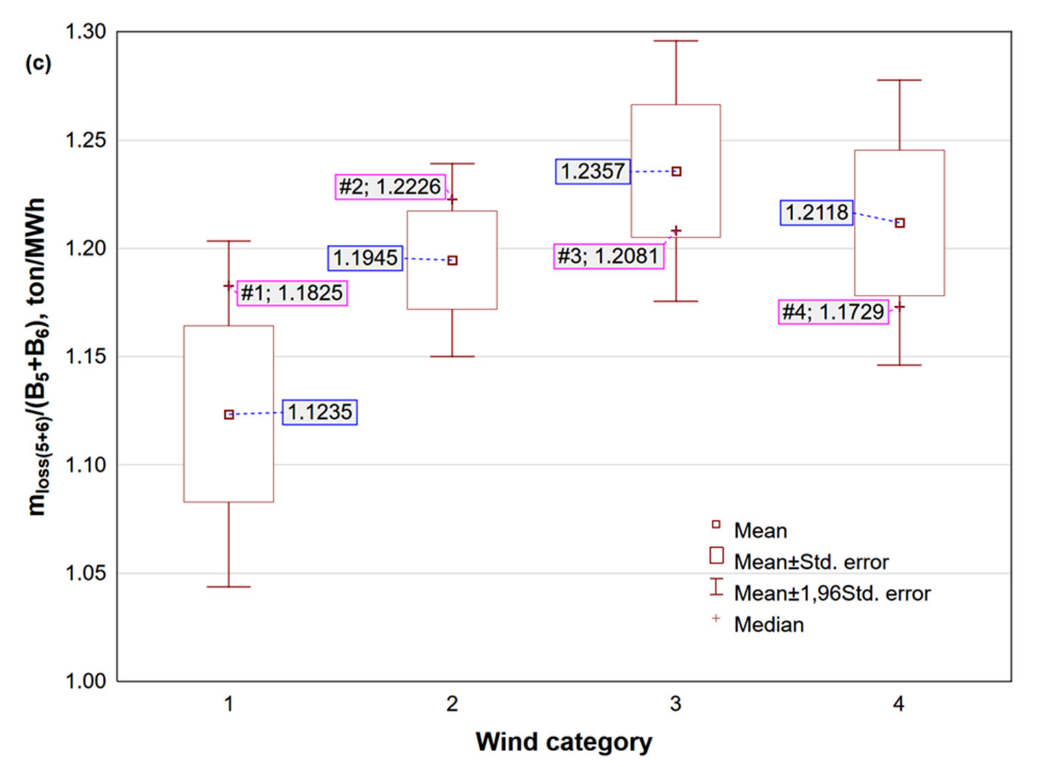
- (c)
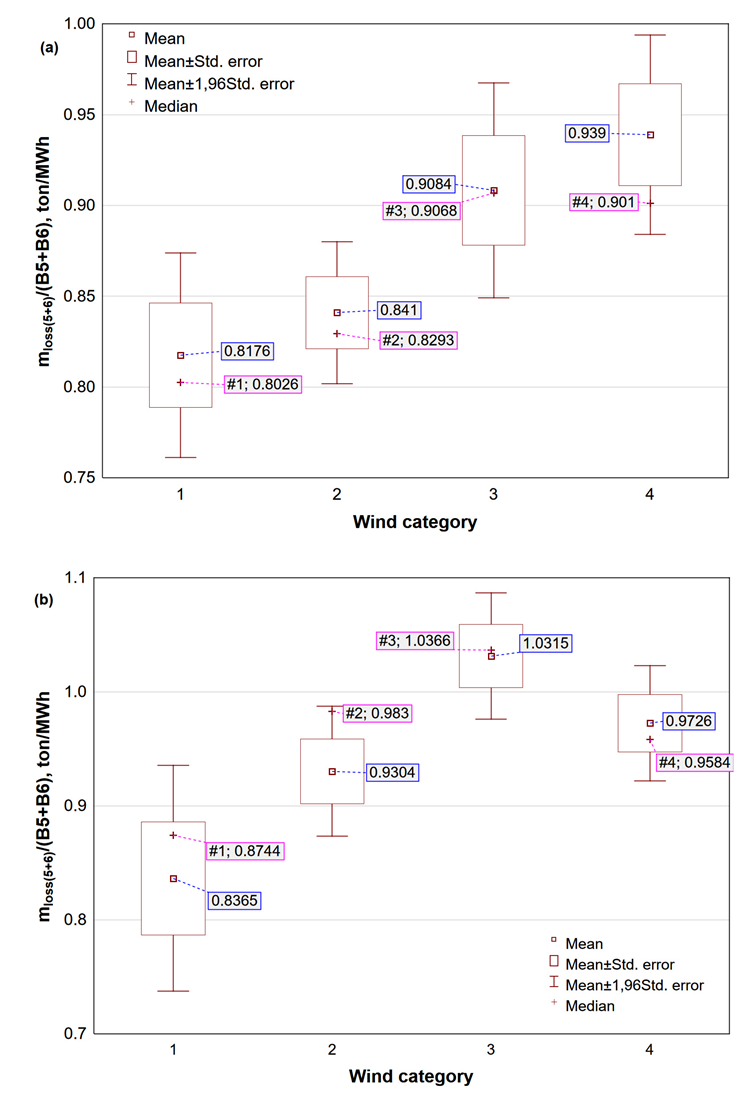
- The effect of wind on total water loss due to evaporation and drift is investigated. Its value is determined for the cooling tower and related to the generated power. The measurement results are given and the calculations are performed for three different values of Tamb, i.e., 7 °C, 15 °C, 22 °C. This effect is found to be statistically significant and the loss so determined, in general, increases with wind speed. This is evident for ambient temperature of 7 °C. In other cases, in each of the wind speed categories, the loss is greater than in case, when the wind speed is in the range between 0–1 m/s. The loss of cooling water related to the power unit increased to 14.8% for the temperature of Tamb 7 °C and to 23.3% for Tamb 15 °C. For Tamb 22 °C, the maximum increase of this loss was about 10%.
- (d)
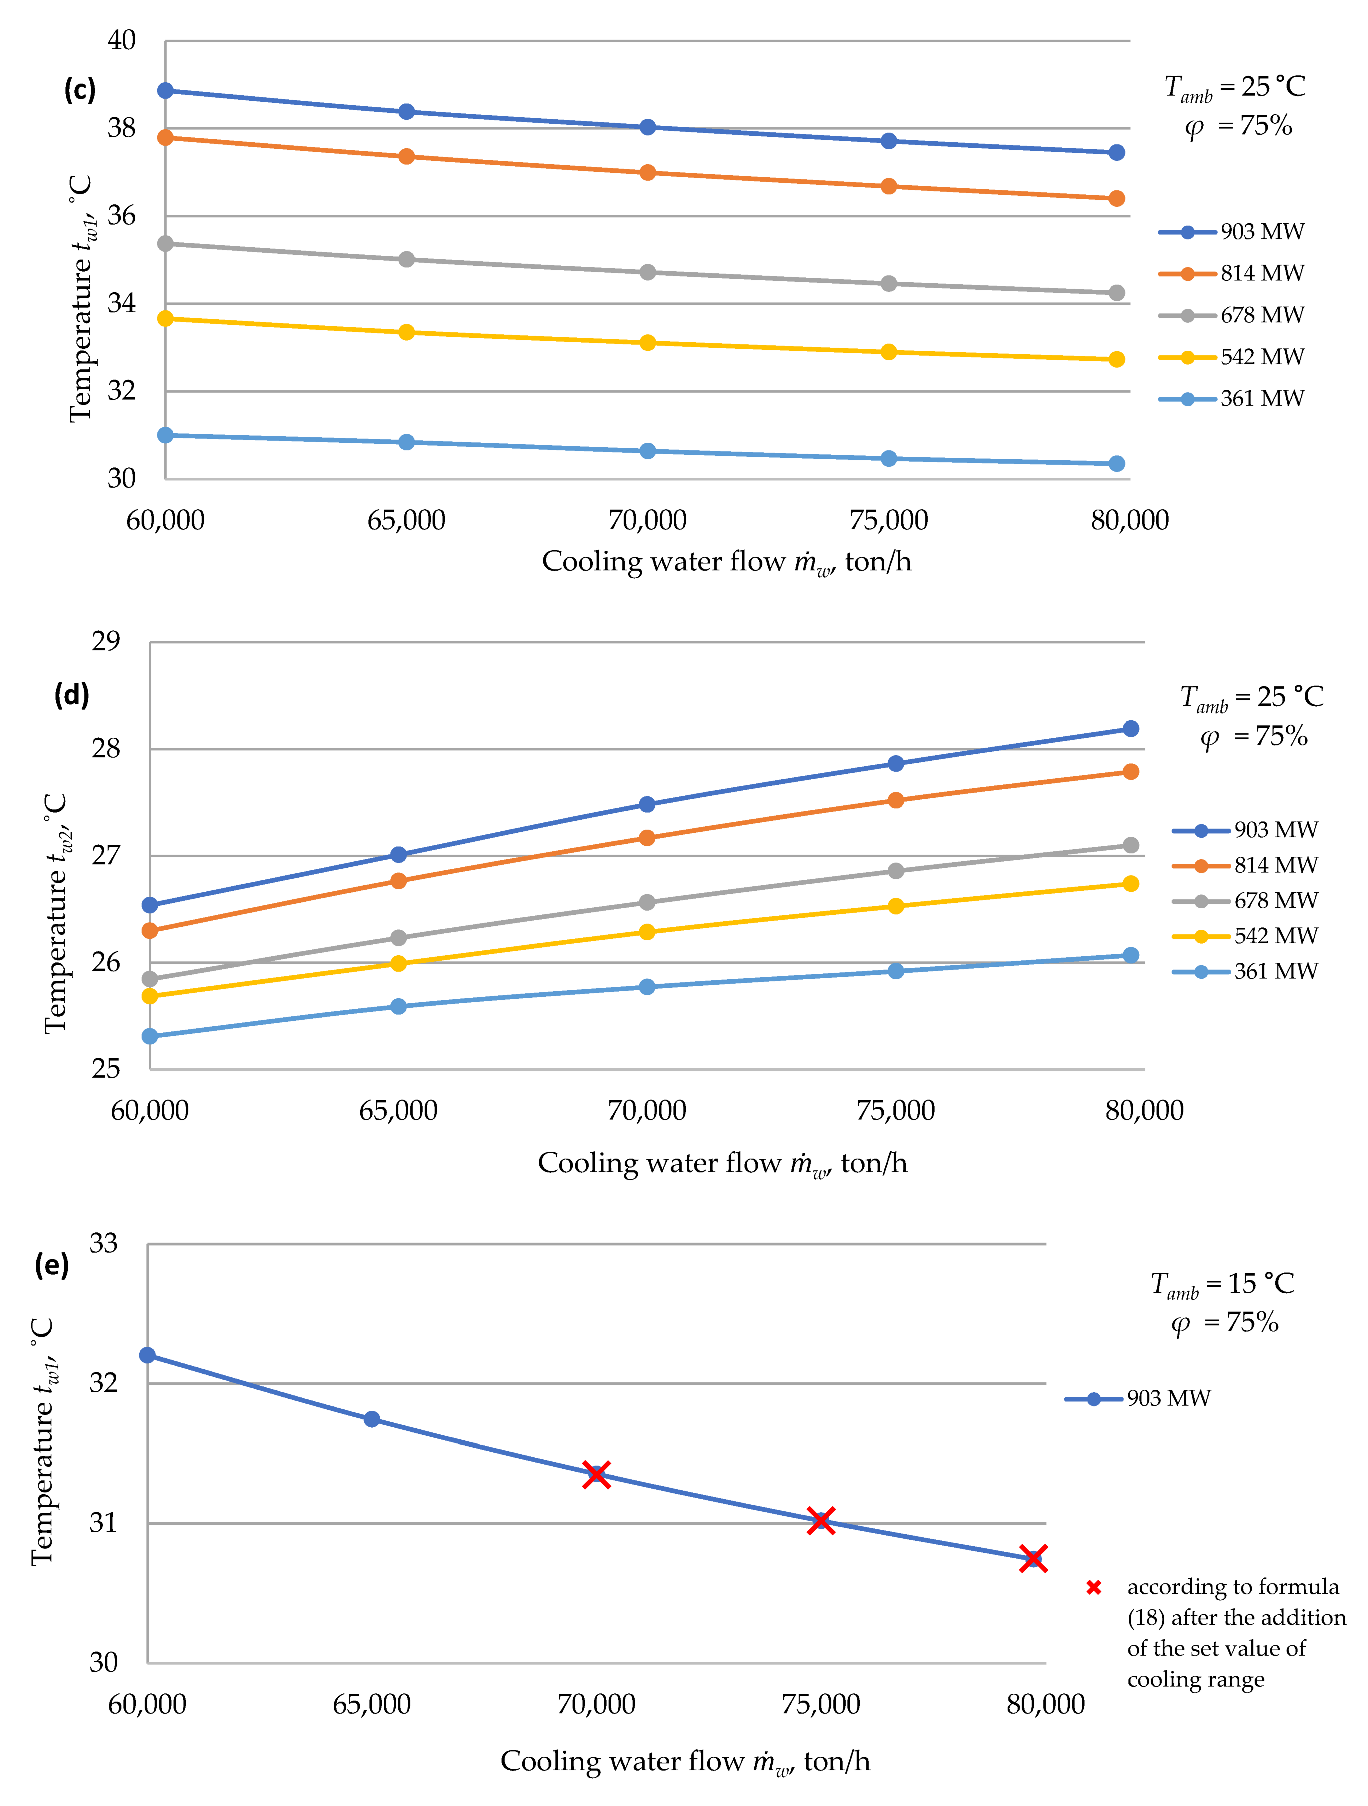
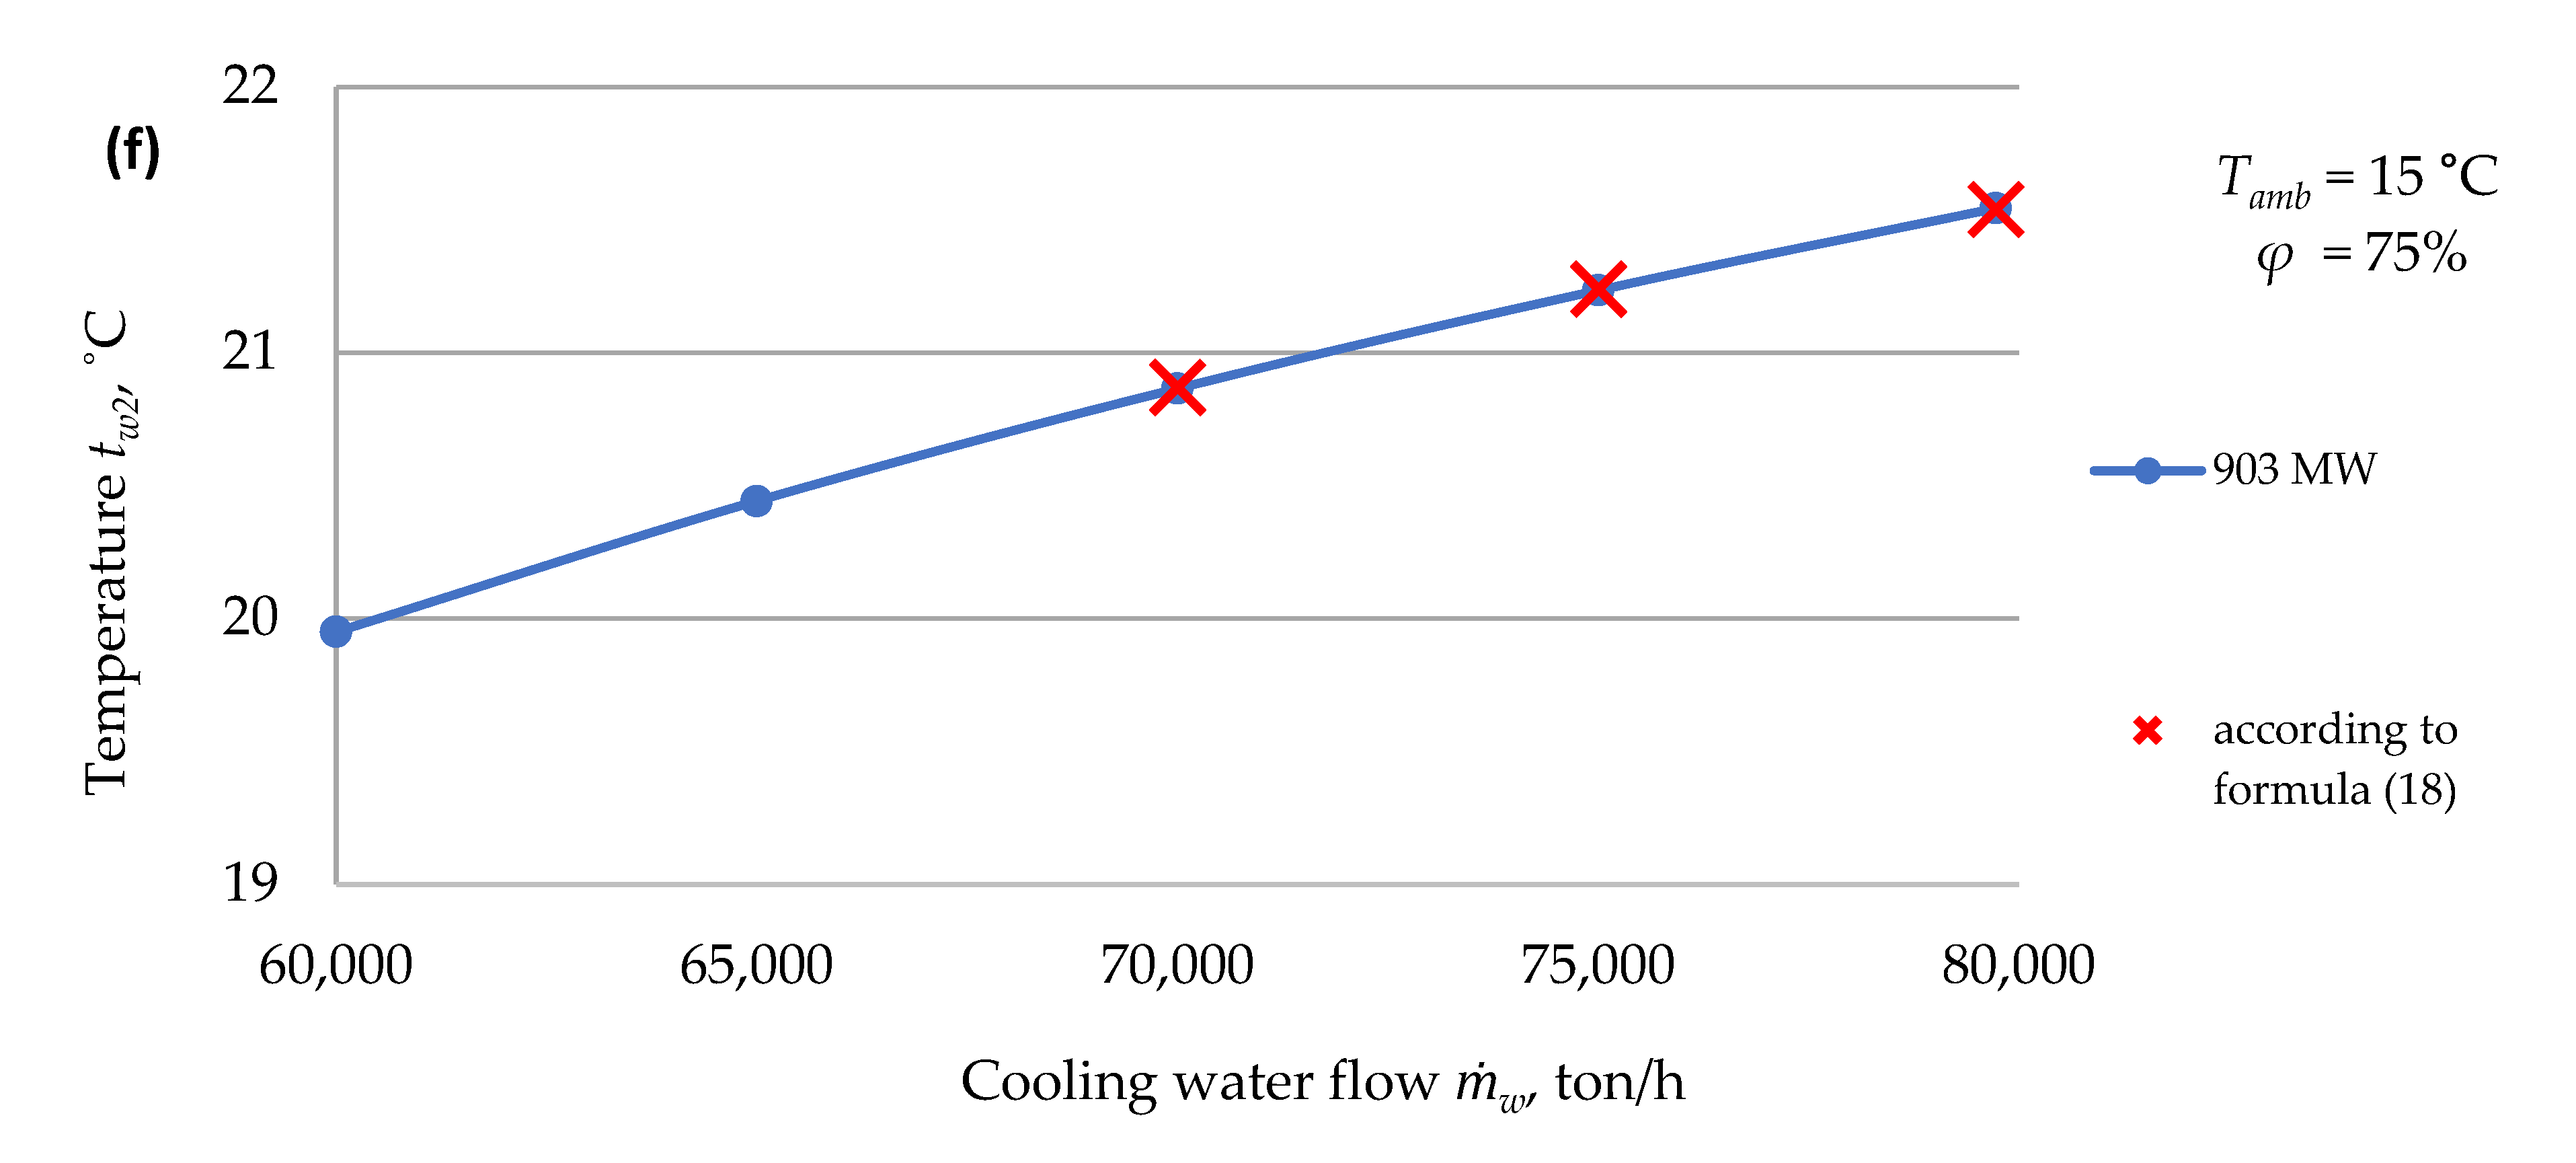
- The effect of change in the cooling water flux on the power unit operation is investigated. As the cooling water flux decreases, the water temperature tw1 increases, which has a negative effect on the turbine power output by increasing Ts and ps. In the analysed range of changes in , as the chilled water flux ṁw decreases, the chilled water temperature tw2 decreases. This may be due to the decreasing resistance to airflow through the cooling tower and the change in the ratio . In terms of changes in water flux ṁw from 80,000 ton/h to 60,000 ton/h, tw2 decreases by about °C for B = 903 MW and Tamb = 25 °C and by about 0.75 °C at 361 MW and Tamb = 25 °C Similar ranges of change occur for other ambient temperatures Tamb.
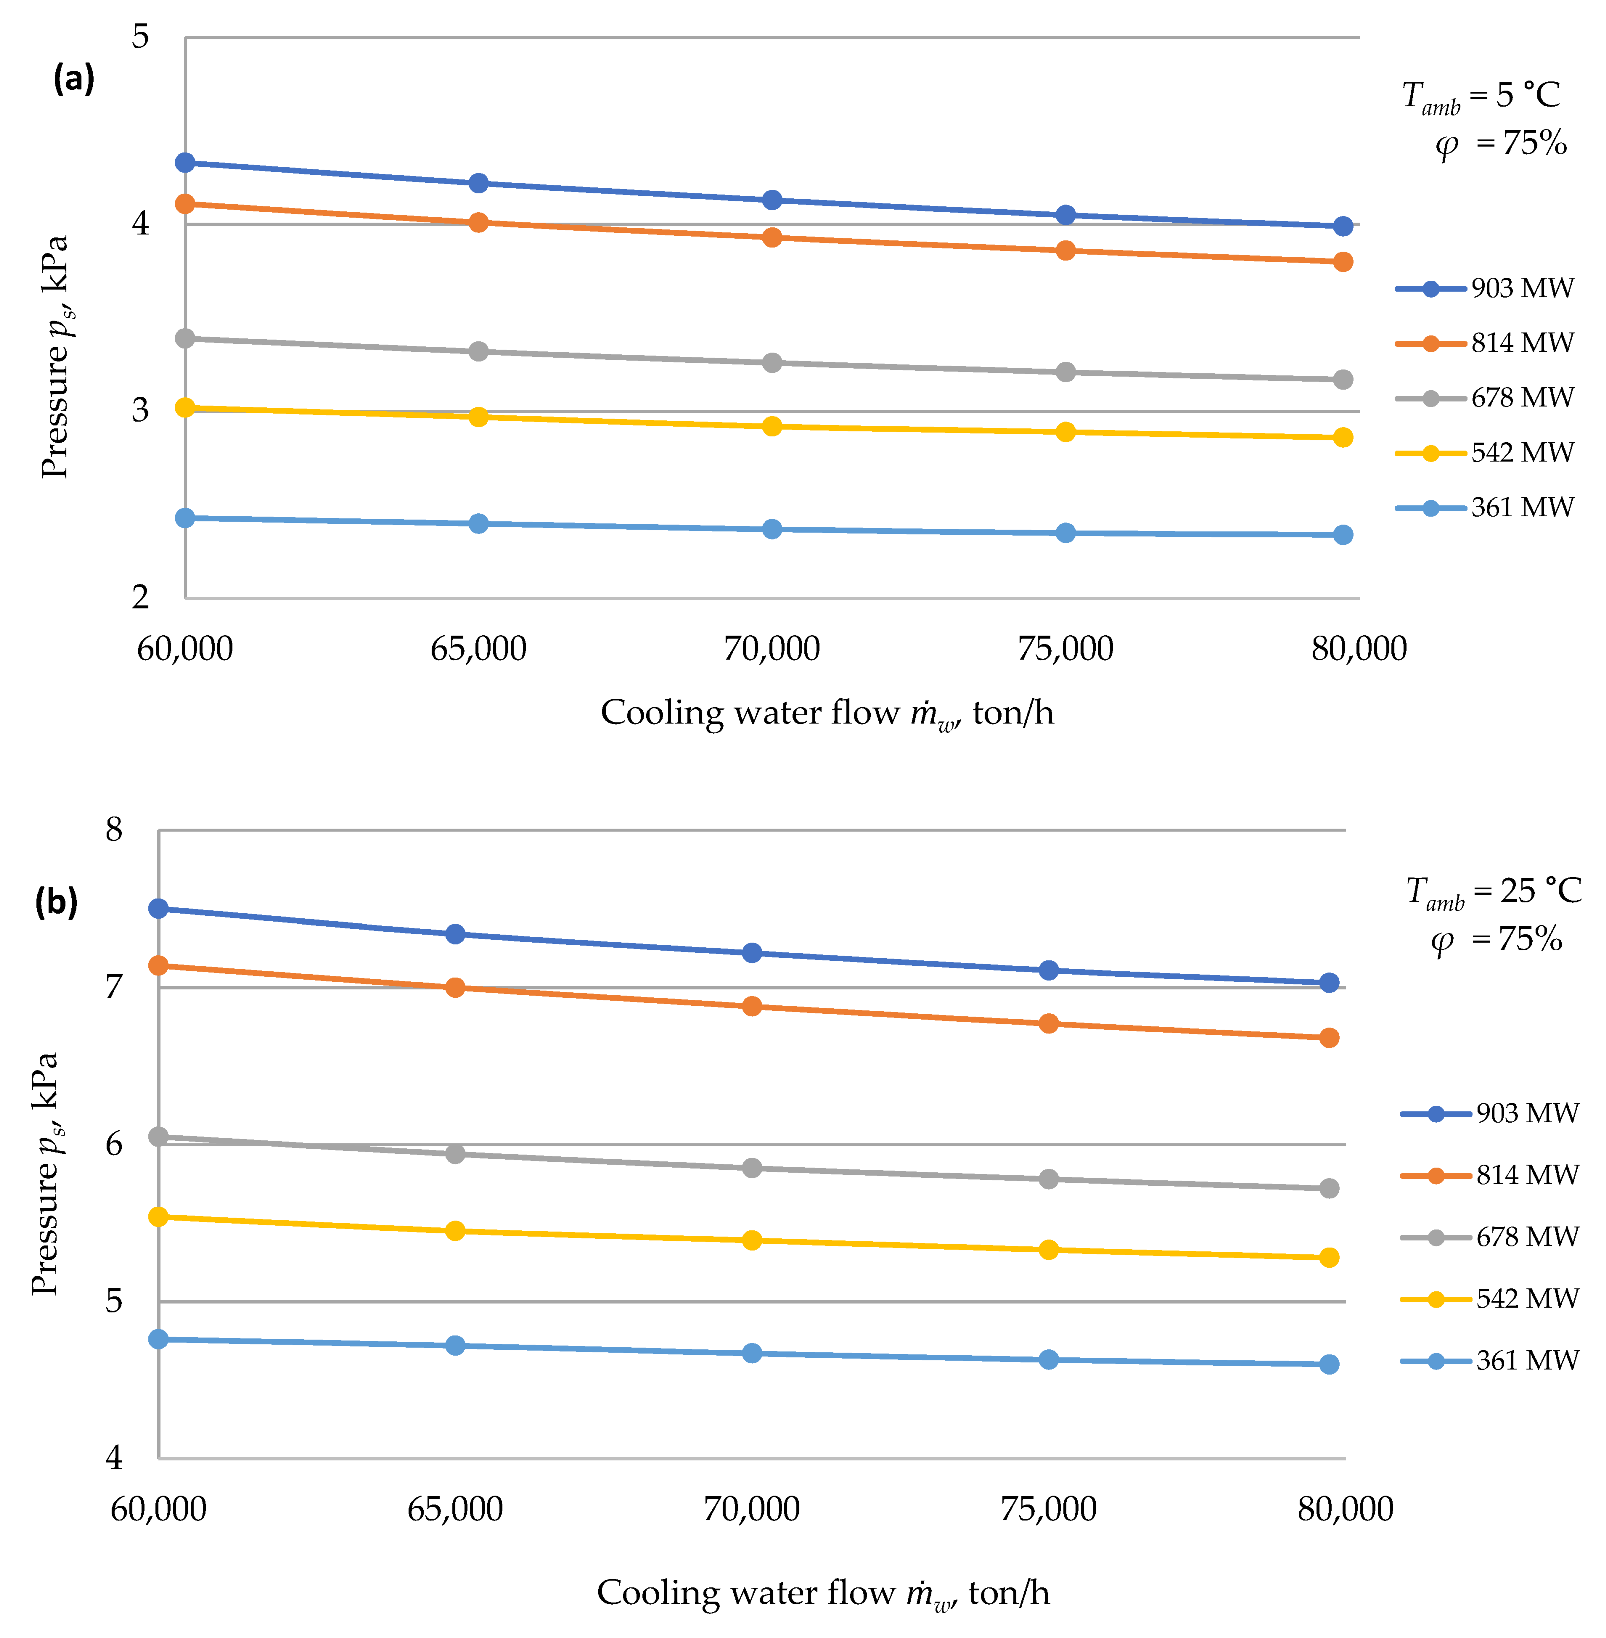
- (e)
- The condenser vapour pressure value is most significantly affected by the power unit load and ambient temperature. In the range of changes analysed, the effect of ṁw on ps is clearly smaller. At Tamb = 25 °C, the range of these changes is 0.5 kPa for the power of 903 MW and 0.16 kPa for the lowest power of 361.7 MW. At Tamb = 5 °C, these changes are 0.34 kPa and 0.08 kPa, respectively. In the range of changes in ṁw analysed, their effect on water loss due to evaporation is also negligibly small and less than 0.5% of ṁev.
- (f)
- Figure 12 shows the changes in turbine generator unit power resulting from the increase in condenser pressure. At extremely different temperatures Tamb and thus ps, the reduction in turbine generator unit power can be 8–10% of the rated value. The calculations also show that at low power unit loads of 360–400 MW and at low temperatures Tamb, less than 10 °C, it is possible to reduce the cooling water flux and obtain an increase in the net power of the unit. This increase is due to a reduction in cooling water pump power. This issue requires further studies for the power units analysed.
Author Contributions
Funding
Institutional Review Board Statement
Informed Consent Statement
Data Availability Statement
Acknowledgments
Conflicts of Interest
Abbreviations
| Latin Symbols: | |
| B | power output (in general), [MWe] |
| B5, B6 | power output of power unit no. 5/6, [MWe] |
| cw | specific heat of water, [kJ/(kg K)] |
| F | inner surface area of the cooling tower shell at the top edge of the air inlet [m2] |
| Fr | Froude number |
| g | Earth’s acceleration, [m/s2] |
| He | effective height of the cooling tower [m] |
| ia1, ia2 | air enthalpy at the inlet/outlet to the cooling tower, [kJ/kg] |
| ia,i | air enthalpy, [kJ/kg] |
| ia,m | air average enthalpy, [kJ/kg] |
| ia | air enthalpy in the fillings, [kJ/kg] |
| iLP | enthalpy of LP-steam [kJ/kg] |
| IN | atmospheric coefficient, |
| ṁa | air flux, [m3/h] |
| ṁev | evaporative loss flux, [ton/h] |
| ṁloss | evaporation and drift loss fluxes, [ton/h] |
| ṁLP | steam flux from LP-part of turbine [ton/h] |
| ṁw | cooling water flux, [ton/h] |
| ṁs | boiler fresh steam flux, [kg/s] |
| Me | Merkel number |
| p | steam pressure, [MPa] |
| pb | barometric pressure, [Pa] |
| ps | saturation pressure, [Pa] |
| heat flux from condensing steam to cooling water [W] | |
| Ta,m | air average temperature, [°C] |
| Tamb | ambient temperature, [°C] |
| TLP | temperature of steam from the LP part of the turbine, [°C] |
| temperature of steam-saturated air above the fillings [°C] | |
| tw,m | average water temperature, [°C] |
| tw1, tw2 | inlet/outlet water temperature at the cooling tower, [°C] |
| wm | average air velocity under the cooling tower fillings, [m/s] |
| Xa,i | air moisture of air surrounding the cooling towers |
| Xa,m | air moisture of saturated air |
| FDG | Flue Gas Desulfurization |
| RH | relative humidity, [%] |
| NDWCT | natural draft wet cooling tower |
| NDHCT | natural draft hybrid cooling tower |
| CCS | carbon capture and storage |
| CSP | concentrating solar power |
| WTP | water treatment plant |
| LP | low pressure part of steam turbine |
| Greek Symbols: | |
| ∆ | increment symbol |
| ηe | power unit net efficiency |
| Λ | number of ventilations |
| ζ | coefficient of resistance to air flow through the cooling tower |
| φ | relative air humidity, [%] |
| ρa1, ρa1 | air density at the inlet/outlet to the cooling tower, [kg/m3] |
| ρam | air average density of moist air in front of the cooling tower and above the fillings, [kg/m3] |
| ρasm | dry air average density, [kg/m3] |
References
- Macknick, J.; Newmark, R.; Heath, G.; Hallett, K.C. Operational water consumption and withdrawal factors for electricity generating technologies: A review of existing literature. Environ. Res. Lett. 2012, 7, 045802. [Google Scholar] [CrossRef]
- Xia, L.; Li, J.; Ma, W.; Gurgenci, H.; Guan, Z.; Wang, P. Water Consumption Comparison between a Natural Draft Wet Cooling Tower and a Natural Draft Hybrid Cooling Tower—An Annual Simulation for Luoyang Conditions. Heat Transf. Eng. 2017, 38, 1034–1043. [Google Scholar] [CrossRef]
- He, W.; Zhang, J.; Li, H.; Liu, S.; Wang, Y.; Lv, B.; Wei, J. Optimal thermal management of server cooling system based cooling tower under different ambient temperatures. Appl. Therm. Eng. 2022, 207, 118176. [Google Scholar] [CrossRef]
- García Cutillas, C.; Ruiz Ramírez, J.; Lucas Miralles, M. Optimum Design and Operation of an HVAC Cooling Tower for Energy and Water Conservation. Energies 2017, 10, 299. [Google Scholar] [CrossRef]
- Song, Y.; Wu, G.; Song, B. Analysis of drift loss and concentration change of wet cooling tower. In IOP Conference Series: Earth and Environmental Science; IOP Publishing: Bristol, UK, 2020; Volume 569, p. 012059. [Google Scholar]
- Song, B. Numerical analysis on the effects of water spraying on cooling tower evaporation and drift. In IOP Conference Series: Earth and Environmental Science; IOP Publishing: Bristol, UK, 2020; Volume 529, p. 012004. [Google Scholar]
- Rubio-Castro, E.; Serna-González, M.; Ponce-Ortega, J.M.; Morales-Cabrera, M.A. Optimization of mechanical draft counter flow wet-cooling towers using a rigorous model. Appl. Therm. Eng. 2011, 31, 3615–3628. [Google Scholar] [CrossRef]
- Gao, M.; Zou, J.; He, S.; Sun, F. Thermal performance analysis for high level water collecting wet cooling tower under cross wind conditions. Appl. Therm. Eng. 2018, 136, 568–575. [Google Scholar] [CrossRef]
- Zhang, Z.; Gao, M.; Wang, M.; Guan, H.; Dang, Z.; He, S.; Sun, F. Field test study on thermal and ventilation performance fornatural draft wet cooling tower after structural improvement. Appl. Therm. Eng. 2019, 155, 305–312. [Google Scholar] [CrossRef]
- Alavi, S.R.; Rahmati, M. Experimental investigation on thermal performance of natural draft wet cooling towers employing an innovative wind-creator setup. Energy Convers. Manag. 2016, 122, 504–514. [Google Scholar] [CrossRef]
- Lu, Y.; Guan, Z.; Gurgenci, H.; Hooman, K.; He, S.; Bharathan, D. Experimental study of crosswind effects on the performance of small cylindrical natural draft dry cooling towers. Energy Convers. Manag. 2015, 91, 238–248. [Google Scholar] [CrossRef]
- Zhou, Y.; Gao, M.; Long, G.; Zhang, Z.; Dang, Z.; He, S.; Sun, F. Experimental study regarding the effects of forced ventilation on the thermal performance for super-large natural draft wet cooling towers. Appl. Therm. Eng. 2019, 155, 40–48. [Google Scholar] [CrossRef]
- Klimanek, A.; Cedzich, M.; Białecki, R. 3D CFD modeling of natural draft wet-cooling tower with flue gas injection. Appl. Therm. Eng. 2015, 91, 824–833. [Google Scholar] [CrossRef]
- Wu, T.; Ge, Z.; Yang, L.; Du, X. Flow deflectors to release the negative defect of natural wind on large scale dry cooling tower. Int. J. Heat Mass Transf. 2019, 128, 248–269. [Google Scholar] [CrossRef]
- Chen, X.; Sun, F.; Chen, J.; Gao, M. Novel method for improving the cooling performance of natural draft wet cooling towers. Appl. Therm. Eng. 2019, 147, 562–570. [Google Scholar] [CrossRef]
- Gao, M.; Sun, F.; Wang, K.; Shi, Y.; Zhao, Y. Experimental research of heat transfer performance on natural draft counter flow wetcooling tower under cross-wind conditions. Int. J. Therm. Sci. 2008, 47, 935–994. [Google Scholar] [CrossRef]
- Chen, K.; Sun, F.; Zhang, L.; Chen, X.; Zhang, X. A sensitivity-coefficients method for predicting thermal performance of natural draft wet cooling towers under crosswinds. Appl. Therm. Eng. 2022, 206, 118105. [Google Scholar] [CrossRef]
- Zhou, Y.; Wang, K.; Gao, M.; Dang, Z.; He, S.; Sun, F. Experimental study on the drag characteristic and thermal performance of non-uniform fillings for wet cooling towers under crosswind conditions. Appl. Therm. Eng. 2018, 140, 398–405. [Google Scholar] [CrossRef]
- Ardekani, M.A.; Farhani, F.; Mazidi, M. Effects of Cross Wind Conditions on Efficiency of Heller Dry Cooling Tower. Exp. Heat Transf. 2015, 28, 344–353. [Google Scholar] [CrossRef]
- Lu, Y.; Guan, Z.; Gurgenci, H.; Alkhedhair, A.; He, S. Experimental investigation into the positive effects of a tri-blade-like windbreak wall on small size natural draft dry cooling towers. Appl. Therm. Eng. 2016, 105, 1000–1012. [Google Scholar] [CrossRef]
- Lucas, M.; Martínez, P.J.; Viedma, A. Experimental determination of drift loss from a cooling tower with different drift eliminatorsusing the chemical balance method. Int. J. Refrig. 2012, 35, 1779–1788. [Google Scholar] [CrossRef]
- Buryn, Z.; Kuczuk, A.; Pospolita, J.; Smejda, R.; Widera, K. Impact of Weather Conditions on the Operation of Power Unit Cooling Towers 905 MWe. Energies 2021, 14, 6412. [Google Scholar] [CrossRef]
- He, S.; Gurgenci, H.; Guan, Z.; Hooman, K.; Zou, Z.; Sun, F. Comparative study on the performance of natural draft dry, pre-cooled and wet cooling towers. Appl. Therm. Eng. 2016, 99, 103–113. [Google Scholar] [CrossRef]
- Zembaty, W. Systemy i Urządzenia Chłodzące Elektrowni Cieplnych [Cooling Systems and Devices of Thermal Power Plants]; WNT: Warsaw, Poland, 1993; p. 337. (In Polish)
- Picardo, J.R.; Variyar, J.E. The Merkel equation revisited: A novel method to compute the packed height of a cooling tower. Energy Convers. Manag. 2012, 57, 167–172. [Google Scholar] [CrossRef]
- Yuan, W.; Sun, F.; Liu, R.; Chen, X.; Li, Y. The Effect of Air Parameters on the Evaporation Loss in a Natural Draft Counter-Flow Wet Cooling Tower. Energies 2020, 13, 6174. [Google Scholar] [CrossRef]
- Badanie Wilgotności Gazów na Przykładzie Powietrza [Testing the Moisture of Gases Using Air as an Example]. Available online: http://home.agh.edu.pl/~{}pawelzak/lab/badanie_wilg_gazow.pdf (accessed on 15 May 2021).
- Kruskal, W.H.; Wallis, W.A. Use of ranks in one-criterion variance analysis. J. Am. Stat. Assoc. 1952, 47, 583–621. [Google Scholar] [CrossRef]
- Corder, G.W.; Foreman, D.I. Nonparametric Statistics for Non-Statisticians; John Wiley & Sons: Hoboken, NJ, USA, 2009; pp. 99–105. [Google Scholar]
- Divine, G.W.; Norton, H.J.; Barón, A.E.; Juarez-Colunga, E. The Wilcoxon–Mann–Whitney Procedure Fails as a Test of Medians. Am. Stat. 2018, 72, 278–286. [Google Scholar] [CrossRef]
- Radzik, T.; Miełek, Ł.; Cholewa, R.; Kusa, M. Report on the In-Service Measurements of Power Unit 5 in PGE GiEK S.A. Opole Power Plant Branch, Part 1/5. Turbogenerator and Power Unit Thermal Measurements. Ref. No. 120/ZC/2021. ZP-BE Energopomiar Sp. z o.o. Gliwice; Energopomiar: Gliwice, Poland, 2021. (In Polish) [Google Scholar]
- Miełek, Ł.; Cholewa, R.; Kusa, M. Report on the Measurements to Determine the Characteristics of the Influence of the Outlet Steam Pressure Change on the Power and Specific Heat Consumption of Power Units no. 5 and 6 in PGE GiEK S.A. Opole Power Plant Branch. No. 169/ZC/2021. ZP-BE Energopomiar Sp. z o.o. Gliwice; Energopomiar: Gliwice, Poland, 2021. (In Polish) [Google Scholar]
- Standard EN 14705:2005; Heat Exchangers—Method of Measurement and Evaluation of Thermal Performances of Wet Cooling Towers. Comite Europeen de Normalisation: Brussels, Belgium, 2015.


| Wind Speed | Number of Data | Mean Values | p-Value | ||||
|---|---|---|---|---|---|---|---|
| Tamb = 7 ± 1 °C | B5 + B6 | ṁloss(5 + 6) | tw2 | ||||
| 1 | 28 | 7.006 | 909.304 | 742.599 | 15.850 | 0.818 | |
| 2 | 69 | 7.072 | 1054.557 | 885.605 | 15.835 | 0.841 | |
| 3 | 40 | 6.896 | 1090.670 | 981.192 | 16.289 | 0.908 | |
| 4 | 27 | 7.035 | 1141.913 | 1042.283 | 16.386 | 0.939 | |
| test | Kruskal-Wallis | H(3) = 13.0509 | 0.0045 | ||||
| Media | df = 3; χ2 = 11.9345 | 0.0076 | |||||
| Wind Speed | Number of Data | Mean Values | p-value | ||||
| Tamb = 15 ± 1 °C | B5 + B6 | ṁloss(5 + 6) | tw2 | ||||
| 1 | 33 | 14.816 | 910.027 | 797.715 | 21.300 | 0.837 | |
| 2 | 89 | 15.015 | 1244.289 | 1180.559 | 21.261 | 0.930 | |
| 3 | 60 | 15.211 | 1235.232 | 1260.130 | 21.169 | 1.032 | |
| 4 | 35 | 14.928 | 1170.516 | 1124.718 | 20.373 | 0.973 | |
| test | Kruskal-Wallis | H(3) = 12.4542 | 0.0060 | ||||
| Median | df = 3; χ2 = 8.65443 | 0.0343 | |||||
| Wind Speed | Number of Data | Mean Values | p-value | ||||
| Tamb = 22 ± 1 °C | B5 + B6 | tw2 | |||||
| 1 | 45 | 22.039 | 1076.775 | 1221.596 | 25.383 | 1.124 | |
| 2 | 138 | 21.931 | 1171.848 | 1383.292 | 25.393 | 1.195 | |
| 3 | 74 | 21.889 | 1282.604 | 1546.713 | 25.200 | 1.236 | |
| 4 | 28 | 21.800 | 1317.031 | 1564.848 | 25.112 | 1.212 | |
| test | Kruskal-Wallis | H(3) = 1.70131 | |||||
| Median | df = 3; χ2 = 2.17466 | ||||||
Publisher’s Note: MDPI stays neutral with regard to jurisdictional claims in published maps and institutional affiliations. |
© 2022 by the authors. Licensee MDPI, Basel, Switzerland. This article is an open access article distributed under the terms and conditions of the Creative Commons Attribution (CC BY) license (https://creativecommons.org/licenses/by/4.0/).
Share and Cite
Pospolita, J.; Kuczuk, A.; Widera, K.; Buryn, Z.; Cholewa, R.; Drajczyk, A.; Pietrucha, M.; Smejda, R. Water Losses in the Condenser Cooling System at the 905 MWe Power Unit. Energies 2022, 15, 5969. https://doi.org/10.3390/en15165969
Pospolita J, Kuczuk A, Widera K, Buryn Z, Cholewa R, Drajczyk A, Pietrucha M, Smejda R. Water Losses in the Condenser Cooling System at the 905 MWe Power Unit. Energies. 2022; 15(16):5969. https://doi.org/10.3390/en15165969
Chicago/Turabian StylePospolita, Janusz, Anna Kuczuk, Katarzyna Widera, Zbigniew Buryn, Robert Cholewa, Andrzej Drajczyk, Mirosław Pietrucha, and Rafał Smejda. 2022. "Water Losses in the Condenser Cooling System at the 905 MWe Power Unit" Energies 15, no. 16: 5969. https://doi.org/10.3390/en15165969
APA StylePospolita, J., Kuczuk, A., Widera, K., Buryn, Z., Cholewa, R., Drajczyk, A., Pietrucha, M., & Smejda, R. (2022). Water Losses in the Condenser Cooling System at the 905 MWe Power Unit. Energies, 15(16), 5969. https://doi.org/10.3390/en15165969