
Innovative Energy Technologies in Road Transport in Selected EU Countries


Abstract
:1. Introduction
2. Literature Review
- Manufacturing novel products or improvement of existing products;
- Use of new production methods;
- Opening of a new sales market;
- Development of a novel type of product;
- Acquisition of new sources of raw materials or intermediate goods;
- Creation of a new branch organisation.
- (1)
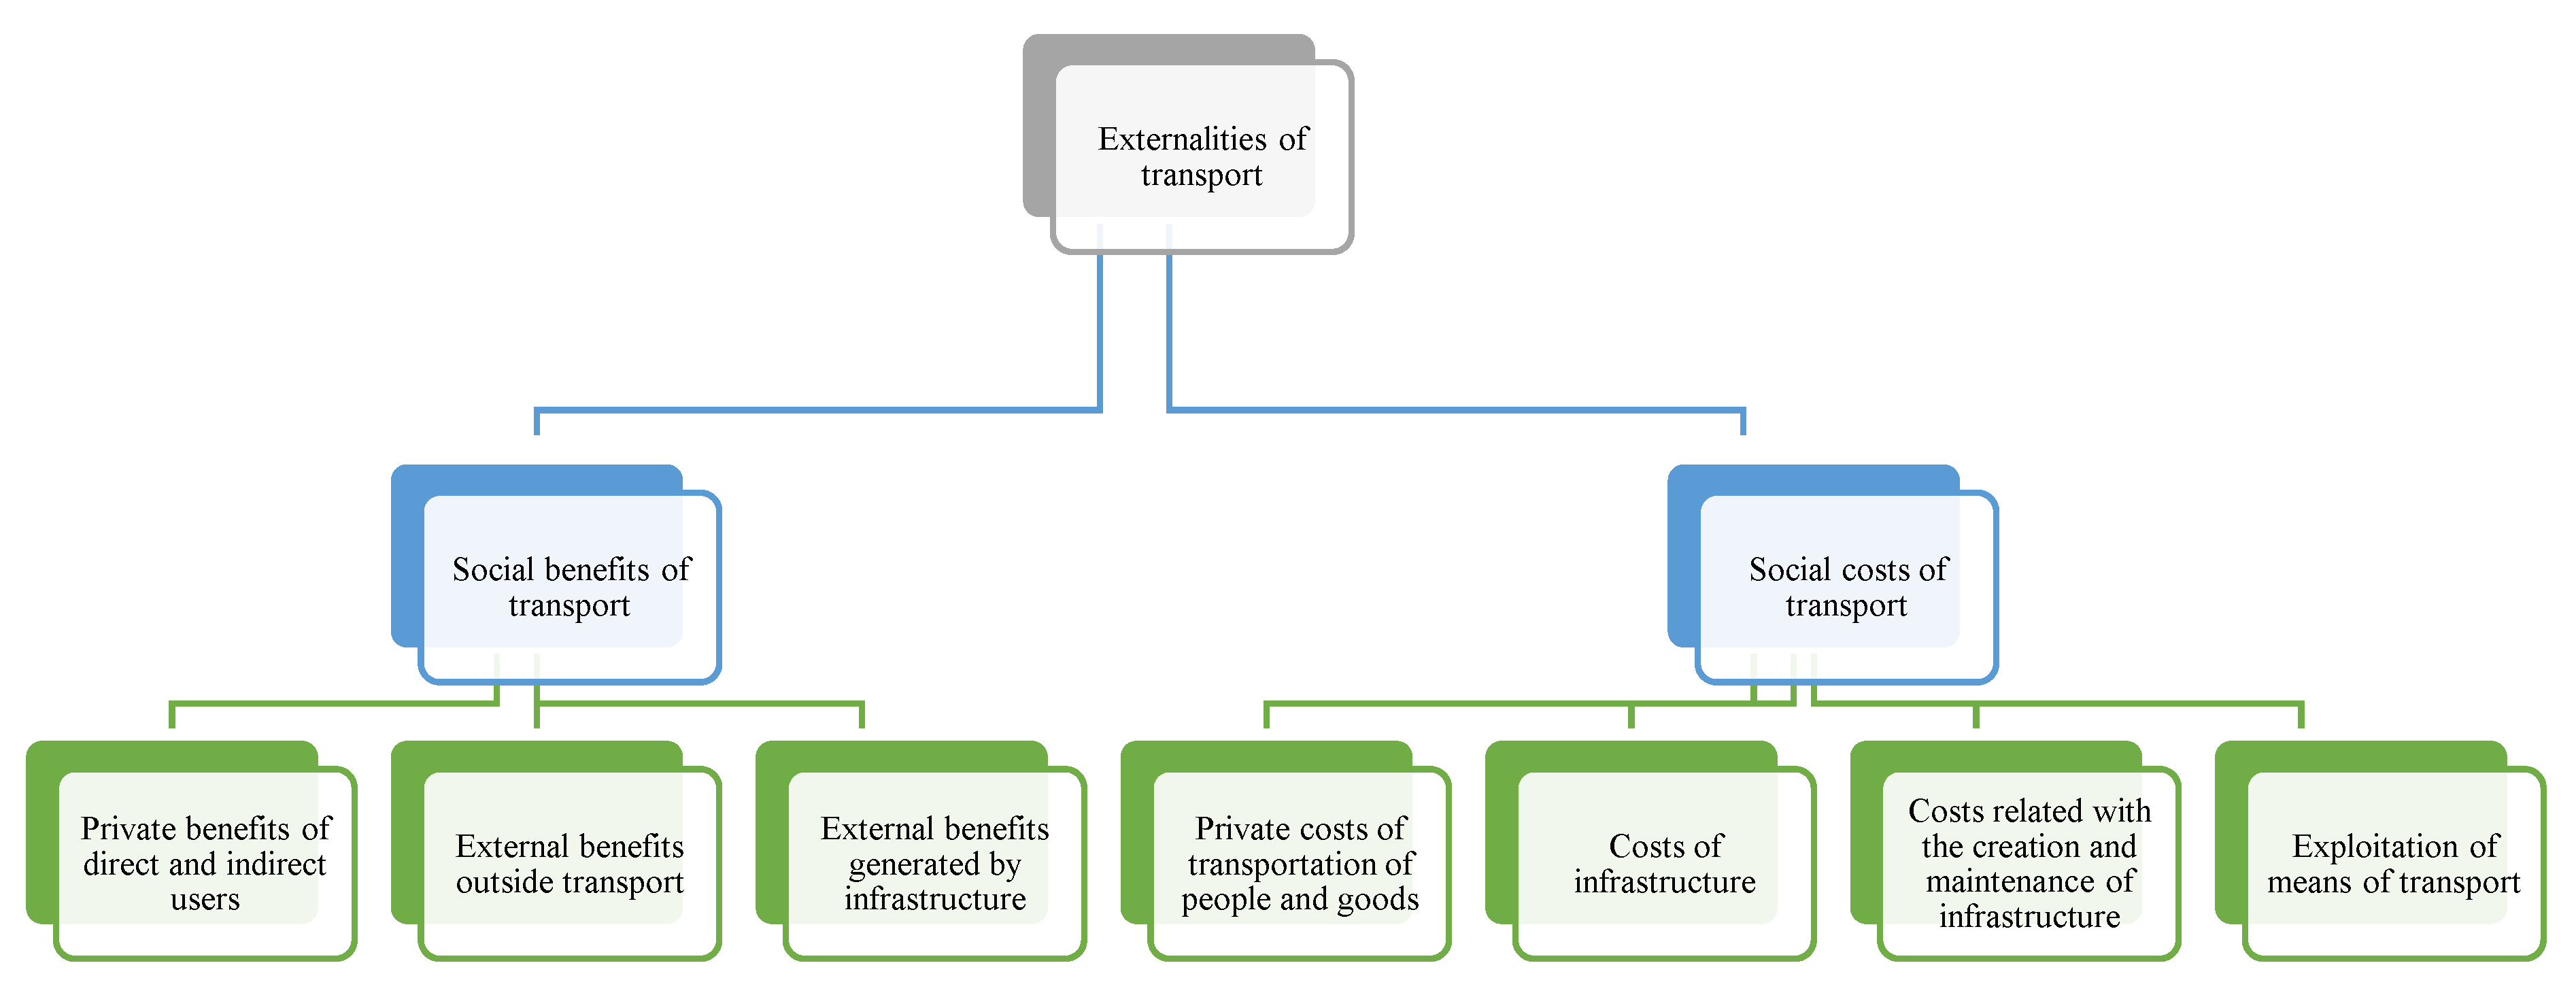
- Benefits for users:
- Changes in the duration of travel;
- Change in the maintenance costs of vehicles;
- Effect on traffic safety.
- (2)
- Effects of transport networks:
- Creation of new traffic options;
- Intrasector shifts in demand;
- Improved reliability of transport;
- Quality of transport services.
- (3)
- Socio-economic effects:
- Changes in availability;
- Changes in employment within the region;
- Changes in efficiency and production;
- Changes in social integration;
- Changes in property value.
- (4)
- Environmental effects.
- (1)
- By 2030:
- A minimum of 30 million zero-emission vehicles will be introduced onto European roads;
- 100 European cities will be climate neutral;
- High-speed rail transport will increase twofold;
- Regular public transport up to 500 km should be CO2 emission neutral within the EU;
- Extensive implementation of automated mobility;
- Preparation for zero-emission ships to be on the market.
- (2)
- By 2035:
- Preparation for launching of zero-emission large aircraft onto the market.
- (3)
- By 2050:
- Almost all passenger vehicles, transport vehicles, buses and new heavy-duty lorries will be zero emission;
- Rail freight will increase twofold;
- Traffic of high-speed trains will increase threefold;
- Multimodal Trans-European Transport Network (TEN-T) will be equipped for sustainable and smart transport, ensuring fast connections.
- (1)
- Limiting the energy demand of transport, e.g., modal shifts (individual private transport towards public transport, air transport towards high-speed rail, road transport towards waterway transport), through remote work, changes in prices, operational improvements or other solutions related to demand.
- (2)
- Improvement of efficiency through electrification, hybrid systems and upgraded engines.
- (3)
- Transition to energy carriers with lower carbon dioxide emissions, such as renewable energy or sustainable biofuels, e.g., bioethanol, biodiesel, biomethane, hydrogenated vegetable oil (HVO) and fatty acid methyl esters (FAME) [55].
- Transport methods and technologies;
- Planning, organisation and management of transport systems;
- Financing of transport in relation both to the maintenance and modernisation of existing resources, as well as new infrastructure, vehicle fleets and other resources.
3. Material and Methods
- x1—the share of renewable energy sources used in transport in 2019 (in %);
- x2—the share in the market of electric passenger vehicles in 2019 (in %);
- x3—the share in the market of electric lorries in 2019 (in %);
- x4—the share in the market of hybrid passenger vehicles in 2019 (in %);
- x5—the share in the market of hybrid lorries in 2019 (in %);
- x6—average CO2 (carbon dioxide) emission from new automobiles in 2019 (in g CO2/km);
- x7—average CO2 emission from new lorries in 2019 (in g CO2/km).
- Zij—normalised value of j-th variable for i-th object (here, an EU country).
- xij—value of j-th variable in i-th object;
- maxi xij–mini xij—range of j-th variable.
4. Results and Discussion
- This market increased by 3.6 million cars, reaching 9 million cars in 2019;
- In the same period, the number of sold diesel engine automobiles dropped by almost 2 million;
- The number of electric cars within the 6-year period increased to 458,915 vehicles;
- In 2019, the number of sold hybrid electric vehicles was 720,260 higher compared to the year 2014.
- Sweden was the country characterised by the highest share (in %) of use of renewable energy sources in transport and the share (in %) in the market of electric lorries.
- The greatest share (in %) in the market of electric passenger vehicles was recorded in the Netherlands, while it was lowest in Estonia.
- In as many as 14 countries (AT, CZ, EE, GR, HU, IE, LV, NL, PL, PT, RO, SK, SI, SW), the share (in %) in the market of hybrid lorries was 0.00.
- The lowest average CO2 emissions (in g CO2/km) from new passenger cars were recorded in the Netherlands, while from new lorries the lowest emissions were recorded in Portugal.
5. Conclusions
Author Contributions
Funding
Institutional Review Board Statement
Informed Consent Statement
Data Availability Statement
Conflicts of Interest
References
- Rask, K.N. Clean air and renewable fuels: The market for fuel ethanol in the US from 1984 to 1993. Energy Econ. 1998, 20, 325–345. [Google Scholar] [CrossRef]
- Skogstad, G. Mixed feedback dynamics and the USA renewable fuel standard: The roles of policy design and administrative agency. Policy Sci. 2020, 53, 349–369. [Google Scholar] [CrossRef]
- Meisel, K.; Milliniger, M.; Naumann, K.; Müller-Langer, F.; Majer, S.; Thrän, D. Future Renewable Fuel Mixes in Transport in Germany under RED II and Climate Protection Targets. Energies 2020, 13, 1712. [Google Scholar] [CrossRef]
- Wołek, M.; Wolański, M.; Bartłomiejczyk, M.; Wyszomirski, O.; Grzelec, K.; Hebela, K. Ensuring sustainable development of urban public transport: A case study of the trolleybus system in Gdynia and Sopot (Poland). J. Clean. Prod. 2021, 279, 123807. [Google Scholar] [CrossRef]
- Scarpellini, S.; Valero, A.; Llera, E.; Aranda, A. Multicriteria analysis for the assessment of energy innovations in the transport sector. Energy 2013, 57, 160–168. [Google Scholar] [CrossRef]
- Sovacool, B.K.; Noel, L.; Kester, J.; de Rubens, G.Z. Reviewing Nordic transport challenges and climate policy priorities: Expert perceptions of decarbonisation in Denmark, Finland, Iceland, Norway, Sweden. Energy 2018, 165, 532–542. [Google Scholar] [CrossRef]
- Saboori, B.; Sapri, M.; bin Baba, M. Economic growth, energy consumption and CO2 emissions in OECD (Organization for Economic Co-operation and Development)’s transport sector: A fully modified bi-directional relationship approach. Energy 2014, 66, 150–161. [Google Scholar] [CrossRef]
- Sorlei, I.S.; Bizon, N.; Thounthong, P.; Varlam, M.; Carcadea, E.; Culcer, M.; Iliescu, M.; Raceanu, M. Fuel cell electric vehicles—A brief review of current topologies and energy management strategies. Energies 2021, 14, 252. [Google Scholar] [CrossRef]
- Mounce, R.; Nelson, J.D. On the potential for one-way electric vehicle car-sharing in future mobility systems. Transp. Res. Part A Policy Pract. 2019, 120, 17–30. [Google Scholar] [CrossRef]
- Yildiz, A.; Özel, M.A. A Comparative Study of Energy Consumption and Recovery of Autonomous Fuel-Cell Hydrogen–Electric Vehicles Using Different Powertrains Based on Regenerative Braking and Electronic Stability Control System. Appl. Sci. 2021, 11, 2515. [Google Scholar] [CrossRef]
- Bartolozzi, I.; Rizzi, F.; Frey, M. Comparison between hydrogen and electric vehicles by life cycle assessment: A case study in Tuscany, Italy. Appl. Energy 2013, 101, 103–111. [Google Scholar] [CrossRef]
- Talebpour, A.; Mahmassani, H.S. Influence of connected and autonomous vehicles on traffic flow stability and throughput. Transp. Res. Part C Emerg. Technol. 2016, 71, 143–163. [Google Scholar] [CrossRef]
- Bansal, P.; Kockelman, K.M. Forecasting Americans’ long-term adoption of connected and autonomous vehicle technologies. Transp. Res. Part A Policy Pract. 2017, 95, 49–63. [Google Scholar] [CrossRef]
- Schumpeter, J.A. Teoria Rozwoju Gospodarczego; Wydawnictwo Naukowe PWN: Warsaw, Poland, 1960; Volume 104. [Google Scholar]
- Wojciechowski, M. Innowacje w samorządzie terytorialnym. In Innowacje 2015. Rozwój Społeczeństwa Informacyjnego w Nowej Perspektywie Finansowej; Nowak, P.A., Ed.; Urząd Marszałkowski Województwa Łódzkiego: Łódź, Poland, 2015; pp. 117–126. Available online: http://bcpw.bg.pw.edu.pl/Content/5963 (accessed on 5 July 2022).
- Kaczmarek, B. Współczesne Wyzwania dla Zarządzania Przedsiębiorstwami; Towarzystwo Naukowe Organizacji i Kierownictwa Dom Organizatora: Toruń, Poland, 2013; Volume 55. [Google Scholar]
- Freeman, C. The Economics of Industrial Innowation; F. Pinter: London, UK, 1982; Volume 7. [Google Scholar]
- Jashapara, A. Zarządzanie Wiedzą; Wydawnictwo Naukowe PWN: Warsaw, Poland, 2006; Volume 91. [Google Scholar]
- OECD Eurostat. Oslo Manual 2018: Guidelines for Collecting and Interpreting Innovation Data, 3rd ed.; The Measurement of Scientific and Technological Activities OECD Publishing: Paris, France, 2018. [Google Scholar]
- OECD Eurostat. Oslo Manual 2018: Guidelines for Collecting, Reporting and Using Data on Innovation, 4th ed.; The Measurement of Scientific, Technological and Innovation Activities OECD Publishing: Paris, France; Eurostat: Luxembourg, 2018. [Google Scholar]
- Łyżwa, E. Innowacyjność Przedsiębiorstw a Konkurencyjność Regionów; Wydawnictwo Uniwersytetu Jana Kochanowskiego: Kielce, Poland, 2014; Volume 75. [Google Scholar]
- Główny Urząd Statystyczny. Pojęcia Stosowane w Statystyce Publicznej. Available online: https://stat.gov.pl/metainformacje/slownik-pojec/pojecia-stosowane-w-statystyce-publicznej/4253,pojecie.html (accessed on 5 July 2022).
- International Renewable Energy Agency. Innovation Priorities to Transform the Energy System—An Overview for Policy Makers; International Renewable Energy Agency: Abu Dhabi, United Arab Emirates, 2018; Volume 23, Available online: https://www.irena.org/-/media/Files/IRENA/Agency/Publication/2018/May/IRENA_Innovation_priorities_2018.pdf (accessed on 5 July 2022).
- Zawada, M.; Pabian, A.; Felicjan, B.; Chichobłaziński, L. Innowacje w sektorze energetycznym. In Zeszyty Naukowe Politechniki Częstochowskiej. Zarządzanie; Politechnika Częstochowska: Częstochowoa, Poland, 2015; Volume 9, pp. 8–17. [Google Scholar]
- Pearson, M.M. 3-Local Government and Firm Innovation in China’s Clean Energy Sector. In Policy, Regulation and Innovation in China’s Electricity and Telecom Industries; Brandt, L., Rawski, T.G., Eds.; Cambridge University Press: Cambridge, UK, 2019. [Google Scholar]
- Stec, S.; Szymańska, E.J. Energy innovation of polish local governments. Energies 2022, 15, 1414. [Google Scholar] [CrossRef]
- Okraszewska, E. Znaczenie i uwarunkowania innowacji w sektorze energetycznym. In Współczesne Problemy Ekonomiczne w Badaniach Młodych Naukowców; Gruszewska, E., Matel, A., Kuzionko-Ochrymiuk, E., Eds.; Zarządzanie Organizacją, Finanse i Inwestycje; Polskie Towarzystwo Ekonomiczne: Białystok, Poland, 2018; Volume 2, pp. 49–52. [Google Scholar]
- Stan, C. Alternative Propulsion for Automobiles; Springer International Publishing: Cham, Switzerland, 2017. [Google Scholar]
- Boulouchos, K.; Sturm, P.; Kretzschmar, J.; Duić, N.; Laurikko, J.K.; Bradshaw, A.M.; Harmacher, T.; Bettzüge, M.O.; Giannopoulos, G.A.; Poutré, H.L.; et al. Decarbonisation of Transport: Options and Challenges; EASAC Policy Report 37; EASAC: Halle, Germany, 2019; Volume 9. [Google Scholar]
- Schafer, A. Regularities in travel demand—An international perspective. J. Transp. Stat. 2000, 3, 1–31. Available online: https://www.bts.gov/archive/publications/journal_of_transportation_and_statistics/volume_03_number_03/paper_01/index (accessed on 25 June 2022).
- EC. Horizon 2020 Transport Programme. 2018. Available online: https://ec.europa.eu/programmes/horizon2020/en/area/transport (accessed on 3 July 2022).
- Key Figures on Europe; Publications Office of the European Union: Luxembourg, 2021.
- Lozzi, G.; Cré, I.; Ramos, C. Relaunching Transport and Tourism in the EU after COVID-19; European Parliament’s Committee on Transport and Tourism: Brussel, Belgium, 2022; Volume 13. [Google Scholar]
- Kamińska, T. Koszty i korzyści zewnętrzne transportu. Cz. 1. Przegląd Komunikacyjny. 1998, 7, 10–16. [Google Scholar]
- Huderek-Glapska, S. Efekty zewnętrzne transportu. Aspekty teoretyczne. Zesz. Nauk. Uniw. Szczecińskiego. Probl. Transp. I Tur. 2014, 25, 83–97. [Google Scholar]
- Puławska, S. Koszty zewnętrzne w polityce transportowej Unii Europejskiej. Transport i Ochrona Środowiska 2008, 5–6, 46–52. [Google Scholar]
- Petrović, N.; Jovanović, V.; Nikolić, B.; Pavlović, J.; Mihajlović, J. A comparative analysis of road and rail freight transport through the Republic of Serbia from the aspect of external costs. Acta Tech. Jaurinensis 2022. [Google Scholar] [CrossRef]
- Szałankiewicz, K. A Comparative Analysis of the Costs of Transport Service Using Own Fleet and the Transport of an External Company. Ph.D. Thesis, Zakład Inżynierii Systemów Transportowych i Logistyki, Warsaw, Poland, 2021. [Google Scholar]
- Van Essen, H.; Fiorello, D.; El Beyrouty, K.; Bieler, C.; van Wijngaarden, L.; Schroten, A.; Parolin, R.; Brambilla, M.; Sutter, D.; Maffii, S.; et al. Handbook on the External Costs of Transport, Version 2019; Publications Office of the European Union: Luxembourg, 2020. [Google Scholar]
- Heggie, I.G. Management and financing of roads. World Bank Tech. Pap. 1995, 275, 1–155. [Google Scholar]
- Rothengatter, W. External effects of transport. In A Analytical Transport Economics; Polak, J.H., Ed.; Edward Elgar Publishing: Cheltenham, UK, 2000; Volume 88, pp. 79–116. [Google Scholar]
- Mishan, E.J. The postwar literature on externalities: An interpretative essay. J. Econ. Lit. 1971, 9, 1–28. [Google Scholar]
- Poliński, J. Identyfikacja, estymacja i internalizacja kosztów zewnętrznych transportu. Probl. Kolejnictwa 2012, 156, 33–67. [Google Scholar]
- Kisielińska, J.; Roman, M.; Pietrzak, P.; Roman, M.; Łukasiewicz, K.; Kacperska, E. Utilization of Renewable Energy Sources in Road Transport in EU Countries—TOPSIS Results. Energies 2021, 14, 7457. [Google Scholar] [CrossRef]
- Raczyński, J. Koszty Zewnętrzne w Polityce Rozwoju Transportu. Tech. Transportu Szynowego Forum Producentów Konstruktorów Użytkowników 2003, 7–8, 12–17. [Google Scholar]
- Alonso Raposo, M.; Ciuffo, B.; Alves Dias, P.; Ardente, F.; Aurambout, J.; Baldini, G.; Baranzelli, C.; Blagoeva, D.; Bobba, S.; Braun, R.; et al. The Future of Road Transport—Implications of Automated, Connected, Low-Carbon and Shared Mobility. EUR 29748 EN; Publications Office of the European Union: Luxembourg, 2019. [Google Scholar] [CrossRef]
- Szaruga, E. Rationalization of the energy consumption of road transport for sustainable development. Sci. J. Marit. Univ. Szczec. 2020, 62, 36–42. [Google Scholar]
- Szaruga, E.; Załoga, E. Rationalization of energy intensity of road transport of member countries of the International Energy Agency. In Challenges of Urban Mobility, Transport Companies and Systems, Proceedings of the 2018 TranSopot Conference, Sopot, Poland, 28–30 May 2018; Springer: Berlin/Heidelberg, Germany, 2019. [Google Scholar]
- EUR-Lex. Traktat Ustanawiający Europejską Wspólnotę Energii Atomowe. 2022, Dz.U.2004.90.864/3. Available online: https://lexlege.pl/traktat-ustanawiajacy-europejska-wspolnote-energii-atomowej/ (accessed on 15 July 2022).
- Communication from the Commission to the European Parliament and the Council, A Clean Planet for all. A European Strategic Long-Term Vision for a Prosperous, Modern, Competitive and Climate Neutral Economy, COM(2018)773, 28 November 2018. Available online: https://www.eumonitor.eu/9353000/1/j9vvik7m1c3gyxp/vktvm72o8kyq. (accessed on 15 July 2022).
- European Commission. Energy Roadmap 2050; Publications Office of the European Union: Luxembourg, 2012. [Google Scholar]
- European Parliament. Energy Policy—General Principles. Available online: https://www.europarl.europa.eu/factsheets/pl/sheet/68/polityka-energetyczna-zasady-ogolne (accessed on 15 July 2022).
- European Commission. The European Green Deal. Available online: https://ec.europa.eu/info/strategy/priorities-2019-2024/european-green-deal_en (accessed on 28 July 2021).
- European Commission. Komunikat Komisji do Parlamentu Europejskiego, Rady, Europejskiego Komitetu Ekonomiczno-Społecznego I Komitetu Regionów Strategia na Rzecz Zrównoważonej i Inteligentnej Mobilności—Europejski Transport na Drodze ku Przyszłości. Available online: https://data.consilium.europa.eu/doc/document/ST-14012-2020-INIT/pl/pdf (accessed on 28 June 2022).
- Możliwości Dekarbonizacji Transportu do 2030 r. Available online: https://kib.pl/wp-content/uploads/2019/04/Ecofys-Navigant-2019-Dekarbonizacja-transportu_PL_final_.pdf (accessed on 29 June 2022).
- Cascetta, E. Transportation Systems Analysis, Models and Applications; Springer: Berlin/Heidelberg, Germany, 2009. [Google Scholar] [CrossRef]
- Szymanski, P.; Ciuffo, B.; Fontaras, G.; Martini, G.; Pekar, F. The future of road transport in Europe. Environmental implications of automated, connected and low-carbon mobility. Combust. Engines 2021, 186, 3–10. [Google Scholar] [CrossRef]
- Innowacyjność w Transporcie do 2020 Roku—Podstawowe Pojęcia i Tezy. Fundacja Centrum Analiz Transportowych i Infrastrukturalnych (CATI), Warszawa, Listopad 2012. Available online: https://cati.org.pl/download/INNOWACJE/Innowacje%20transportowe%20definicja.pdf (accessed on 5 July 2022).
- Patel, N.; Bhoi, A.K.; Padmanaban, S.; Holm-Nielsen, J.B. Pojazdy Elektryczne: Nowoczesne Technologie i Trendy; Springer: Singapore, 2021; pp. 285–292. [Google Scholar]
- Faraz, A.; Ambikapathy, S.; Thangavel, K.; Logavani, G.A. Prasad, Battery Electric Vehicles (BEVs). In Electric Vehicles, Green Energy and Technology; Springer: Singapore, 2021; pp. 137–150. [Google Scholar]
- Energy Innovation Needs Assessment. In Road Transport; Department for Business, Energy and Industrial Strategy: London, UK, 2019; pp. 10–11.
- Sulatisky, M.; Hill, S.; Lung, B. Dual-Fuel Hydrogen Pickup Trucks, World Hydrogen Energy Conference Lyon 2006. Available online: https://citeseerx.ist.psu.edu/viewdoc/download?doi=10.1.1.604.180&rep=rep1&type=pdf (accessed on 30 June 2022).
- Briguglio, N.; Andaloro, L.; Ferraro, M.; Antonucci, V. Fuel Cell Hybrid Electric Vehicles. In Electric Vehicles—The Benefits and Barriers; Soylu, S., Ed.; IntechOpen: London, UK, 2011; Volume 6. [Google Scholar]
- Shadidi, B.; Najafi, G.; Yusaf, T. A Review of Hydrogen as a Fuel in Internal Combustion Engines. Energies 2021, 14, 6209. [Google Scholar] [CrossRef]
- Duan, Z.; Zhang, L.; Feng, L.; Yu, S.; Jiang, Z.; Xu, X.; Hong, J. Research on Economic and Operating Characteristics of Hydrogen Fuel Cell Cars Based on Real Vehicle Tests. Energies 2021, 14, 7856. [Google Scholar] [CrossRef]
- Burchart-Korol, D.; Gazda-Grzywacz, M.; Zarębska, K. Research and Prospects for the Development of Alternative Fuels in the Transport Sector in Poland: A Review. Energies 2020, 13, 2988. [Google Scholar] [CrossRef]
- Sterlepper, S.; Fischer, M.; Claßen, J.; Huth, V.; Pischinger, S. Concepts for Hydrogen Internal Combustion Engines and Their Implications on the Exhaust Gas Aftertreatment System. Energies 2021, 14, 8166. [Google Scholar] [CrossRef]
- Lin, P.S. Connected Vehicles and Autonomous Vehicles: Where Do ITE Members Stand. ITE J. 2013, 83, 12. [Google Scholar]
- Neufville, R.; Abdalla, H.; Abbas, A. Potential of Connected Fully Autonomous Vehicles in Reducing Congestion and Associated Carbon Emissions. Sustainability 2022, 14, 6910. [Google Scholar] [CrossRef]
- Ahmed, H.U.; Huang, Y.; Lu, P.; Bridgelall, R. Technology Developments and Impacts of Connected and Autonomous Vehicles: An Overview. Smart Cities 2022, 5, 382–404. [Google Scholar] [CrossRef]
- Walters, J.G.; Marsh, S.; Rodrigues, L. Planning Perspectives on Rural Connected, Autonomous and Electric Vehicle Implementation. Sustainability 2022, 14, 1477. [Google Scholar] [CrossRef]
- Alam, M.S.; Georgakis, P. The State of the Art of Cooperative and Connected Autonomous Vehicles from the Future Mobility Management Perspective: A Systematic Review. Future Transp. 2022, 2, 589–604. [Google Scholar] [CrossRef]
- Kacperska, E.; Łukasiewicz, K.; Pietrzak, P. Use of Renewable Energy Sources in the European Union and the Visegrad Group Countries—Results of Cluster Analysis. Energies 2021, 14, 5680. [Google Scholar] [CrossRef]
- Strzała, K.; Przechlewski, T. Ekonometria Inaczej; Wydawnictwo Uniwersytetu Gdańskiego: Gdańsk, Polska, 1994. [Google Scholar]
- Stanisz, A. Przystępny kurs Statystyki z Zastosowaniem STATISTICA PL na Przykładach z Medycyny; Analizy Wielowymiarowe; StatSoft: Cracow, Poland, 2007; Volume 3. [Google Scholar]
- Gostkowski, M.; Rokicki, T.; Ochnio, L.; Koszela, G.; Wojtczuk, K.; Ratajczak, M.; Szczepaniuk, H.; Bórawski, P.; Bełdycka-Bórawska, A. Clustering Analysis of Energy Consumption in the Countries of the Visegrad Group. Energies 2021, 14, 5612. [Google Scholar] [CrossRef]
- Kukuła, K. Propozycja budowy rankingu obiektów z wykorzystaniem cech ilościowych oraz jakościowych. Metod. Ilościowe W Bad. Ekon. 2012, 1, 5–16. [Google Scholar]
- Fischer, R.; Elfgren, E.; Toffolo, A. Energy Supply Potentials in the Northern Counties of Finland, Norway and Sweden towards Sustainable Nordic Electricity and Heating Sectors: A Review. Energies 2018, 11, 751. [Google Scholar] [CrossRef]
- National Energy and Climate Strategy of Finland for 2030. Available online: https://www.iea.org/policies/6367-national-energy-and-climate-strategy-of-finland-for-2030 (accessed on 12 June 2022).


| Variable | x1 | x2 | x3 | x4 | x5 | x6 | x7 |
|---|---|---|---|---|---|---|---|
| x1 | 1.00 | 0.81 * | 0.76 * | 0.60 * | 0.37 | 0.10 | 0.28 |
| x2 | 0.81 * | 1.00 | 0.76 * | 0.53 * | 0.34 | −0.27 | 0.27 |
| x3 | 0.76 * | 0.76 * | 1.00 | 0.38 | 0.37 | −0.04 | 0.24 |
| x4 | 0.60 * | 0.53 * | 0.38 | 1.00 | 0.29 | 0.15 | 0.22 |
| x5 | 0.37 | 0.34 | 0.37 | 0.29 | 1.00 | 0.02 | 0.01 |
| x6 | 0.10 | −0.27 | −0.04 | 0.15 | 0.02 | 1.00 | 0.56 * |
| x7 | 0.28 | 0.27 | 0.24 | 0.22 | 0.01 | 0.56 * | 1.00 |
| Country | 2014 | 2015 | 2016 | 2017 | 2018 | 2019 | 2014 = 100 |
|---|---|---|---|---|---|---|---|
| AT | 10.98 | 11.41 | 10.58 | 9.70 | 9.93 | 10.05 | 91.51 |
| BE | 5.85 | 3.92 | 6.03 | 6.64 | 6.71 | 6.82 | 116.63 |
| CZ | 7.00 | 6.54 | 6.50 | 6.62 | 6.56 | 7.84 | 112.06 |
| DK | 6.56 | 6.43 | 6.73 | 6.94 | 6.92 | 7.11 | 108.45 |
| EE | 0.42 | 0.41 | 0.43 | 0.42 | 3.32 | 6.24 | 1493.54 |
| FI | 24.12 | 24.56 | 8.81 | 18.67 | 14.77 | 14.32 | 59.36 |
| FR | 8.25 | 8.37 | 8.41 | 8.77 | 8.96 | 9.25 | 112.11 |
| GE | 6.90 | 6.57 | 7.01 | 7.03 | 7.94 | 7.63 | 110.58 |
| GR | 1.33 | 1.10 | 1.62 | 4.00 | 4.11 | 4.05 | 305.35 |
| HU | 7.00 | 7.17 | 7.77 | 7.73 | 7.75 | 8.06 | 115.08 |
| IE | 5.20 | 5.94 | 5.16 | 7.44 | 7.19 | 8.92 | 171.35 |
| IT | 5.02 | 6.51 | 7.41 | 6.48 | 7.66 | 9.05 | 180.22 |
| LV | 4.08 | 3.64 | 2.45 | 2.27 | 4.73 | 4.55 | 111.75 |
| NL | 6.56 | 5.60 | 4.76 | 5.84 | 9.48 | 12.33 | 187.81 |
| PL | 6.32 | 5.69 | 3.97 | 4.23 | 5.72 | 6.20 | 98.12 |
| PT | 3.67 | 7.43 | 7.65 | 7.91 | 9.04 | 9.09 | 247.86 |
| RO | 4.68 | 5.49 | 6.17 | 6.56 | 6.34 | 7.85 | 167.83 |
| SK | 7.95 | 8.63 | 7.77 | 6.95 | 6.99 | 8.31 | 104.49 |
| SI | 2.88 | 2.24 | 1.60 | 2.57 | 5.48 | 7.98 | 277.57 |
| SE | 1.02 | 1.09 | 5.17 | 5.80 | 6.94 | 7.61 | 743.16 |
| SW | 18.83 | 21.49 | 26.56 | 26.84 | 29.70 | 30.31 | 160.95 |
| Min. | 0.42 | 0.41 | 0.43 | 0.42 | 3.32 | 4.05 | 59.36 |
| Average | 6.89 | 7.15 | 6.79 | 7.59 | 8.39 | 9.22 | 241.70 |
| Max. | 24.12 | 24.56 | 26.56 | 26.84 | 29.70 | 30.31 | 1493.54 |
| Engine Type | 2014 | 2015 | 2016 | 2017 | 2018 | 2019 | 2014 = 100 |
|---|---|---|---|---|---|---|---|
| Petroleum | 5,358,452 | 6,036,564 | 6,800,116 | 7,563,739 | 8,521,418 | 8,964,034 | 167.29 |
| Diesel | 6,599,462 | 7,039,611 | 7,175,630 | 6,617,051 | 5,402,079 | 4,650,558 | 70.47 |
| Electrically charged including: | 69,958 | 148,027 | 155,634 | 218,083 | 300,258 | 458,915 | 655.99 |
| • Electric batteries; | 37,517 | 59,165 | 63,479 | 97,667 | 147,428 | 284,812 | 759.15 |
| • Plug-in hybrids. | 32,441 | 88,862 | 92,155 | 120,416 | 152,830 | 174,103 | 536.68 |
| Hybrid Electric Vehicles | 176,525 | 218,755 | 278,729 | 426,769 | 598,462 | 896,785 | 508.02 |
| Fuel cell | 38 | 176 | 123 | 253 | 266 | 535 | 1407.89 |
| Natural gas (CNG) | 97,214 | 78,511 | 57,609 | 49,553 | 65,023 | 68,581 | 70.55 |
| Other (LPG + E85) | 141,452 | 140,321 | 118,430 | 156,710 | 164,270 | 187,378 | 132.47 |
| Country | x1 | x2 | x3 | x4 | x5 | x6 | x7 |
|---|---|---|---|---|---|---|---|
| AT | 0.23 | 0.22 | 0.36 | 0.15 | 0.00 | 0.23 | 0.10 |
| BE | 0.11 | 0.20 | 0.16 | 0.04 | 0.07 | 0.34 | 0.35 |
| CZ | 0.14 | 0.01 | 0.04 | 0.03 | 0.00 | 0.13 | 0.07 |
| DK | 0.12 | 0.27 | 0.28 | 0.15 | 1.00 | 0.61 | 0.55 |
| EE | 0.08 | 0.00 | 0.00 | 0.49 | 0.00 | 0.09 | 0.47 |
| FI | 0.39 | 0.45 | 0.12 | 1.00 | 0.07 | 0.52 | 0.23 |
| FR | 0.20 | 0.17 | 0.64 | 0.19 | 0.29 | 0.56 | 0.64 |
| GE | 0.14 | 0.18 | 0.84 | 0.24 | 0.07 | 0.06 | 0.06 |
| GR | 0.00 | 0.01 | 0.00 | 0.28 | 0.00 | 0.51 | 0.48 |
| HU | 0.15 | 0.11 | 0.08 | 0.28 | 0.00 | 0.05 | 0.43 |
| IE | 0.19 | 0.26 | 0.48 | 0.55 | 0.00 | 0.55 | 0.51 |
| IT | 0.19 | 0.04 | 0.20 | 0.27 | 0.50 | 0.40 | 0.55 |
| LV | 0.02 | 0.01 | 0.00 | 0.44 | 0.00 | 0.16 | 0.33 |
| NL | 0.32 | 1.00 | 0.64 | 0.34 | 0.00 | 1.00 | 0.04 |
| PL | 0.08 | 0.01 | 0.04 | 0.39 | 0.00 | 0.04 | 0.12 |
| PT | 0.19 | 0.37 | 0.20 | 0.13 | 0.00 | 0.69 | 1.00 |
| RO | 0.14 | 0.04 | 0.04 | 0.17 | 0.00 | 0.26 | 0.47 |
| SK | 0.16 | 0.01 | 0.08 | 0.13 | 0.00 | 0.00 | 0.00 |
| SI | 0.15 | 0.04 | 0.12 | 0.00 | 0.00 | 0.28 | 0.21 |
| SE | 0.14 | 0.07 | 0.32 | 0.54 | 0.21 | 0.35 | 0.69 |
| SW | 1.00 | 0.75 | 1.00 | 0.53 | 0.00 | 0.39 | 0.40 |
| Variable | Cluster 1 | Cluster 2 | Cluster 3 | Cluster 4 |
|---|---|---|---|---|
| x1 | 18.98% | 8.50% | 6.16% | 8.11% |
| x2 | 11.07% | 3.18% | 0.75% | 1.92% |
| x3 | 1.57% | 0.98% | 0.17% | 0.77% |
| x4 | 9.53% | 6.07% | 6.47% | 3.85% |
| x5 | 0.03% | 0.47% | 0.00% | 0.03% |
| x6 | 111.13 g CO2/km | 114.95 g CO2/km | 126.95 g CO2/km | 127.33 g CO2/km |
| x7 | 166.13 g CO2/km | 150.50 g CO2/km | 160.40 g CO2/km | 169.53 g CO2/km |
Publisher’s Note: MDPI stays neutral with regard to jurisdictional claims in published maps and institutional affiliations. |
© 2022 by the authors. Licensee MDPI, Basel, Switzerland. This article is an open access article distributed under the terms and conditions of the Creative Commons Attribution (CC BY) license (https://creativecommons.org/licenses/by/4.0/).
Share and Cite
Kraciuk, J.; Kacperska, E.; Łukasiewicz, K.; Pietrzak, P. Innovative Energy Technologies in Road Transport in Selected EU Countries. Energies 2022, 15, 6030. https://doi.org/10.3390/en15166030
Kraciuk J, Kacperska E, Łukasiewicz K, Pietrzak P. Innovative Energy Technologies in Road Transport in Selected EU Countries. Energies. 2022; 15(16):6030. https://doi.org/10.3390/en15166030
Chicago/Turabian StyleKraciuk, Jakub, Elżbieta Kacperska, Katarzyna Łukasiewicz, and Piotr Pietrzak. 2022. "Innovative Energy Technologies in Road Transport in Selected EU Countries" Energies 15, no. 16: 6030. https://doi.org/10.3390/en15166030