Article

Porosity and Permeability Model of a Regionally Extending Unit (Upper Miocene Sandstones of the Western Part of Sava Depression, Croatia) Based on Vintage Well Data

Faculty of Mining Geology and Petroleum Engineering, University of Zagreb, Pierottijeva 6, HR-10000 Zagreb, Croatia
*
Author to whom correspondence should be addressed.
Energies 2022, 15(16), 6066; https://doi.org/10.3390/en15166066
Submission received: 6 July 2022 / Revised: 17 August 2022 / Accepted: 18 August 2022 / Published: 21 August 2022

Abstract

:
The deep saline aquifer (DSA) Poljana in the Upper Pannonian Poljana Sandstones of Sava depression, the SW part of the Pannonian basin system, was identified as a potential CO2 storage object in previous works. Its boundaries have been redefined and its general model further developed, including the areal distribution of porosity based on analyses of 23 well logs. The sandstones were deposited in turbiditic and deltaic facies that caused considerable variations of porosity, which was further influenced by diagenetic processes. A comparison of altogether 355 pairs of porosity and permeability measurements on core plugs from 16 wells indicated 2 different sets of samples: impermeable samples with effective porosities reaching 18% and permeable samples which showed correlation between porosity and permeability. Accordingly, the permeability model was developed as semi-categorical with two categories: the first category comprising parts of DSA Poljana with porosity values exceeding 18%, where permeability was correlated with porosity, although with limited reliability, and the second category comprising model cells with porosity values below the threshold of 18%, where permeability should not be correlated with porosity due to the appearance of impermeable values. This approach enabled delineation of areas where permeability can be estimated with greater certainty, which is of utmost importance for the planning and development of CO2 storage projects and/or energy storage projects with respect to fluid injectivity. This approach can be used in areas with similar geological settings and limited datasets as an important step from regional capacity estimations towards the detailed, local-scale investigations.

Graphical Abstract

1. Introduction

In spite of the strong political support instigated by the international scientific community (e.g., [1,2]), the energy transition has shown to be rather slow [3], even in the highly developed countries that have pledged to take the lead. Over the last two decades, it evolved into a gradual process with multiple learning curves, found to be unavoidable. One of these involves the roll out of the carbon capture and geological storage (CCS) technology that is to be piloted, demonstrated, and upscaled until 2030 and fully developed by 2050, while simultaneously exploring possibilities for underground energy storage, including hydrogen storage, that are both crucial for effective transition to renewable energy sources. Planned uptake of CCS technology, as well as underground hydrogen storage, gravely depends on exploration of the subsurface geological formations that have regionally extending reservoir properties that are the basic prerequisite for the construction of the underground storage objects. The CO2 geological storage resource clearly depends on natural settings—composition and structure of deep rock formations that up to now used to be studied mostly in petroleum exploration. In this exploration process, various geological and geophysical data are validated, interpreted, and integrated, and results are illustrated by the construction of specific subsurface maps. These maps depict various characteristics, such as structures, properties of geological formations, or anything else that is important for the exploration of targeted resources in the deep subsurface.
When investigating the potential for CO2 geological storage on a regional scale, one of the first and most important steps is to reliably define its static storage capacity. This capacity is considered “theoretical” according to the concept of the techno-economic resource pyramid [4,5], because it includes the estimate of a total pore space in a specific porous and permeable stratigraphic unit that is deep enough to contain supercritical CO2 and is covered by a regional cap rock formation. Such a unit is usually referred to as a “deep saline aquifer” (DSA). Since only a fraction of its pores could even theoretically be filled with injected CO2, the total pore space is further reduced by using the “storage efficiency factor”, as explained by [5,6,7,8]. Techniques of such numerical estimation are fairly simple, as described in many works (e.g., [9,10,11,12]). Their simplicity is because, like any regional exploration, it all comes to the construction of maps of the effective thickness of a reservoir, mean depth, temperature, pressure, and its porosity, which is crucial for CO2 storage capacity, yet a rather difficult parameter to estimate. Further exploration is targeted towards the estimation of permeability, which affects injectivity [13,14] as well as pressure buildup (e.g., [15]) and is equally as important for CO2 storage as for hydrogen storage or energy storage. Reconstruction of regional distribution of porosity and permeability are challenging problems, and this paper provides one approach to their solution.
In the century of petroleum exploration, a standard procedure to characterize reservoir geometry and properties was developed, but on a scale of a specific hydrocarbon reservoir. Similar methods would apply to an underground storage object in well-investigated areas, such as a depleted oil or gas field or a structurally defined aquifer, with the addition of stability analysis, i.e., the investigation of reservoir geo-mechanical behavior during CO2/hydrogen injection [16,17]. It is not such a straightforward task for the regionally extending formations with a lack of data or with a large and inhomogeneous dataset, which would require extensive preparatory works even before the interpretation aimed at detailed characterization. It is not particularly demanding to define parameters such as effective thickness and areal extension of a regional deep saline aquifer, while it is more difficult to reliably estimate its porosity. Namely, porosity values in sandstone formations predominantly depend upon the grain size, shape, rounding, and the level of sorting, as well as upon various diagenetic processes that might have taken place in geological history. These are the mechanical processes, including compaction, plastic deformation, brittle deformation, fracture evolution, and geochemical processes, such as dissolution and reprecipitation [18]. Porosity and permeability in sandstones can be reduced (e.g., [19]) or preserved, sometimes even enhanced by diagenesis [20,21]. Generally, it is not possible to directly access to what extent each of these processes influenced the values of porosity and permeability, nor to establish a correlation between the processes and reservoir properties, mainly due to the complexity of interconnected processes and the lack of regional data. Therefore, establishing the porosity model always represents a demanding task, and a permeability model even more so.
There has been an increase of studies using advanced methods, such as computed tomography [22,23,24], to better assess the petrophysical properties of reservoir rocks. The problem with wider use of this approach is the availability of equipment as well as the availability of the core samples from deep wells that are usually unattainable for researchers outside the oil and gas industry. In the case of the absence of a sufficient amount of core samples, a digital rock sample model could be developed [25]. Development of a permeability model is particularly problematic, and the novel approach includes a combination of computational fluid dynamics and hybrid machine learning methods [26].
Regarding the methods to predict the spatial distribution of petrophysical properties of deep saline aquifers, the proposed approach is based on the traditional correlation between porosity and permeability, similar to [27] for permeability model A, but also takes into consideration the influence of grain size (permeability model B) and irreducible water saturation (permeability model C). There are more novel approaches applying stochastic inversion to multiple-source geophysical data, as proposed in [28]. The principal problem with this approach is data availability. Namely, the mentioned research used synthetic data. It is not clear how reliable the results would be using the real data if they were available. Data availability is a pronounced problem for DSA characterization and that fact is obvious from simulation studies that use synthetic reservoirs [29] or very simplified DSA characterization, such as in [30]. Therefore, with data availability being a major problem for the reliable characterization of deep saline aquifers, the use of simplified methods may be the only solution.
The study area is situated in the western part of Sava depression (SW part of the Pannonian basin, in continental Croatia). The investigated unit is of Late Pannonian age, when the thick sandstone-shale sequence developed that contains several medium- to fine-grained sandstone bodies deposited in a protected environment of a semi-isolated lake or deep embayment of Paratethys [31,32].
The presented approach to the development of porosity and permeability models of deep saline aquifers is applicable for the characterization of regional clastic deep saline aquifers in mature basins where vintage data are available. An overview of three different yet similar approaches (all are based on the porosity model) to permeability estimation is provided and their weaknesses discussed. All three methods may seem oversimplified, but based on the experience of participation in several EC-funded projects on CO2 geological storage (mainly limited to estimation of CO2 storage capacity, e.g., EUGeoCapacity, ECCO-European value chain for CO2, CO2StoP, Strategy CCUS), the authors very often experienced a lack of data on deep saline aquifers that would enable the development of petrophysical models, which are crucial for focusing on further exploration and development of CO2 storage projects. The porosity model is crucial for meaningful CO2 storage capacity estimates and the permeability model enables delineation of areas with higher injectivity. The proposed methods show the possible ways to address this problem even with the limited dataset consisting of vintage data. In that respect, the suggested approach could be used for regional estimates of CO2 storage potential in similar geological settings and with the similar dataset limitations.

2. Geological Setting

Late Miocene in continental Croatia is characterized by the post-rift thermal subsidence of the Pannonian basin [33,34]. The brackish to freshwater Lake Pannon is characterized by the onset of sedimentation in shallow to deep open lake environments [35]. The rest of the Lake Pannon infill is presented with a deltaic progradation basin architecture [36]. Turbidite system sediments, in front of the delta slope, contain sandstones intercalated with siltstones deposited as sand lobes and channel fill of considerable thickness. Turbiditic successions are overlain by a shale-prone delta slope and sandy delta front to coastal plain sediments [37]. The history of petroleum exploration left this up to 3 km-thick sequence of sandstone, silt, and marl layers, described in an elaborate scheme of lithostratigraphic units with prevailingly sandstone sections separated by the marl/silty marl sections, all on a rank of a lithostratigraphic member [38]. These members were grouped in formations based on their common lithological or depositional characteristics. In this way, defined sandstone members became units where the largest number of oil and gas reservoirs were discovered. Since in the beginning they also meant the largest reserves in continental Croatia, they are usually referred to as the most prolific unit—the “regional petroleum reservoirs”.
Upper Miocene (Pannonian) sediments filling in the Sava depression are the 2000–3000 m-thick sequence of medium- to fine-grained sandstone and marl layers. Their lithostratigraphic units are shown in Figure 1. In decades of petroleum exploration, the Upper Pannonian Okoli and Iva Sandstones of Ivanić Grad formation and the Poljana Sandstones of Kloštar Ivanić formation were found to be the most prolific, and therefore also called the “regional petroleum reservoirs”. That is why these layers were the most drilled and the largest number of cores was taken and analyzed, which makes up the principal, albeit vintage, dataset for this analysis. Elaborate subsurface mapping and sedimentological analyses revealed that these layers were deposited in the beginning as turbidites and transitioned into the pro-delta and deltaic environments. These stacked sandstone layers are mostly elongated in the direction of paleo-transport, and have variable thickness, grain size, and porosity. On the other hand, the complex structural setting of the Sava depression as an elongated, asymmetric half-graben resulted in pronounced variations of depth, particularly in dip directions along several structures. The Poljana Sandstones member (green in Figure 1) comprises one to five layers of sandstones, varying in thickness and granulometry. The sandstones are covered by Graberski marl (Figure 1), the unit that is continuous within the study area, with thickness exceeding 20 m. This unit is proven to be efficient cap rock for hydrocarbons, but its sealing properties for carbon dioxide are yet to be demonstrated. Whereas the influence of depth and thickness variability on geological storage capacity estimates was investigated in [39], the influence of porosity has not been considered, and a single average value was used to characterize the whole regional deep saline aquifer.

3. Porosity Estimates

When assessing the CO2 geological storage potential of a certain region, the starting point is to estimate the storage capacity of regionally extending units—deep saline aquifers (DSA). As mentioned before, it is rather simple to define the values of depth and effective thickness and to map areal extension of DSA, while it is a more complex task to make a reliable estimation of porosity.
In the case when sparse data do not enable any detailed modeling, the simple volumetric approach developed by NETL and introduced in the US DOE Carbon Sequestration Atlas of the USA and Canada [40] is usually used. This approach does not consider porosity variability, but a single average number is used, which can be somewhat problematic in areas with significant porosity variability. Actually, the reliable estimate of the average porosity value of a reservoir is one of the classical problems in petroleum development geology.
A somewhat different approach to the problem of porosity was presented in [41] in The Queensland CO2 Geological Storage Atlas. The porosity values were estimated based on the correlation between the porosity and the depth of sandstones, representing the deep saline aquifer. The same approach was used in [27] for the purpose of estimating the capacity of the Mount Simon sandstone aquifer. This approach assumes that porosity is mainly dependent upon compaction, which is usually true, but for some geological settings represents an oversimplification. The relationship is dependent upon the reservoir pressure gradient, with the reservoirs with a hydrostatic pressure gradient generally showing higher correlation coefficients [42]. As well as the reservoir pressure gradient, the relationship mostly depends on the extent of other processes that reduce the porosity during diagenesis, and their contribution is much more complex to assess. It usually requires an ample dataset of sedimentological analyses to correctly determine the mineralogic composition of grains, cement, or matrix, and to estimate groundwater flow and mineralization, all of which are controlling factors of diagenetic processes in the deep subsurface.
Upper Pannonian Poljana Sandstones constituting the DSA Poljana, like all Upper Miocene sandstones in the Sava depression, are heterogeneous, with porosity values differing considerably within the same layer. That is why particular attention must be paid to the problem of defining the areal distribution of this attribute. As previously mentioned, Upper Miocene sandstones were deposited in turbiditic and deltaic facies, which resulted in a specific morphology of sandstone bodies, thus possibly influencing the values of porosity. According to [43], Upper Miocene sandstones of the Western part of Sava depression are mainly fine-grained to medium-grained (grain diameter ranging from 0.08 to 0.4 mm), and generally well-sorted.
The most comprehensive study of Upper Miocene sandstones using SEM was conducted in [44]. According to the authors, the grains are angular to sub-rounded, usually with tangential (point) and rarely concavo-convex and sutured contacts. Sandstones are of feldspar-litho-quartzose types. They are mostly composed of quartz (monocrystalline and polycrystalline), sedimentary rock fragments, feldspar, and metamorphic rock fragments, with variable quantities of micas and heavy minerals. The most dominant rock fragments are carbonate fragments with the presence of bioclasts. Fragments of siliciclastic sediments, mostly marls and sandstones, and volcaniclastic sediments (tuffs) were also observed. Metamorphic rock fragments are numerous and of variable mineral composition, including mica schists, quartzites, slates, phyllites, as well as metasediments, mostly metapelites, and rarely metasandstones. Magmatic rock fragments are less common, mostly represented by plutonic granitoids (granites), and very rarely altered extrusive rocks. Intergranular volume is filled with carbonate cement (calcite and ankerite), and with fine-grained matrix formed through alteration and dissolution of the main grains and different types of authigenic clay minerals (kaolinite, illite, chlorite, and different types of interstratified clays).
Accessible results of porosity and permeability analyses performed on core samples from old exploration wells indicate rather high heterogeneity of Poljana Sandstones’ reservoir properties, varying from exceptional (porosity exceeding 35% and horizontal permeability of 1000 mD) to fair (porosity is rather high, around 20%, while permeability is significantly lower, between 0.03 and 112 mD). However, the results of laboratory measurements are too sparse to be used in creating a simple model of areal distribution of porosity. Only the range of porosity is confirmed for well log analyses.
The heterogeneity of porosity and the permeability of Upper Miocene sandstones in the Western part of Sava depression arises from depositional conditions and differential compaction, but also from cementation and later cement dissolution, as reservoir properties are characteristically dependent upon cementation in turbidite sandstones [45]. It should be noted that samples with a higher clay content have a higher porosity and permeability with respect to those with a lower content of clay [43]. It can be concluded that the presence of clay minerals in the form of coating around grains inhibited cementation [46].

4. Materials and Methods

The boundaries of the Poljana Sandstones together with the positions of wells used for porosity estimates and porosity/permeability correlation are shown in Figure 2. As already mentioned, DSA Poljana is in the Sava depression, and its NW boundary is located only 5 km from the City of Zagreb’s eastern border. The input dataset consisted of well data including well logs from 23 wells that were used for porosity estimates, as well as petrophysical data obtained from laboratory analyses coming from 9 of these 23 wells (marked with black symbols in Figure 2) and from 7 other wells without porosity logs (marked with red symbols in Figure 2).
The porosity estimates were performed in Lloyd’s Register Interactive Petrophysics software. For four wells, all “porosity logs” were available (neutron log, density log, and sonic log), whereas three estimates were made based on the interpretation of the density log and sixteen estimates were made based on the interpretation of sonic logs only. For the four wells with all porosity logs, an “effective porosity” estimate was performed using the Mineral Solver tool, while for other wells a simple porosity log interpretation was conducted. It needs to be emphasized that “effective porosity” in Interactive Petrophysics software is derived from total porosity and the volume of clay (with the clay porosity value estimated to 10%), where the porosity of clay is subtracted from the total porosity. Thus, erroneous estimation of clay porosity may lead to errors in “effective porosity” estimates. It should be noted that in this way, the calculated effective porosity slightly differs from the effective porosity calculated based only on the total porosity and the volume of shale, as suggested in [47].
Top and bottom boundaries of the sandstone layers within the DSA Poljana were mostly taken from [39], where the authors defined the boundaries of DSA Poljana based on the interpretation of well logs from 140 wells, with the addition of well data in the SE area to encompass the whole body of Poljana Sandstones (Figure 2). Two main lithological categories were defined based on the lithological determination of drill cuttings and core samples from deep wells: marls interbedded with sandstones. To optimize the level of detail, porosity upscaling was preceded by layering of the model based on the general changes in the lithological composition. Building of a simplified lithological model, based on the upscaled well data, was performed after variogram analysis using sequential indicator simulations. The obtained porosity estimates were than upscaled and incorporated into a model within the sandstone lithology. Spatial distribution of porosity within the model was mapped using the Gaussian random function simulations after variogram analysis of the upscaled porosity data from wells (Figure 3).
All three approaches to the permeability estimate were based on the dependence of permeability on porosity. The first approach (model A) considered the correlation of the results of the laboratory measurements on core samples, which were available for 16 wells. It must be emphasized that the data were not spatially evenly distributed. For 1 well, a total of 93 pairs of porosity and permeability measurements were available, in contrast to the 5 wells having only 1 or 2 pairs of data. Distribution of porosity/permeability measurements suggested a semi-categorical approach to the permeability model, since two different types of porosity–permeability pairs were distinguished. This approach is based on measured values with a clear level of correlation reliability expressed by the determination factor. On the other hand, the data that are used were taken from the vintage well reports dating from the 1970s to the 1990s of last century. The reports contain only the results of the measurements, without information on methods used or any details. It is not possible to assess the reliability of these vintage data and the results should be taken with caution.
The second approach (model B) was based on Slichter’s empirical equation describing the influence of grain size and packing on permeability [48]:
k = 10.2 d g r a i n a p
where k is the permeability in darcies, dgrain is the diameter of presumably spherical grains in mm, and ap is a packing constant (dimensionless), which is dependent on porosity (Φ):
a p = 0.97 Φ 3.3
When the packing constant in Equation (1) is substituted into Equation (2), the correlation reads [49]:
k = 10.5 d g r a i n Φ 3.3
Since the results from only 23 granulometry analyses were available (from 4 wells), and the values did not show significant variation (they were in the range from 0.065 mm (very fine-grained) to 0.145 mm (fine-grained)), a single value of grain diameter of 0.095 mm was used, representing a median of average values reported for the 23 samples. This is a rather rough approximation, obviously having an impact on the reliability of the resulting permeability model, but the number of analyses was too low to enable any meaningful assessment of the grain size spatial distribution. The porosity values were taken from the previously constructed porosity model.
The third approach (model C) considered the influence of porosity and irreducible water saturation on permeability, and the relationship was investigated by many authors [50,51,52,53,54]. The problem with the application of this approach was the limited knowledge about irreducible water saturation of DSA Poljana Sandstones. Namely, there were no NMR nor CT measurements conducted (to apply the approach suggested in [55,56,57,58]). Furthermore, the available well log data encompassed only wells where sandstones of DSA Poljana are water-saturated, not hydrocarbon-saturated, so the irreducible water saturation could not be estimated in any zone of the DSA, and the bulk volume of water (BVW), also called the Buckle number (defined in [59]), could not be defined and used to estimate it in other parts with known porosity. The Buckle number represents the product of porosity and irreducible water saturation and is almost constant for a given type of rock. This led to another simplification—the value of the Buckle number was calculated from porosity and estimated irreducible water saturation values of the hydrocarbon reservoir in the south-eastern part of DSA Poljana (location of the well not provided) presented in [60]. The Buckle numbers calculated from nine pairs of values showed rather high variability, ranging from 0.023 to 0.053. The irreducible water saturation in the above work was estimated from a limited capillary pressure dataset, the wettability of the samples was not investigated, and it might play a significant role in values of capillary pressure and consequently in the estimated values of irreducible water saturation. The highest value of the Buckle number (0.053) was taken to estimate the irreducible water saturation from the developed porosity model, due to the very small grain size of the sandstones indicated by granulometric analyses, as well as the fact that DSA Poljana Sandstones are mainly water-wet, resulting in increased irreducible water saturation [61]. The value corresponds to typical values of Buckle number reported in [62] very fine-grained sandstones (between 0.05 and 0.07) and fine-grained sandstones (between 0.035 and 0.05).
Since the values of the measured permeabilities on the samples with estimated irreducible water saturation and measured porosity were also reported in [60], these values were used to select the equation best fitting the observed values. The Timur equation often shows best fitting with the results of permeability measurements on core samples of clastic rocks in comparison to other equations, e.g., in comparison to equations of the authors of [50,63] in a study conducted in [64], and also when compared to equations of the authors of [52,54], as reported in [65]. Results derived from equations developed by the authors of [50,51,52,53,54], Tixier [50], Wyllie and Rose [51], Morris and Biggs [52], Timur [53], and Coates and Denoo [54] and values of permeability measured on core samples (Table 1) showed that application of the equation from [52] was the most appropriate for describing the permeability of Poljana Sandstones:
k = 6241 Φ 6 s w i r r 2
where k is absolute permeability in millidarcies, Φ is porosity, and Swirr is irreducible water saturation (fraction). All other equations yielded much higher values of permeability (see Table 1 for comparison). Equation (4) was then applied to the porosity model to estimate the permeability.
Figure 3 shows the flowchart of the process sequence. It includes all the important steps in the assessment of DSA Poljana petrophysical properties, as described above.

5. Results

The relationship between the porosity and permeability is shown in Figure 4. It can be observed that the porosity and permeability of the investigated DSA show high variability, with porosities ranging from 2% to 34% and permeabilities ranging from 0 to 1454 mD. As already mentioned, the available data indicated the existence of two different types of samples: impermeable samples with effective porosities reaching 18% and permeable samples which showed a correlation between porosity and permeability. Thus, a permeability model consisting of two categories was developed: The first category comprised parts of DSA Poljana with porosity values exceeding 18%, where permeability was correlated with porosity using the expression in Figure 4 obtained for permeable samples, although with limited reliability (determination coefficient 0.5748). The second category comprised model cells with porosity values below the threshold of 18%, where permeability was not estimated due to the appearance of impermeable values.
It should be noted that all impermeable pairs of values were attributed a permeability value of 0.001 mD due to the lack of knowledge regarding the measurement limit. Some were originally reported to have a permeability of 0 mD, while others were simply assigned as “impermeable”.
Figure 5 shows the result of the process that consists primarily of the porosity estimate, which is then associated with upscaled lithological composition followed by the permeability estimate: permeability model A based on the porosity–permeability relationship with a cut-off at an 18% porosity value, permeability model B based on porosity and mean grain size, and permeability model C developed from the empirical equation of [52]. It should be noted that the porosity values were upscaled only within the reservoir units, while the intervals of interbedded marlstones were excluded from the porosity upscaling process. It can be observed that porosity values show large variability that cannot be associated with the depth or thickness of the respective sandstone. Namely, both the lowest and highest porosity values are associated with the shallowest sandstone layers. This indicates the necessity of grain size analysis as well as detailed sedimentological analysis to assess the effect of diagenetic processes on petrophysical parameters.
The well log analyses resulted in estimates of porosity values ranging from 0.01% to 35%, which is in accordance with the available results of laboratory measurements on core plugs (see Figure 4). The model of porosity distribution is shown in Figure 5. It can be observed that lower porosity values are associated with the deepest sandstone layers, which can be attributed to the effect of compaction. However, the model is not affected solely by compaction as it can be noticed that smaller areas characterized by low porosity are also found in the NW part of the DSA Poljana, where it is situated at rather shallow depths. Further, it can be noticed that the SE part is also situated rather shallow and is characterized by increased porosity values. It should be emphasized that the data are very scarce in the SE part and that the reliability of the model is decreased accordingly.
Generally, with respect to the frequency plot on Figure 6, it can be noted that most of the upscaled cells of DSA Poljana have porosity in the range from 5% to 24%, with a mean value of 15%. Porosity values above 15% can be observed in the NW and in the central part of the model. Higher porosity values are present in the SE part as well, although this is supposed to be the most distal depositional environment for these turbidite sandstone bodies. It is between these two regions that the layers are at a greater depth and are therefore exhibiting lower effective porosity values.
A semi-categorical permeability model (model A) is shown in Figure 7A. Areas without permeability estimates are scarce in the NW part of the DSA, while they are more represented in the central part, and partly in SE part of DSA Poljana. On the other hand, the areas with favorable permeability are limited to the northern, central, and southernmost parts of the DSA Poljana. Notably, the permeability model does not imply that the areas where the permeability was not assessed have lower permeability and should be avoided in case of planning injection in this reservoir unit. In these areas, permeability is more difficult to assess since it is practically impossible to correlate it with porosity. Additionally, the presence of impermeable samples associated with this category could be arguably related to the greater influence of diagenetic processes, especially cementation.
Similar to the porosity model, permeability model A is also burdened by the lack of data and the consequently questionable reliability in the southernmost part of the investigated area. Further research is needed to characterize this part of the DSA Poljana.
The permeability model based on the relationship between the permeability, porosity, and grain size (model B) is shown in Figure 7B. It is obvious that the model strongly resembles the porosity model (Figure 6), which was expected given the fact that the single median value of the grain diameter was considered. Most of the estimated values fall in the range between 1 and 10 mD. The arrangement of the highest values corresponds with the model A, although the values are overall lower in model B. Additionally, the lowest values found within the central, deepest part of DSA Poljana somewhat correspond to the areas without permeability assessment in model A.
Permeability model C, developed based on the equation provided by Morris and Biggs [52], shows the lowest values of permeability (Figure 7C). As expected, it shows similarities with permeability model B, since both are dominated by the porosity spatial distribution. However, permeability model C shows the overall largest range of permeabilities in comparison with the other two models. In the deepest part of DSA Poljana, it predicts very low values of permeability, while moderate to high permeability values are predicted in the NW and SE parts of the DSA.

6. Discussion

The reliability of the porosity model is limited due to the small number of wells with appropriate well logs (23) that were used as input data. It can be argued that with differently spaced wells, a different porosity distribution would have been mapped with more than significant implications for the static CO2 storage capacity estimates or spatial planning as far as this regional unit is concerned. In other words, it is questionable to which extent the proposed model relates to the regional variability that comes from the complexity of any geological unit in such an extensive area. On the other hand, there is no approach that could overcome the mentioned problem of geological complexity. Turbiditic sandstones are very complex, and the mechanisms of their sedimentation that have a direct implication on their geometry, grain size distribution, and petrophysical properties are still being studied [66], not to mention the complexity of diagenetic processes. These sandstones are often interlayered with marls, which can also be noted in our case (Figure 5). In the case of Poljana Sandstones, with respect to the proximal or distal area of the turbidite body, there can be one to five sandstone layers (five layers on Figure 5). Within the sandstone layers, there are occasionally interbedded marls, but of a much smaller thickness. The upscaling of the lithological composition led to a reduction of marl interlayers in the topmost sandstone layer; initially, there were six marl interlayers interpreted, and after the upscaling, there were only three (Figure 5). It should be noted that the presence of marl interlayers will affect the vertical permeability, which should be addressed when developing a detailed model for injection simulation.
The proposed approach is neither a time-saving nor a cost-effective solution for the problem of areal distribution of petrophysical properties of reservoir rocks. Even if there are many wells with ample measurements, data homogenization and quantitative interpretation of well logs may prove demanding for a regional estimate of a CO2 geological storage potential that is inevitably burdened with other geological and mapping uncertainties, the efficiency of the caprock being one of them. On the other hand, there is no simple satisfactory solution to this problem. The authors tried to establish the connection between the regional geological complexity and areal distribution of porosity through the correlation of porosity with the thickness of sandstone layers and the depth (after [67]), thinking that it might significantly facilitate and enhance estimates. That simplified approach did not yield satisfying results and there was not enough data to test the approach of intergranular volume compaction curve construction, as suggested in [68]. Therefore, it was decided to use porosity estimates using well logs to obtain reliable results and then try to establish the relationship with permeability. The significance of permeability in operations including injection of fluids into the reservoir and possibly withdrawal of fluids from the reservoir was evident. Injectivity and the dynamics of pressure increase upon fluid injection will depend strongly upon the permeability of reservoir rocks. According to the analysis conducted in [69], absolute permeability was the petrophysical parameter that had the greatest impact on the calculated CO2 injection costs. The study did not consider relative permeabilities of reservoir rock to CO2, the petrophysical parameter that is expected to influence the injection process the most. However, given the specificity of the measurements, they are not widely conducted, nor are their results published, and thus they are seldomly used.
One thing must be particularly emphasized: the proposed semi-categorical model of permeability (permeability model A) was established due to the existence of samples with varying effective porosity but lacking permeability. The authors are skeptical about the complete lack of permeability of the samples. The problem of reliable permeability measurements of low permeable samples was addressed in [70]. The low flow rate of injected gas and the measurement time limitation do not allow registration of slow flow through the poorly permeable samples. However, this problem is only partially relevant for samples encompassed in this study. More pronounced is the problem of inadequate knowledge regarding the characteristics of carbonate cementation, especially its intensity and extent. As previously mentioned, SEM studies conducted in [44] suggest that calcite and ankerite cement are filling intergranular pores, which is expected to significantly reduce effective porosity and permeability, but the extent of the reduction cannot be fully comprehended. The effect of cementation on the petrophysical properties is somewhat evident from the comparison of available granulometric and petrophysical properties of samples. Namely, a core sample showing a median grain size of 0.096 mm, and a sorting coefficient, So (after [71]), of 1.67, indicating well-sorted sediment, has an effective porosity of 4.2% and is reported as impermeable. Another sample from the same core (2.4 m deeper) has the same median grain size of 0.096 mm, and a similar sorting coefficient, So, of 1.59, but a significantly higher effective porosity of 12.6%. Despite its higher effective porosity, it is also registered as impermeable. This arguably implies a strong influence of cementation on petrophysical properties, with the reliability of this comparison being questionable due to the limited reliability of the Trask sorting coefficient with respect to the sorting coefficient developed in [72,73,74].
The above-stated comparison led to a similar conclusion as that presented by the authors of [75], who reported that North American sandstones (coming from one unnamed reservoir) with less than 13% porosity are strongly influenced by carbonate cement, which controls porosity and permeability, independently of grain size and sorting.
Regarding the permeability model B, it is heavily burdened by the use of the simple value of the grain diameter. This resulted in the model closely resembling the porosity model. Additionally, this approach is simplified to start with, since it does not address the influence of diagenetic processes on permeability. It considers only the effect of well log-derived porosity and grain diameter. This model is of no significance, even in the early phase of planning a future investigation, since the porosity model, from which it was derived, can be used to focus further research towards more promising areas.
Permeability model C is based on an empirical equation that was developed for reservoirs in Miocene sands, from the zones that were above the gas–water transition zone and therefore were at irreducible water saturation. The authors emphasized that permeability estimations are particularly sensitive to errors in the estimates of porosity and water saturation values. They also emphasized the problem of heterogeneity of reservoir properties influencing the problem of estimating the bulk volume of water (BVW, i.e., Buckle number). Namely, the Buckle number should be constant within a fairly homogenous reservoir. However, changes in lithological composition and grain size will inevitably lead to variation of the Buckle number value. In this work, a single value of the Buckle number was used to estimate irreducible water saturation, and this is problematic because the studied object is of regional extent and characterized by the heterogeneity of petrophysical properties resulting from the initial packing, sorting, and grain diameter, but also strongly influenced by diagenesis, as suggested by laboratory measurements of porosity and permeability on core samples. Although, based on reasonable assumptions, the lack of data decreases the reliability of the permeability model C and the effect of these uncertainties cannot be quantified.
As already mentioned, the weakest part of the porosity model, and permeability model A that was derived from it, is its decreased reliability in the SE part of the study area, due to the lack of well data. This is emphatically problematic since the increased porosity values in this part of the model resulted in the area being characterized as better assessed in permeability model A, i.e., having a higher readiness level to be considered for geological storage as well as other possibilities for subsurface use. Nevertheless, from Figure 7A, it is obvious where the greatest uncertainties of the porosity model A are. It is also obvious that permeability model B shows too-strong matching with the porosity model as a consequence of the use of a single grain diameter. On the other hand, the shortcomings of the permeability model C are not obvious, yet the model is influenced by the same problem as the permeability model B—it does not adequately address the DSA Poljana heterogeneity. Permeability models B and C are presented as possible solutions for similar geological settings and availability of vintage datasets. In case more values of the mean grain size were available, the Slichter method could prove useful. The values of the mean grain size could also be used to better assess the irreducible water saturation, thus improving the reliability of the permeability model C.

7. Conclusions

There are several conclusions emerging from the presented work:
  • The most obvious conclusion that can be drawn at this stage would be that further research is needed to reliably assess the DSA Poljana, including sedimentological analyses as well as micro-computed tomography, with the novel petrophysical analyses primarily focused on impermeable samples showing fair porosity.
  • Additional analyses of cap rock petrophysical properties are needed, including CO2/brine relative permeability and capillary threshold pressure.
  • The presented approach is suitable for DSAs characterized by variability of petrophysical properties and can be used in the rather early stage of investigation to direct further research towards more promising areas of clastic DSAs.
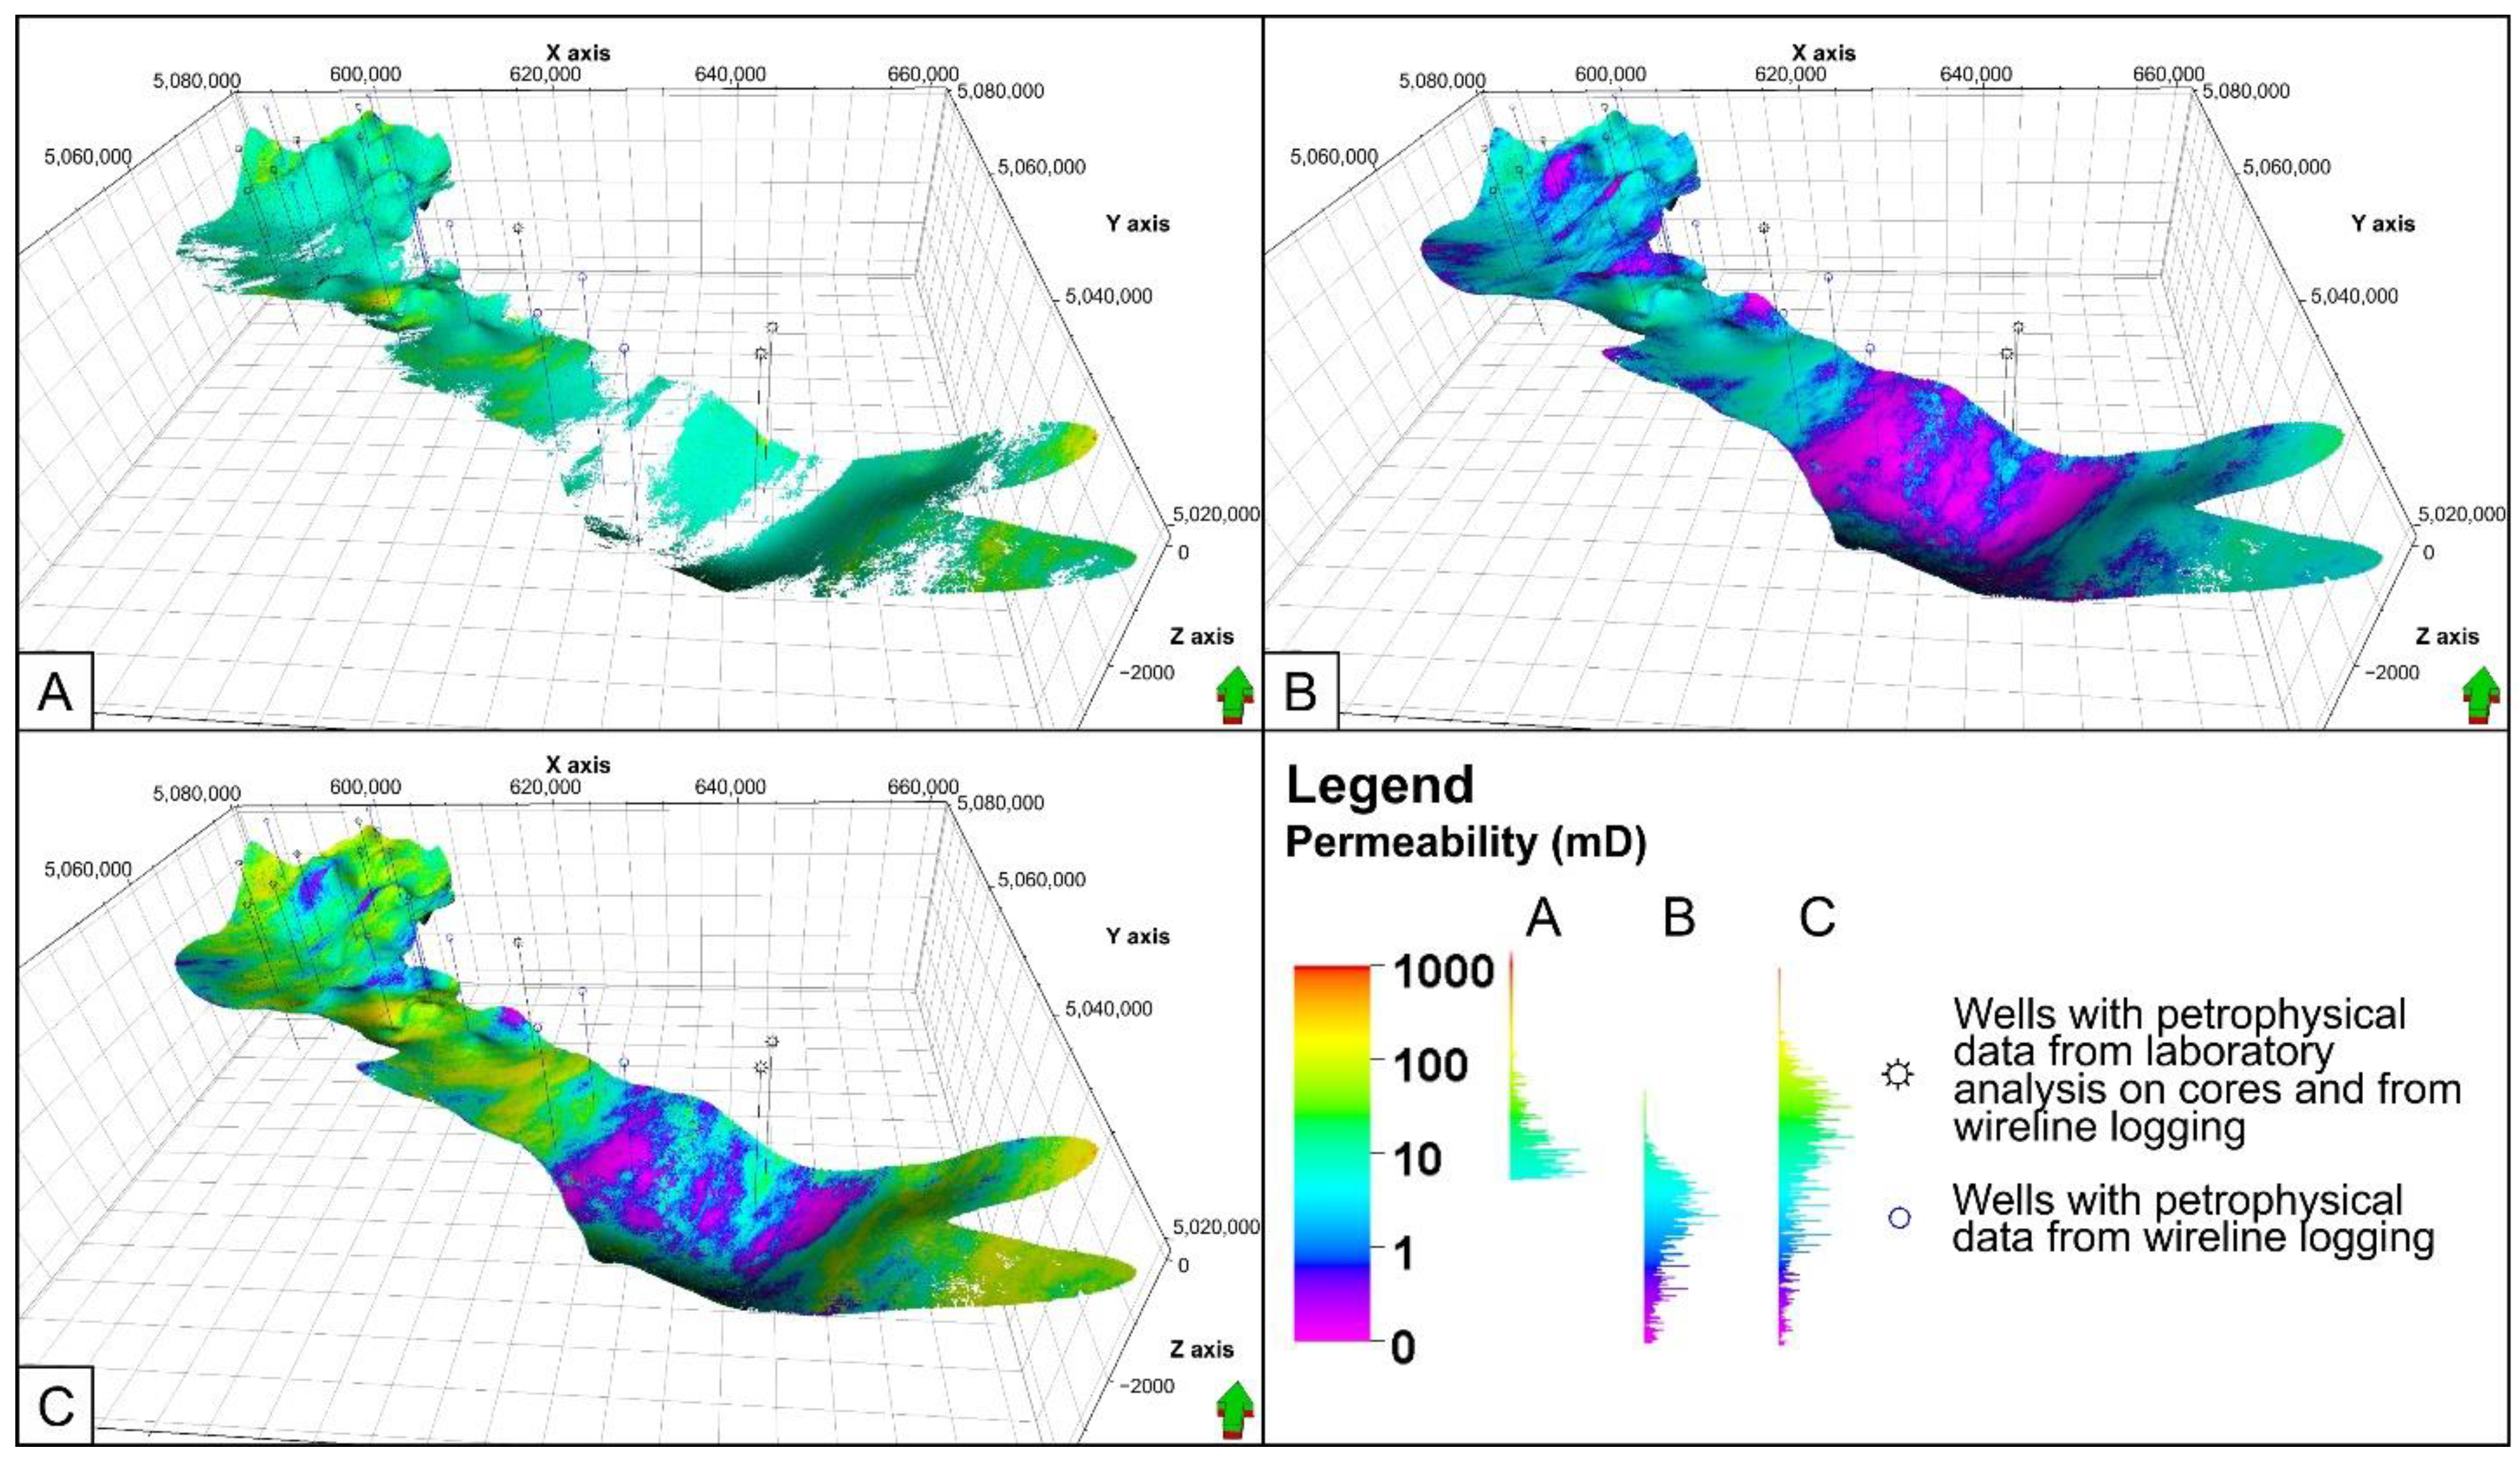
  • Despite showing a significant drawback concerning the inability to adequately describe the permeability of the whole DSA Poljana, the permeability model A can be regarded as the most reliable, since it is based on a greater number of laboratory measurements and it indicates the zones where the diagenetic processes might have played a significant role, strongly influencing the permeability values.
  • Using the Slichter equation to develop the meaningful permeability model B is practically impossible without a large dataset that would enable to assess the spatial distribution of the mean grain size.
  • Attempts to make use of the Timur equation (model C) have run into a similar problem—the lack of reliable input data prohibits any estimate of the reliability of the results.
  • Seismic data should be included to enable identification of structures suitable for underground storage of CO2 or energy and development of their structural models as a start point for site characterization and project development.

Author Contributions

Conceptualization, I.K.M. and B.S.; methodology, I.K.M., M.C., and B.S.; software, M.C., I.K.M., and D.R.; validation, B.S. and D.R.; formal analysis, I.K.M. and M.C.; investigation, I.K.M. and M.C.; resources, M.C. and D.R.; data curation, M.C. and D.R.; writing—original draft, I.K.M. and M.C.; writing—review and editing, B.S. and D.R.; visualization, M.C. and B.S.; supervision, B.S.; project administration, B.S. and M.C.; funding acquisition, B.S. and M.C. All authors have read and agreed to the published version of the manuscript.

Funding

This research received no external funding.

Institutional Review Board Statement

Not applicable.

Informed Consent Statement

Not applicable.

Data Availability Statement

The data supporting results reported in this manuscript can be issued from the Croatian Hydrocarbon Agency.

Acknowledgments

The authors would like to thank their colleague Zvonko Jeras for valuable discussions and help regarding well log interpretation. The original dataset was obtained through long-lasting cooperation with the Croatian Hydrocarbon Agency, while the Interactive petrophysics software was donated to the Faculty by Lloyd’s Register for educational and scientific purposes. The authors express their gratitude to the Schlumberger company for the donation of PetrelTM software suite for educational and scientific purposes. The authors express their gratitude to the four anonymous reviewers whose efforts helped to increase the quality of the paper. Work and publication were financed by the University of Zagreb, Faculty of Mining, Geology, and Petroleum Engineering.

Conflicts of Interest

The authors declare no conflict of interest.

References

  1. UNDP. World Energy Assessment; Energy and the Challenge of Sustainability; UNDP: New York, NY, USA, 2000. [Google Scholar]
  2. Global Energy Assessment (GEA); Johansson, T.B.; Nakicenovic, N.; Patwardhan, A.; Gomez-Echeverri, L. (Eds.) Global Energy Assessment; Cambridge University Press: Cambridge, UK, 2012; ISBN 9780511793677. [Google Scholar]
  3. Howes, S.; Wyrwoll, P. Evaluation of Current Pledges, Actions, and Strategies. In Managing the Transition to a Low-Carbon Economy—Perspectives, Policies, and Practices from Asia; Nbumozhi, V., Kawai, M., Lohani, B.N., Eds.; Asian Development Bank Institute: Hong Kong, China, 2015; pp. 85–146. [Google Scholar]
  4. Bradshaw, J.; Bachu, S.; Bonijoly, D.; Burruss, R.; Holloway, S.; Christensen, N.P.; Mathiassen, O.M. CO2 storage capacity estimation: Issues and development of standards. Int. J. Greenh. Gas Control 2007, 1, 62–68. [Google Scholar] [CrossRef] [Green Version]
  5. Bachu, S.; Bonijoly, D.; Bradshaw, J.; Burruss, R.; Holloway, S.; Christensen, N.P.; Mathiassen, O.M. CO2 storage capacity estimation: Methodology and gaps. Int. J. Greenh. Gas Control 2007, 1, 62–68. [Google Scholar] [CrossRef] [Green Version]
  6. Doughty, C.; Pruess, K. Modeling Supercritical Carbon Dioxide Injection in Heterogeneous Porous Media. Vadose Zone J. 2004, 3, 837–847. [Google Scholar] [CrossRef]
  7. Goodman, A.; Hakala, A.; Bromhal, G.; Deel, D.; Rodosta, T.; Frailey, S.; Small, M.; Allen, D.; Romanov, V.; Fazio, J.; et al. U.S. DOE methodology for the development of geologic storage potential for carbon dioxide at the national and regional scale. Int. J. Greenh. Gas Control 2011, 5, 952–965. [Google Scholar] [CrossRef]
  8. Bachu, S. Review of CO2 storage efficiency in deep saline aquifers. Int. J. Greenh. Gas Control 2015, 40, 188–202. [Google Scholar] [CrossRef]
  9. Vangkilde-Pedersen, T.; Anthonsen, K.L.; Smith, N.; Kirk, K.; Neele, F.; van der Meer, B.; Le Gallo, Y.; Bossie-Codreanu, D.; Wojcicki, A.; Le Nindre, Y.-M.; et al. Assessing European capacity for geological storage of carbon dioxide–the EU GeoCapacity project. Energy Procedia 2009, 1, 2663–2670. [Google Scholar] [CrossRef] [Green Version]
  10. Höller, S.; Viebahn, P. Assessment of CO2 storage capacity in geological formations of Germany and Northern Europe. Energy Procedia 2011, 4, 4897–4904. [Google Scholar] [CrossRef] [Green Version]
  11. Bader, A.G.; Thibeau, S.; Vincké, O.; Delprat Jannaud, F.; Saysset, S.; Joffre, G.H.; Giger, F.M.; David, M.; Gimenez, M.; Dieulin, A.; et al. CO2 Storage Capacity Evaluation in Deep Saline Aquifers for an Industrial Pilot Selection. Methodology and Results of the France Nord Project. Energy Procedia 2014, 63, 2779–2788. [Google Scholar] [CrossRef] [Green Version]
  12. Koukouzas, N.; Tyrologou, P.; Karapanos, D.; Carneiro, J.; Pereira, P.; de Mesquita Lobo Veloso, F.; Koutsovitis, P.; Karkalis, C.; Manoukian, E.; Karametou, R. Carbon Capture, Utilisation and Storage as a Defense Tool against Climate Change: Current Developments in West Macedonia (Greece). Energies 2021, 14, 3321. [Google Scholar] [CrossRef]
  13. Burton, M.; Kumar, N.; Bryant, S.L. CO2 injectivity into brine aquifers: Why relative permeability matters as much as absolute permeability. Energy Procedia 2009, 1, 3091–3098. [Google Scholar] [CrossRef] [Green Version]
  14. Yusof, M.A.M.; Neuyam, Y.A.S.; Ibrahim, M.A.; Saaid, I.M.; Idris, A.K.; Mohamed, M.A. Experimental study of CO2 injectivity impairment in sandstone due to salt precipitation and fines migration. J. Pet. Explor. Prod. Technol. 2022, 12, 2191–2202. [Google Scholar] [CrossRef]
  15. Birkholzer, J.; Zhou, Q.; Tsang, C. Large-scale impact of CO2 storage in deep saline aquifers: A sensitivity study on pressure response in stratified systems. Int. J. Greenh. Gas Control 2009, 3, 181–194. [Google Scholar] [CrossRef] [Green Version]
  16. Khan, S.; Al-Shuhail, A.A.; Khulief, Y.A. Numerical modeling of the geomechanical behavior of Ghawar Arab-D carbonate petroleum reservoir undergoing CO2 injection. Environ. Earth Sci. 2016, 75, 1499. [Google Scholar] [CrossRef]
  17. Vilarrasa, V.; Silva, O.; Carrera, J.; Olivella, S. Liquid CO2 injection for geological storage in deep saline aquifers. Int. J. Greenh. Gas Control 2013, 14, 84–96. [Google Scholar] [CrossRef] [Green Version]
  18. Worden, R.H.; Burley, S.D. Sandstone Diagenesis: The Evolution of Sand to Stone. In Sandstone Diagenesis; Burley, S.D., Worden, R.H., Eds.; Blackwell Publishing Ltd.: Oxford, UK, 2003; pp. 1–44. [Google Scholar]
  19. Füchtbauer, H. Influence of Different Types of Diagenesis on Sandstone Porosity. In Proceedings of the 7th World Petroleum Congress, Mexico City, Mexico, 2–9 April 1967. [Google Scholar]
  20. Bjorlykke, K. Petroleum Geoscience; Springer: Berlin/Heidelberg, Germany, 2010; ISBN 978-3-642-02331-6. [Google Scholar]
  21. Collen, J.D. Diagenetic Control of Porosity and Permeability in Pakawau and Kapuni Group Sandstones, Taranaki Basin, New Zealand. Energy Explor. Exploit. 1988, 6, 263–280. [Google Scholar] [CrossRef]
  22. Cnudde, V.; Boone, M.; Dewanckele, J.; Dierick, M.; Van Hoorebeke, L.; Jacobs, P. 3D characterization of sandstone by means of X-ray computed tomography. Geosphere 2011, 7, 54–61. [Google Scholar] [CrossRef]
  23. Neumann, R.F.; Barsi-Andreeta, M.; Lucas-Oliveira, E.; Barbalho, H.; Trevizan, W.A.; Bonagamba, T.J.; Steiner, M.B. High accuracy capillary network representation in digital rock reveals permeability scaling functions. Sci. Rep. 2021, 11, 11370. [Google Scholar] [CrossRef]
  24. Galkin, S.V.; Martyushev, D.A.; Osovetsky, B.M.; Kazymov, K.P.; Song, H. Evaluation of void space of complicated potentially oil-bearing carbonate formation using X-ray tomography and electron microscopy methods. Energy Rep. 2022, 8, 6245–6257. [Google Scholar] [CrossRef]
  25. Belozerov, I.; Gubaydullin, M. Concept of technology for determining the permeability and porosity properties of terrigenous reservoirs on a digital rock sample model. J. Min. Inst. 2020, 244, 402–407. [Google Scholar] [CrossRef]
  26. Tian, J.; Qi, C.; Sun, Y.; Yaseen, Z.M.; Pham, B.T. Permeability prediction of porous media using a combination of computational fluid dynamics and hybrid machine learning methods. Eng. Comput. 2021, 37, 3455–3471. [Google Scholar] [CrossRef]
  27. Medina, C.R.; Rupp, J.A.; Barnes, D.A. Effects of reduction in porosity and permeability with depth on storage capacity and injectivity in deep saline aquifers: A case study from the Mount Simon Sandstone aquifer. Int. J. Greenh. Gas Control 2011, 5, 146–156. [Google Scholar] [CrossRef]
  28. Grana, D.; Liu, M.; Ayani, M. Prediction of CO2 Saturation Spatial Distribution Using Geostatistical Inversion of Time-Lapse Geophysical Data. IEEE Trans. Geosci. Remote Sens. 2021, 59, 3846–3856. [Google Scholar] [CrossRef]
  29. Khanal, A.; Shahriar, M.F. Physics-Based Proxy Modeling of CO2 Sequestration in Deep Saline Aquifers. Energies 2022, 15, 4350. [Google Scholar] [CrossRef]
  30. Bandilla, K.W.; Celia, M.A.; Elliot, T.R.; Person, M.; Ellett, K.M.; Rupp, J.A.; Gable, C.; Zhang, Y. Modeling carbon sequestration in the Illinois Basin using a vertically-integrated approach. Comput. Vis. Sci. 2012, 15, 39–51. [Google Scholar] [CrossRef]
  31. Popov, S.V.; Shcherba, I.G.; Ilyina, L.B.; Nevesskaya, L.A.; Paramonova, N.P.; Khondkarian, S.O.; Magyar, I. Late Miocene to Pliocene palaeogeography of the Paratethys and its relation to the Mediterranean. Palaeogeogr. Palaeoclimatol. Palaeoecol. 2006, 238, 91–106. [Google Scholar] [CrossRef]
  32. Palcu, D.V.; Patina, I.S.; Șandric, I.; Lazarev, S.; Vasiliev, I.; Stoica, M.; Krijgsman, W. Late Miocene megalake regressions in Eurasia. Sci. Rep. 2021, 11, 11471. [Google Scholar] [CrossRef]
  33. Pavelić, D. Tectonostratigraphic model for the North Croatian and North Bosnian sector of the Miocene Pannonian Basin System. Basin Res. 2001, 13, 359–376. [Google Scholar] [CrossRef]
  34. Saftić, B.; Velić, J.; Sztanó, O.; Juhász, G.; Ivković, Ž. Tertiary subsurface facies, source rocks and hydrocarbon reservoirs in the SW part of the Pannonian Basin (Northern Croatia and south-western Hungary). Geol. Croat. 2003, 56, 101–122. [Google Scholar] [CrossRef]
  35. Balázs, A.; Magyar, I.; Matenco, L.; Sztanó, O.; Tőkés, L.; Horváth, F. Morphology of a large paleo-lake: Analysis of compaction in the Miocene-Quaternary Pannonian Basin. Glob. Planet. Chang. 2018, 171, 134–147. [Google Scholar] [CrossRef]
  36. Pavelić, D.; Kovačić, M. Sedimentology and stratigraphy of the Neogene rift-type North Croatian Basin (Pannonian Basin System, Croatia): A review. Mar. Pet. Geol. 2018, 91, 455–469. [Google Scholar] [CrossRef]
  37. Lučić, D.; Saftić, B.; Krizmanić, K.; Prelogović, E.; Britvić, V.; Mesić, I.; Tadej, J. The Neogene evolution and hydrocarbon potential of the Pannonian Basin in Croatia. Mar. Pet. Geol. 2001, 18, 133–147. [Google Scholar] [CrossRef]
  38. Šimon, J. On some results of regional lithostratigraphic correlation in the south-western part of Pannonian basin (In Croatian: O nekim rezultatima regionalne korelacije litostratigrafskih jedinica u jugozapadnom području Panonskog bazena). Nafta 1973, 24, 623–630. [Google Scholar]
  39. Kolenković, I.; Saftić, B.; Perešin, D. Regional capacity estimates for CO2 geological storage in deep saline aquifers—Upper Miocene sandstones in the SW part of the Pannonian basin. Int. J. Greenh. Gas Control 2013, 16, 180–186. [Google Scholar] [CrossRef]
  40. US DOE. Carbon Sequestration Atlas of United States and Canada, 3rd ed.; US DOE: Washington, DC, USA, 2010.
  41. Spencer, L.K.; Bradshaw, J.; Bradshaw, B.E.; Lahtinen, A.-L.; Chirinos, A. Regional storage capacity estimates: Prospectivity not statistics. Energy Procedia 2011, 4, 4857–4864. [Google Scholar] [CrossRef] [Green Version]
  42. Ramm, M.; Bjørlykke, K. Porosity/depth trends in reservoir sandstones: Assessing the quantitative effects of varying pore-pressure, temperature history and mineralogy, Norwegian Shelf data. Clay Miner. 1994, 29, 475–490. [Google Scholar] [CrossRef]
  43. Tadej, J.; Marić Đureković, Ž.; Slavković, R. Porosity, Cementation, Diagenesis and Their Influence on the Productive Capability of Sandstone Reservoirs in the Sava Depression (Croatia). Geol. Croat. 1996, 49, 311–316. [Google Scholar]
  44. Matošević, M.; Kovačić, M.; Pavelić, D. Provenance and diagenesis of the Upper Miocene sandstones from the Pannonian Basin System. In Proceedings of the Book of Abstracts of 35th IAS Meeting of Sedimentology, Prague, Czech Republic, 21–25 June 2021. [Google Scholar]
  45. Dutton, S.P. Calcite cement in Permian deep-water sandstones, Delaware Basin, west Texas: Origin, distribution, and effect on reservoir properties. Am. Assoc. Pet. Geol. Bull. 2008, 92, 765–787. [Google Scholar] [CrossRef]
  46. Pittman, E.D.; Lumsden, D.N. No TitleRelationship between chlorite coating on quartz grain and porosity, Spiro Sand, Oklahoma. J. Sediment. Petrol. 1968, 38, 668–670. [Google Scholar] [CrossRef]
  47. Ahmad, N.; Khan, S.; Al-Shuhail, A. Seismic Data Interpretation and Petrophysical Analysis of Kabirwala Area Tola (01) Well, Central Indus Basin, Pakistan. Appl. Sci. 2021, 11, 2911. [Google Scholar] [CrossRef]
  48. Slichter, S.C. Theoretical investigation of the motion of ground water. In US Geological Survey, 19th Annual Report, Part II; Government Printing Office: Washington, DC, USA, 1899; pp. 295–384. [Google Scholar]
  49. Tiab, D.; Donaldson, E.C. Petrophysics: Theory and Practice of Measuring Reservoir Rock and Fluid Transport Properties; Gulf Professional Publishing: Houston, TX, USA, 2015. [Google Scholar]
  50. Tixier, M.P. Evaluation of Permeability from Resistivity Gradient on Electric Logs. Tulsa Geol. Soc. Dig. 1949, 17, 68–73. [Google Scholar]
  51. Wyllie, M.R.J.; Rose, W.D. Some Theoretical Considerations Related to Quantitative Evaluation of Physical Characteristics of Reservoir Rocks from Electrical Log Data. Trans. AIME 1950, 189, 105–118. [Google Scholar] [CrossRef]
  52. Morris, R.L.; Biggs, W.P. Using log-derived values of water saturation and porosity. In Proceedings of the SPWLA Annual Logging Symposium, Denver, CO, USA, 12–14 June 1967. [Google Scholar]
  53. Timur, A. Pulsed Nuclear Magnetic Resonance Studies of Porosity, Movable Fluid, and Permeability of Sandstones. J. Pet. Technol. 1969, 21, 775–786. [Google Scholar] [CrossRef]
  54. Coates, G.R.; Denoo, S. The producibility answer product. Tech. Rev. 1981, 29, 54–63. [Google Scholar]
  55. Peng, L.; Zhang, C.; Ma, H.; Pan, H. Estimating irreducible water saturation and permeability of sandstones from nuclear magnetic resonance measurements by fractal analysis. Mar. Pet. Geol. 2019, 110, 565–574. [Google Scholar] [CrossRef]
  56. Lis-Śledziona, A.; Stadtmüller, M. Determining irreducible water saturation based on well log data and laboratory measurements. Nafta-Gaz 2019, 75, 239–246. [Google Scholar] [CrossRef]
  57. Shi, J.-Q.; Xue, Z.; Durucan, S. History matching of CO2 core flooding CT scan saturation profiles with porosity dependent capillary pressure. Energy Procedia 2009, 1, 3205–3211. [Google Scholar] [CrossRef] [Green Version]
  58. Wang, R.; Zhang, C.; Chen, D.; Yang, F.; Li, H.; Li, M. Microscopic Seepage Mechanism of Gas and Water in Ultra-Deep Fractured Sandstone Gas Reservoirs of Low Porosity: A Case Study of Keshen Gas Field in Kuqa Depression of Tarim Basin, China. Front. Earth Sci. 2022, 10, 893701. [Google Scholar] [CrossRef]
  59. Buckles, R.S. Correlating and Averaging Connate Water Saturation Data. J. Can. Pet. Technol. 1965, 4, 42–52. [Google Scholar] [CrossRef]
  60. Vulin, D.; Čogelja, Z.; Biljanović, T. Determination of representative capillary pressure curve by adjusting the laboratory and well logging data (in Croatian, original title: Određivanje reprezentativne krivulje kapilarnog tlaka usklađivanjem laboratorijskih i karotažnih podataka). Naft. I Plin 2016, 36, 33–40. (In Croatian) [Google Scholar]
  61. Baker, R.O.; Yarranton, H.W.; Jensen, J.L. Special Core Analysis—Rock–Fluid Interactions. In Practical Reservoir Engineering and Characterization; Elsevier: Amsterdam, The Netherlands, 2015; pp. 239–295. [Google Scholar]
  62. Asquith, G.B.; Gibosn, C.R. Basic Well Log Analysis for Geologists; American Association of Petroleum Geologists: Tulsa, OK, USA, 1982; ISBN 978-1-6298-1171-0. [Google Scholar]
  63. Coates, G.R.; Dumanoir, J.L. A new approach to improved log derived permeability. Log Anal. 1974, 15, 17–29. [Google Scholar]
  64. Torskaya, T.; Shabro, V.; Torres-Verdín, C.; Salazar-Tio, R.; Revil, A. Grain Shape Effects on Permeability, Formation Factor, and Capillary Pressure from Pore-Scale Modeling. Transp. Porous Media 2014, 102, 71–90. [Google Scholar] [CrossRef]
  65. El Sharawy, M.S.; Gaafar, G.R. Impacts of petrophysical properties of sandstone reservoirs on their irreducible water saturation: Implication and prediction. J. Afr. Earth Sci. 2019, 156, 118–132. [Google Scholar] [CrossRef]
  66. Ge, Z.; Nemec, W.; Vellinga, A.J.; Gawthorpe, R.L. How is a turbidite actually deposited? Sci. Adv. 2022, 8, eabl9124. [Google Scholar] [CrossRef] [PubMed]
  67. Jelić, K. Porosity and permeability relation to burial depth for lithostratigraphic units of Sava and Drava Depressions (Odnos gustoće i poroznosti s dubinom litostratigrafskih formacija Savske i Dravske potoline). Nafta 1984, 35, 952–965. (In Croatian) [Google Scholar]
  68. Paxton, S.T.; Szabo, J.O.; Ajdukiewicz, J.M.; Klimentidis, R.E. Construction of an intergranular volume compaction curve for evaluating and predicting compaction and porosity loss in rigid-grain sandstone reservoirs. Am. Assoc. Pet. Geol. Bull. 2002, 86, 2047–2067. [Google Scholar] [CrossRef]
  69. Cheng, C.-L.; Gragg, M.J.; Perfect, E.; White, M.D.; Lemiszki, P.J.; McKay, L.D. Sensitivity of injection costs to input petrophysical parameters in numerical geologic carbon sequestration models. Int. J. Greenh. Gas Control 2013, 18, 277–284. [Google Scholar] [CrossRef]
  70. Yang, J.; Busen, H.; Scherb, H.; Hürkamp, K.; Guo, Q.; Tschiersch, J. Modeling of radon exhalation from soil influenced by environmental parameters. Sci. Total Environ. 2019, 656, 1304–1311. [Google Scholar] [CrossRef] [PubMed]
  71. Trask, P. Origin and Environment of Source Sediments of Petroleum; Gulf Publishing Co.: Huston, TX, USA, 1932. [Google Scholar]
  72. Folk, R.L. The Distinction between Grain Size and Mineral Composition in Sedimentary-Rock Nomenclature. J. Geol. 1954, 62, 344–359. [Google Scholar] [CrossRef]
  73. Folk, R.L.; Ward, W.C. Brazos River bar: A study in the significance of grain size parameters. J. Sediment. Petrol. 1957, 27, 3–26. [Google Scholar] [CrossRef]
  74. Friedman, G.M. On Sorting, Sorting Coefficients, and the Lognormality of the Grain-Size Distribution of Sandstones. J. Geol. 1962, 70, 737–753. [Google Scholar] [CrossRef]
  75. Coskun, S.B.; Wardlaw, N.C.; Haverslew, B. Effects of composition, texture and diagenesis on porosity, permeability and oil recovery in a sandstone reservoir. J. Pet. Sci. Eng. 1993, 8, 279–292. [Google Scholar] [CrossRef]
Figure 1. Schematic lithostratigraphic column of the Sava depression (modified after [38]) with marked DSA Poljana in Poljana Sandstones.
Energies 15 06066 g001
Figure 2. Areal distribution of the DSA Poljana with wells used for porosity upscaling.
Energies 15 06066 g002
Figure 3. Process sequence of petrophysical model development.
Energies 15 06066 g003
Figure 4. Relationship between porosity and permeability based on the results of laboratory measurements on core samples (blue dots represent porosity–permeability values showing correlation, and orange dots represent the group of porosity–permeability values of samples that were reported as impermeable).
Energies 15 06066 g004
Figure 5. Selected well log from the porosity and permeability model of the DSA Poljana for three permeability cases: A—calculated from the relationship shown in Figure 4 with an 18% porosity cut-off, B—calculated based on the Slichter equation in [61], and C—calculated based on the Timur equation in [61].
Energies 15 06066 g005
Figure 6. Spatial distribution of the porosity within the DSA Poljana with a frequency plot.
Energies 15 06066 g006
Figure 7. Permeability models of the DSA Poljana: (A) calculated from the relationship shown in Figure 4 with an 18% porosity cut-off, (B) calculated based on the Slichter equation in [61], and (C) calculated based on the Timur equation in [61].
Energies 15 06066 g007
Table 1. Parameters used to develop permeability model C (from [60]) and permeability values estimated using empirical equations developed by Tixier [50], Wyllie and Rose [51], Morris and Biggs [52], Timur [53], and Coates and Denoo [54] (in italic).
SampleDepth (m)kmeasured (mD)ΦSwirr
Estimated
k after Wyllie and Rose (mD) k after Tixier (mD) k after Timur (mD) k after Coates and Denoo (mD) k after Morris and Biggs (mD)
11528.910.320.20130.1618281.4103158.8494283.4618440.669915.86207
21528.4414.490.20240.2642108.163761.557108.8929130.16556.146836
31526.9715.210.21050.2178189.8973114.6243190.4287253.237611.44593
41526.5545.530.21620.1799313.8978197.2204313.9364454.039919.69364
51528.5523.30.21890.1417535.0153342.464534.4174842.406234.19708
61526.8633.950.22060.1099920.9359596.3726919.19521553.47559.55138
71527.6434.790.22250.1282703.4108461.4069701.47941133.38646.07424
81528.6538.070.22290.1021120.198736.78381116.9221913.34273.57229
91528.3471.50.2540.166761.2644609.0685749.18851050.63260.81914
Publisher’s Note: MDPI stays neutral with regard to jurisdictional claims in published maps and institutional affiliations.

