Article

Assessment Criteria of Changes in Health Index Values over Time—A Transformer Population Study

by
Patryk Bohatyrewicz
* and
Szymon Banaszak
Faculty of Electrical Engineering, West Pomeranian University of Technology in Szczecin, 70-313 Szczecin, Poland
*
Author to whom correspondence should be addressed.
Energies 2022, 15(16), 6078; https://doi.org/10.3390/en15166078
Submission received: 22 July 2022 / Revised: 15 August 2022 / Accepted: 19 August 2022 / Published: 22 August 2022

Abstract

:
The current use of health index algorithms is mainly limited to single assessments of the unit’s condition or the device comparison. The paper focuses on the changes in the health index values between the consecutive analyses. The algorithm used for this purpose was previously developed by the authors. The test group included 359 complete oil evaluation results from 86 power transformers monitored over several years. For each outcome, the influence of the sub-components of the main score was calculated. Additional health index increase simulations were performed based on the IEC 60599 standard guidelines. The highest increases and decreases in the total score were listed and analyzed to determine the main factors behind the changes. The study has shown that the changes in dissolved gases concentrations have a much more significant influence on the health index values than the changes in physicochemical properties of the oil and furfural content. Based on the magnitude of the observed changes and the simulation outcomes, the authors have proposed two assessment thresholds—the 50th percentile health index increase within a population as an alarm zone, and the 90th or 95th percentile increase as a pre-failure zone.

1. Introduction

Power transformers are the most expensive, commonly used power grid assets. Distribution system operators strive to minimize emergency outages of crucial equipment to improve the power system availability. Site repair of some transformer faults is possible, but severe defects require transportation of units to a workshop for internal inspection or repair involving removal of the active part from the tank, which is time and cost-consuming. Therefore, system operators carry out periodic maintenance and diagnostics on transformers to determine their current technical condition and the prospects for further trouble-free operation. The information on the actual state of operated transformers in a bigger population allows for effective maintenance and repair planning.
Papers [1,2,3,4] describe the diagnostic procedures used in the evaluation of the technical status of the transformers. Some methods require a switch off of the test object, which may cause problems with the grid operation in the case of units of high importance for the reliability of the local power network. Thus, transformer de-energization for diagnostic purposes is performed, depending on the operator’s capabilities at individually determined intervals.
The most common diagnostic methods applied during transformer operation are routine visual inspections and operation history analysis. They are usually carried out during the general substation inspections when the overall condition of each device is checked, such as instrumentation readings and the sound assessment. In addition, periodic thermal imaging of transformer externals (tank, cooling system, and bushings) provides information on the status of key transformer equipment.
Another activity that can be performed on an operating transformer is oil sampling. The transformer oil is tested mainly for two groups of parameters. The first one, the physicochemical properties, indicates whether the oil is suitable for operation as an insulating and cooling medium within the transformer. The second is the dissolved gas analysis (DGA), which makes it possible to assess whether internal defects have developed within the transformer or the scale of internal faults. These tests are non-invasive except for sampling from the on-load tap changer (OLTC) compartment, which requires transformer de-energization. The DGA effects are significant—detecting pre-failure states and indicating the necessity for more extensive diagnostics with other advanced methods is possible.
A great variety of measurement methods can be used for transformer condition assessment. They can be divided into several categories:
  • Electrical parameters (turns ratio, winding resistance);
  • Insulation properties (insulation resistance, dielectric dissipation of windings, and moisture content evaluation within solid insulation using polarization methods);
  • Mechanical integrity (frequency response analysis, leakage reactance);
  • Accessory check (on-load tap changer diagnostics, bushing assessment).
The abovementioned methods require the test object to be switched off. The choice of diagnostic methods shall be based on the unit’s current technical condition, operation history, or the test procedure provided within the operation and maintenance manual. The test results are evaluated by taking into account the historical values to identify the changes in the technical condition of the unit.
Transformer fleet management becomes challenging when the population reaches the size of several hundred or thousands of units. For such large groups, the simplicity of the health index method is unmatched, as the technical condition of a device is represented as a single indicator. This value is usually numerical, which facilitates the observation of changes in transformer health, comparative analysis between units, and maintenance or overhaul planning. The assessment techniques vary for each health index, but the most important ones are described in a review [5].
So far, several health indexes have been developed, which vary in design [6,7]. Some distribution operators have implemented such methods for transformer population management, and their experiences are described in [8,9,10,11,12]. The application of an IoT platform for online fault diagnosis of power transformers based on the dissolved gas analysis is presented in [13]. An algorithm evaluating transformer oil conditions based on the integration of multiple assessment techniques is described in [14]. The method may also be adopted for calculating the device’s apparent age based on the population data [15], which allows for calculating the remaining life of a transformer [16]. However, the application of health indexes is mainly utilized for analyzing the individual results, comparative analysis between devices, or identifying operation prospects [17]. There are limited references to the use of a health index for long-term monitoring of transformer condition changes, and there is very little knowledge about the assessment of the magnitude of score variations.
In this paper, the authors aim to contribute to the know-how of health index application by evaluating score changes over time using field and simulated data. The analysis was carried out using a previously created health index based on periodic oil diagnostics. A selected group of transformers working in different operating conditions and of various ages was used for this study. The paper’s contributions are as follows:
  • Simulations of the algorithm output based on different criteria to determine the magnitude of typical internal faults detectable through oil analysis;
  • Evaluation of the score changes observed within the population;
  • Recommendation of alarm and pre-failure thresholds based on the observed and simulated results.

2. Materials and Methods
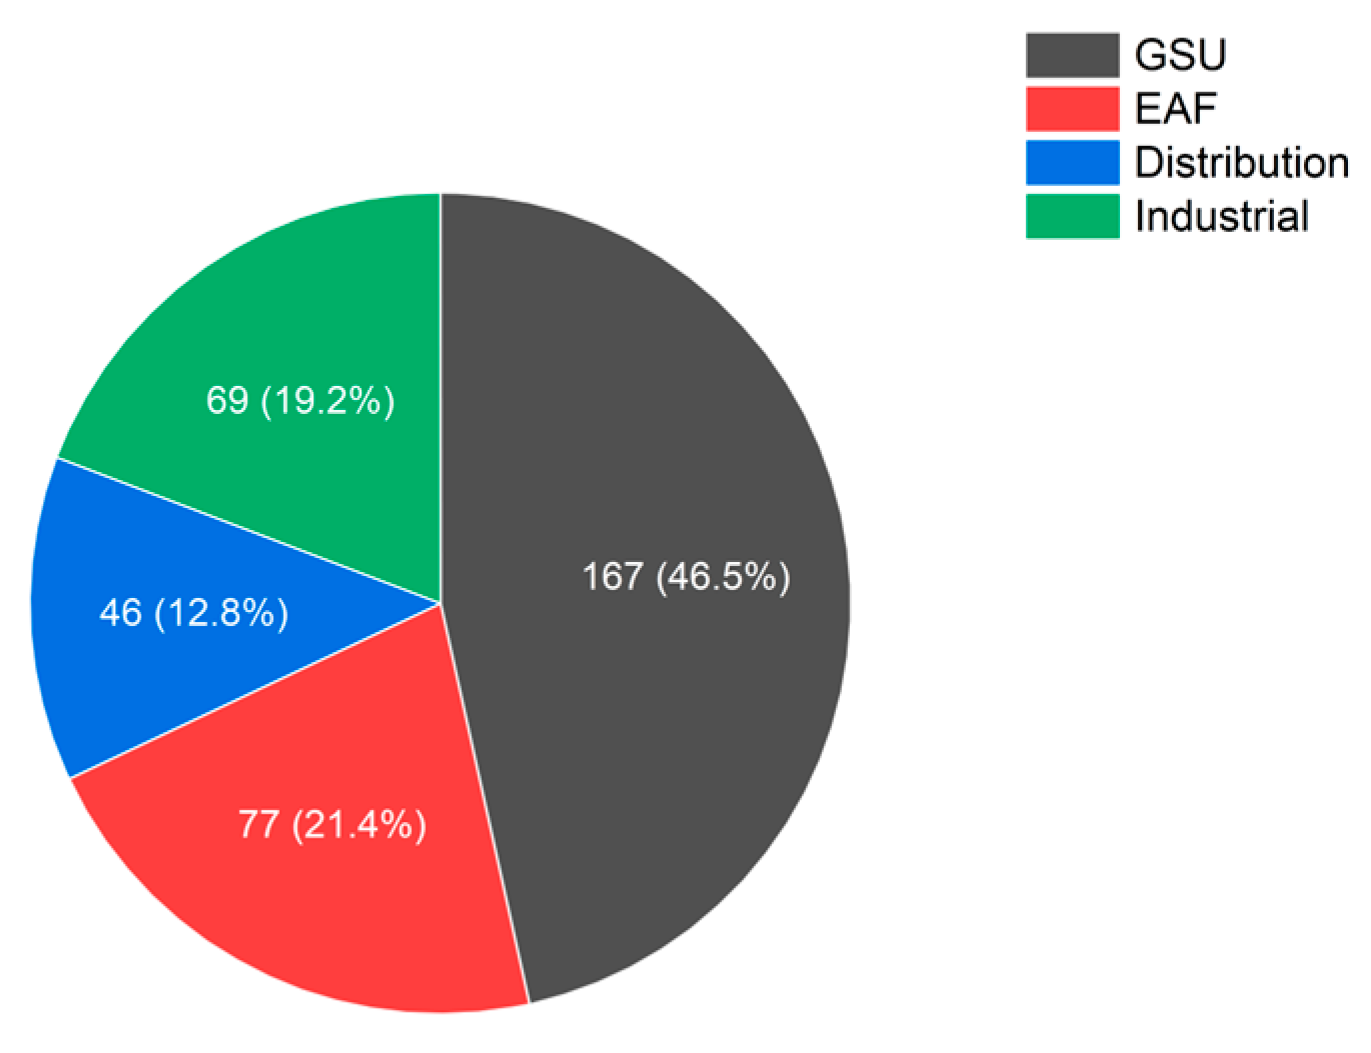
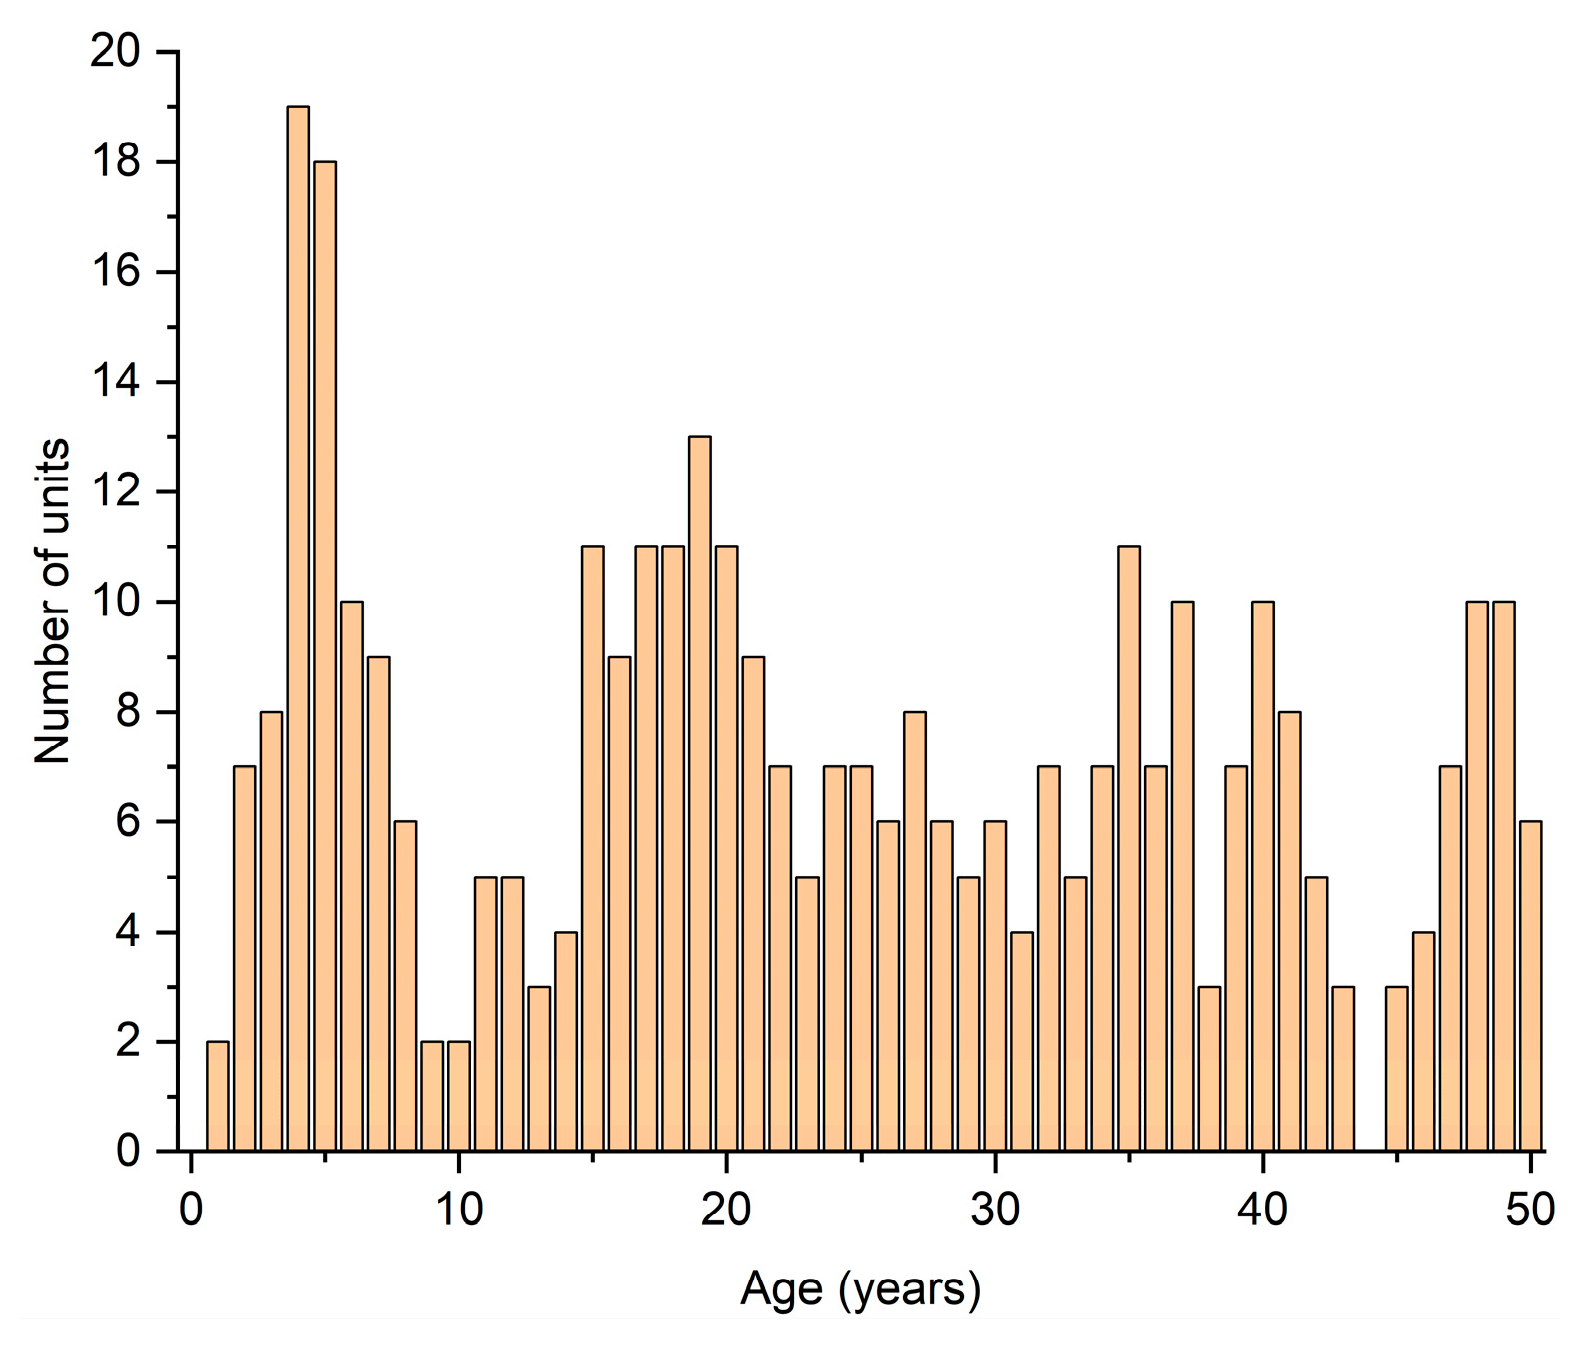
The basis of this study was the algorithm developed by the authors [18]. A concise description of the population and the algorithm’s structure is presented in the following subsections.

2.1. Study Group

The study group included power transformers installed in Polish power grids. The devices were characterized by upper voltages from 15 to 220 kV and rated power between 5 and 270 MVA. All units had mineral oil as liquid insulation, and most were equipped with an on-load tap changer. To ensure the presence of units with various load levels, the study group included generator step-up (GSU), electric arc furnace (EAF), distribution, and industrial transformers. The distribution of the operation type of the transformers in the study group is shown in Figure 1.
The study group included transformers aged less than a year to 50 years in operation. The authors decided not to include older units due to the non-conclusiveness of their results in population analyses, as described in [18]. The distribution of transformers’ age is presented in Figure 2.
Initially, the study population consisted of 620 complete oil analyses from 220 power transformers. The criteria introduced for long-term observations (equal or more than three measurements within at least two years) resulted in a population size drop. Then, for each transformer, the first record was reduced due to the transition from individual analysis to the score change between the subsequent analyses. Ultimately, the population consisted of 359 records from 86 power transformers.

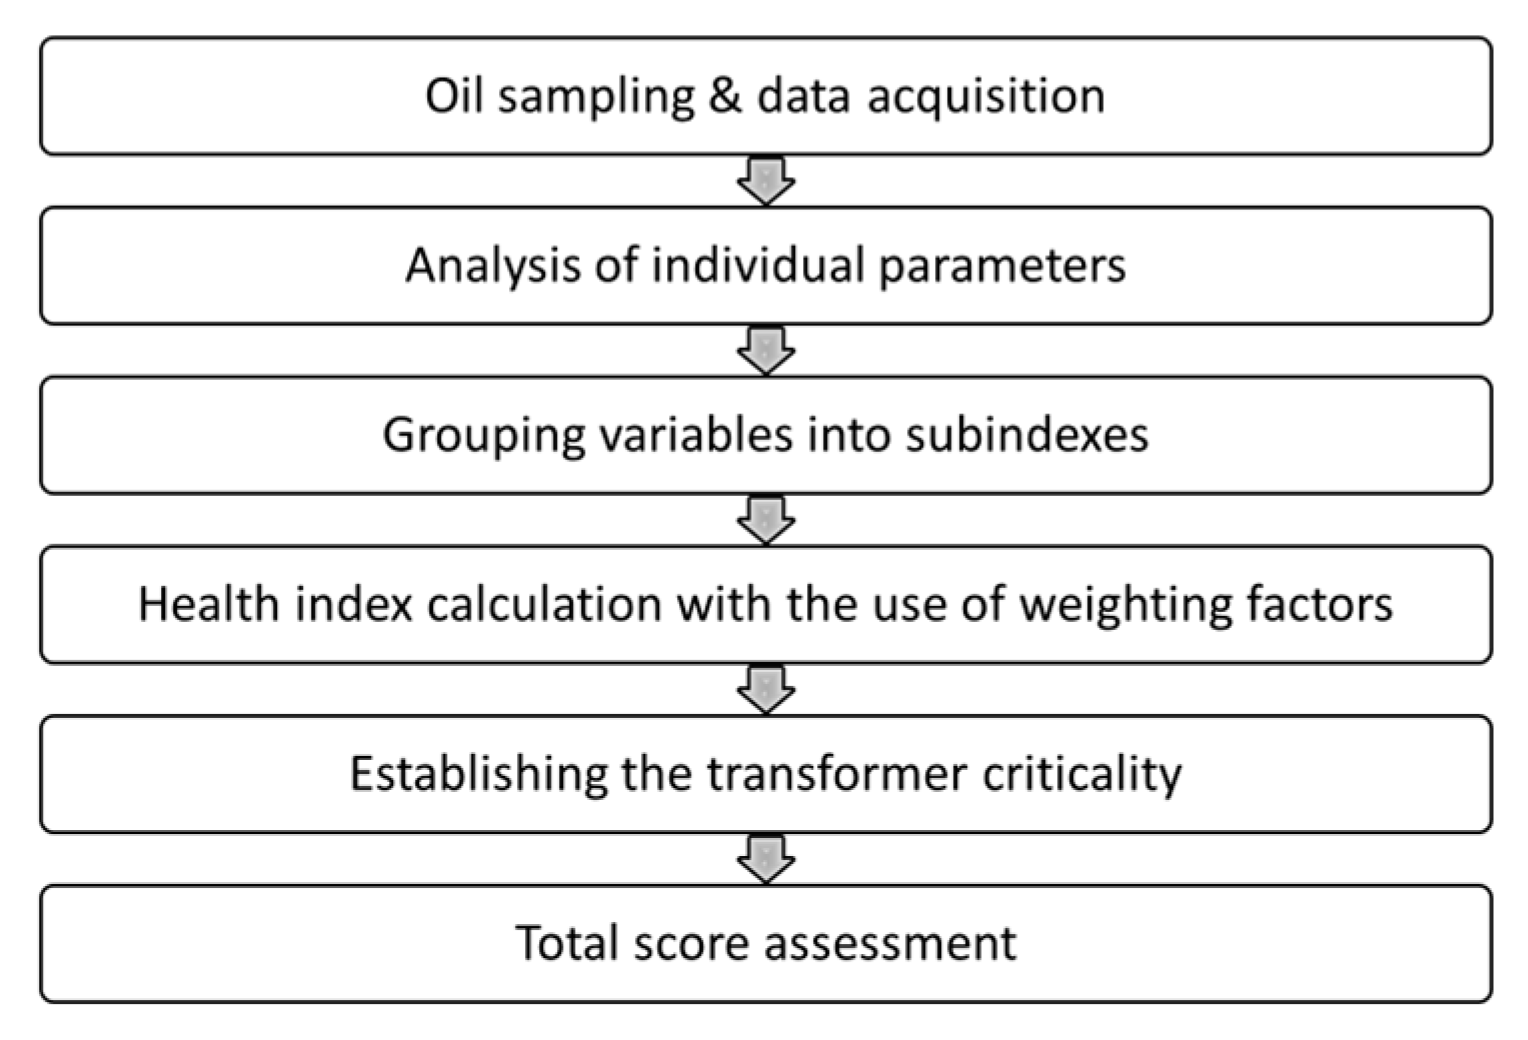
2.2. The Health Index Adopted for the Study

The algorithm used for the analysis is a health index based on routine diagnostics of the electrical insulating oil. The primary consideration in the design was to allow regular condition checks without the need for transformer de-energization. The inclusion of additional offline diagnostic methods would significantly increase the cost of a single health index analysis and decrease the condition evaluation frequency. The procedure steps are indicated in Figure 3, and the parameters included in the algorithm are presented in Table 1.
n index consists of three subindexes, which are a weighted sum of all the parameters included. The individual functions for each component have been determined based on the recommendations of IEC [19], IEEE [20,21], and CIGRE [22,23]. The choice of weighting factors for the parameters is important as it can significantly affect the efficiency of the evaluation [24]. The general relationships are given in Equations (1)–(4), where Fx(j) are the individual functions for each parameter included in the health index, with W(j) being their respective weighting factors, and Wx are the subindex weighting values. The exact mathematical functions, the philosophy behind their design, and the selection of weighting factors are described in detail in [18].
HI OIL = j = 1 n F OIL ( j ) · W ( j )
HI DGA = j = 1 n F DGA ( j ) · W ( j )
HI ISO = j = 1 n F ISO ( j ) · W ( j )
HI = HIOIL ∙ WOIL + HIDGA ∙ WDGA + HIISO ∙ WISO
Once the final health index value has been calculated, the importance of the transformer in the power system must first be determined to establish the device condition. The criticality is related to operating conditions and is determined once for each unit during the first health index calculation. The criticality of the device can be changed after considering factors such as the nature of the customer, lack of redundancy, or restricted maintenance possibilities. The classification is based on the division established in the Polish national guidelines for transformer operation [25]. The criticality division is presented in Table 2.
For each criticality level, individual evaluation criteria were assigned. These were based on the analysis of the observed values in each group of the transformers. The thresholds presented in Table 3 are shown in percentage values of the maximum obtainable score, 10 points. A value of 0% should be considered as 0 points, which corresponds to a condition of a new device, and 100% is 10 points, which indicates the end-of-life condition of the unit.
The algorithm was designed for routine diagnostics to detect even minor changes in oil parameters. Therefore, the individual functions were linear instead of the step functions typically used for other health indexes, which makes it much more suitable for analyzing changes in performance due to the much higher sensitivity to parameter changes than other methods.

3. Study Considerations

Since the presented algorithm has three main components—oil physicochemical properties, dissolved gas analysis, and 2-FAL concentration, the influence of each should be discussed separately.
The physicochemical properties used in the algorithm are characterized by a mixed rate of change in the parameters. Breakdown voltage and water content levels are often related, and the changes can be dynamic—between successive measurements, a significant deterioration of both parameters can occur due to overheating of the solid insulation or moisture penetration from the atmosphere. The remaining parameters: acidity and dielectric loss factor, are not subject to rapid changes, and the observation of trends takes place over several years. The authors assumed that significant changes in the value of the HIOIL subindex might occur between successive tests, which indicates a substantial deterioration in the prospects of failure-free operation of oil as a liquid insulating medium.
The values of dissolved gases in oil vary considerably over time. The rate of increase indicates an active defect within the transformer, and the gas ratio methods allow us to determine its nature. The results of DGA tests are one of the most critical determinants for undertaking broader diagnostics of the unit’s technical condition. Authors believe that the fluctuations in dissolved gas concentrations are the main factor affecting the health index due to the magnitude of the changes.
The furfural concentration is associated with solid insulation degradation, as the cellulose’s degree of polymerization (DP) can be approximated from the 2-FAL concentration using several calculation methods with various accuracy, as indicated in [26]. However, the observation of changes in this parameter is impossible during the initial years of operation due to its undetectable laboratory levels. Considerable increases are recorded for service-aged equipment or when the DP is below 400 [27]. Therefore, the authors assumed that significant changes in the health index values from 2-FAL may occur mainly for old transformers, and they warn about the decreasing mechanical strength of the cellulose insulation.
In technical standards and manuals, it is possible to find the average parameters change over time for devices in-service only for the dissolved gas analysis. Due to the lack of reference data for other groups, it is impossible to simulate the impact of average parameter changes on the health index outcome. Therefore, the study focused on performing simulations for different guidelines of 90th percentile changes in dissolved gases between successive measurements and on the general observations of trends in the study group.

4. Results

This section is divided into four parts. In the first one, simulations of the influence of concentration changes in gases dissolved in oil on the overall HI value were conducted using data from various sources. The second part analyzes health index variations across the whole population. The remaining parts present the highest recorded increases and decreases in the health index value over time.

4.1. The Simulation of Changes in Dissolved Gas Content

The 90th percentile values for DGA changes were adopted as it is considered that the values below this threshold are considered typical during normal operation. Failure is also possible, but the risk is much lower than for the values above this limit.
This paper used the reference values included in the IEC standard [19] and the publication [28]. The authors have also calculated the 90th percentile changes in the study group and used them for simulations. The reference values provided in the IEEE guide [20] were given for 95th percentile results, so they were not used in this study. A summary of typical yearly 90th percentile increases is presented in Table 4. In the IEC standard, the values were presented as a range, so the upper and lower limits were separated and presented as “low” and “high” scenarios.
The values provided in Table 4 were used to calculate the effect of each parameter change on the health index outcome. These results are given in Table 5.
Since single gas increases are rarely observable, simulations were performed for typical faults [29] determined by the Key Gas Method (overheated oil, overheated cellulose, partial discharges in oil, and arcing in oil) and the Duval Triangle 1 (D1: discharge of low energy, D2: discharge of high energy, DT: a mixture of thermal and electrical faults, PD: partial discharges, T1: thermal faults of less than 300 °C, T2: thermal faults of between 300 °C and 700 °C, and T3: thermal faults of over 700 °C) on an annual basis. The simulated results for the Key Gas Method (KGM) are presented in Table 6, and for the Duval Triangle 1 (DTM 1), they can be found in Table 7.
In the case of KGM, the values determined are the minimum impact on the health index value when the key gas value reaches a 90th percentile increase. However, for DTM 1, the local extrema were calculated for each sub-area considering the increase in the 90th percentile value of one of the gases, and the impact on the health index score should be interpreted as for the Key Gas Method.
The health index variations resulting from the 90th percentile gas increases are substantially higher for the faults identified by DTM 1. The IEC 60599 “high” criteria feature the most significant HI score changes, constituting notable variations in the overall value. This effect is not as significant for the study group results, indicating the need for applying lower observation thresholds.

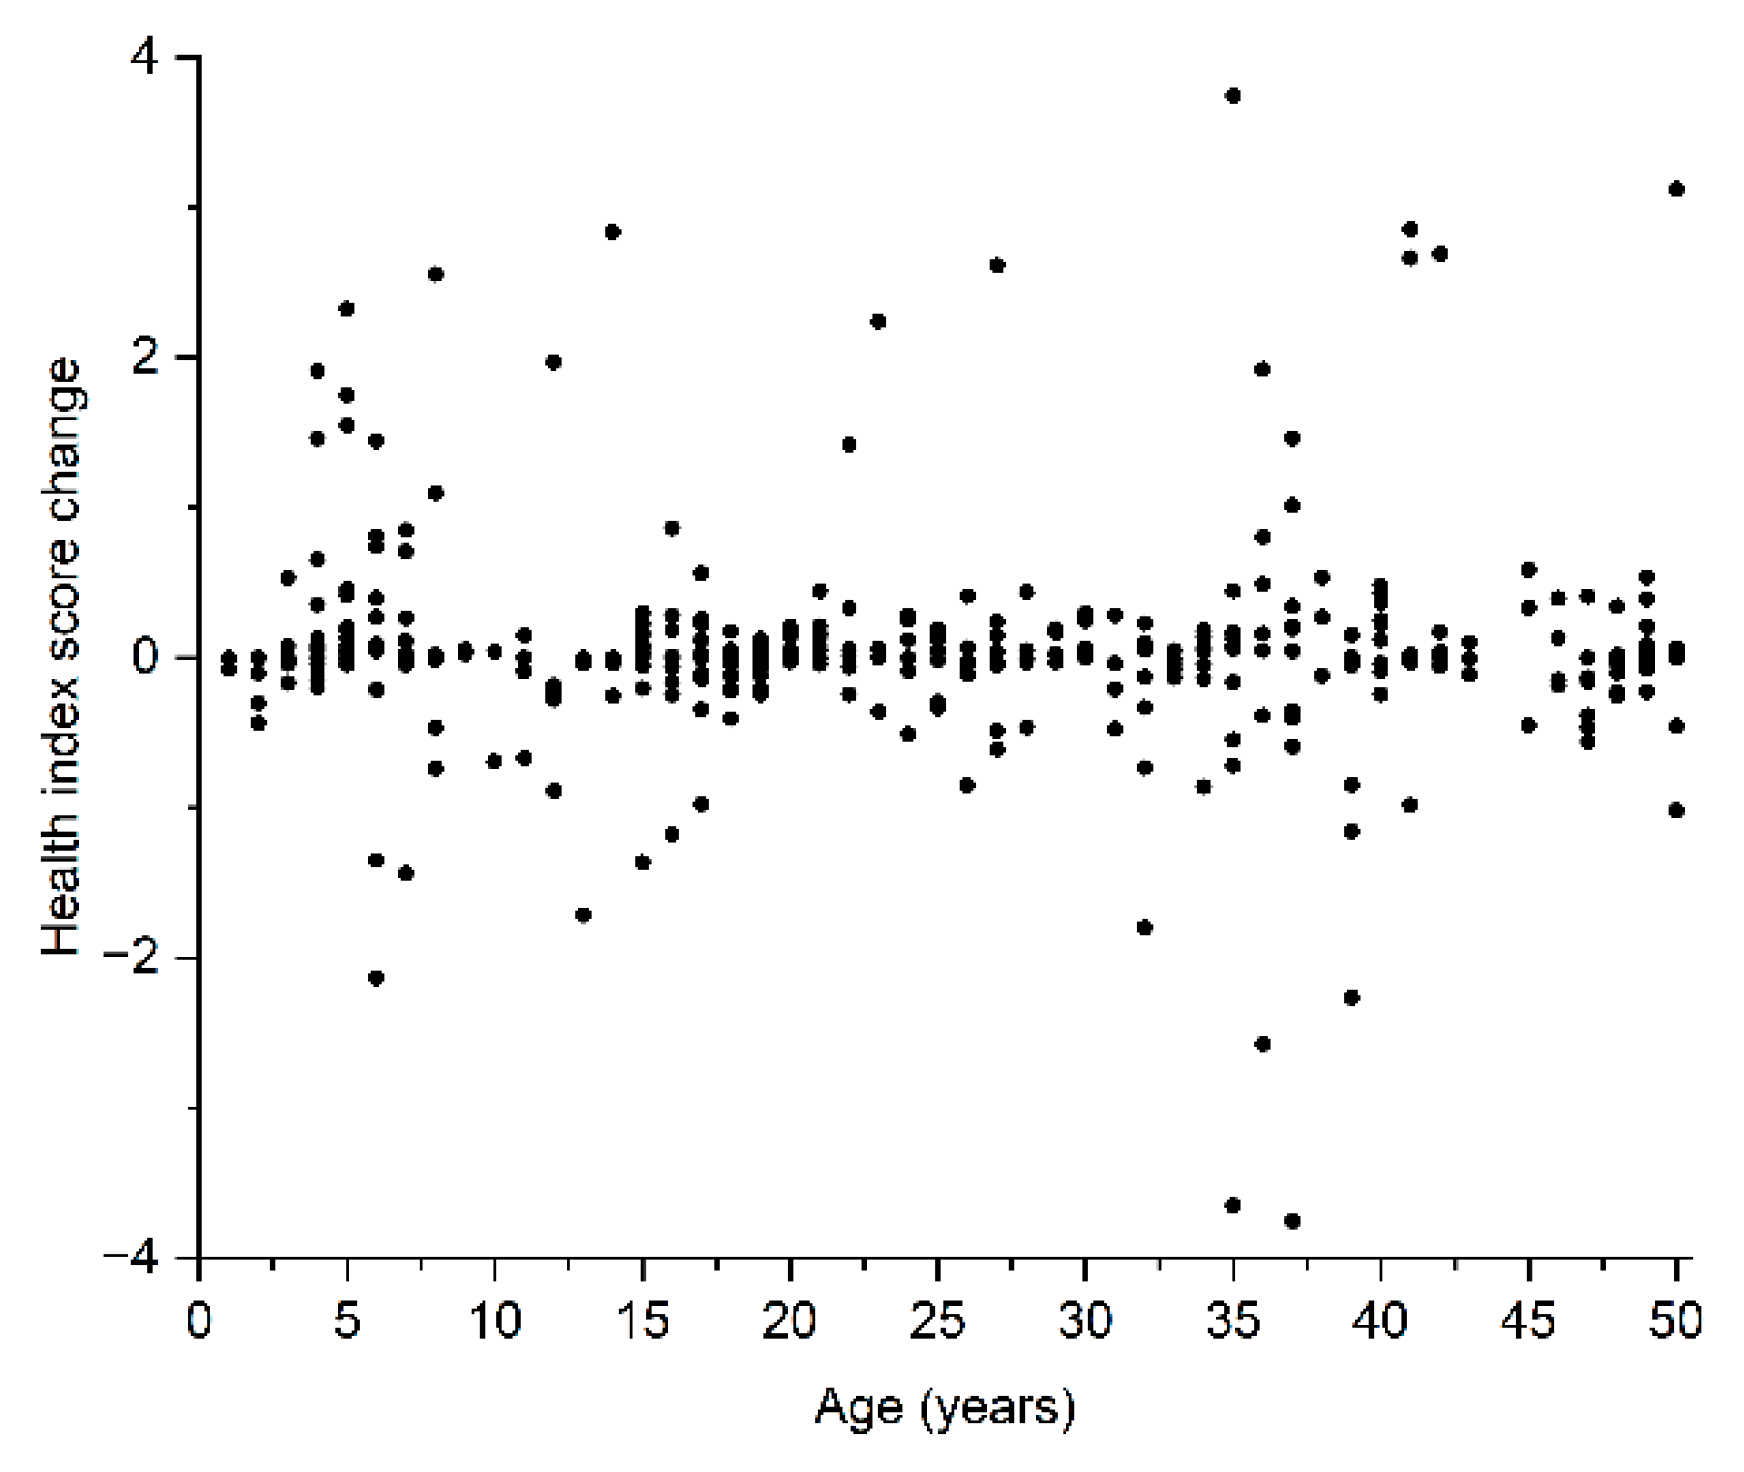
4.2. The Health Index Score Changes in the Population

Different sampling intervals characterized the majority of the calculated HI changes in the population. To enable the comparison, each result had to be recalculated to change over one year. This part of the study did not consider changes recorded within less than 90 days, as the observation period was too short. The standardized results of the health index variations versus device age are presented in Figure 4.
Figure 4 shows a significant concentration of results around value zero. The mean score was 0.057, which, on a sample of several hundred devices, confirms that the average change in the HI value over time is positive. In addition, the calculations of each subindex contribution were performed, and the results versus transformer age are presented in Figure 5.
The mean annual change of 0.057 consisted of 0.004 for HIOIL, 0.043 for HIDGA, and 0.010 for HIISO. The mean changes in values of all subindexes are positive, which indicates that gradual aging changes are notable across the population. Compared to the assessment thresholds presented in Table 3, the mean annual change does not pose a threat of major condition change, allowing for safe maintenance planning.

4.3. The Highest Recorded Increases in the Health Index Values

Significant increases in the health index score were identified within the population, and further study was required to analyze the causes. An increase of a minimum of 0.5 points between successive tests was adopted as a criterion for major positive HI value changes. The group consisted of 28 results, including four analyses after an emergency shutdown of the transformers. The results are shown in Figure 6, and selected details can be found in Appendix A.
To interpret the results, it is necessary to refer to the CIGRE analysis of the pre-failure states [30]. The pre-failure daily increases in individual gases are shown in Table 8, and the recalculated HI values for these thresholds considering the KGM and DTM 1 outputs can be found in Table 9 and Table 10.
Several individual results were in line with the guidelines from the CIGRE publication. The calculated values of health index variations in Table 9 and Table 10 may result in a significant condition change in a short period. Due to the magnitude of these changes, each major positive result shall be carefully investigated.

4.4. The Highest Recorded Decreases in the Health Index Values

Similar to the results presented in the previous paragraph, significant decreases in the HI values were also distinguished. The criteria were almost identical as in Section 4.3; however, a careful selection of results had to be made to identify the interference to the transformer’s health improving its technical condition. Therefore, transformers that underwent processes such as oil regeneration or de-gassing were not included. The group consisted of 21 results that were unaffected by human interference. The results are shown in Figure 7, and selected details can be found in Appendix B.
The results above indicate that the health index values may fluctuate significantly over time. The natural decreases in the content of gases dissolved in oil occur after periods of high thermal loads, which may be related to the operation conditions and occur naturally at certain times of the year.

5. Discussion

The 90th percentile values calculated in Section 4.1 for the study group are not significantly different from those indicated in the IEC standard. These values are unique to each population and will vary depending on the group size, the equipment design, and the operating conditions.
The results presented in Section 4.2 indicate that both substantial increases and decreases in the HI values can be observed over the entire age spectrum of the population. The mean change (0.067) in the study group is lower than the calculated variations in the health index resulting from the 90th percentile increases in gas concentrations for DTM 1 and most of the faults classified by KGM except for oil overheating.
The impact of the HIOIL was found to be the smallest of all the subindexes. This is because the parameters with slow variability—acidity and loss factor, do not show sufficient fluctuations to significantly influence the total health index score despite their weight factor. In contrast, the dielectric breakdown voltage and water content show greater variability, confirmed by the individual cases found during the analysis of the highest increases and decreases in the HI value.
The HIDGA subindex was, as anticipated, both the most significant contributor to increases and decreases in the health index output. Changes in the concentration of each of the five gases included in the subindex impact the overall HI, which is particularly visible in the detailed information provided in Appendix A and Appendix B.
The influence of the HIISO subindex was noticeable mainly due to the variations in the concentration of carbon monoxide and carbon dioxide. A high increase in the HI score from the 2-FAL concentration was noticed for two units; however, in most cases, this parameter greatly influences the long-term observation of the changes in technical conditions.
The calculated standard deviation was 0.725, which indicates a significant scatter of results in the population compared to the mean change. If the DGA criteria (90th percentile increase) for the changes in the HI were adopted, the alarming increase would be a change of more than 1.192. As the analysis of the highest score increases has shown, many of the alarming results do not meet this criterion despite the laboratory recommendations to shorten the diagnostic intervals. In addition, this value differs significantly from the calculations presented in Table 4 and Table 5 for the study group. This suggests separating the thresholds into alarm and pre-failure zones.
Due to individual features and various operating conditions, the authors propose an alarm threshold at the 50th percentile of the HI score variation (for the study group, it is 0.18 per year). Adoption of such value means that almost all types of defects (except D2 in DTM 1) indicated by the DGA at the 90th percentile increases in the gas concentrations may exist, which shows the need for future observation of the unit’s technical condition with greater care.
In the case of the pre-failure zone, a criterion of 90th or 95th percentile of the population increases is suggested (1.192 and 1.507, respectively). The four evaluations after the device’s emergency shutdown were above the 95th percentile. The choice of threshold level should depend on the operator and be dictated by the risk tolerance—with a more conservative approach, a 90th percentile level is recommended.
As far as the criteria for the natural decreases in the HI values are concerned, it is impossible to establish unambiguous criteria. Small drops in gas concentrations over time are a natural phenomenon associated with the so-called “transformer breathing” and the internal defect activity. Large decreases in the gas concentrations have been observed after the significant HI score increases, and in some cases, such situations would repeat regularly. This may be due to the operating conditions (thermal cycling) or seasonality (e.g., higher average operating temperatures during summer). Similar to the alarm threshold for HI value increases, the 50th percentile change, a decrease of less than −0.07 should be investigated.
The study was conducted using the algorithm developed by the authors, so the scoring guidelines do not apply to other health indexes. The alarm and pre-failure thresholds proposed above can be calculated for any numerical health index regardless of design. However, this requires commitment and initiative from their users to maximize the use of data provided by these tools.

6. Conclusions

In this paper, the variations in health index scores between successive measurements were investigated on a test group of 359 individual results from 86 transformers operating in various conditions using an algorithm developed by the authors. During the analysis of the health index value in the study group, it was found that each group of parameters could be a significant factor causing large fluctuations in the total score. The results have confirmed the assumptions that the changes in the dissolved gas content influence the variability of the overall results.
During the population analysis, alarm (50th percentile population increase—more than 0.18 per year) and pre-failure (90th or 95th percentile population increases—higher than 1.192 and 1.507, respectively) thresholds were proposed to determine the values that signal potential defects or increased operational risk. For the negative changes in the health index score, any decreases above the 50th percentile of the population changes (less than −0.07 per year) should be investigated individually to determine the nature of changes occurring in the unit.
However, it should be added that due to the size of the study group, further research on a larger group of devices of various diversity is required to confirm the reliability of the recommendations. The future study may concern the individual fleets with the same operating principles to identify specific relationships within such populations and investigation of health index score variations for transformers filled with alternative dielectric fluids (e.g., ester-based).

Author Contributions

Conceptualization, P.B.; methodology, P.B. and S.B.; investigation, P.B. and S.B.; writing—original draft preparation, P.B. and S.B.; writing—review and editing, P.B. and S.B.; visualization, P.B.; supervision, S.B. All authors have read and agreed to the published version of the manuscript.

Funding

This research received no external funding.

Institutional Review Board Statement

Not applicable.

Informed Consent Statement

Not applicable.

Data Availability Statement

Restrictions apply to the availability of these data. Data were obtained from Energo-Complex Ltd. (Piekary Śląskie, Poland) and are available from the corresponding author with the permission of Energo-Complex Ltd.

Acknowledgments

Authors would like to thank Energo-Complex Ltd. for providing the research data for this study.

Conflicts of Interest

The authors declare no conflict of interest.

Appendix A

This appendix provides selected details of the individual results presented in Section 4.3, which were the highest observable increases in the HI value within the study group. Table A1 lists the age of the device, details regarding the variation in the health index and the respective subindexes, the interval between successive tests, and the main factors responsible for the increase in the health index output. For the latter, increases in the greater than 90th percentile values specified by IEC [19] were considered significant changes for the DGA, and for the other parameters, major changes were listed.
Table A1. The detailed information concerning the major increases in the health index score in the study group.
ObjectAgeHI ChangeHIOIL
Change
HIDGA
Change
HIISO
Change
Testing Interval in DaysSignificant Changes
T180.980.000.980.00326DGA (CH4, C2H6, C2H4)
T2271.200.001.23−0.03167DGA (CH4, C2H6, C2H4)
T3502.18−0.562.690.05255DGA (H2, CH4, C2H6, C2H4, C2H2)
T4160.850.800.000.05358BDV and WC
T5410.860.000.340.52118DGA (CH4, C2H6, CO, CO2)
T6351.290.001.290.00126DGA (H2, C2H2)
T7361.070.080.730.26203DGA (H2, C2H6, C2H4, C2H2, CO2)
T8370.70−0.040.700.04175DGA (C2H6, C2H4, C2H2)
T9410.920.000.920.00118DGA (H2, C2H6, C2H4, C2H2)
T10120.940.090.580.27175DGA (CH4, C2H6, CO)
T11350.890.160.560.1763DGA (H2, CH4, C2H6, C2H4, C2H2, CO, CO2)
T12370.530.050.450.03190DGA (C2H6, C2H4, C2H2, CO2)
T13371.420.051.200.1736DGA (H2, CH4, C2H6, C2H4, C2H2, CO, CO2)
T14350.880.120.470.2988DGA (H2, CH4, C2H6, C2H4, C2H2, CO, CO2)
T15221.890.001.380.51486DGA (H2, CH4, C2H6, C2H4, CO, CO2)
T1661.350.000.450.90614DGA (CH4, C2H4) and 2-FAL
T17 *421.780.001.780.00242DGA (H2, CH4, C2H6, C2H4, C2H2)
T18 *122.480.002.480.0071DGA (H2, CH4, C2H6, C2H4, C2H2, CO)
T19 *81.580.260.141.18226DGA (H2, CH4, C2H6, C2H4, CO, CO2), WC and 2-FAL
T20 *233.20−0.013.76−0.55521DGA (H2, CH4, C2H6, C2H4, C2H2)
T21141.14−0.050.540.65147DGA (H2, CH4, C2H6, C2H4, CO, CO2)
T2260.690.110.580.00174DGA (H2, CH4, C2H6, C2H4)
T2340.910.630.280.00174DGA (H2, CH4, C2H6)
T2451.220.101.14−0.02191DGA (H2, CH4, C2H6, CO)
T2540.700.480.170.05174DGA (H2, CH4, C2H6, CO2)
T2650.810.050.650.11191DGA (H2, CH4, C2H6, CO)
T2750.570.000.270.30118DGA (H2, CH4, C2H6, CO, CO2)
T2860.530.000.320.21485DGA (H2, CO, CO2)
*—means that the analysis was performed after the emergency shutdown from transformer protections.

Appendix B

This appendix provides selected details of the individual results presented in Section 4.4, which were the highest observable decreases in the HI value within the study group. Table A2 lists the age of the device, details regarding the variation in the health index and the respective subindexes, the interval between successive tests, and the main factors responsible for the decrease in the health index output. For the latter, decreases in the greater than 90th percentile values specified by IEC [19] were considered significant changes for the DGA, and for the other parameters, major changes were listed.
Table A2. The detailed information concerning the major decreases in the health index score in the study group.
ObjectAgeHI ChangeHIOIL
Change
HIDGA
Change
HIISO
Change
Testing Interval in DaysSignificant Changes
T124−0.520.00−0.580.06375DGA (H2, CH4, C2H6, C2H4)
T235−1.040.00−1.040.00104DGA (H2, CH4, C2H4, C2H2, CO)
T312−0.480.00−0.39−0.09196DGA (H2, CH4, C2H4, C2H2, CO)
T435−0.610.00−0.59−0.02402DGA (CH4, C2H6, C2H4)
T536−1.240.05−0.98−0.31176DGA (H2, CH4, C2H6, C2H4, CO, CO2)
T637−1.01−0.05−0.92−0.0498DGA (H2, CH4, C2H6, C2H4, C2H2, CO2)
T734−0.50−0.05−0.13−0.32211DGA (C2H6, C2H4, C2H2, CO, CO2)
T835−0.560.00−0.46−0.10283DGA (H2, C2H2, CO)
T950−0.81−0.820.000.01291BDV and WC
T102−0.550.00−0.550.00283DGA (CH4, C2H6)
T117−0.75−0.04−0.54−0.17191DGA (CH4, C2H6, C2H4, C2H2, CO2)
T126−1.080.00−1.01−0.07184DGA (H2, CH4, C2H6)
T136−0.680.00−0.50−0.18184DGA (H2, CO, CO2)
T1447−0.55−0.10−0.15−0.30361DGA (CH4, C2H6, CO)
T1547−0.54−0.09−0.41−0.04427DGA (CH4, C2H6)
T1615−1.340.10−0.56−0.88357DGA (H2, CH4, C2H4, CO, CO2)
T1716−0.75−0.760.000.01233BDV and WC
T1827−0.580.00−0.25−0.33349DGA (C2H6, C2H4, CO, CO2)
T1936−0.550.00−0.40−0.15520DGA (CH4, C2H6)
T2039−1.650.00−1.32−0.33522DGA (H2, CH4, C2H6, CO)
T2131−0.68−0.08−0.34−0.26521DGA (CH4, C2H6)

References

  1. Tenbohlen, S.; Coenen, S.; Djamali, M.; Müller, A.; Samimi, M.H.; Siegel, M. Diagnostic Measurements for Power Transformers. Energies 2016, 9, 347. [Google Scholar] [CrossRef]
  2. IEEE. IEEE C57.152-2013—Guide for the Diagnostic Field Testing of Fluid-Filled Power Transformers, Regulators, and Reactors; Institute of Electrical and Electronics Engineers: Piscataway, NJ, USA, 2013. [Google Scholar]
  3. CIGRE. Guide for Transformer Maintenance; WG A2.34, Technical Brochure No. 445; CIGRE: Paris, France, 2011. [Google Scholar]
  4. Subocz, J.; Banaszak, S.; Kornatowski, E.; Szrot, M.; Węgrzyn, B.; Zenker, M. Transformers Technical Condition Assessment and Population Management (in Polish—Ocena Stanu Technicznego i Zarządzanie Populacją Transformatorów); Joint Publication; OBRE: Piekary Śląskie, Poland, 2013; ISBN 978-83-938292-0-0. [Google Scholar]
  5. Soni, R.; Mehta, B. Review on asset management of power transformer by diagnosing incipient faults and faults identification using various testing methodologies. Eng. Fail. Anal. 2021, 128, 105634. [Google Scholar] [CrossRef]
  6. Davidenko, I.V.; Kuzina, T.S. Analysis of the modern methods of the power transformers health index calculation. In Proceedings of the 2017 IEEE Conference of Russian Young Researchers in Electrical and Electronic Engineering (ElConRus), St. Petersburg and Moscow, Russia, 1–3 February 2017. [Google Scholar] [CrossRef]
  7. Azmi, A.; Jasni, J.; Azis, N.; Kadir, M.Z.A.A. Evolution of transformer health index in the form of mathematical equation. Renew. Sustain. Energy Rev. 2017, 76, 687–700. [Google Scholar] [CrossRef]
  8. Jahromi, A.N.; Piercy, R.; Cress, S.; Service, J.R.R.; Fan, W. An Approach to Power Transformer Asset Management Using Health Index. IEEE Electr. Insul. Mag. 2009, 25, 20–34. [Google Scholar] [CrossRef]
  9. Aman, T.A.; Mokhtar, A.S.; AizamTalib, M. Assessment The Overall Health Condition of Transformer Using Health Index and Critical Index Approach: TNB GRID Case Study. In Proceedings of the 2020 IEEE International Conference on Power and Energy (PECon), Penang, Malaysia, 7–8 December 2020. [Google Scholar] [CrossRef]
  10. Scatiggio, F.; Pompili, M. Health index: The TERNA’s practical approach for transformer fleet management. In Proceedings of the 2013 IEEE Electrical Insulation Conference (EIC), Ottawa, ON, Canada, 2–5 June 2013. [Google Scholar] [CrossRef]
  11. Picher, P.; Boudreau, J.F.; Manga, A.; Rajotte, C.; Tardif, C.; Bizier, G.; Di Gaetano, N.; Garon, D.; Girard, B.; Hamel, J.F.; et al. Use of Health Index and Reliability Data for Transformer Condition Assessment and Fleet Ranking. In Proceedings of the Session CIGRE 2014, Paris, France, 24–29 August 2014; pp. 24–29. [Google Scholar]
  12. Singh, A.; Swanson, A.G. Analysis and improvement of the plant health index by ESKOM to assess the condition of the power transformers in its distribution fleet. In Proceedings of the 19th International Symposium on High Voltage Engineering, Pilsen, Czech Republic, 23–28 August 2015. [Google Scholar]
  13. Elsisi, M.; Tran, M.Q.; Mahmoud, K.; Mansour, D.E.A.; Lehtonen, M.; Darwish, M.M. Effective IoT-based deep learning platform for online fault diagnosis of power transformers against cyberattacks and data uncertainties. Measurement 2022, 190, 110686. [Google Scholar] [CrossRef]
  14. Badawi, M.; Ibrahim, S.A.; Mansour, D.E.A.; El-Faraskoury, A.A.; Ward, S.A.; Mahmoud, K.; Lehtonen, M.; Darwish, M.M. Reliable Estimation for Health Index of Transformer Oil Based on Novel Combined Predictive Maintenance Techniques. IEEE Access 2022, 10, 25954–25972. [Google Scholar] [CrossRef]
  15. Li, S.; Wu, G.; Dong, H.; Yang, L.; Zhen, X. Probabilistic Health Index-Based Apparent Age Estimation for Power Transformers. IEEE Access 2020, 8, 9692–9701. [Google Scholar] [CrossRef]
  16. Prasojo, R.A.; Setiawan, A.; Suwarno; Maulidevi, N.U.; Soedjarno, B.A. Development of Power Transformer Remaining Life Model Using Multi-Parameters. In Proceedings of the 13th International Conference on the Properties and Applications of Dielectric Materials (ICPADM 2021), Johor Bahru, Malaysia, 12–14 July 2021. [Google Scholar] [CrossRef]
  17. Alvarez, D.L.; Rodriguez, D.F.; Cardenas, A.; Faria da Silva, F.; Leth Bak, C.; García, R.; Rivera, S. Optimal Decision Making in Electrical Systems Using an Asset Risk Management Framework. Energies 2021, 14, 4987. [Google Scholar] [CrossRef]
  18. Bohatyrewicz, P.; Mrozik, A. The Analysis of Power Transformer Population Working in Different Operating Conditions with the Use of Health Index. Energies 2021, 14, 5213. [Google Scholar] [CrossRef]
  19. IEC. IEC 60599:2015—Mineral Oil-Filled Electrical Equipment in Service—Guidance on the Interpretation of Dissolved and Free Gases Analysis; International Electrotechnical Commission: Geneva, Switzerland, 2015. [Google Scholar]
  20. IEEE. IEEE C57.104-2019—Guide for the Interpretation of Gases Generated in Oil-Immersed Transformers; Institute of Electrical and Electronics Engineers: Piscataway, NJ, USA, 2019. [Google Scholar]
  21. IEEE. IEEE C57.106-2015—Guide for the Acceptance and Maintenance of Insulating Mineral Oil in Electrical Equipment; Institute of Electrical and Electronics Engineers: Piscataway, NJ, USA, 2015. [Google Scholar]
  22. CIGRE. Recent Developments in DGA Interpretation; Joint Task Force D1.01/A2.11, Technical Brochure 296; CIGRE: Paris, France, 2006. [Google Scholar]
  23. CIGRE. Furanic Compounds for Diagnosis; WG D1.01 (TF13), Technical Brochure no. 494; CIGRE: Paris, France, 2012. [Google Scholar]
  24. Bohatyrewicz, P.; Płowucha, J.; Subocz, J. Condition Assessment of Power Transformers Based on Health Index value. Appl. Sci. 2019, 9, 4877. [Google Scholar] [CrossRef] [Green Version]
  25. Bagiński, A.; Domżalski, T.; Kaźmierski, M.; Łukaszewski, J.; Olech, W.; Olejniczak, H.; Owczarek, J.; Sieradzki, S.; Szymański, Z. Framework Instructions for Transformer Operation (in Polish—Ramowa Instrukcja Eksploatacji Transformatorów); Joint Publication; Zpbe Energopomiar-Elektryka: Gliwice, Poland, 2012; ISBN 978-83-916040-4-5. [Google Scholar]
  26. Walker, C.; Walker, D. Creation & Validation of Transformer Residual Life Models. In Proceedings of the 2022 IEEE 21st International Conference on Dielectric Liquids (ICDL), Sevilla, Spain, 29 May–2 June 2022. [Google Scholar] [CrossRef]
  27. Duval, M.; De Pablo, A.; Atanasova-Hoehlein, I.; Grisaru, M. Significance and detection of very low degree of polymerization of paper in transformers. IEEE Electr. Insul. Mag. 2017, 33, 31–38. [Google Scholar] [CrossRef]
  28. Bustamante, S.; Manana, M.; Arroyo, A.; Martinez, R.; González, A.; Rodriguez, J.I. Case Study—Calculation of DGA Limit Values and Sampling Interval in Power Transformers. In Proceedings of the 2019 6th International Advanced Research Workshop on Transformers (ARWtr), Cordoba, Spain, 7–9 October 2019. [Google Scholar] [CrossRef]
  29. Abu Bakar, N.; Abu-Siada, A.; Islam, S. A Review of Dissolved Gas Analysis Measurement and Interpretation Techniques. IEEE Electr. Insul. Mag. 2014, 30, 39–49. [Google Scholar] [CrossRef]
  30. Duval, M. Calculation of DGA Limit Values and Sampling Intervals in Transformers in Service. IEEE Electr. Insul. Mag. 2008, 24, 7–13. [Google Scholar] [CrossRef]
Figure 1. The operation type distribution of the transformers included in the study group.
Energies 15 06078 g001
Figure 2. The age distribution of the transformers included in the study group.
Energies 15 06078 g002
Figure 3. The overall scheme of the health index analysis.
Energies 15 06078 g003
Figure 4. The annual changes in the HI score between successive tests in the study group.
Energies 15 06078 g004
Figure 5. The annual changes in the subindex values between successive tests: (a) HIOIL; (b) HIDGA; (c) HIISO.
Energies 15 06078 g005
Figure 6. The major positive changes in the health index value between the successive measurements.
Energies 15 06078 g006
Figure 7. The major negative changes in the health index value between the successive measurements.
Energies 15 06078 g007
Table 1. The parameters included in the presented health index with the subindex breakdown.
Physicochemical Properties
HIOIL
Dissolved Gas Analysis
HIDGA
Solid insulation Evaluation
HIISO
Breakdown voltage (BDV)Hydrogen (H2)Furfural (2-FAL)
Water content (WC)Methane (CH4)Carbon monoxide (CO)
AcidityEthane (C2H6)Carbon dioxide (CO2)
Dissipation factorEthylene (C2H4)
Acetylene (C2H2)
Table 2. The division of device criticality levels for the condition assessment in the presented health index.
Level “0”Level “1”Level “2”Level “3”
Group I as per [25]Group I as per [25]Group II as per [25]Groups III and IV as per [25]
Crucial importanceSignificant importanceStandard importanceMinor importance
Table 3. The percentage thresholds of health index score for the condition assessment of devices of all criticality levels.
ConditionLevel “0”Level “1”Level “2”Level “3”
Good0–5%0–10%0–15%0–15%
Fair5–15%10–20%15–25%15–30%
Poor15–30%20–40%25–50%30–55%
Risky30–100%40–100%50–100%55–100%
Table 4. The 90th percentile values of gas level increase between successive sampling in ppm/year.
CriteriaH2CH4C2H6C2H4C2H2COCO2
IEC 60599 low3510532212601700
IEC 60599 high1321209014537106010,000
Bustamante et al. [28]9715820372231477
Study group2523531581451510
Table 5. The impact of the 90th percentile gas level increase between successive sampling on the health index score.
CriteriaH2CH4C2H6C2H4C2H2COCO2
IEC 60599 low0.140.050.000.110.410.200.14
IEC 60599 high0.520.590.050.490.720.570.57
Bustamante et al. [28]0.380.070.000.070.720.170.12
Study group0.100.110.030.050.160.110.14
Table 6. The calculated increases in health index score for faults determined by the Key Gas Method for 90th percentile gas increases.
CriteriaOverheated OilOverheated CellulosePD in OilArcing in Oil
IEC 60599 low0.080.190.130.21
IEC 60599 high0.420.570.520.57
Bustamante et al. [28]0.060.180.330.45
Study group0.060.110.100.12
Table 7. The calculated increases in health index score for faults determined by the Duval Triangle 1 for 90th percentile gas increases.
CriteriaD1D2DTPDT1T2T3
IEC 60599 low0.410.430.360.050.070.100.22
IEC 60599 high0.721.231.030.640.821.241.00
Bustamante et al. [28]0.720.720.230.080.100.150.14
Study group0.160.240.180.120.160.150.13
Table 8. The pre-failure gas increase rate in ppm/day.
CriteriaH2CH4C2H6C2H4C2H2COCO2
CIGRE351150.5N/R *N/R *
* N/R means that the pre-failure gas values are not reachable during operation.
Table 9. The calculated monthly increases in the health index score for faults identified by the Key Gas Method with the use of daily pre-failure gas increase rates indicated by CIGRE.
CriteriaOverheated oilOverheated CellulosePD in OilArcing in Oil
CIGRE0.46- *0.390.35
* CIGRE did not specify the pre-failure daily increase rate for CO, so the calculation is impossible.
Table 10. The calculated monthly increases in the health index score for faults identified by the Duval Triangle 1 with the use of daily pre-failure gas increase rates indicated by CIGRE.
CriteriaD1D2DTPDT1T2T3
CIGRE0.290.740.790.650.881.331.10
Publisher’s Note: MDPI stays neutral with regard to jurisdictional claims in published maps and institutional affiliations.

