Article

A Novel Energy Efficient Threshold Based Algorithm for Wireless Body Sensor Network

by
Suresh Kumar Arumugam
1,
Amin Salih Mohammed
2,3,
Kalpana Nagarajan
4,
Kanagachidambaresan Ramasubramanian
5,
S. B. Goyal
6,
Chaman Verma
7,*,
Traian Candin Mihaltan
8,* and
Calin Ovidiu Safirescu
9
1
Department of Computer Science and Engineering, Graphic Era Deemed to be University, Dehradun 248002, Uttarakhand, India
2
Department of Computer Engineering, Lebanese French University, Erbil 44002, Kurdistan Region, Iraq
3
Department of Software and Informatics Engineering, Salahaddin University, Erbil 44002, Kurdistan Region, Iraq
4
Department of CSE, PSNA College of Engineering and Technology, Dindigul 624622, Tamilnadu, India
5
Department of CSE, Veltech Dr. Rangarajan Dr. Sagunthala R&D Institute of Science and Technology, Chennai 600062, Tamil Nadu, India
6
Faculty of Information Technology, City University, Petaling Jaya 46100, Malaysia
7
Department of Media and Educational Informatics, Faculty of Informatics, Eotvos Lorand University, 1053 Budapest, Hungary
8
Faculty of Building Services, Technical University of Cluj-Napoca, 40033 Cluj-Napoca, Romania
9
Environment Protection Department, Faculty of Agriculture, University of Agriculture Sciences and Veterrnary Medicine Cluj-Napoca, Calea Manastur No. 3–5, 40033 Cluj-Napoca, Romania
*
Authors to whom correspondence should be addressed.
Energies 2022, 15(16), 6095; https://doi.org/10.3390/en15166095
Submission received: 29 June 2022 / Revised: 7 August 2022 / Accepted: 18 August 2022 / Published: 22 August 2022
(This article belongs to the Special Issue Energy Efficiency in Wireless Networks)

Abstract

:
Wireless body sensor networks (WBSNs) monitor the changes within the human body by having continuous interactions within the nodes in the body network. Critical issues with these continuous interactions include the limited energy within the node and the nodes becoming isolated from the network easily when it fails. Moreover, when the node’s burden increases because of the failure of other nodes, the energy utilization as well as the heat dissipated increases much more, causing damage to the network as well as human body. In this paper, we propose a threshold-based fail proof lifetime enhancement algorithm which schedules the nodes in an optimal way depending upon the available energy level. The proposed algorithm is experimented with a real time system setup and the proposed algorithm is compared with different routing mechanisms in terms of various network parameters. It is inferred that the proposed algorithm outperforms the existing routing mechanisms.

1. Introduction

Limited medical facility and need for smart digital environments have resulted in exponential usage of WBSN. The WBSN has wide application in areas, including sports, defence, medical, smart home automation, and Internet of Things (IoT) applications. The WBSN provides mobility to patients and avoids the feeling of being monitored. However, the WBSN should also provide prodigious care like being in the hospital during critical situations [1,2,3,4,5,6,7]. These tiny, embedded machines are power starving and energy issue is met through battery sources. In WBSN, the sensor node monitors the physiological signals of the human body and transmits the signal to the central node, called central monitoring unit (CMU), which is connected to doctors and other health workers. The CMU is superior in computing and energy capability when compared to other nodes. The data from the nodes are communicated 24 × 7 to ensure the medical safety of the seniors and post-surgical patients [8,9,10,11]. Engaging full-time monitoring by a node having limited energy supply makes nodes unavailable. In some cases, the sensor nodes are implanted inside the human body to monitor the signals deep inside the subject [12,13,14,15,16,17]. The overloading and continuous monitoring of the signal from implanted node heats the node and causes tissue damage to the subject [10]. The data from each sensor node are communicated to the sink either by star or mesh topology. Figure 1 depicts the STAR topology and MESH topology of the WBSN.
The star topology follows single hop communication and Mesh topology proceeds with multi hop communication. The cluster head (CH) selection or next hop selection mainly determines the lifetime of the network [18,19,20,21,22]. Table 1 illustrates the data rate and different physiological sensor comparison [3,4,10].

2. Related Works

Numerous algorithms on enhancing the lifetime and providing failure safe WBSN are proposed in papers [3,4,10,14,16]. These papers concentrate on providing enhanced lifetime by optimally scheduling the nodes and by selecting the next hop towards the sink. The N policy model-based scheduling of nodes in wireless sensor networks suits delay-sensitive applications. The transceiver switching energy is minimized in this N policy model [23,24,25,26,27,28]. The losses due to transceiver circuit on-off condition are taken into account. The number of the on-off condition of the transceiver circuit is reduced in N-Policy method. The packets are stored and forwarded through the N-Policy scheme. Nodes in networks are highly subjected to many failures based on depletion of energy, failure of hardware, errors in communication link and many other factors. Node failures due to communication link are common and hence the problem of mean time to failure and mean time to repair during the communication link is taken into account. Here, if any fault occurs during active state, the transmission is stopped and the fault at the node is detected. The packet transmission is continued in the active state after the faulty node recovers [10]. The Fail Safe Fault Tolerant (FSFT) algorithm in [3] enhances network lifetime in the group based WBSN. The packets are classified based on subject status and transmitted through high energy node. However, the thermal effect and tissue damage is not considered in FSFT approach. The TA-FSFT algorithm addresses the heating issue of an implanted node. The implanted node data is routed through a high energy node [10]. The TA-FSFT algorithm fails to consider distance as a factor. However, the power consumption and heat dissipation is with respect to distance.
The Adaptive Threshold based Thermal unaware Energy-efficient Multi-hop Protocols (ATTEMPT) algorithm addresses the topology change during critical condition, the algorithm concentrates in better hop selection. The Mobility-supporting Adaptive Threshold-based Thermal-aware Energy-efficient Multi-hop Protocol (M-ATTEMPT) [4] algorithm addresses the issue of network lifetime during critical conditions the CH rotation is done to enhance the lifetime of the network. The Multihop based WBSN suggested in [8] enhances the lifetime of the network through mesh topology. However, the mesh topology is delay sensitive in nature and node with maximum load are selected as CH, resulting in the network having a shorter lifespan. The list of possible condition for sensor to provide false data or improper data is discussed in [15] that includes (a) loose connection of sensors (b) hardware failure and (c) communication failure. All the above algorithms enhance lifetime of the network, however the node availability during critical condition and safe data delivery should be ensured during critical conditions with low thermal dissipation. To manage the energy consumption of sensor nodes, uses a pseudo-random route discovery algorithm and an improved pheromone trail-based update strategy [29,30]. The routing protocols must be developed to balance traffic among the various nodes that make up a WBASN. Vital signals from the human body demand various levels of service quality for various data kinds [31,32].
The FPLE algorithm proposed improves network lifetime and also ensures availability during the critical condition of the subject. The distance between the hospital and the subjects taken into account and the amount of reserved energy required to monitor subject during critical energy is calculated. The reserved energy is utilized only during abnormal conditions. The subject status is modelled as a finite state machine (FSM) with three states, i.e., (a) normal (b) above normal, and (c) abnormal. During Above normal and abnormal states exigent care is in need. The threshold-based T* Policy scheme suits delay in sensitive applications; it stores data and forwards after N packets. However, the data from the WBSN during Normal condition are delay insensitive in nature, the T* Threshold framework scheme is adapted during this condition to save energy. During critical condition, the node provides a continuous communication to the network.

3. Fail-Proof Lifetime Enhancement (FPLE) Algorithm
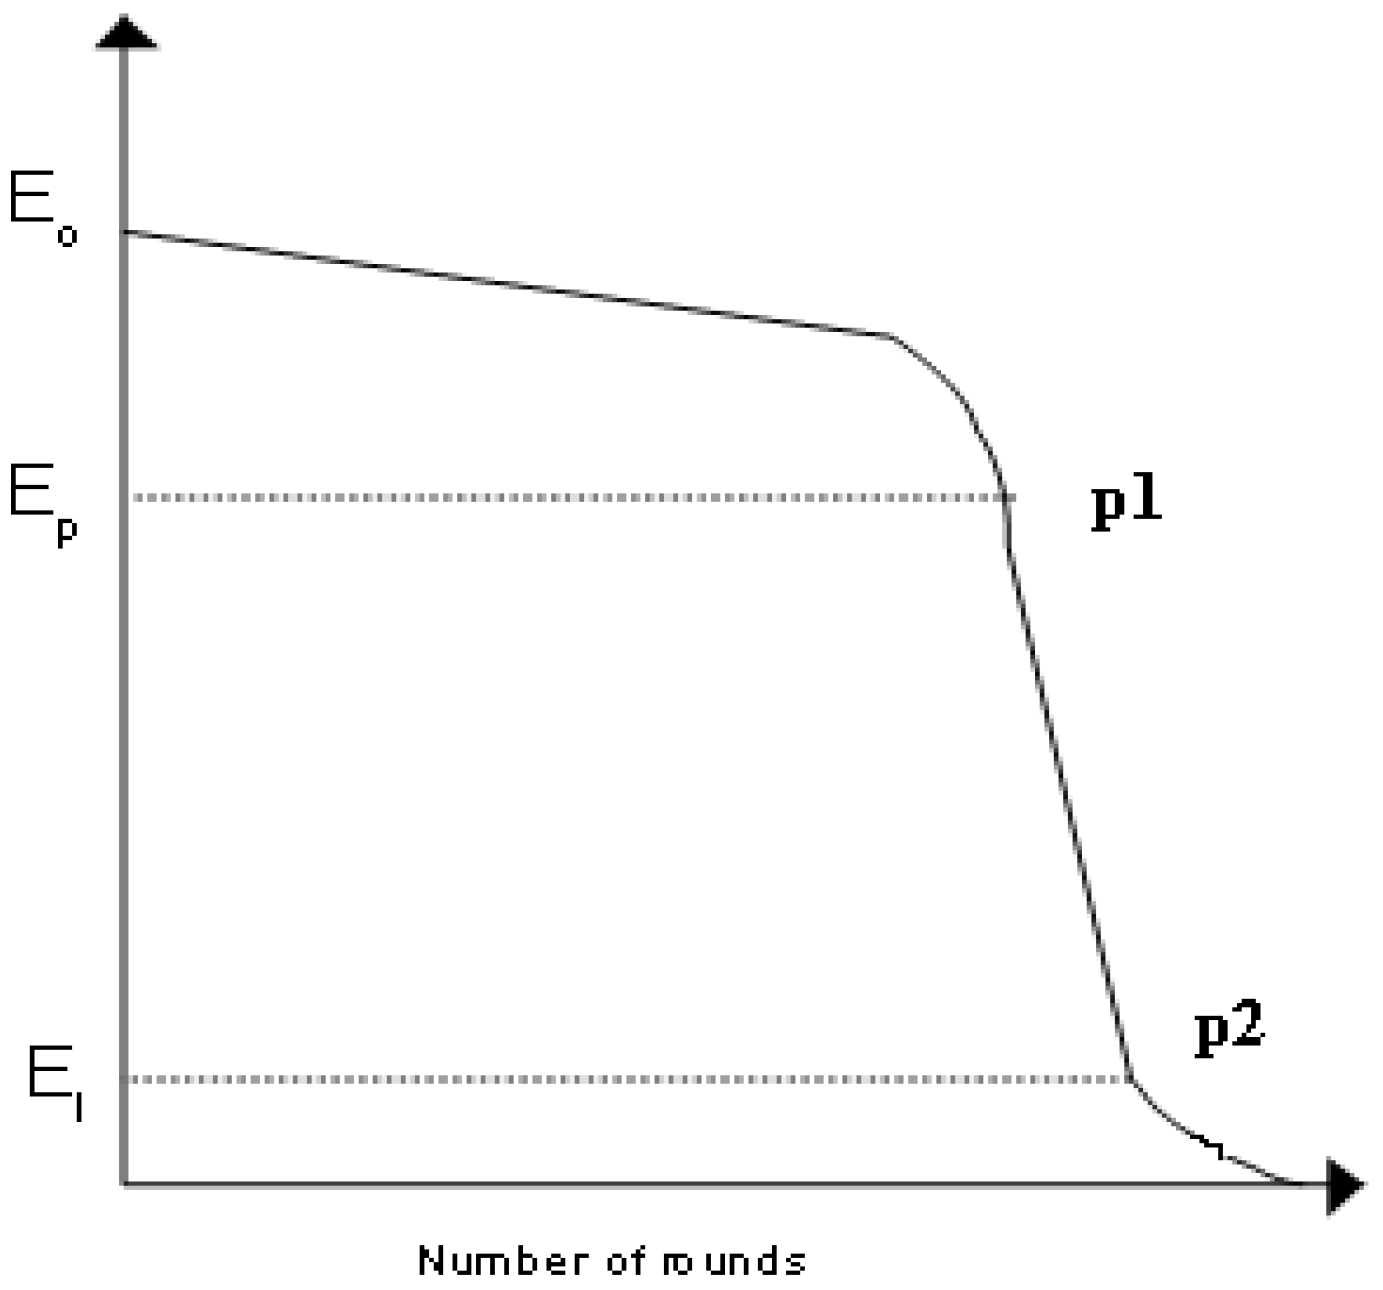
The sensor node connected with the subject is classified to primary sensors and secondary sensors. The primary sensors are always made available to sense the physiological signal of the subject. The secondary sensors are essential during critical conditions and close monitoring of subject is engaged during this state of operation. Here, electro cardio graph (ECG) and pulse rate (PR) signals are considered as primary sensors and made available all time. Continuous monitoring of data from the implanted node increases its thermal dissipation causing tissue damage to the subject, hence the implanted node is activated only during the critical conditions. The subject is realized with three states, i.e., (a) normal (S1) (b) above normal and (S2), and (c) abnormal (S3). The cross-correlation coefficient of sensor data with the subject normal data is considered for state transition.In the case of S1 the cross-correlation coefficient is low and slightly deviated in case of abnormal and the deviation is high in case of the abnormal state. The transition from one state to another state depends on the present input and is memory free in nature. Since the transitions exhibit Markov nature, the probability of transition from state to another state of the FSM is predicted through the Markov approach. Figure 2 illustrates the FSM realization of the subject.

3.1. Markov Model

In the case of Markov approach, the probability value of r different steps from x state to y state is given by conditional probability approach.
The probability of selecting state x to state y for n different steps is given by Equation (1).
Pxy = Pr (Pn = y | P0 = x)
Equations (2)–(4) denote the next step transition in Markov chain.
The probability of one-step transition from xth to kth is given in Equation (2).
Pxk = Pr (P1 = y|P0 = x)
Equations (3) and (4) give the time homogenous transition from x state to y.
The r steps transition is determined by Equation (3).
The time-homogeneous Markov chain is given as
Pr (Pn = y) = ∑r∈sPryPr (Pn−1 = r)
The general probability of choosing r steps is given in Equation (4).
Pr (Pn = y) = ∑r∈sPryPr (P0 = r)
The probability P of transition x state to y state is represented by the matrix in Equation (5).
P =   P r 11 P r 12 P r 13 P r 21 P r 22 P r 23 P r 31 P r 22 P r 33  

3.2. Battery Model

The power starving battery is modelled with the voltage decaying process. The fully charged battery shows high voltage due to high charge density and loses while discharging which results in low potential across its terminals. Figure 3 summarises the battery voltage curve of the battery in which E0 is the initial voltage of the battery when it is fully charged. The point p1 and p2 are utilized for setting the threshold limits in the algorithm.
Equation (6) expresses the voltage (V) curve of the battery cell in which E is the voltage across the terminals of the battery and x1, y1, z1, x2, y2, and z2 are curve constants which depend on the diffusion of chemicals inside the battery.
E = x1sin(y1a + z1) + x2sin(y2a + z2)

3.3. Radio Model

The reserved energy for a battery is computed with the data rate of the node and distance between the subject and medical help. Table 1 illustrates the data rate of the different sensor attached over the body. The energy taken by the transceiving unit for transceiving a bit of data is provided in Equations (7) and (8).
ETX(k,d) = Eeleck + Efskd2; d < d0
          = Eeleck + Empkd4; d > d0               
ERX(k) = Eeleck
The residual energy for a particular physiological sensor is calculated as given in Equation (9).
ERE = Energy due to transceiving unit × Data rate × time
k—umber of bits;
d—distance between the nodes;
Eelec—Energy expense/bit to run the transmitter (TX) or the receiver (RX) circuit;
Erx—Energy expense during data reception;
Efs (pJ/(bit-m2)), Emp(pJ/(bit-m2))—Energy expense/bit to process the amplifier of the transmitter determined by the distance between the TX and RX.
The nearby medical help is assumed to be within 9–27 miles. The ambulance arrival time is considered to be 10 min in minimum and not later than 60 min [9,10].

3.4. Threshold T* Policy Framework

The threshold policy T* reduces the number of transceiver switching conditions. The store and forward strategy used reduces power consumption. The optimum number of packets to be in a hold during normal and faulty node condition is given as follows.
Terminologies
λRate at which the packets are arrived
µRate at which the packets are serviced
ρUtilization factor
TThreshold number of packets
ETXAmount of energy consumed during transmit mode in J
ETRAmount of energy consumed due to synchronization and switching in J
E[C]Average cycle duration
E[T]Average energy consumption of node as a function of T in J
E[I]Sensor node’s average duration in Idle state
CyMean number of cycles
LAverage number of packets
PIIdle-state probability
The Idle-state probability (PI) is defined as the ratio of sensor node’s average duration in Idle state to the average cycle duration. Equation (10) illustrates the probability of a node to be in idle condition. The process of determining the threshold T* during normal and faulty condition is provided in (a) and (b).
(a)
T* Node during normal operation condition
P I = E I E C  
P I = E I E C  
P I = 1 ρ  
From Equations (10) and (11).
E C = T λ 1 ρ  
where
ρ = λ µ  
The mean number of cycles (Cy) is given as
C y = 1 E C  
Hence Cy is obtained from Equation (13) is given as,
C y = λ 1 ρ T  
The average or mean energy consumption of an sensor node E(T) is given by,
E T = E T X L + E T R C y  
On the basis of M/G/1 queuing model, the mean or average number of packets (L) in a sensor node is expressed as in Equation (17).
= n = 1 T 1 n P I n + n = 1 n P B n  
where
L equals ρ + λ 2 E S 2 2 1 ρ + T 1 2 and E[S2] is the 2nd order service time moment and L is found to be,
L = ρ 2 ρ 2 1 ρ + T 1 2  
Equating Equation (18) with Equation (16), E[T] is found. Here, the energy cost E[T]with reference to the average or mean number of packets is given by Equation (19).
E T = E T X ρ 2 ρ 2 1 ρ + T 1 2 + E T R λ 1 ρ T  
The optimal threshold (T*) value is the one T which corresponds to the minimal energy taken by the node and the following inequality condition is used to determine T*.
E T E T + 1 < 0  
T* is determined based on Equations (19) and (20) as in Equation (21),
T * = 2 E T R λ 1 ρ E T X  
(b)
T* Model under node fault condition (Communication failure)
E C = T λ 1 ρ b r  
where
  ρ br = ρ 1 + α β
The mean number of cycles Cy is obtained from Equation (14) is given with α, β as follows,
C y = λ 1 ρ b r T  
On basis of M/G/1 queuing model, the mean packets L in faulty condition is given in Equation (24).
L = ρ b r + λ 2 ρ b r 2 E S 2 2 ρ 2 1 ρ b r + λ α ρ E B r 2 2 1 ρ b r + T 1 2  
where E[Br2] is the second-order moment of mean repair time, failure rate follows the Poisson process with mean time to failure 1/α and with mean repair time 1/β, and the L is found in Equation (25).
= ρ b r + ρ b r 2 2 1 ρ b r + λ α ρ 2 β 2 1 ρ b r + T 1 2  
Equating Equation (25) with Equation (24), E[T] is calculated and it is given in Equation (26).
T = E T X ρ b r + ρ b r 2 2 1 ρ b r + λ α ρ 2 β 2 1 ρ b r + T 1 2 + E T R λ 1 ρ b r T  
Using Equation (26), the optimal threshold (T*) under faulty condition is given in Equation (27), and it is expressed as,
T * = 2 E T R λ 1 ρ b r E T X  
Figure 4 elucidates the architecture of the FPLE algorithm. The data from the primary sensors are hoped to the coordinator (or) sink through high energy cum high potential node to enhance its lifetime. The other secondary sensor transmits its I-am-alive packet directly to the CMU to ensure its presence for facing the critical conditions. The data from the implanted during above normal condition is hoped to the neighbor node nearby, under the abnormal condition the implanted node data is hoped directly to sink. As the energy dissipation is proportional to distance and number of bits transmitted, the implanted node dissipates low energy transmitting data to the node very nearby. The tissue damage to the implanted node is avoided by hoping data to the nearby node. The node acting as a transceiver follows T-threshold framework where the packets are stored and forwarded towards the sink to save energy of the nodes.
Algorithm 1 illustrates the proposed FPLE algorithm. The reserved energy in the algorithm is calculated with subject distance and nearby medical help available as given in Equation (9). The alarm is given to the neighbor under a fault condition and low energy condition. Under fault conditions, the data arrival rate from the sensor node increases causing increased data transmission. The fault occurrence α and repair rate β are considered as from Equation (23). The threshold rate between β → α is considered from the T-Threshold model.
When the state of the subject enters above normal or abnormal state, the sensor nodes check the data rate to detect a loose connection, value limit to find hardware failure, and also check with other primary sensor cross-correlation coefficients to avoid false computation. Algorithm 2 illustrates node fault detection of the proposed FPLE algorithm.
Algorithm 1: FPLE routing
BEGIN PROCESS
While(1)
Cross-correlate the ECG and HB value with normal data
 IF cross correlation coefficient εr < ε1
  subject under normal condition;
  reserved Energy RE = ERE; // compute reserved energy from Equation (9);
  While1 (1)
   receive I am alive packet from all nodes; delay();
 if I am alive packet not received or RE < ERE
alarm;
end if
  end while1
   if1 VECG > VPR
    ECG sensor works as a CH
   Route the PR & ECG data towards sink if T = T*
go to if1;
   else
    PR sensor works as a CH
Routes the ECG data towards sink if T = T*;
   end if1
 else IF cross correlation coefficient ε1 < εr < ε2
  Check node fault();
Wakeup all idle nodes subject under above normal condition;
  Reserved Energy RE = 0;
  Implanted node selects high energy and high signal strength node;
  All the other nodes directly send data towards sink following star topology;
 else
  Check node fault();
Wakeup all idle nodes subject under abnormal condition;
  All nodes send data directly to sink;
end IF
end while
Algorithm 2: FPLE Node Fault Check
Begin node fault
 Check data rate;
 Check value limit
 Check cross correlation coefficient with neighbor primary sensor node;
End

3.5. Proof for FPLE Being Thermal-Aware

The node chooses a high voltage node as the next hop towards the sink. The energy dissipated during the transmission and receiving of data is given in Equations (7) and(8), choosing a high voltage node as a router decreases the current consumption thereby enhancing the network lifetime. Equation (28) illustrates the energy taken from the battery.
E = VB × IN × t
Equation (29) provides the amount of energy consumed as distance when the node is performing the role of the router.Increase in distance increases the energy consumption thereby increasing the temperature of the node.
ECH = Eeleck + Empkd4 + Eeleck
Solving Equations (28) and (29)
VB × IN × td = Eeleck + Empkd4 + Eeleck
I N = E e l e c k + E e l e c k 4 + E e l e c k V B   × t d  
Equations (30) and (31) illustrate that the increased load increases the current consumption fastening the battery decay. The voltage decaying process of the battery is illustrated in Equation (6). The node with low voltage acting as a router drains more current to compensate for the rise in load. The implanted node of the subject is only allowed as a participant. Thereby, it is awakened during above normal and abnormal condition, thereby the temperature rise in node due to overloaded is avoided.

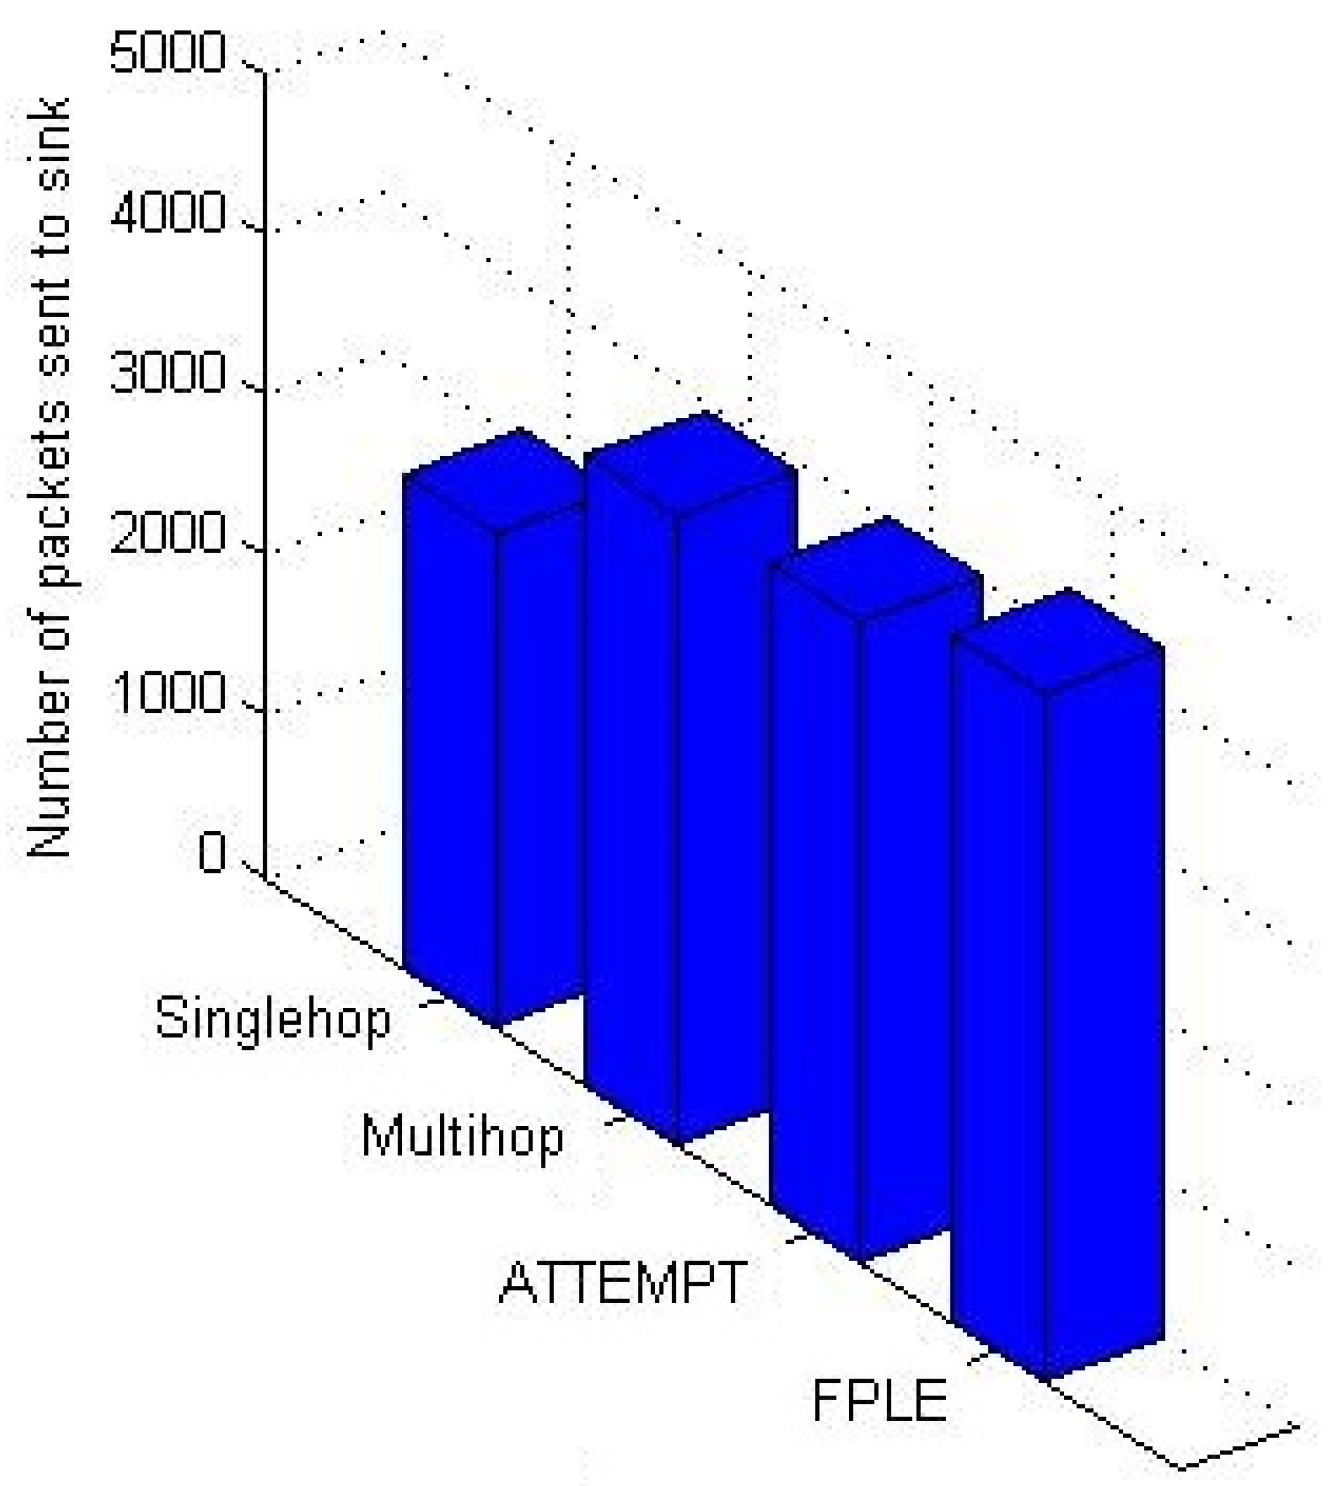
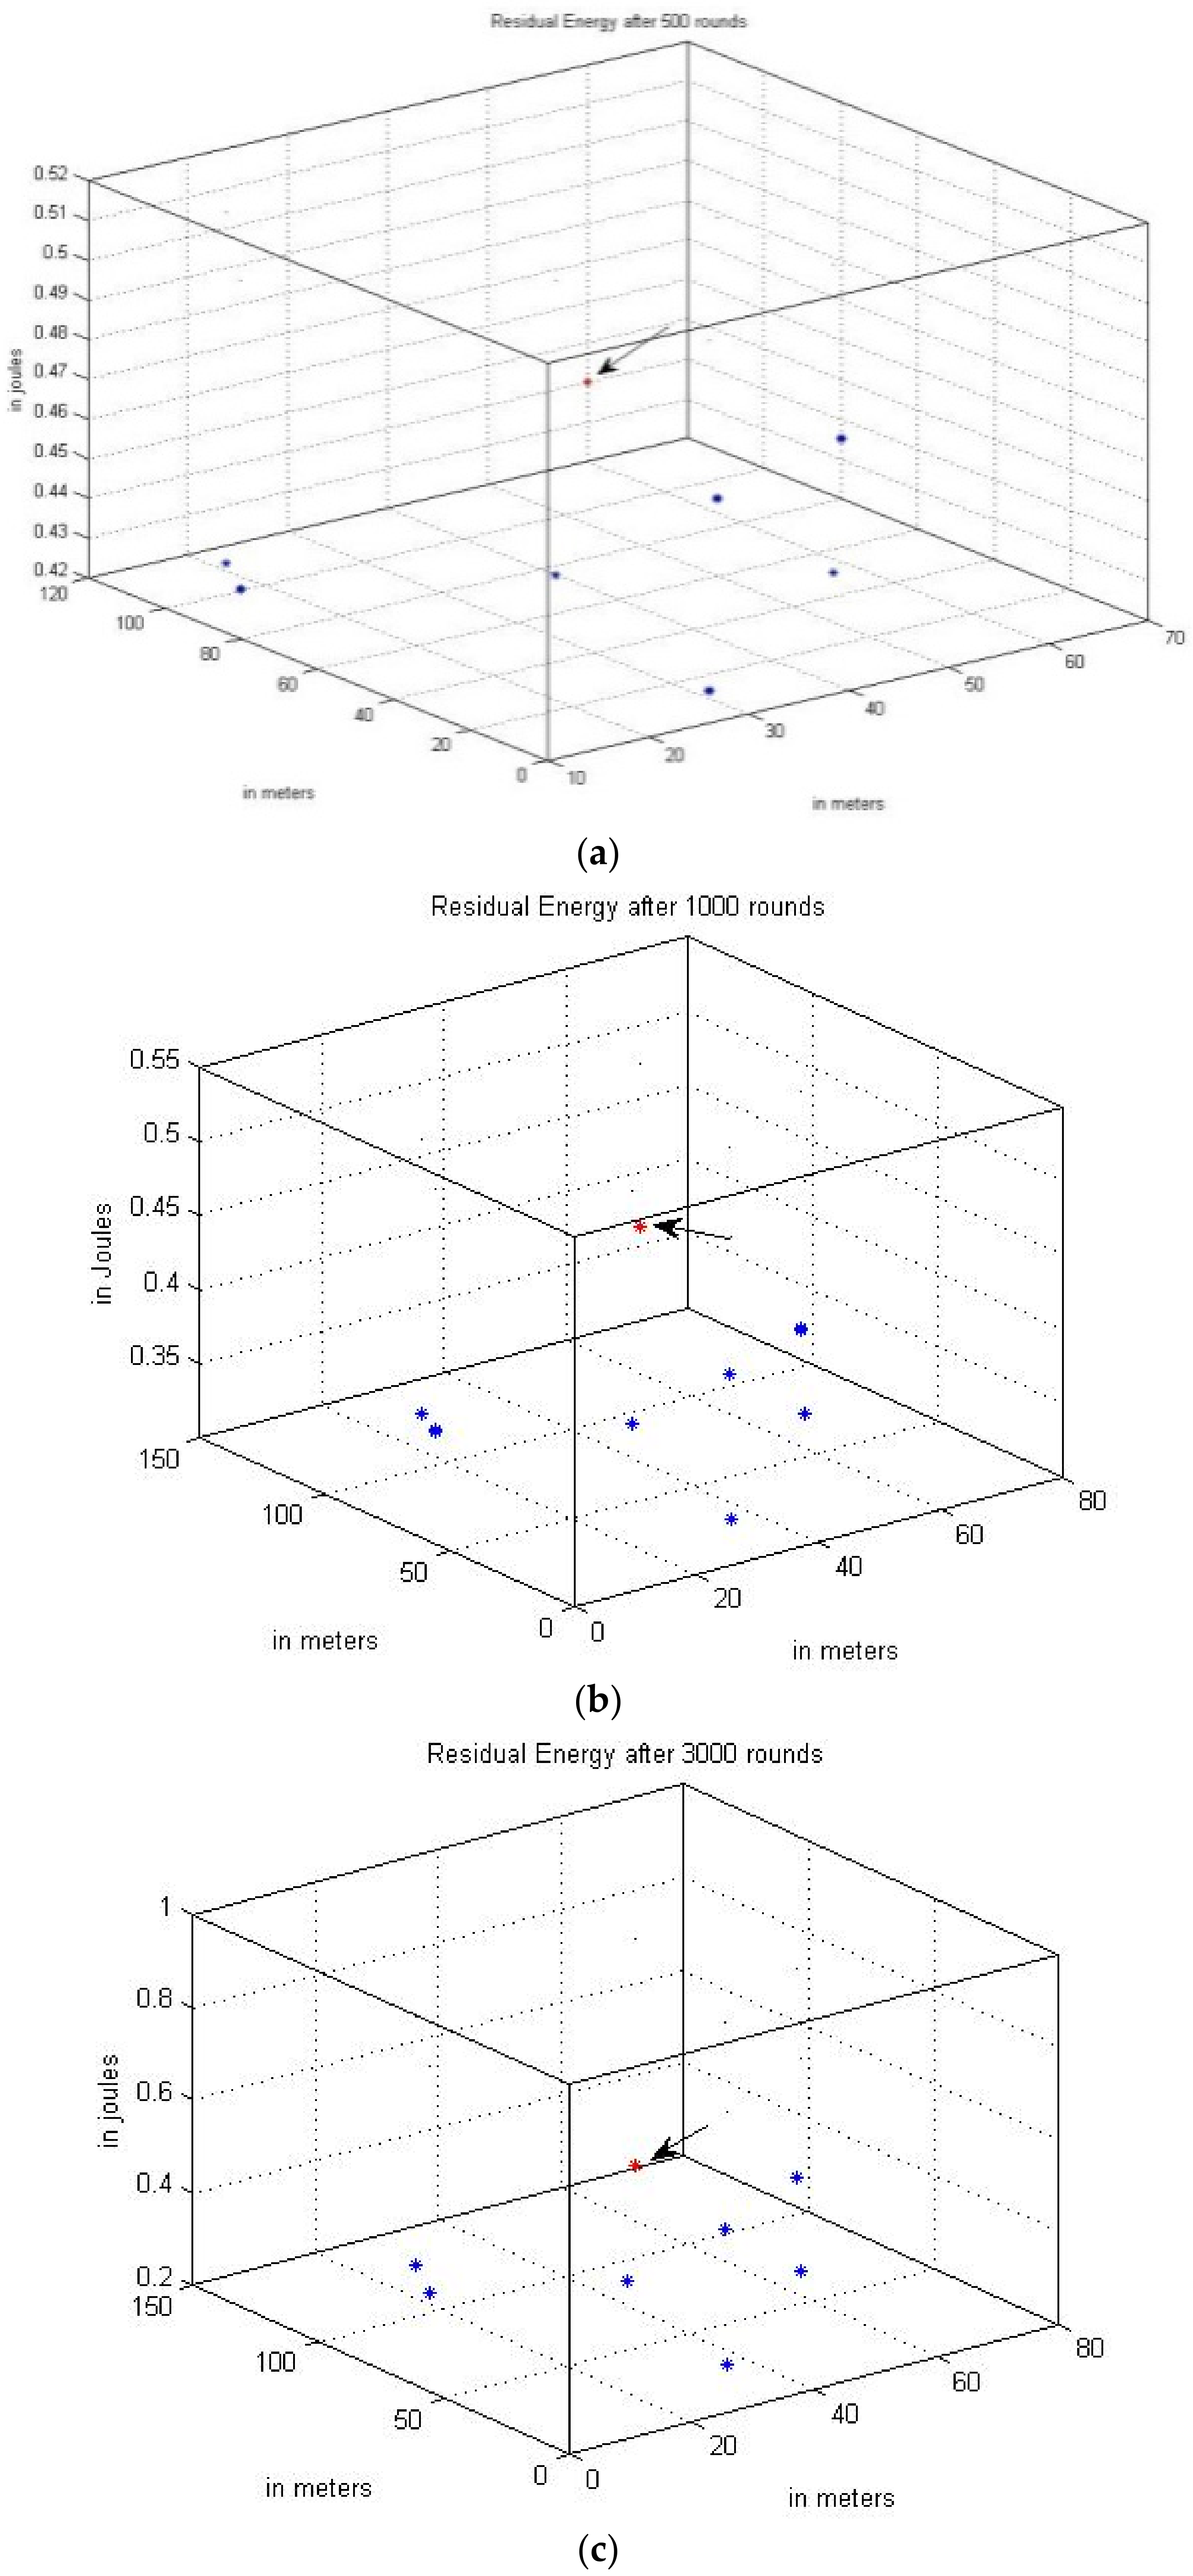
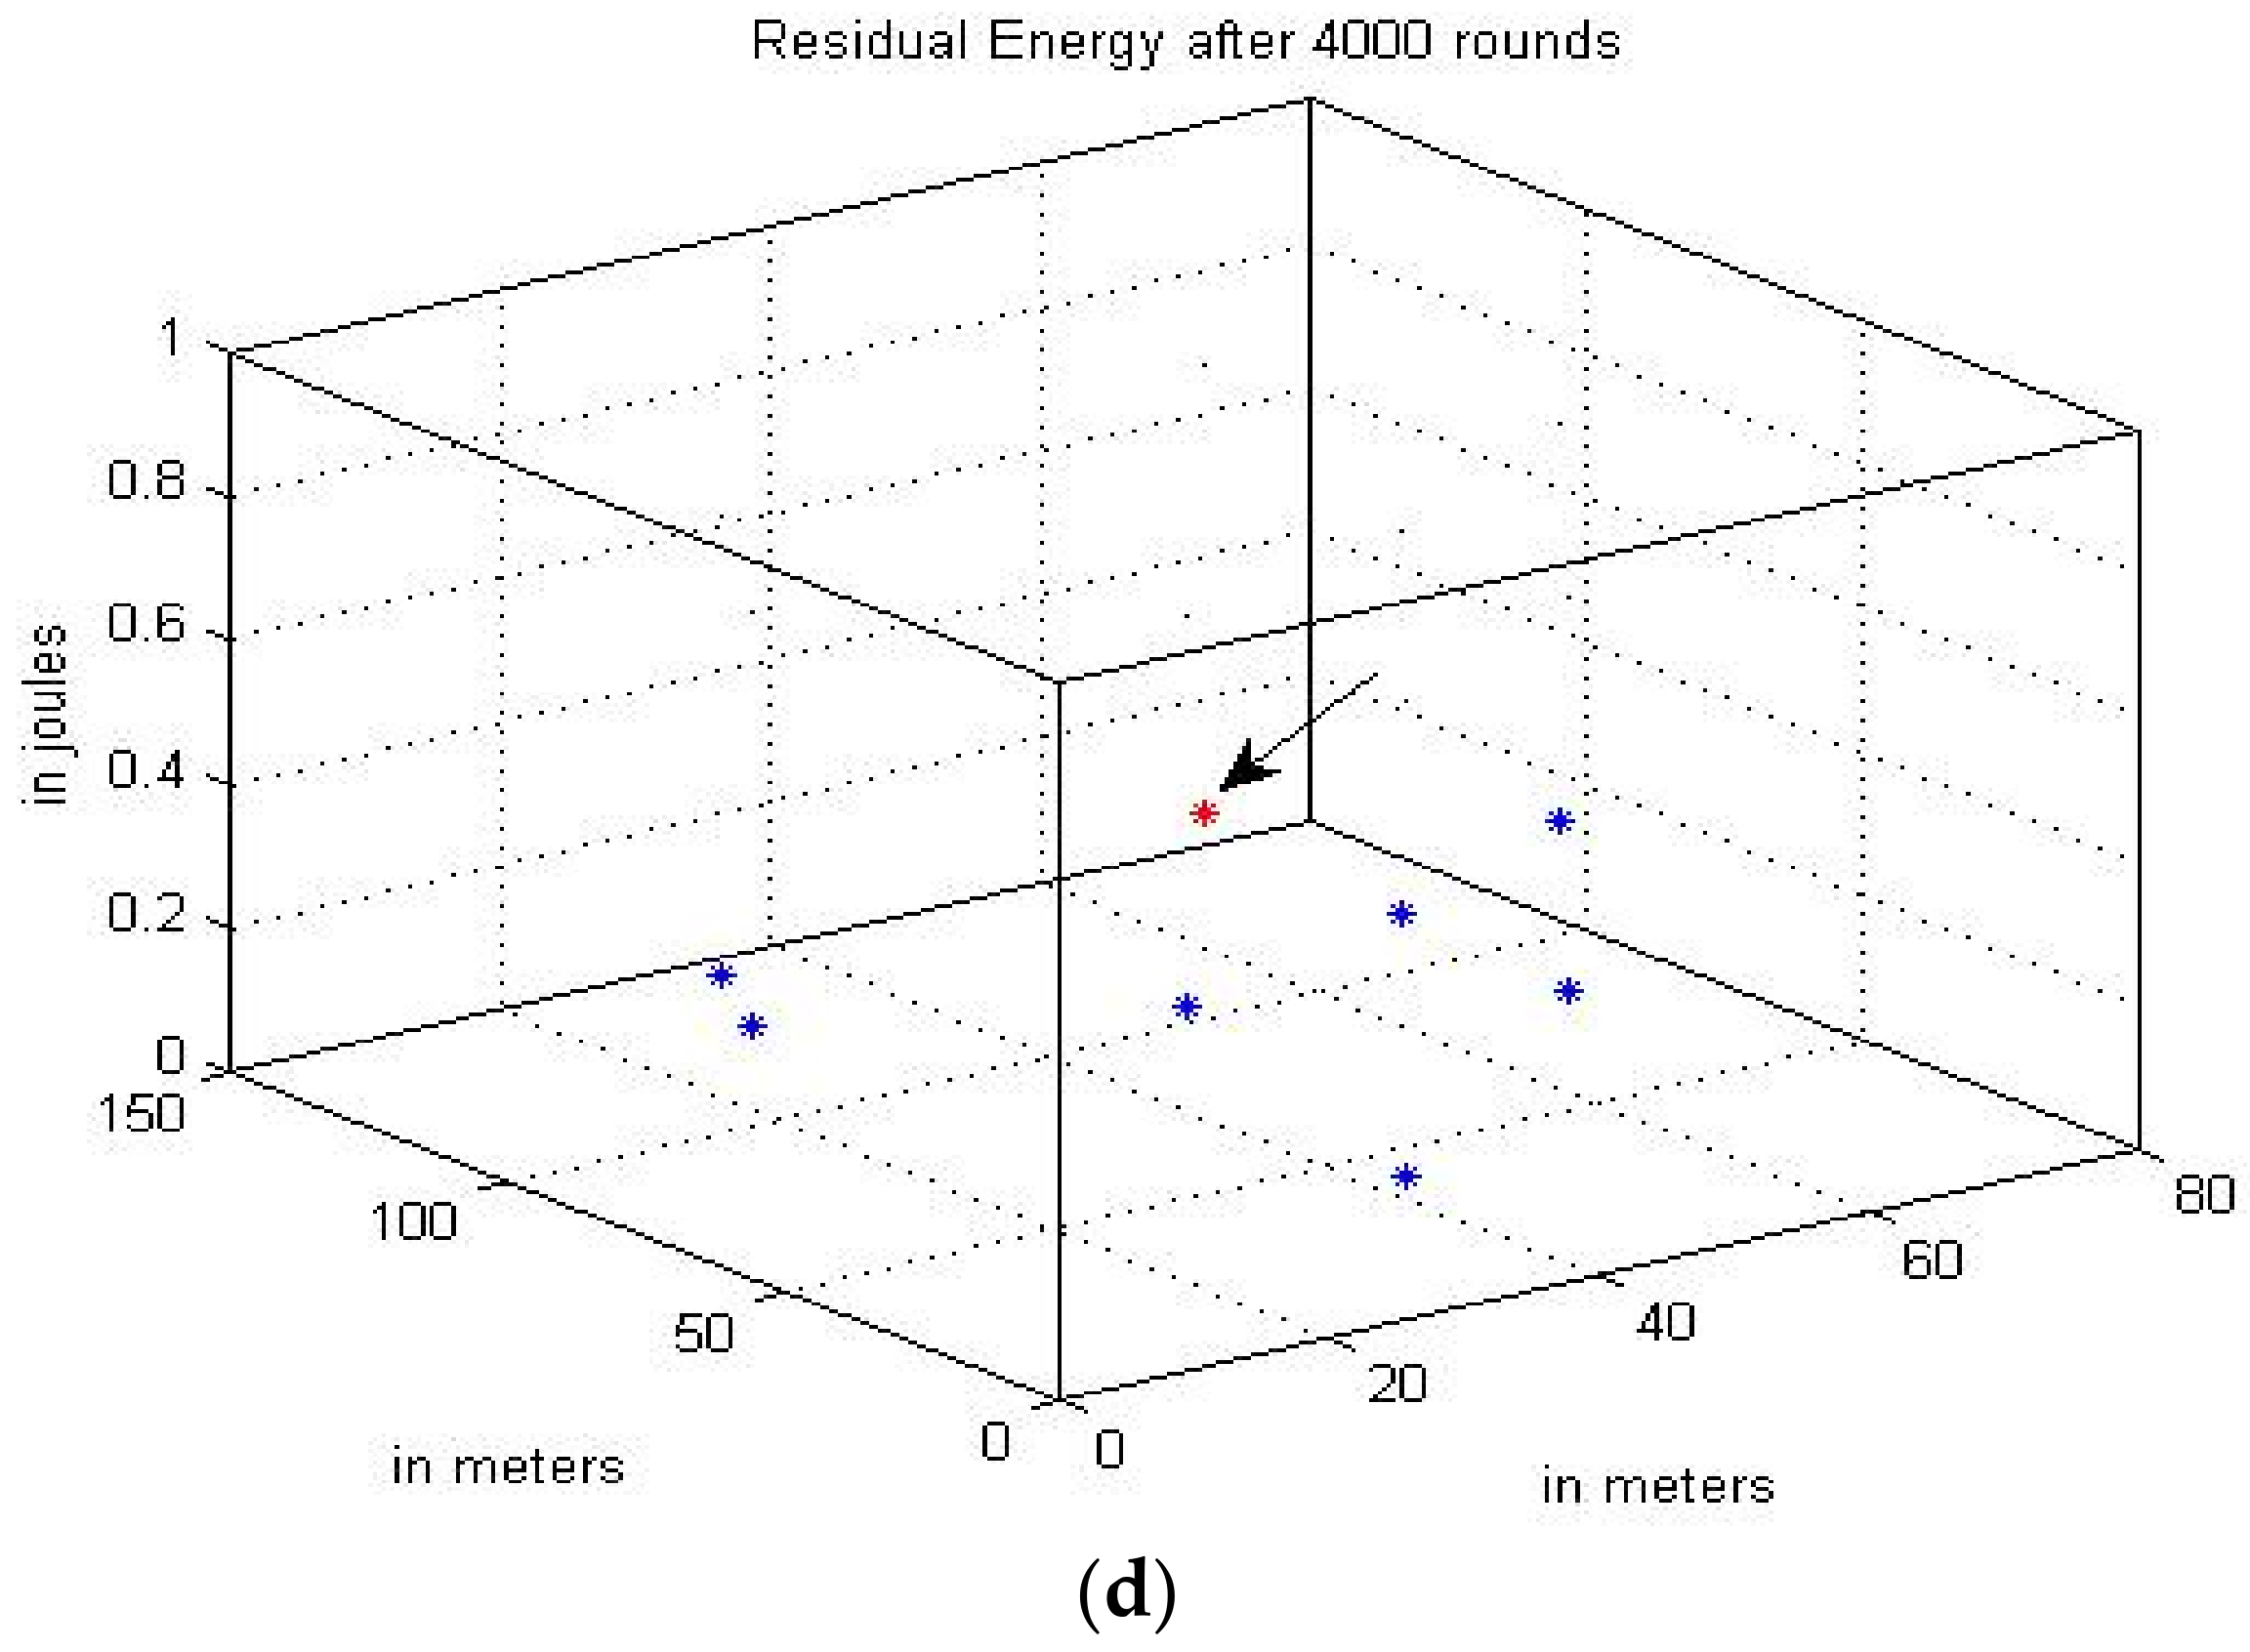
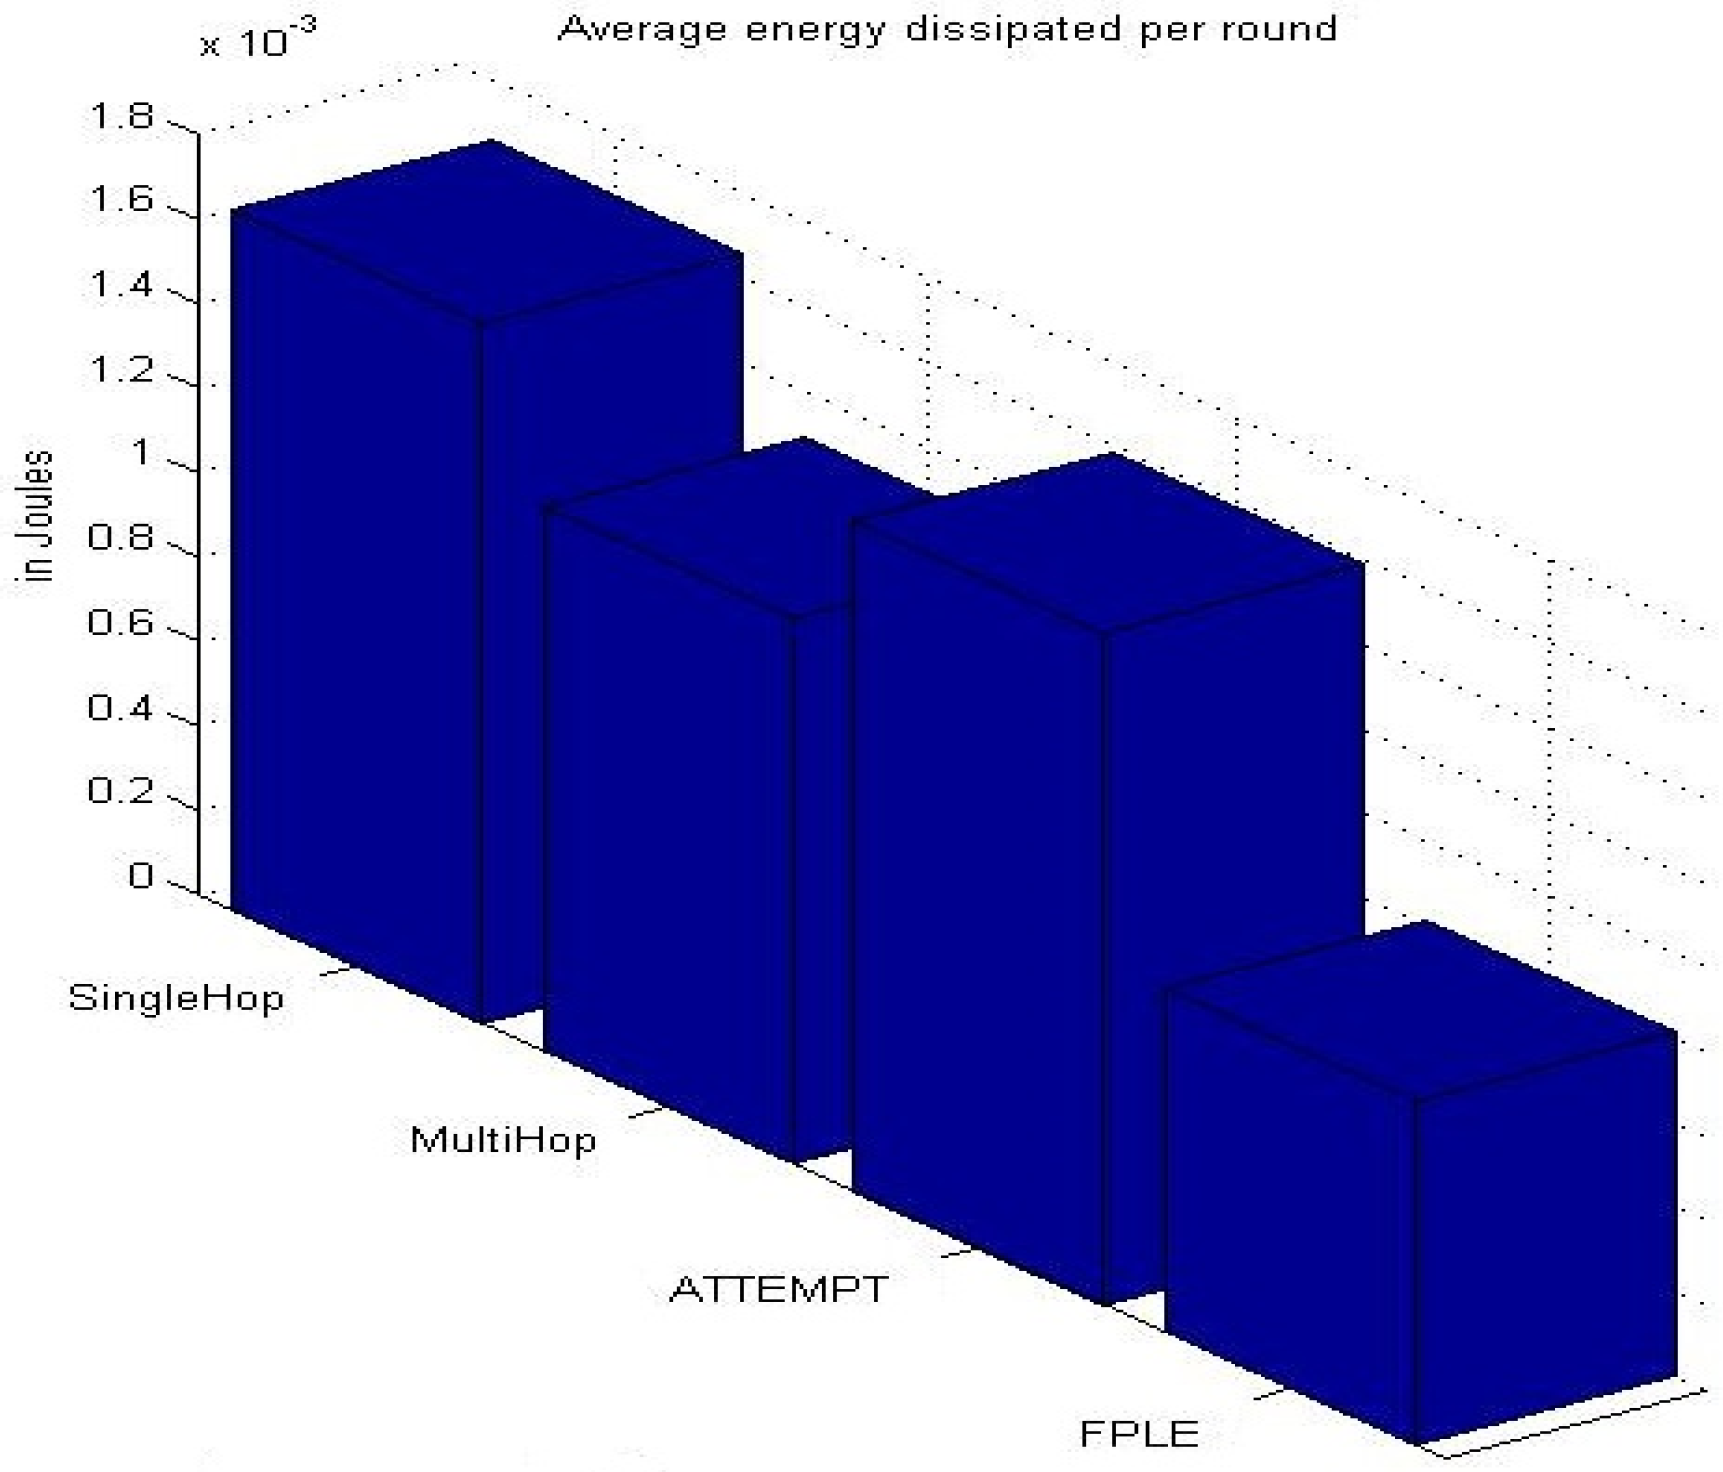
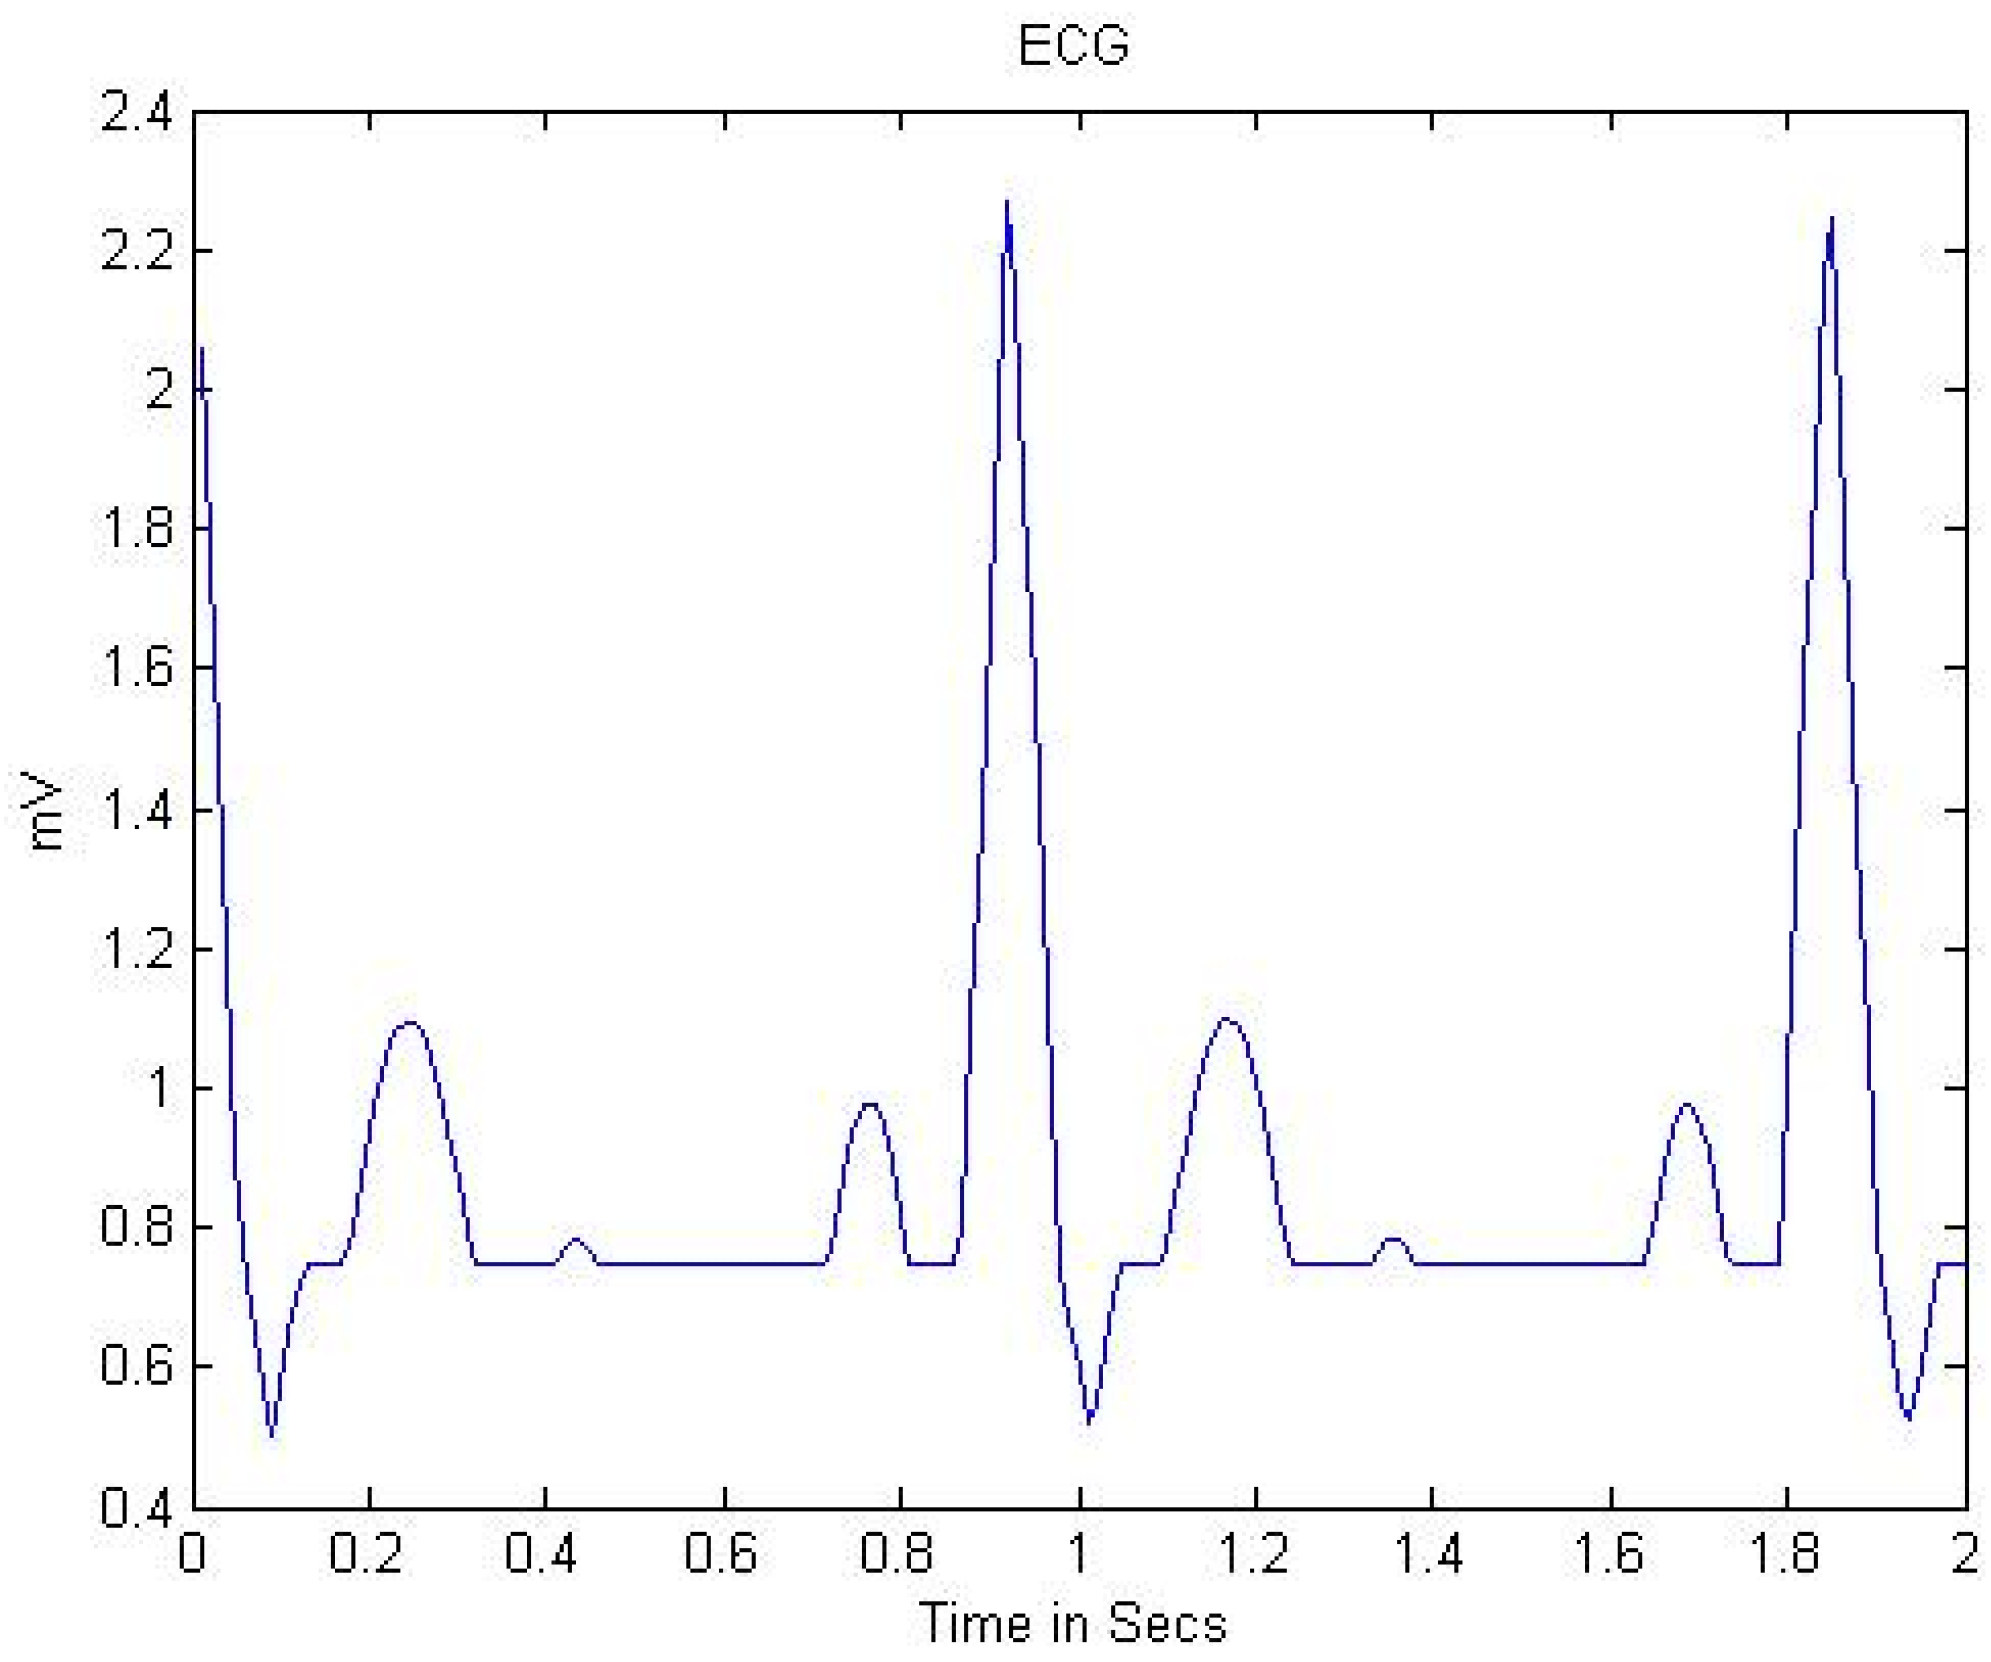
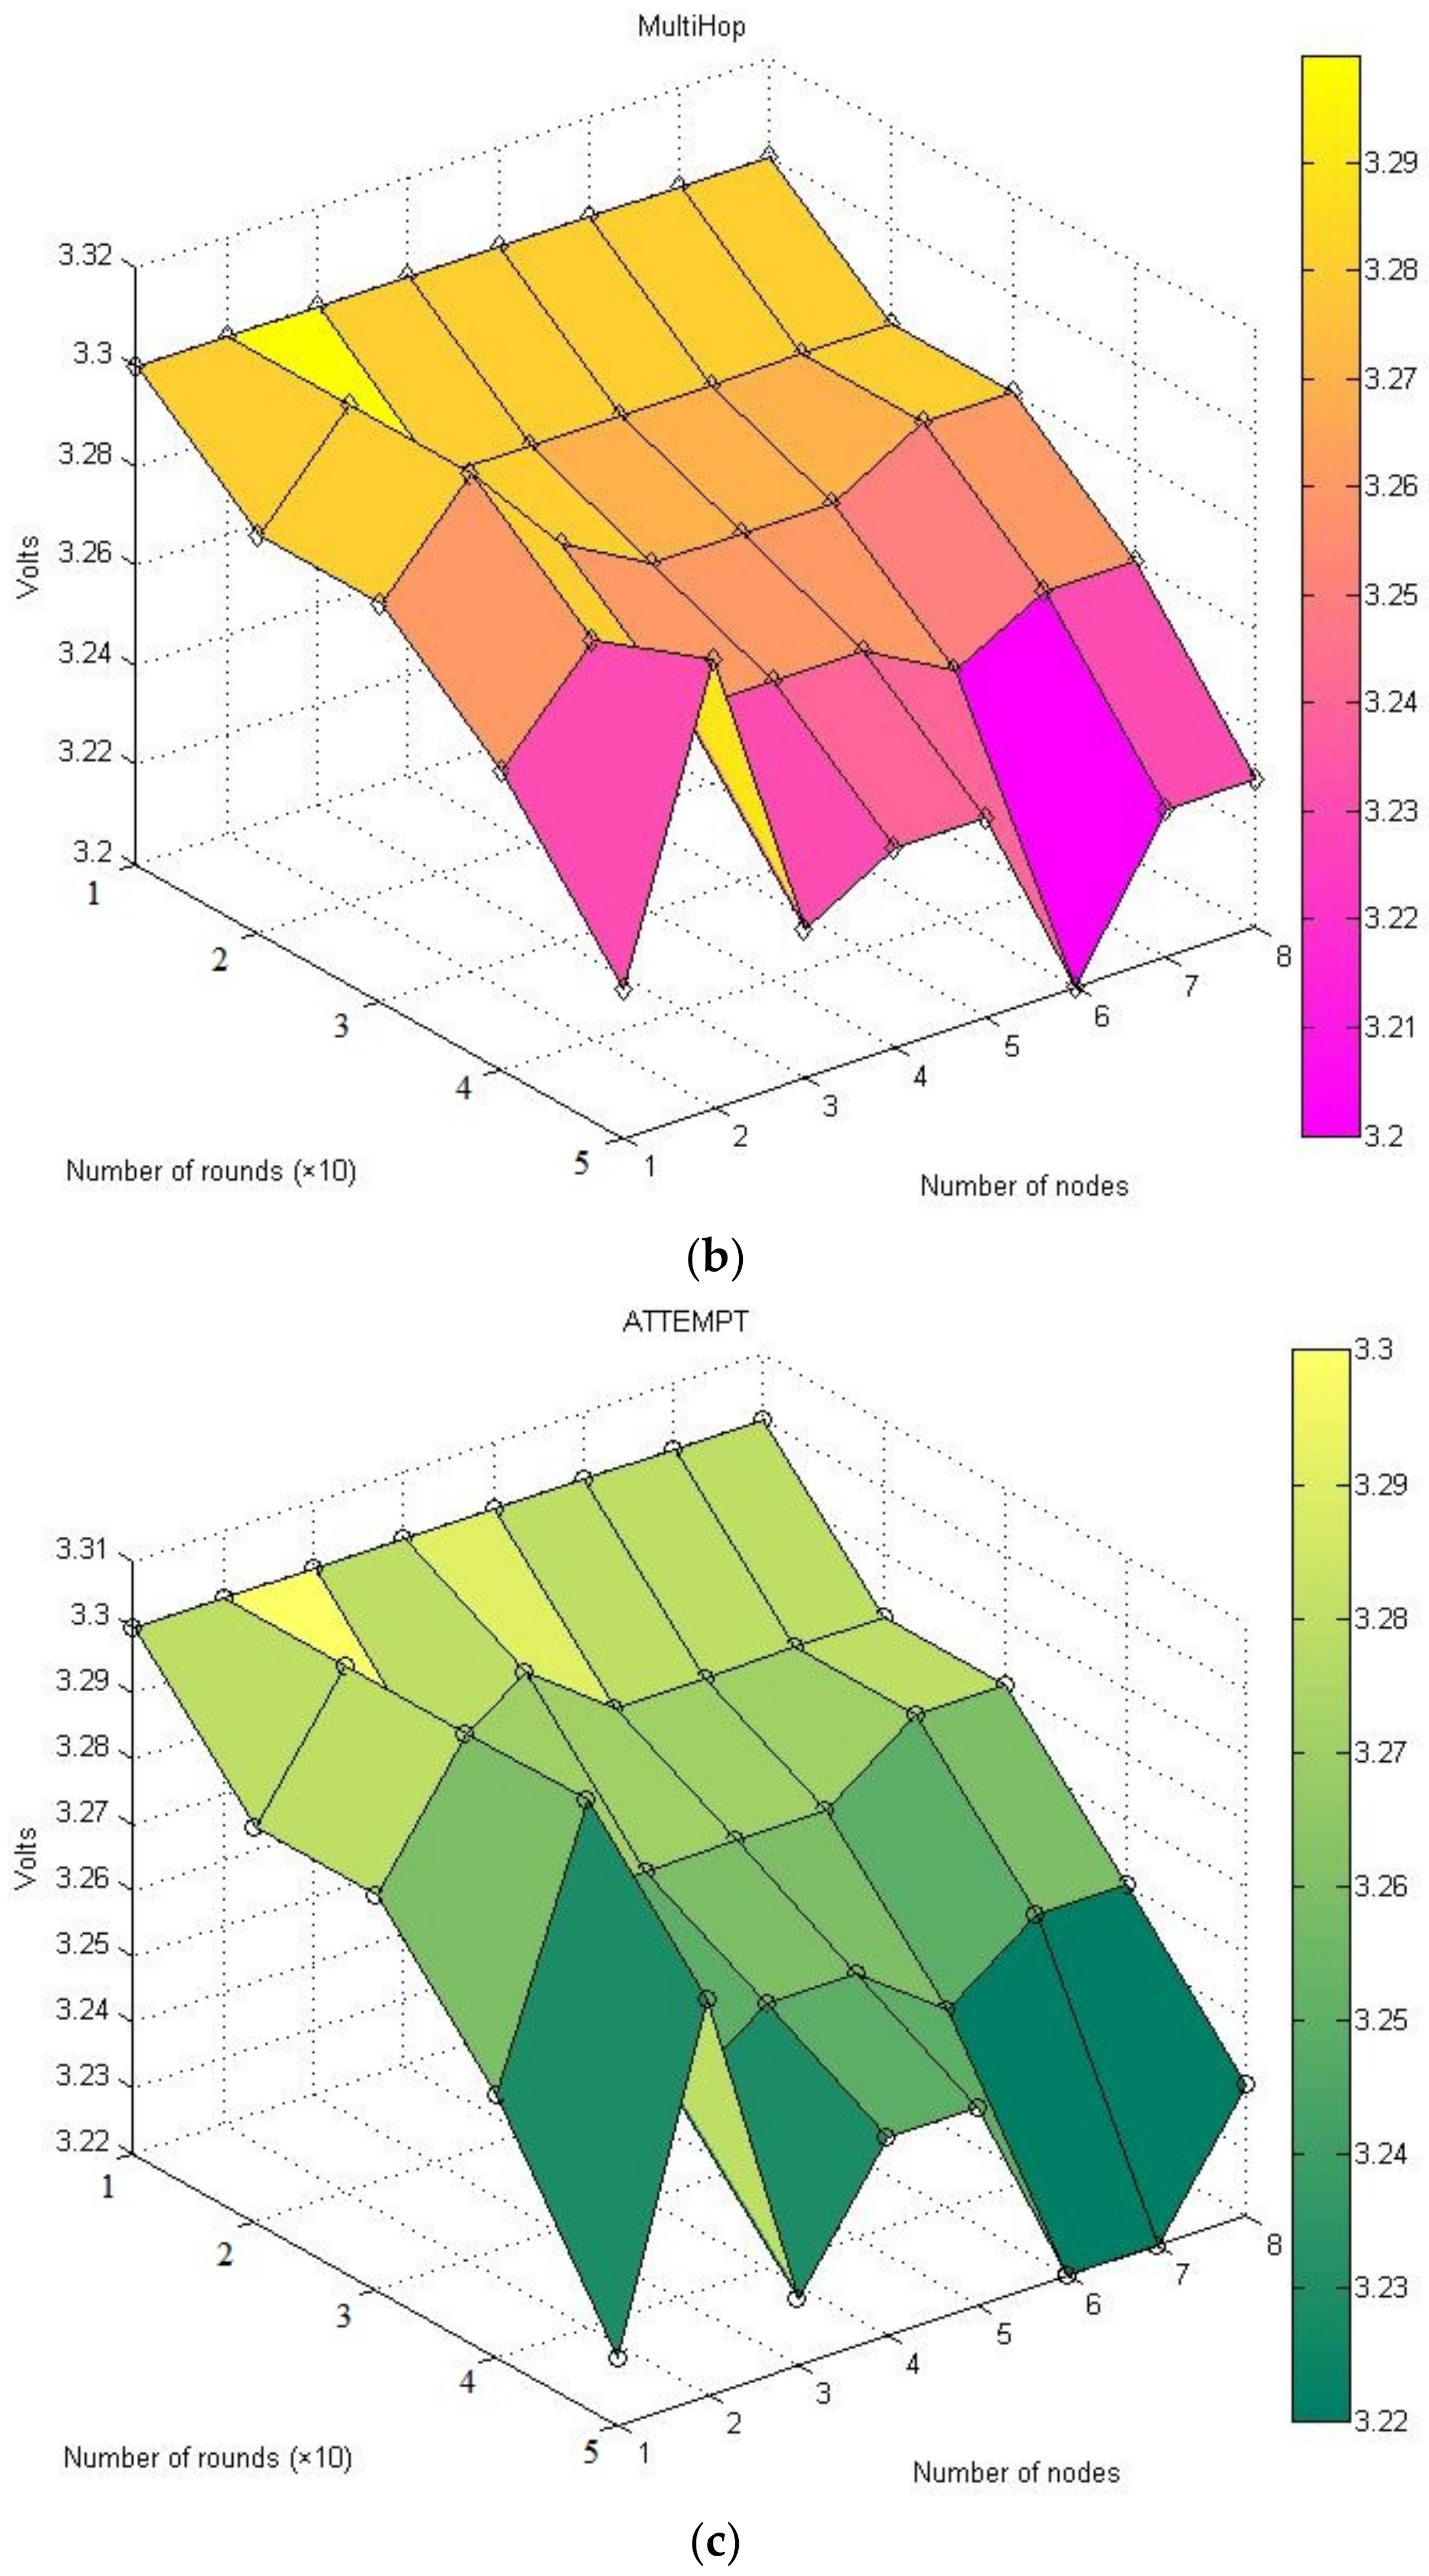
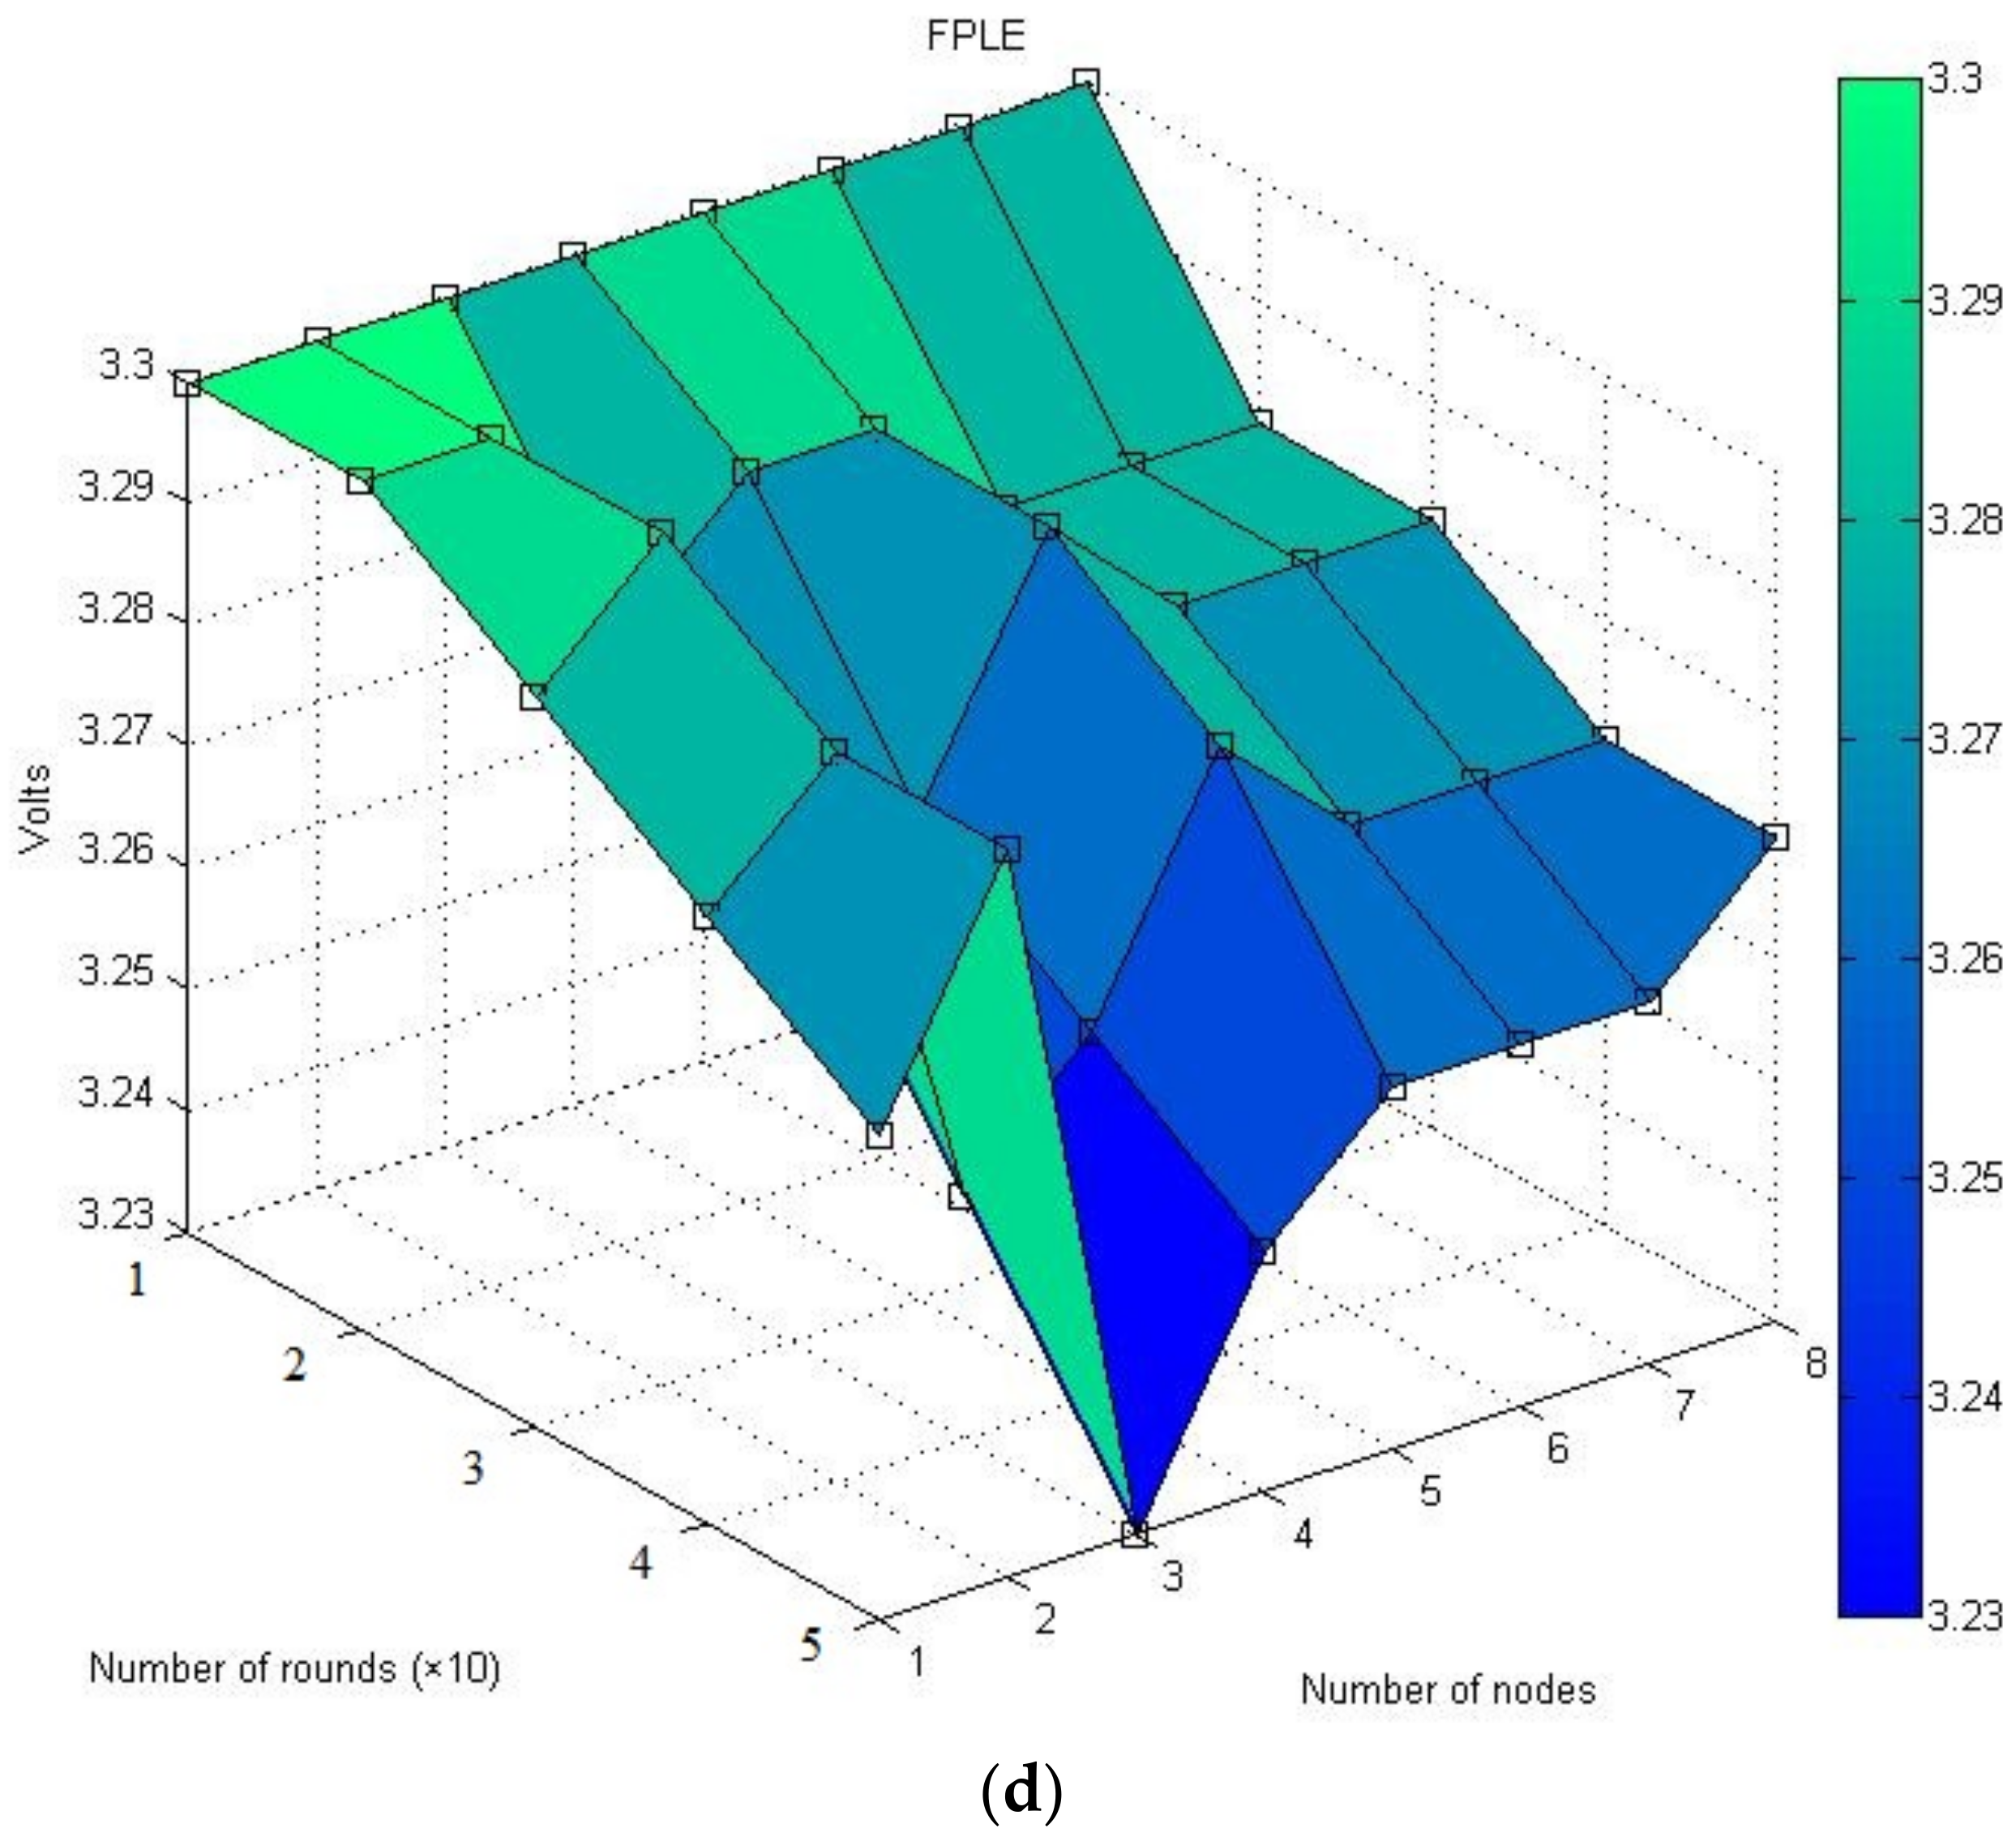
4. Results and Discussion

The proposed FPLE algorithm is simulated with Mat lab 2017 with 8 SNs. Table 2 and Table 3 illustrates the node placement in the region of Interest (ROI), in which node 2 is considered as the implanted node as well as the network parameters. The implanted node senses the subject internal temperature during critical conditions. The status of the subject is changed with respect to the FSM and Markov model proposed. Based on the rate of failure considered, the node packet size is varied. Hence, α = 0.001 and (1/β) = 1000 ms value for are considered, as provided by [17].
The list of prelims considered for simulation is mentioned below.
  • All SNs are deployed in the ROI.
  • The nodes are treated as energy starving.
  • The nodes are assumed to be either a Full Function or reduced function device.
  • All nodes in nature are static in their respective positions
Figure 5 illustrates the lifetime comparison of FPLE, ATTEMPT, Multihop, SingleHop algorithms. The FPLE outperforms ATTEMPT algorithm by 1.94 times extended lifetime. The proposed algorithm sustains for a longer duration, whereas the first node become inactive only after 3200 rounds approximately in FPLE approach.
The number of packets sent to the coordinator (sink) by SingleHop, MultiHop, ATTEMPT, and FPLE algorithms is given in Figure 6. The FPLE algorithm provides high throughput to the network 1.1 times when compared with ATTEMPT protocol.
Figure 7 elucidates the remaining energy of the SNs after 500, 1000, 3000, and 4000 rounds. The implanted node (red node marked with the arrow) in the simulation survives longer duration. The load to the implanted node is lowest (blue node) to avoid thermal dissipation. As proof of low burdening, the node dies last in the simulation. The FPLE algorithm supports thermal-aware and emergency response during critical conditions.
The left energy of the implanted node in Figure 7 supports low energy consumption and low thermal dissipation.Figure 8 elucidates the mean energy consumed in one round in case of Single Hop, MultiHop, ATTEMPT, and FPLE algorithms.
The proposed FPLE approach consumes less power when considered with ATTEMPT, MultiHop, and SingleHop protocol. The proposed FPLE algorithm is validated with 9 Waspmote in real-time in lab condition. The nodes send the sample HB data to the sink and the battery end terminal voltage is monitored after 25 rounds and 50 rounds. Figure 9 illustrates the sample HB signal transmitted by the node to the sink. Table 4 illustrates the node specification used for validating the work.
Table 4 shows the sensor mote details used to validate the algorithm. Figure 10 illustrates the experimental setup used to validate the proposed FPLE algorithm. The node marked with pink flag is considered to be the implanted temperature node. The node transmits a temperature value to sink during critical conditions. The remaining node transmits the sample ECG signal to sink. The primary sensor nodes [33,34,35,36,37] are programmed to send a high data rate exhibiting noise signal randomly during the simulation time based on α and β values considered. The experimental setup is tested to send 50 cycles of ECG data. The CMU marked with white flag activates the buzzer for fault data generation and low energy.
The residual energy present in the node is proportional to the end voltage of the battery, the battery terminal voltage after every ten rounds of ECG signal transmission is listed in Figure 11. Nodes 3 and 4 serve as the primary sensors in the experimental setup in case of FPLE evaluation. The FPLE algorithm shows high voltage across the battery with respect to SingleHop, MultiHop, and ATTEMPT algorithms, supporting the energy efficiency.
The implanted node terminal voltage after 50 rounds is high in the case of the FPLE algorithm. Table 5 illustrates the protocol comparison, that the FPLE algorithm supports lifetime enhancement, emergency situations, and exhibits thermal and fault awareness.

5. Conclusions

This paper presents a novel FPLE algorithm to addresses the optimal node scheduling based on the energy level and the threshold T* and achieve better network lifetime. The objective of monitoring persons in smart digital environment is achieved by classifying packets based on their status and packets are transmitted towards the sink upon meeting a threshold value T*. A part of the energy in the sensor node is utilized during emergencies to ensure the availability of monitoring the subject during critical conditions. The FPLE algorithm is compared with SingleHop, MultiHop, and ATTEMPT routing schemes and it is inferred that the FPLE algorithm outperforms the SingleHop, MultiHop, and ATTEMPT routing schemes in terms of lifetime and throughput. The FPLE algorithm provides 1.91 times lifetime and 1.1 times throughput when compared with the ATTEMPT communication protocol. The FPLE algorithm is also tested in real-time, also providing better results when compared to ATTEMPT, SingleHop, and MultiHop protocols.

Author Contributions

Conceptualization, writing—original draft, S.K.A.; supervision, A.S.M. and S.B.G.; writing—original draft and review and editing, K.R. and K.N.; validation, S.B.G.; methodology, K.N. and S.B.G.; formal analysis, investigation, C.O.S.; resources, S.B.G. and C.O.S.; Software, T.C.M.; writing—review and editing, T.C.M. and C.V.; project administration, T.C.M., C.O.S. and C.V.; funding acquisition, T.C.M., C.O.S. and C.V. All authors have read and agreed to the published version of the manuscript.

Funding

National Research Development Projects to finance excellence (PFE)-14/2022-2024 granted by the Romanian Ministry of Research and Innovation, this paper was partially supported through BEIA projects, AISTOR, FinSESco, CREATE, I-DELTA, DEFRAUDIFY, Hydro3D, FED4FIRE—SO-SHARED, AIPLAN—STORABLE, EREMI, NGI-UAV-AGRO and by European Union’s Horizon 2020 research and innovation program under grant agreements No. 872172 (TESTBED2) and No. 777996 (SealedGRID), SOLID-B5G.

Institutional Review Board Statement

Not applicable.

Informed Consent Statement

Not applicable.

Data Availability Statement

Data will be shared for review based on the editorial reviewer’s request.

Acknowledgments

The work of Chaman Verma was supported by the European Social Fund under the project “Talent Management in Autonomous Vehicle Control Technologies” (EFOP-3.6.3-VEKOP-16-2017-00001).

Conflicts of Interest

The authors declare no conflict of interest.

References

  1. Kanagachidambaresan, G.R.; SarmaDhulipala, V.R.; Vanusha, D.; Udhaya, M.S. Matlab based modelling of body sensor network using ZigBee protocol. In Proceedings of the International Conference on Computational Intelligence and Information Technology (CCIS 250), Pune, India, 7–8 November 2011; Springer: Berlin/Heidelberg, Germany, 2011; pp. 773–776. [Google Scholar]
  2. Akyildiz, I.F.; Su, W.; Sankarasubramaniam, Y.; Cayirci, E. Wireless sensor networks: A survey. Comput. Netw. 2002, 38, 393–422. [Google Scholar] [CrossRef] [Green Version]
  3. Kanagachidambaresan, G.R.; Chitra, A. Fail safe fault tolerant mechanism for wireless body sensor network (WBSN). Wirel. Pers. Commun. 2015, 80, 247–260. [Google Scholar] [CrossRef]
  4. Javaid, N.; Abbas, Z.; Farid, M.S.; Khan, Z.A.; Alrajeh, N. M-attempt a new energy-efficient routing protocol in wireless body area sensor networks. Procedia Comput. Sci. 2013, 19, 224–231. [Google Scholar] [CrossRef] [Green Version]
  5. Ahmad, A.; Javaid, N.; Qasim, U.; Ishfaq, M.; Khan, Z.A.; Alghamdi, T.A. RE-ATTEMPT: A new energy-efficient routing protocol for wireless body sensor networks. Int. J. Distrib. Sens. Netw. 2014, 10, 464010. [Google Scholar] [CrossRef]
  6. Abdur, M.R.; Hong, C.; Lee, S. Data-centric multi objective QoS-aware routing protocol for body sensor networks. Sensors 2011, 11, 917–937. [Google Scholar] [CrossRef]
  7. Kanagachidambaresan, G.R.; Chitra, A. TA-FSFT Thermal Aware Fail Safe Fault Tolerant algorithm for Wireless Body Sensor Network. Wirel. Pers. Commun. 2016, 90, 1935–1950. [Google Scholar] [CrossRef]
  8. Braem, B.; Latre, B.; Blondia, C.; Moerman, I.; Demeester, P. Analysing and improving reliability in multi-hop body sensor networks. Adv. Internet Technol. 2009, 2, 152–161. [Google Scholar]
  9. Fleischman, R.J.; Lundquist, M.; Jui, J.; Newgard, C.D.; Warden, C. Predicting Ambulance Time of Arrival to the Emergency Department Using Global Positioning System and Google Maps. Prehosp. Emerg. Care 2013, 17, 458–465. [Google Scholar] [CrossRef] [Green Version]
  10. Breen, N.; Woods, J.; Bury, G.; Murphy, A.W.; Brazier, H. A national census of ambulance response times to emergency calls in Ireland. Emerg. Med. J. 2000, 17, 392–395. [Google Scholar] [CrossRef] [Green Version]
  11. Kanagachidambaresan, G.R.; SarmaDhulipala, V.R.; Udhaya, M.S. Markovian model based trustworthy architecture. In Procedia Engineering; ICCTSD; Elsevier: Amsterdam, The Netherlands, 2011. [Google Scholar]
  12. SarmaDhulipala, V.R.; Kanagachidambaresan, G.R.; Chandrasekaran, R.M. Lack of power avoidance: A fault classification based fault tolerant framework solution for lifetime enhancement and reliable communication in wireless sensor network. Inf. Technol. J. 2012, 11, 719. [Google Scholar]
  13. Ababneh, N.; Timmons, N.; Morrison, J.; Tracey, D. Energy balanced rate assignment and routing protocol for body area networks. In Proceedings of the 26th International Conference on the Advanced Information Networking and Applications Workshops (WAINA’12), Fukuoka, Japan, 26–29 March 2012; pp. 466–471. [Google Scholar]
  14. Ben Elhadj, H.; Chaari, L.; Kamoun, L. A survey of routing protocols in wireless body area networks for healthcare applications. Int. J. E-Health Med. Commun. 2012, 3, 118. [Google Scholar] [CrossRef]
  15. Titouna, C.; Aliouat, M.; Gueroui, M. FDS: Fault Detection Scheme for Wireless Sensor Networks. Wirel. Pers. Commun. 2016, 86, 549–562. [Google Scholar] [CrossRef]
  16. Hanson, M.A.; Powell, H.C., Jr.; Barth, A.T.; Ringgenberg, K.; Calhoun, B.H.; Aylor, J.H.; Lach, J. Body area sensor networks: Challenges and opportunities. Computer 2009, 42, 58–65. [Google Scholar] [CrossRef]
  17. Liu, H.; Nayak, A.; Stojmenović, I. Fault-Tolerant Algorithms/Protocols in Wireless Sensor Networks. In Guide to Wireless Sensor Networks; Springer: London, UK, 2009; pp. 261–291. [Google Scholar]
  18. Mhatre, V.; Rosenberg, C.P.; Kofman, D.; Mazumdar, R.; Shroff, N. A minimum cost heterogeneous sensor network with a lifetime constraint. IEEE Trans. Mob. Comput. 2005, 1, 4–15. [Google Scholar]
  19. Du, X.; Guizani, M.; Xiao, Y.; Chen, H.-H. Two tier secure routing protocol for heterogeneous sensor networks. IEEE Trans. Wirel. Commun. 2007, 6, 3395–3401. [Google Scholar] [CrossRef]
  20. Polastre, J.; Hill, J.; Culler, D. Versatile low energy media access for wireless sensor networks. In Proceedings of the 2nd International Conference on Embedded Networked Sensor Systems, Baltimore, MD, USA, 3–5 November 2004; pp. 95–107. [Google Scholar]
  21. Maheswar, R.; Jayaparvathy, R. Performance Analysis of Cluster based Sensor Networks Using N-Policy M/G/1 Queueing Model. Eur. J. Sci. Res. 2011, 58, 177–188. [Google Scholar]
  22. Maheswar, R.; Jayaparvathy, R. Performance Analysis of Fault Tolerant Node in Wireless Sensor Network. In Proceedings of the Third International Conference on Advances in Communication, Network, and Computing—CNC 2012, Chennai, India, 24 February 2012; Springer: Berlin/Heidelberg, Germany, 2012. [Google Scholar]
  23. Darwish, A.; Kanagachidambaresan, G.R.; Maheswar, R.; Laktharia, K.I.; Mahima, V. Buffer Capacity Based Node Life Time Estimation in Wireless Sensor Network. In Proceedings of the 8th IEEE International Conference on Computing, Communication and Networking Technologies (ICCCNT), Delhi, India, 3–5 July 2017. [Google Scholar]
  24. Jayarajan, P.; Maheswar, R.; Kanagachidambaresan, G.R. Modified Energy Minimization Scheme Using Queue Threshold Based on Priority Queueing Model. Clust. Comput. 2017, 22, 12111–12118. [Google Scholar] [CrossRef]
  25. Nageswari, D.; Maheswar, R.; Kanagachidambaresan, G.R. Performance analysis of cluster based homogeneous sensor network using energy efficient N-policy (EENP) model. Clust. Comput. 2018, 22, 12243–12250. [Google Scholar] [CrossRef]
  26. Jayarajan, P.; Maheswar, R.; Sivasankaran, V.; Vigneswaran, D.; Udaiyakumar, R. Performance Analysis of Contention Based Priority Queuing Model Using N-Policy Model for Cluster Based Sensor Networks. In Proceedings of the Seventh IEEE International Conference on Communication and Signal Processing (ICCSP), Chennai, India, 3 April 2018. [Google Scholar]
  27. Maheswar, R.; Jayarajan, P.; Vimalraj, S.; Sivagnanam, G.; Sivasankaran, V.; Amiri, I.S. Energy Efficient Real Time Environmental Monitoring System Using Buffer Management Protocol. In Proceedings of the Ninth IEEE International Conference on Computing, Communication and Networking Technologies (ICCCNT), Bengaluru, India, 10–12 July 2018. [Google Scholar]
  28. Jayarajan, P.; Maheswar, R.; Kanagachidambaresan, G.R.; Sivasankaran, V.; Balaji, M.; Das, J. Performance Evaluation of Fault Nodes Using Queue Threshold Based on N-Policy Priority Queueing Model. In Proceedings of the Ninth IEEE International Conference on Computing, Communication and Networking Technologies (ICCCNT), Bengaluru, India, 10–12 July 2018. [Google Scholar]
  29. Sampathkumar, A.; Mulerikkal, J.; Sivaram, M. Glowworm swarm optimization for effectual load balancing and routing strategies in wireless sensor networks. Wirel. Netw. 2020, 26, 4227–4238. [Google Scholar] [CrossRef]
  30. Sampathkumar, A.; Murugan, S.; Rastogi, R.; Mishra, M.K.; Malathy, S.; Manikandan, R. Energy Efficient ACPI and JEHDO Mechanism for IoT Device Energy Management in Healthcare. In Internet of Things in Smart Technologies for Sustainable Urban Development; Kanagachidambaresan, G.R., Maheswar, R., Manikandan, V., Ramakrishnan, K., Eds.; EAI/Springer Innovations in Communication and Computing; Springer: Cham, Switzerland, 2020. [Google Scholar] [CrossRef]
  31. Murugan, S.; Sampathkumar, A.; Kanaga Suba Raja, S.; Ramesh, S.; Manikandan, R.; Gupta, D. Autonomous Vehicle Assisted by Heads up Display (HUD) with Augmented Reality Based on Machine Learning Techniques. In Virtual and Augmented Reality for Automobile Industry: Innovation Vision and Applications. Studies in Systems, Decision and Control; Hassanien, A.E., Gupta, D., Khanna, A., Slowik, A., Eds.; Springer: Cham, Switzerland, 2022; Volume 412. [Google Scholar] [CrossRef]
  32. Banuselvasaraswathy, B.; Sampathkumar, A.; Jayarajan, P.; Sheriff, N.; Ashwin, M.; Sivasankaran, V. A Review on Thermal and QoS Aware Routing Protocols for Health Care Applications in WBASN. In Proceedings of the 2020 International Conference on Communication and Signal Processing (ICCSP), Chennai, India, 28–30 July 2020; pp. 1472–1477. [Google Scholar] [CrossRef]
  33. Jayarajan, P.; Kanagachidambaresan, G.R.; Sundararajan, T.V.P.; Sakthipandi, K.; Maheswar, R.; Karthikeyan, A. An Energy Aware Buffer Management (EABM) Routing Protocol for WSN. J. Supercomput. 2018, 76, 4543–4555. [Google Scholar] [CrossRef]
  34. Ugochukwu, N.S.; Goyal, S.B.; Arumugam, S. Blockchain-Based IoT-Enabled System for Secure and Efficient Logistics Management in the Era of IR 4.0. J. Nanomater. 2022, 2022, 7295395. [Google Scholar] [CrossRef]
  35. Bedi, P.; Goyal, S.B.; Rajawat, A.S.; Shaw, R.N.; Ghosh, A. Application of AI/IoT for Smart Renewable Energy Management in Smart Cities. In AI and IoT for Smart City Applications. Studies in Computational Intelligence; Piuri, V., Shaw, R.N., Ghosh, A., Islam, R., Eds.; Springer: Singapore, 2022; Volume 1002. [Google Scholar] [CrossRef]
  36. Sharma, S.; Rani, M.; Goyal, S.B. Energy Efficient Data Dissemination with ATIM Window and Dynamic Sink in Wireless Sensor Networks. In Proceedings of the 2009 International Conference on Advances in Recent Technologies in Communication and Computing, Kottayam, India, 27–28 October 2009; pp. 559–564. [Google Scholar] [CrossRef]
  37. Sharma, S.; Goyal, S.B.; Qamar, S. Four-Layer Architecture Model for Energy Conservation in Wireless Sensor Networks. In Proceedings of the 2009 Fourth International Conference on Embedded and Multimedia Computing, Jeju, Korea, 10–12 December 2009; pp. 1–3. [Google Scholar] [CrossRef]
Figure 1. Wireless Body Sensor Network topology.
Energies 15 06095 g001
Figure 2. Finite-SM realization of subject.
Energies 15 06095 g002
Figure 3. Voltage curve of the battery.
Energies 15 06095 g003
Figure 4. Architecture of the proposed FPLE algorithm.
Energies 15 06095 g004
Figure 5. Network lifetime.
Energies 15 06095 g005
Figure 6. Network Throughput.
Energies 15 06095 g006
Figure 7. Residual Energy of nodes after 500, 1000, 3000 and 4000 rounds (FPLE). (a) Remaining Energy after 500 rounds. (b) Remaining Energy after 1000 rounds. (c) Remaining Energy after 3000 rounds. (d) Remaining Energy after 4000 rounds.
Energies 15 06095 g007aEnergies 15 06095 g007b
Figure 8. Average energy consumed per round.
Energies 15 06095 g008
Figure 9. Sample ECG signal.
Energies 15 06095 g009
Figure 10. Experimental Setup for validation of the algorithm.
Energies 15 06095 g010
Figure 11. Battery Terminal voltage for every ten rounds of ECG signal by SingleHop, MultiHop, ATTEMPT and FPLE algorithms. (a) SingleHop; (b) MultiHop; (c) ATTEMPT; (d) FPLE.
Energies 15 06095 g011aEnergies 15 06095 g011bEnergies 15 06095 g011c
Table 1. Comparison of various sensors.
Sensor TypeData Rate in bpsPower Consumption
(H-High/L-Low)
Privacy
(H-High/L-Low)
Bandwidth in Hz
Blood pressure16HH0–150
Temperature120LL0–1
EMG300 kLH0–10,000
ECG288 kLH100–1000
EEG43.2 kLH0–1
Table 2. Sensor node deployment in the region of interest.
Node-IDx Locationy Location
120.00110.00
260.00120.00
310.0080.00
470.0080.00
530.0050.00
650.0060.00
730.0010.00
850.0030.00
9 (CMU)40.0080.00
Table 3. Demonstrates the network parameters.
Network ParametersValue
Network Area160 × 80 cm2
Number of SNs8 + 1 (CMU)
Eelec50 nJ/bit
Efs10 pJ/bit-m2
Energy at time 0 0.5 Joule
Probability of being a CH0.1
Size of normal data2000 bytes
Size of critical data4000 bytes
Size of header field50 bytes
Table 4. Real-time node deployment metrics.
ParameterValue
Network area80 cm × 160 cm
Number of SNs8 + 1 (CMU)
Base station place40, 210
Battery capacity 2300 mAh, 3.3 terminal voltage
Probability to be opted as a CH0.1
Transceiver protocolZigbee protocol (XBee) transceivers)
Body sensor data ECG, Temperature (data from an implanted node)
Processing moduleArduino Uno
Table 5. Protocol Comparison.
ProtocolEnergy SavingEmergency Situation HandlingThermal-AwareFault Awareness
SingleHop×××
MultiHop××
ATTEMPT×
FPLE
Publisher’s Note: MDPI stays neutral with regard to jurisdictional claims in published maps and institutional affiliations.

