Abstract
Compared with oil, natural gas has been the focus of the energy industry in recent years. Renewable energy is the goal and trend of future developments, and it has made considerable progress; however, it has not reached the ideal popularization rate. Therefore, natural gas is still very important so far. In this paper, the influence of thermal gas injection and room temperature gas injection on gas reservoir recovery is analyzed, and the method of water plugging by hot gas injection in tight gas reservoir is put forward. Indoor simulation experiments were carried out to evaluate the effect of hot-gas injection in cut pore water and the degree of water blockage. On this basis, the numerical simulation of removing water blockage by hot-gas injection was carried out. The changes in core temperature and remaining water saturation were discussed by using simulation models. Results of this study can provide a theoretical basis for removing water blockage in actual oil and gas reservoirs.
1. Introduction
Tight sandstone gas refers to natural gas distributed in tight gas sandstones [1,2,3]. The porosity range of tight sandstones is generally from 0 to 10%. Permeability is measured to be less than 0.1 mD, and gas saturation is less than 60%. Therefore, it is classified as unconventional natural gas [4,5,6]. In the process of drilling with respect to the completion and reservoir reconstruction of tight sandstone gas reservoirs, due to the invasion of water-based working fluid in the formation, water saturation in the reservoir increases. The gas’ percolation capacity is weakened, and the gas well’s productivity is affected. This phenomenon is called water block damage [7,8,9,10]. In 1979, Hoditch et al. proposed the concept of “water block” [11]. They found that high water saturation and insufficient formation pressure are important factors affecting the “water block” effect. In 2000, in the process of studying the mechanism of water block effects, Bennion proposed three states of water block damage [12]. Cimolar et al. believed that the cause of water block damage is that the original water saturation of tight sandstone reservoirs is much lower than that of irreducible water saturation [13], which cannot be discharged completely after liquid-phase invasions. By conducting single-factor experiments, Kewen et al. found that sandstone imbibition is inversely proportional to water saturation [14]. The higher the initial imbibition rate of the gas reservoir, the more serious the water lock. Mahadevan believe that the reservoir’s permeability is positively correlated with the imbibition rate and negatively correlated with the degree of water block damage [15]. Abass believes that the existence of cracks can aggravate the water block’s damage [16]. Le proposed the influence of gas reservoir pressure and capillary force on water block damage [17] and explained that the water block damage potential of low-pressure tight sandstone gas reservoirs is usually stronger than that of normal-pressure or high-pressure tight sandstone gas reservoirs.
Many methods have been proposed to evaluate water block damage [18,19,20]. Davis et al. proposed a method for predicting the damage by using the percentage of water in reservoir rocks relative to the total volume of rocks [21]. Golman et al. used some indexes to evaluate the damage of water block effects [22] and proposed data processing methods, such as self-priming amounts and self-priming rates, in detail. Mirzaei et al. used the capillary self-priming method to calculate the permeability damage rate and evaluated the degree of water block damage [23]; they then simulated the two damage processes: capillary self-priming and liquid-phase retention. Akin et al. introduced the concepts of self-suction potential and retention potential [24] and proved that proved that the mathematical relationship between the amount of self-absorption, the amount of return and the square root of time at the initial stage of capillary self-priming and liquid reflux is obviously linear.
For problems existing in the current water block release methods, the idea of “reservoir desiccation” is proposed. That is, the formation water is consumed, and the reservoir’s water saturation is reduced based on chemical reactions and thermal evaporation. On this basis, the related studies on drying mechanism and drying agent were carried out. Somerton et al. found that the core’s permeability increased by more than 50% and mechanical strength decreased by about 50% after heating at 400–800 °C [25]. Murphy et al. pointed out that microfractures caused by high temperature can improve the transport properties of the reservoir and reduce flow impedances [26]. Etienne et al. studied the cracks in granite at high temperature and thought that heating can enhance the connectivity of the rock and initiate new cracks [27]. Noh et al. screened organic alcohol surfactants, which are more effective in reducing water block damage, by conducting laboratory experiments [28], among which methanol solution is the best, followed by anhydrous ethylene glycol. By performing laboratory experiments, Xiong et al. found that supercritical carbon dioxide instead of alcohol solutions can better transport the main drying agent to the pores of a tight reservoir [29]. Based on lattice Boltzmann method, under the condition of high pressure and high temperature, Zhao et al. simulated the flow process of tight gas displacement formation water [30].They combined the experimental results of laser etching model reservoir drying and used numerical simulation method to study the effect of reservoir drying on the percolation capacity of tight gas reservoir.
Based on previous studies, in this paper, the influence of gas at different temperature on permeability and the change of water lock are studied through experimental study. It also demonstrates the feasibility of hot gas injection to improve oil recovery. Then the numerical simulation of water plugging by thermal gas injection in tight cores is carried out. The feasible method of water plugging by hot gas injection is given.
2. Experimental Study on Influencing Factors of Removing Water Block Effects by Hot-Gas Injection in Tight Cores
2.1. Experimental Steps and Methods
a. Wash the core oil and salt and then dry it to measure the core diameter (d) and length (L), dry weight (G1), and permeability (K1). After measurements, the dry weight is 93 g; gas permeability is 0.253 × 10⁻³ μm2; porosity is 10.33%; the core’s size is 2.51 cm in diameter and 9.02 cm in length.
b. Prepare the simulated formation water. The water composition is shown in Table 1.

Table 1.
Simulated formation water component analysis.
c. Place the dry rock sample into the vacuum saturation device to pressurize and saturate it with the simulated formation water. After the core is completely saturated, weigh the core mass G2, calculate the core porosity (Sw1 is calculated as 100%), and use the nuclear magnetic resonance imaging system to measure the T2 spectrum curve of the core’s saturated water.
d. Use CH4 to drive saturated rock samples by unsteady gas flooding. After driving to an irreducible water state, measure the core’s weight, G3, in the irreducible water state; measure the injection pressure, water output, and gas output; calculate irreducible water saturation Sw2 and gas phase permeability K2; use nuclear magnetic resonance imaging system to measure the T2 spectrum curve of the core in several water states.
e. Place the core in the core holder, surround the 22 MPa, heat the drying gas to the set temperature, set the back pressure at 20 MPa, and inject the hot CO2 gas 4 PV (pore volume).
f. Use a nuclear magnetic-resonance imaging system to measure the T2 spectrum curve in the dried state.
g. Measure the core’s gas phase permeability, K3, again.
h. Repeatedly saturate the rock samples, change the gas-injection temperature and gas type, and carry out comparative experiments.
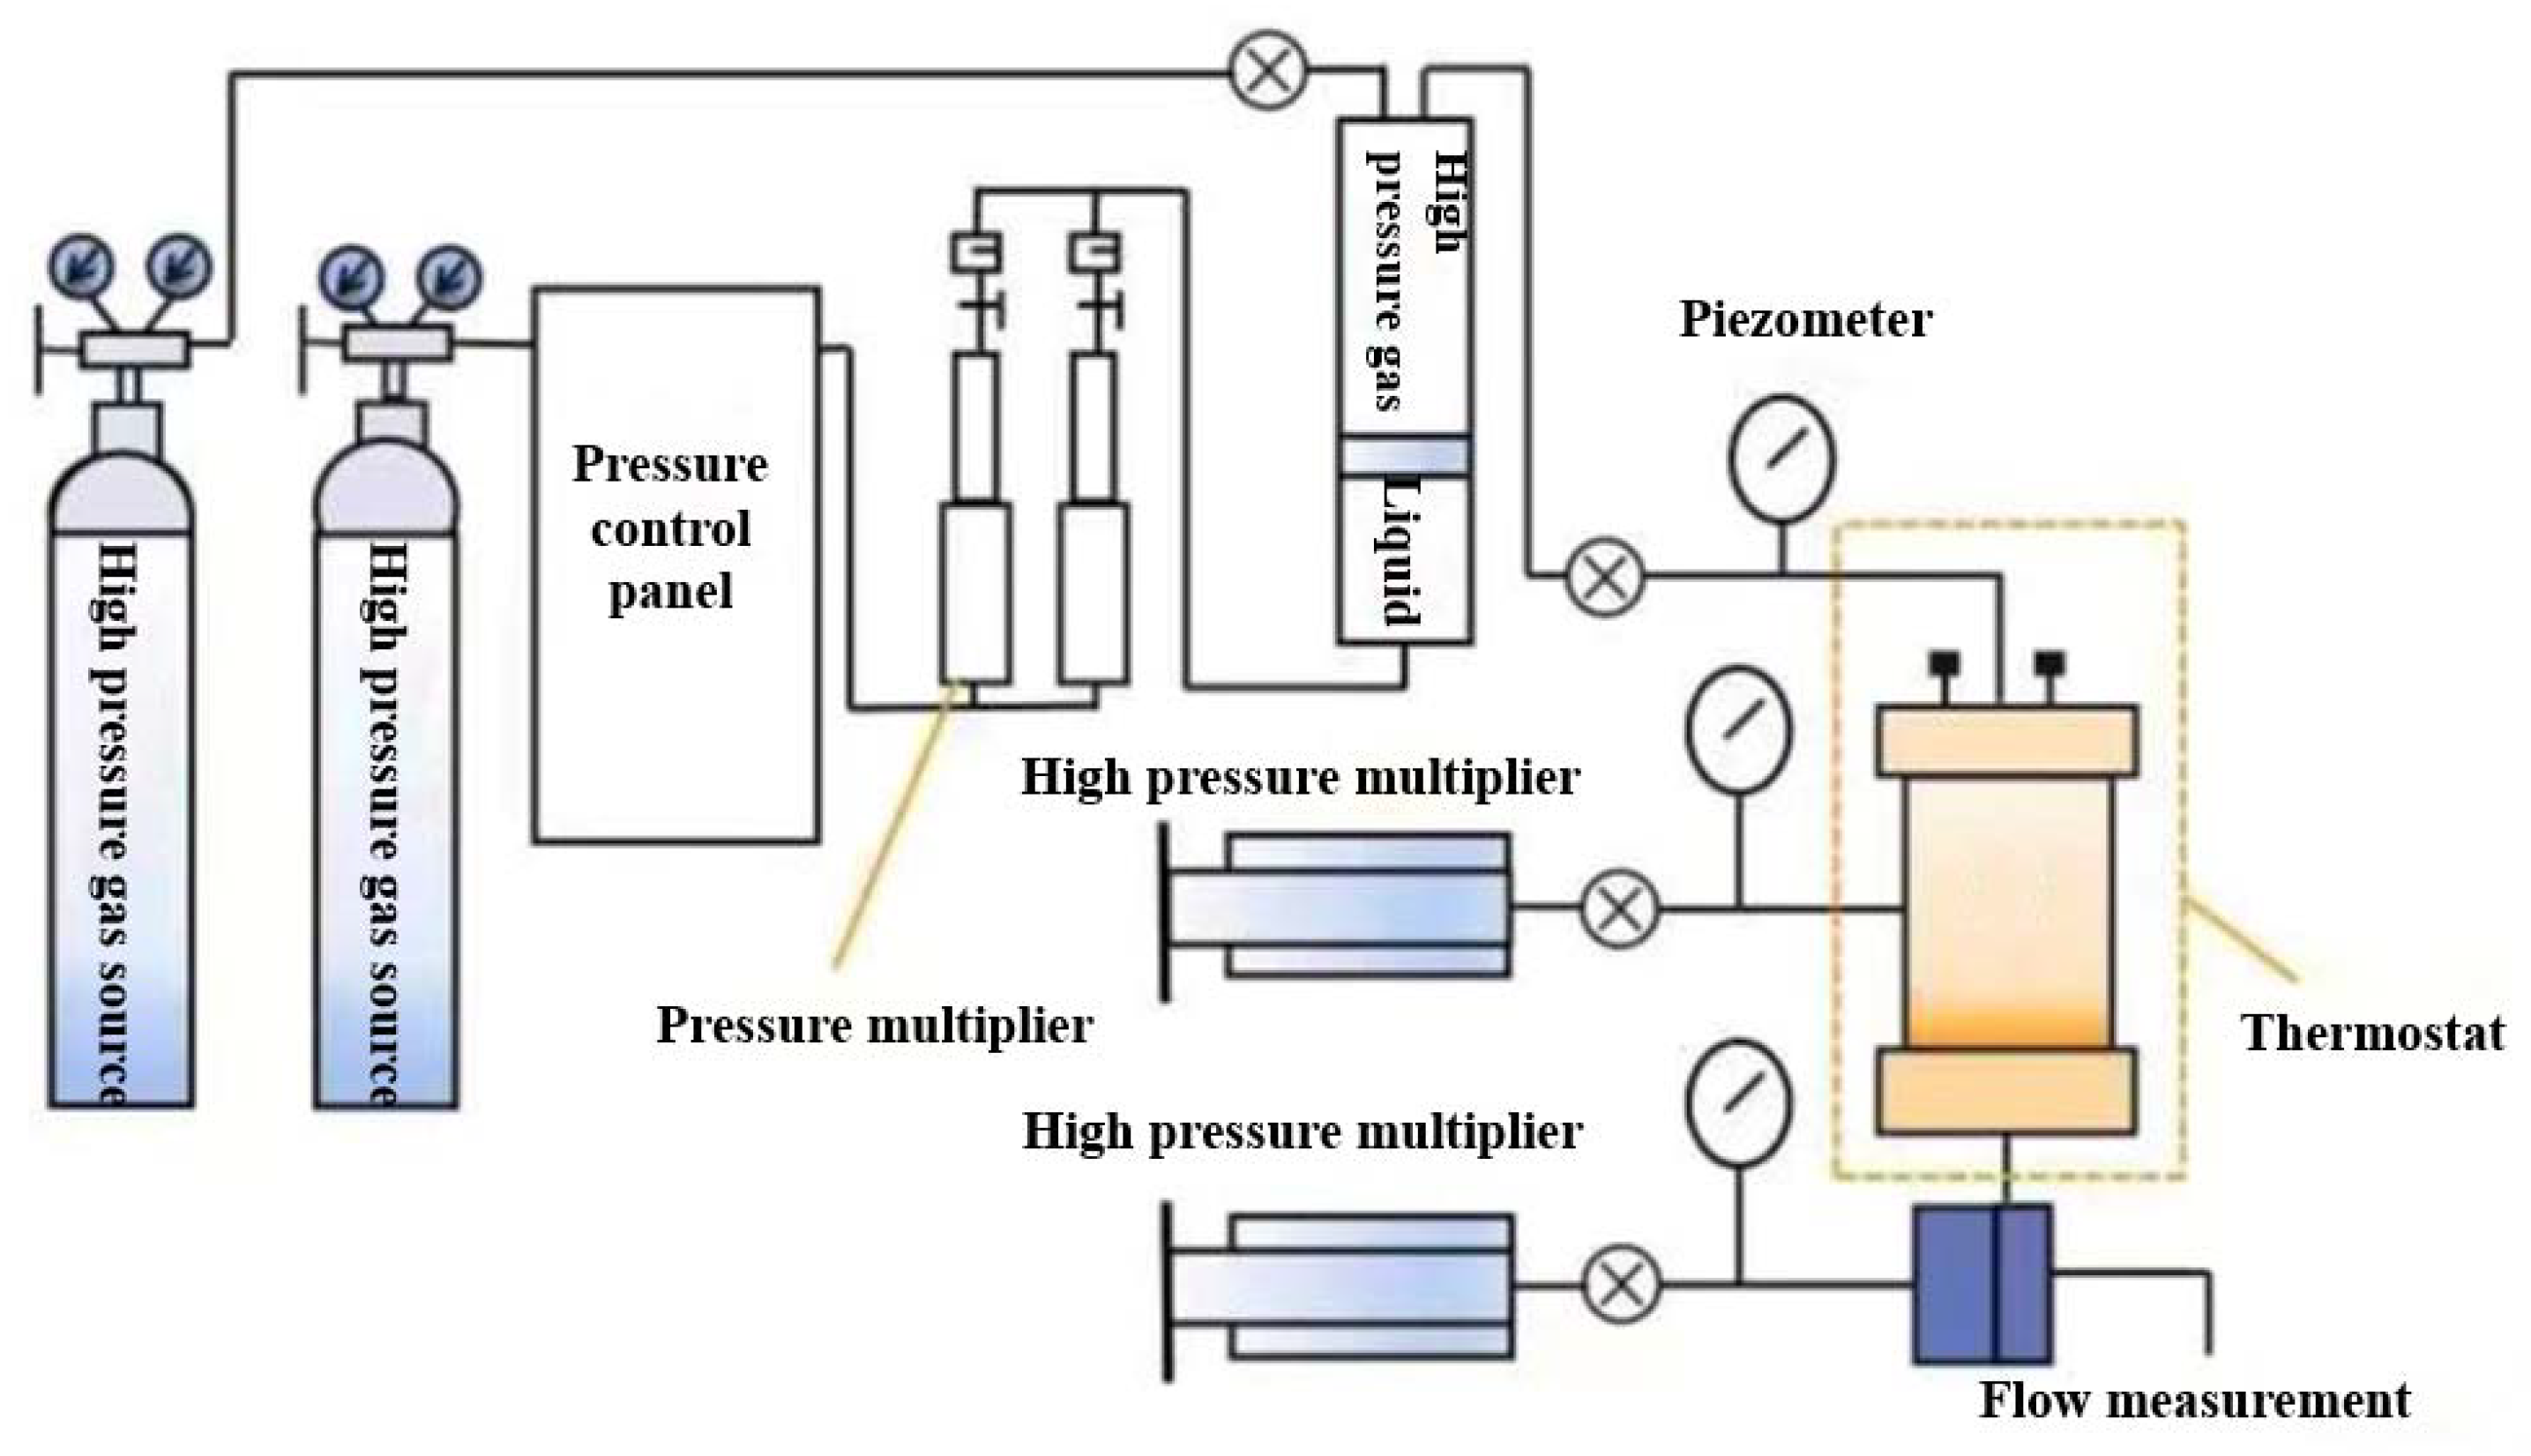
The experimental setup is shown in Figure 1.

Figure 1.
Diagram for experimental setup.
2.2. Evaluation of the Effect of Removing Water Block by Injecting Hot Gas
2.2.1. Influence of Gas-Injection Temperature
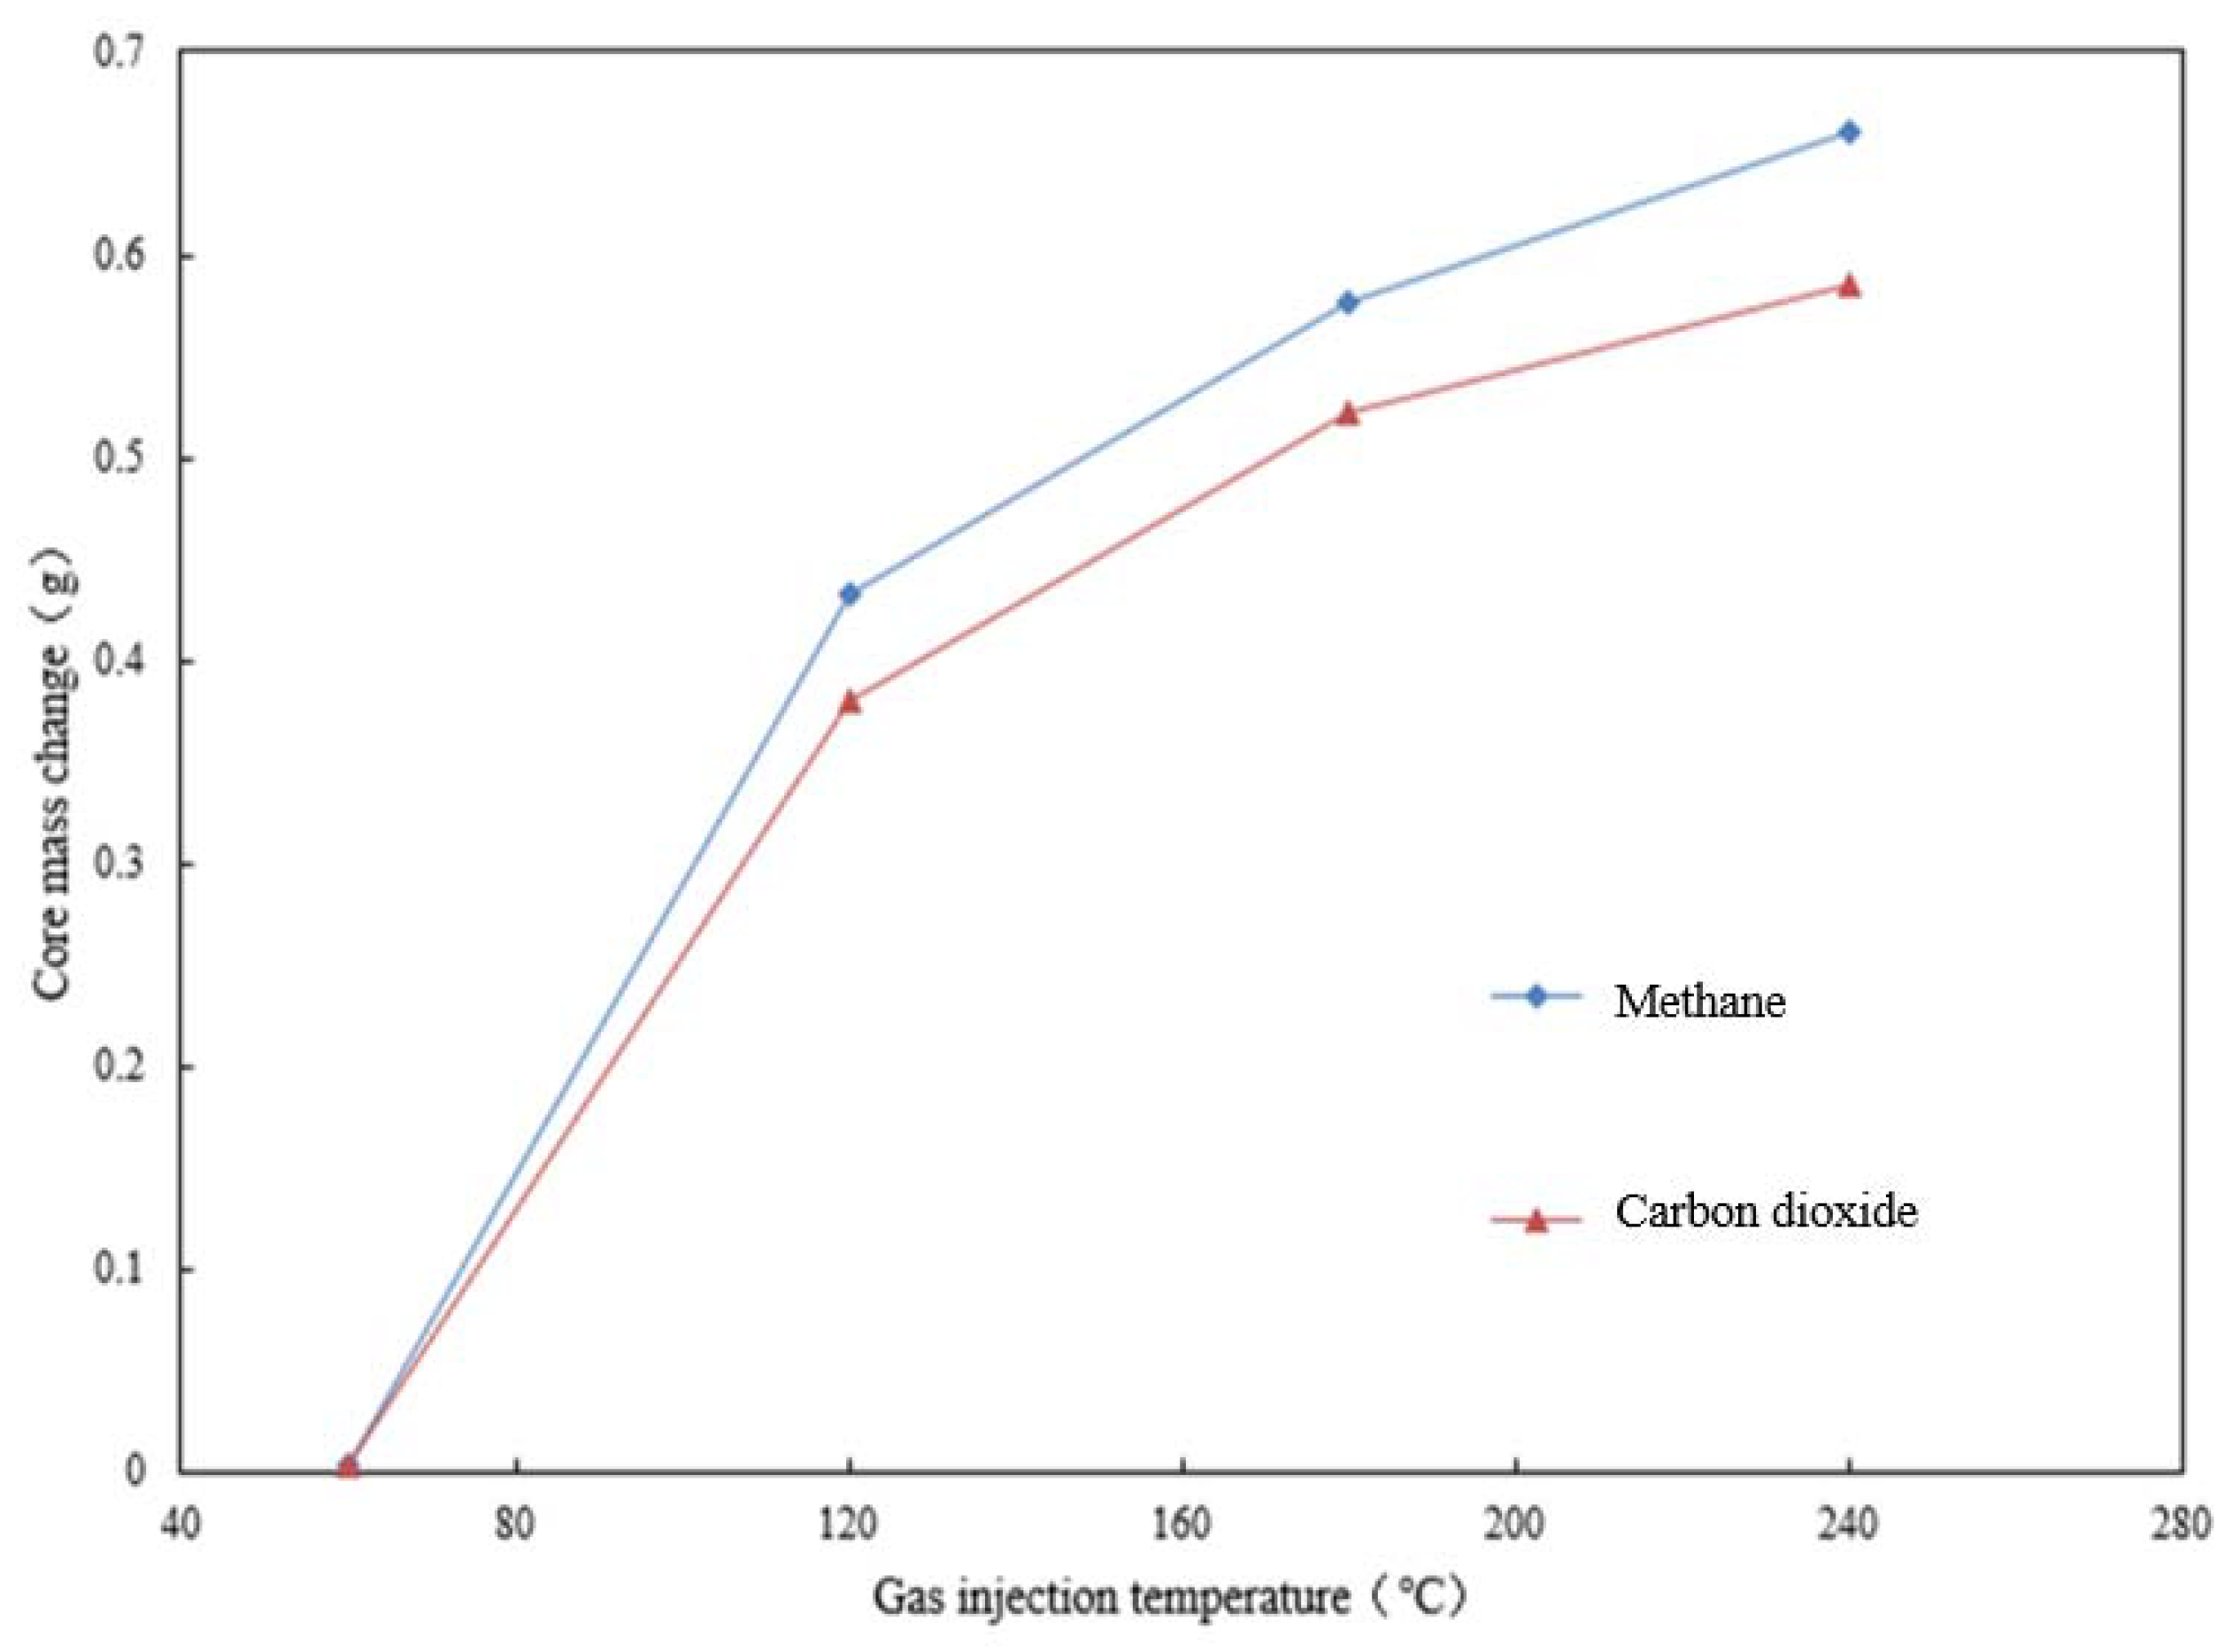
Figure 2 shows the relationship between gas injection temperature and core mass change. For the same type of gas injection, the change in core mass increases with an increase in gas-injection temperature. However, the range of increases gradually decreases. Compared with carbon dioxide injection, the core’s mass changes more after methane injections.
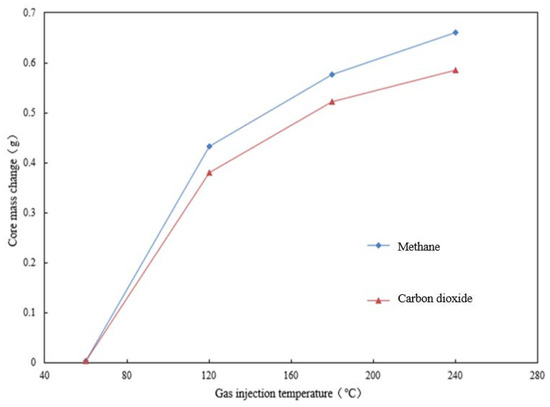
Figure 2.
Relationship between gas-injection temperature and core mass change.
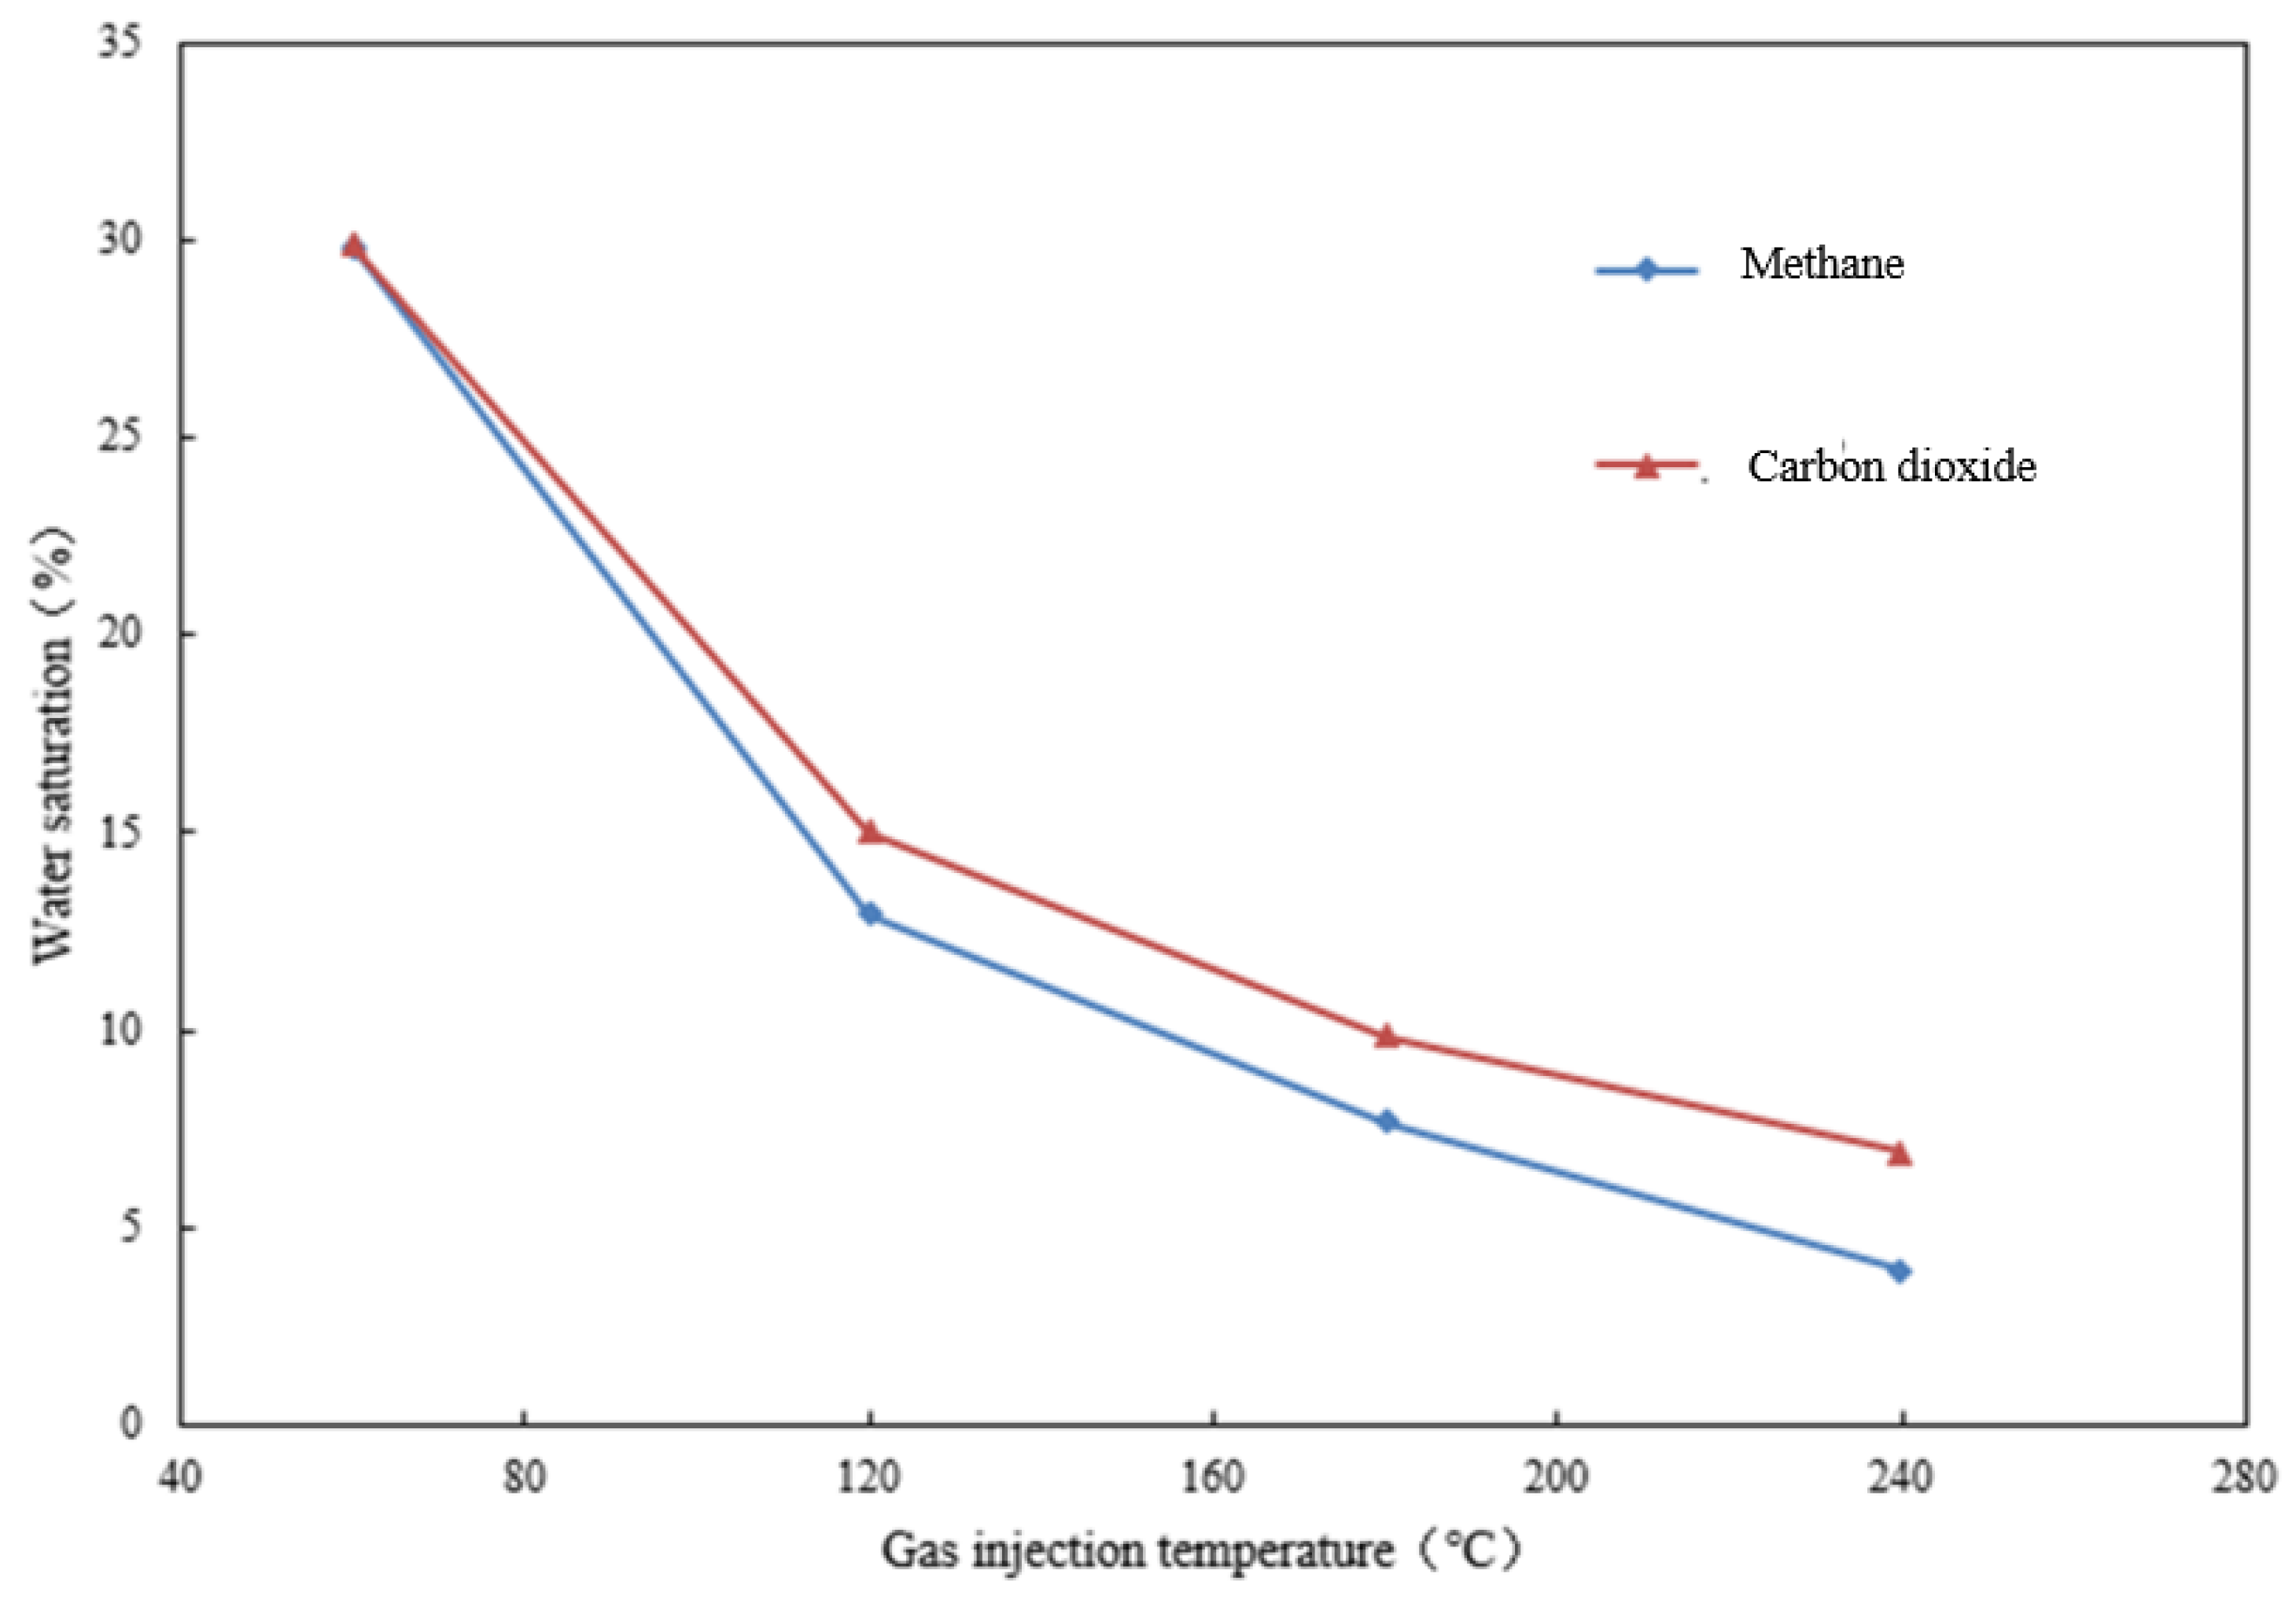
Figure 3 shows the relationship between gas injection temperature and core water saturation. In Figure 3, with the increase of temperature of gas injection, the core water saturation decreases, but the trend of the decrease decreases gradually. When the gas-injection temperature reaches 120 °C, the decreasing rate of core water saturation slows down. Compared with carbon dioxide injection, water saturation in the core decreases greatly after methane injection, which indicates that methane has a stronger carrying effect on irreducible water block effects in the core.
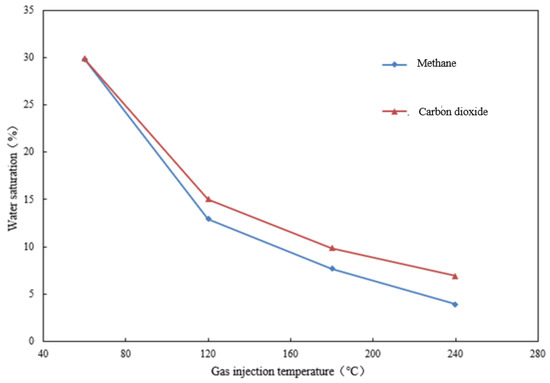
Figure 3.
Relationship between gas-injection temperature and core water saturation.
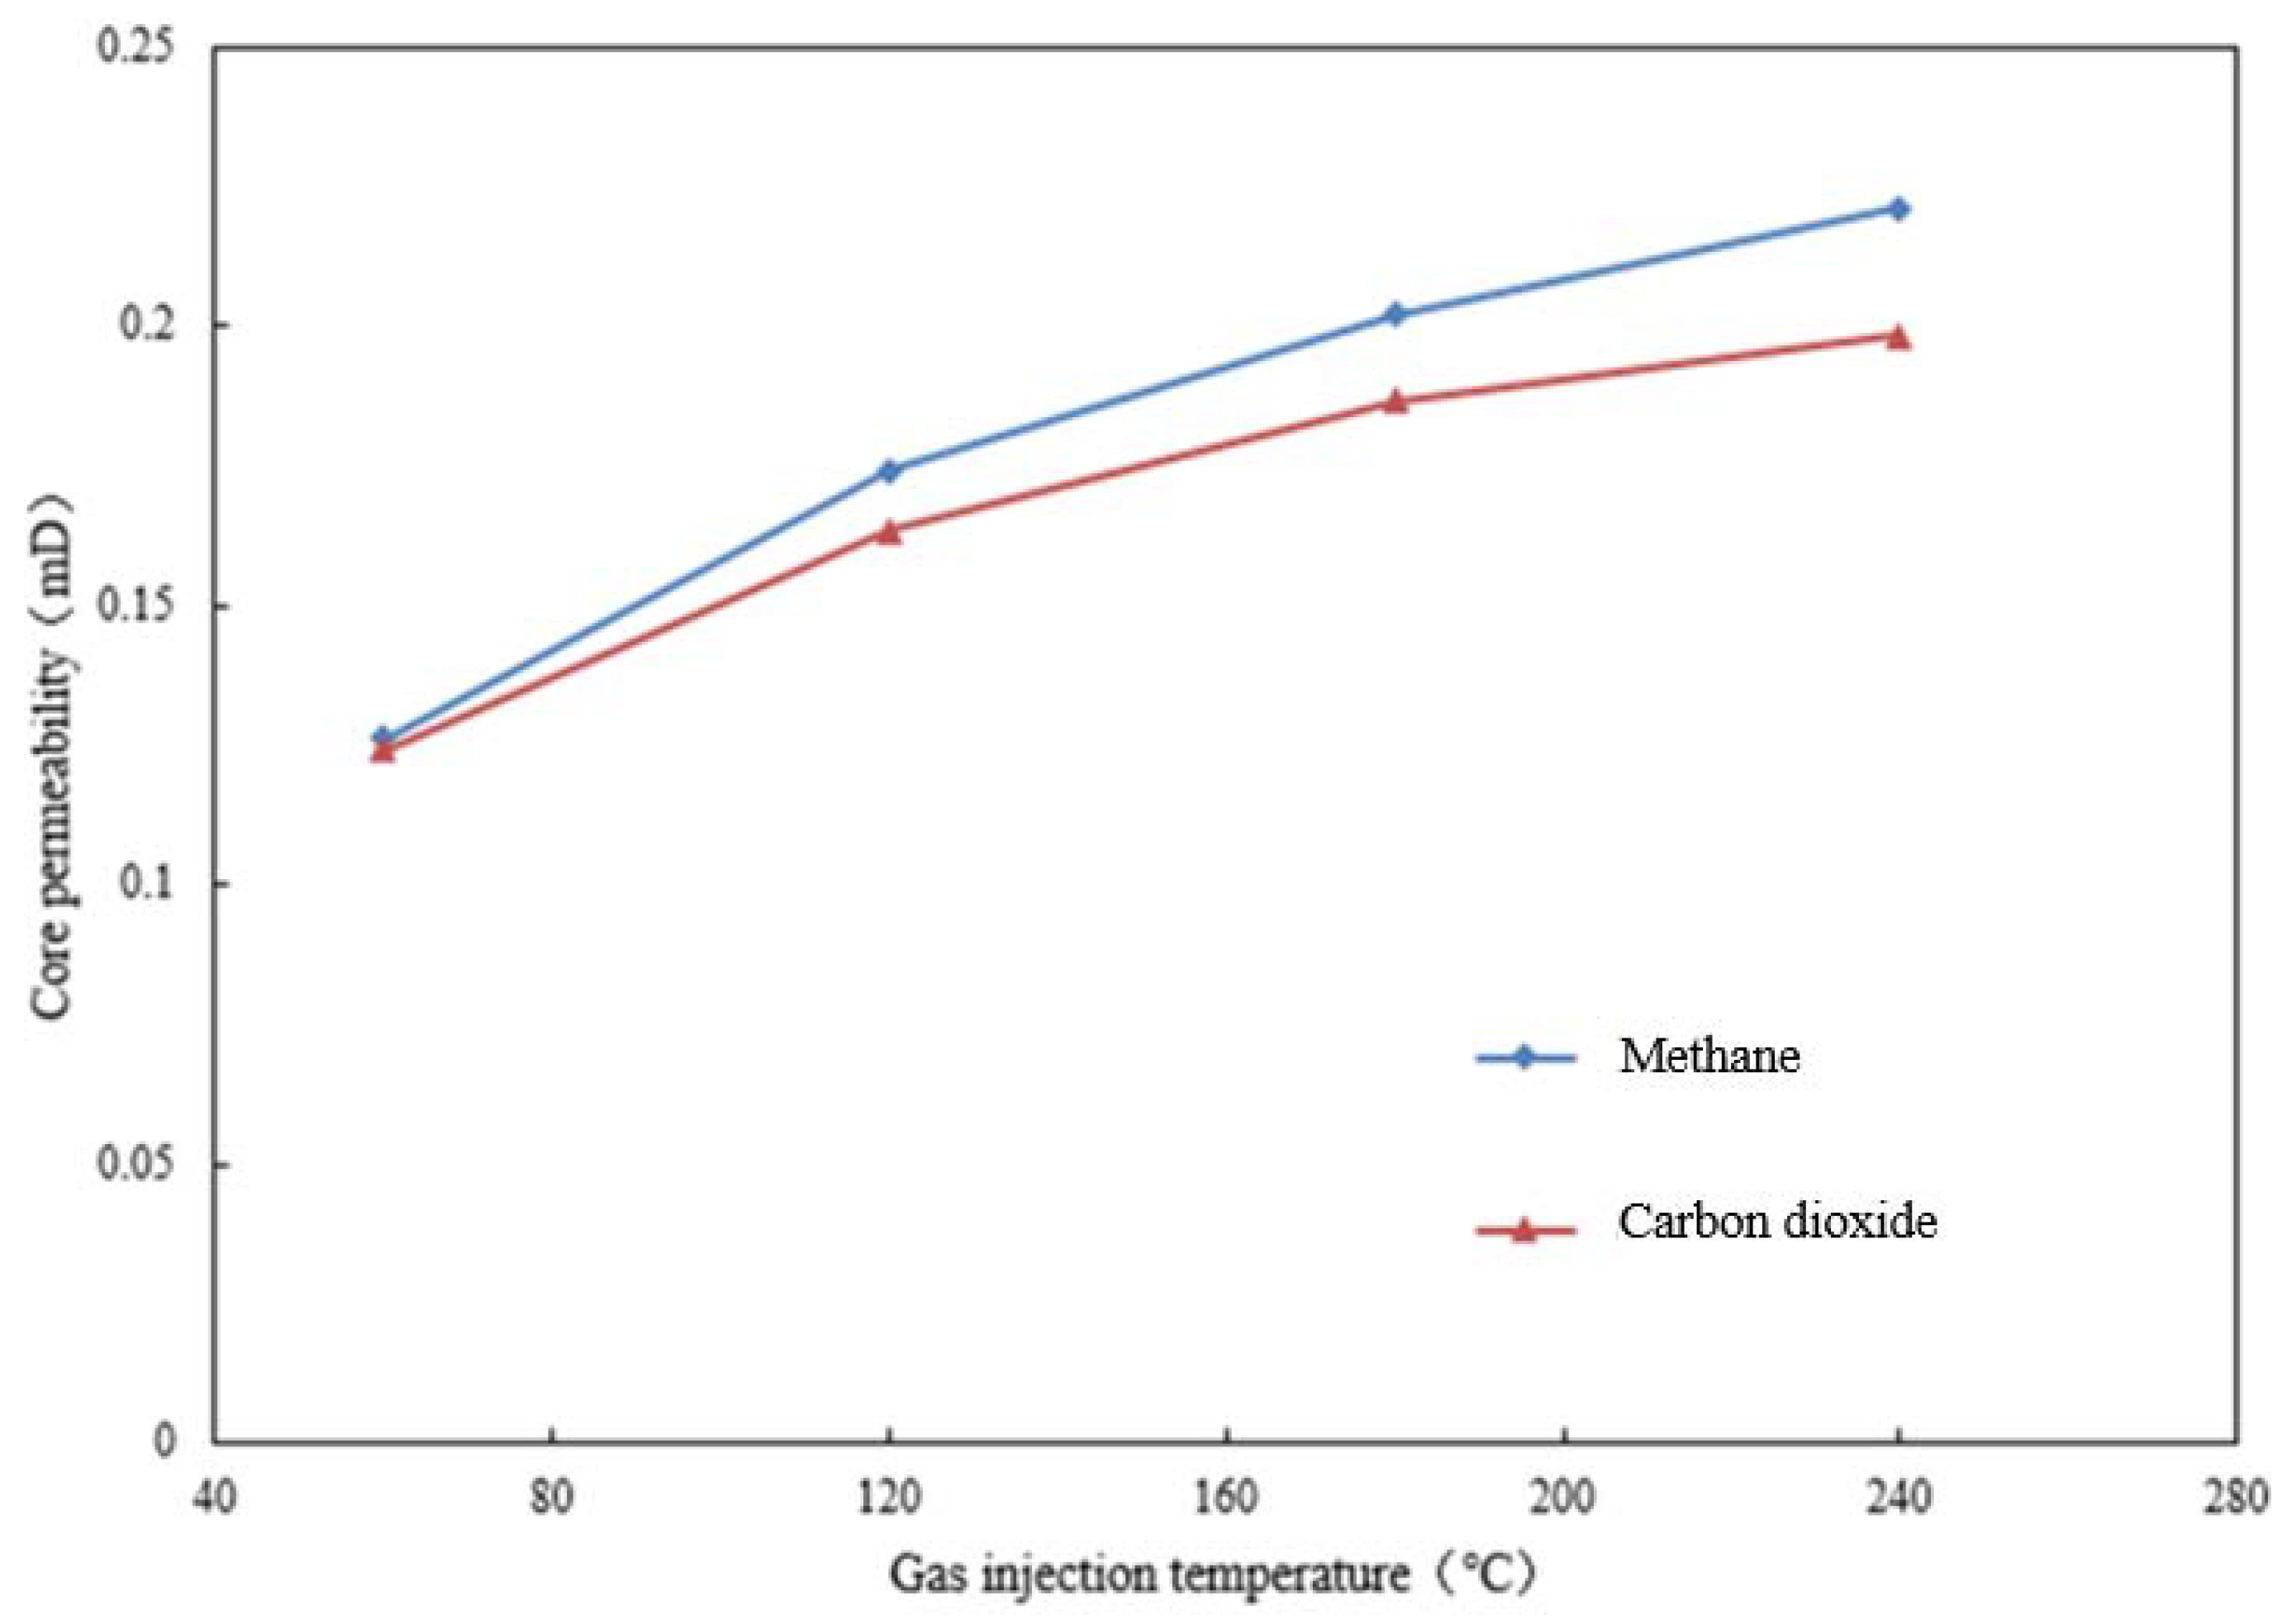
Figure 4 shows the relationship between gas injection temperature and core permeability. In Figure 4, under the same experimental conditions, the core’s permeability increases gradually with the increase in drying gas temperature, but the range of increase decreases. Compared with carbon dioxide, the drying effect of methane is superior. The specific performance is that the recovery value of core permeability is higher at the same drying temperature. Under the condition of injecting drying gas at the same temperature, the heat loss of methane in the core is higher because of its higher specific heat capacity. On the one hand, the loss of heat heats the rock itself. On the other hand, more heat is released and evaporates, carrying more bound water in the core’s pores, and its viscosity is higher. Therefore, methane has a stronger carrying effect on bound water in the core’s pores, and the recovery value of core permeability is higher.
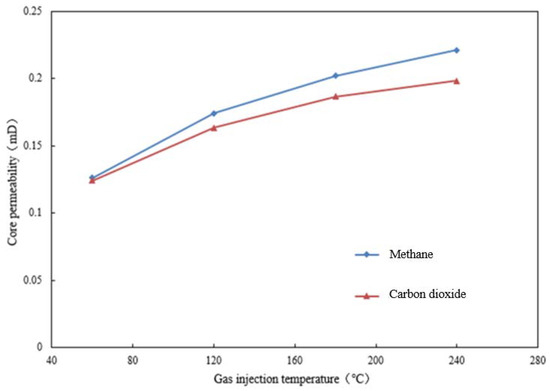
Figure 4.
Relationship between gas-injection temperature and core permeability.
2.2.2. Influence of Water Block Degree
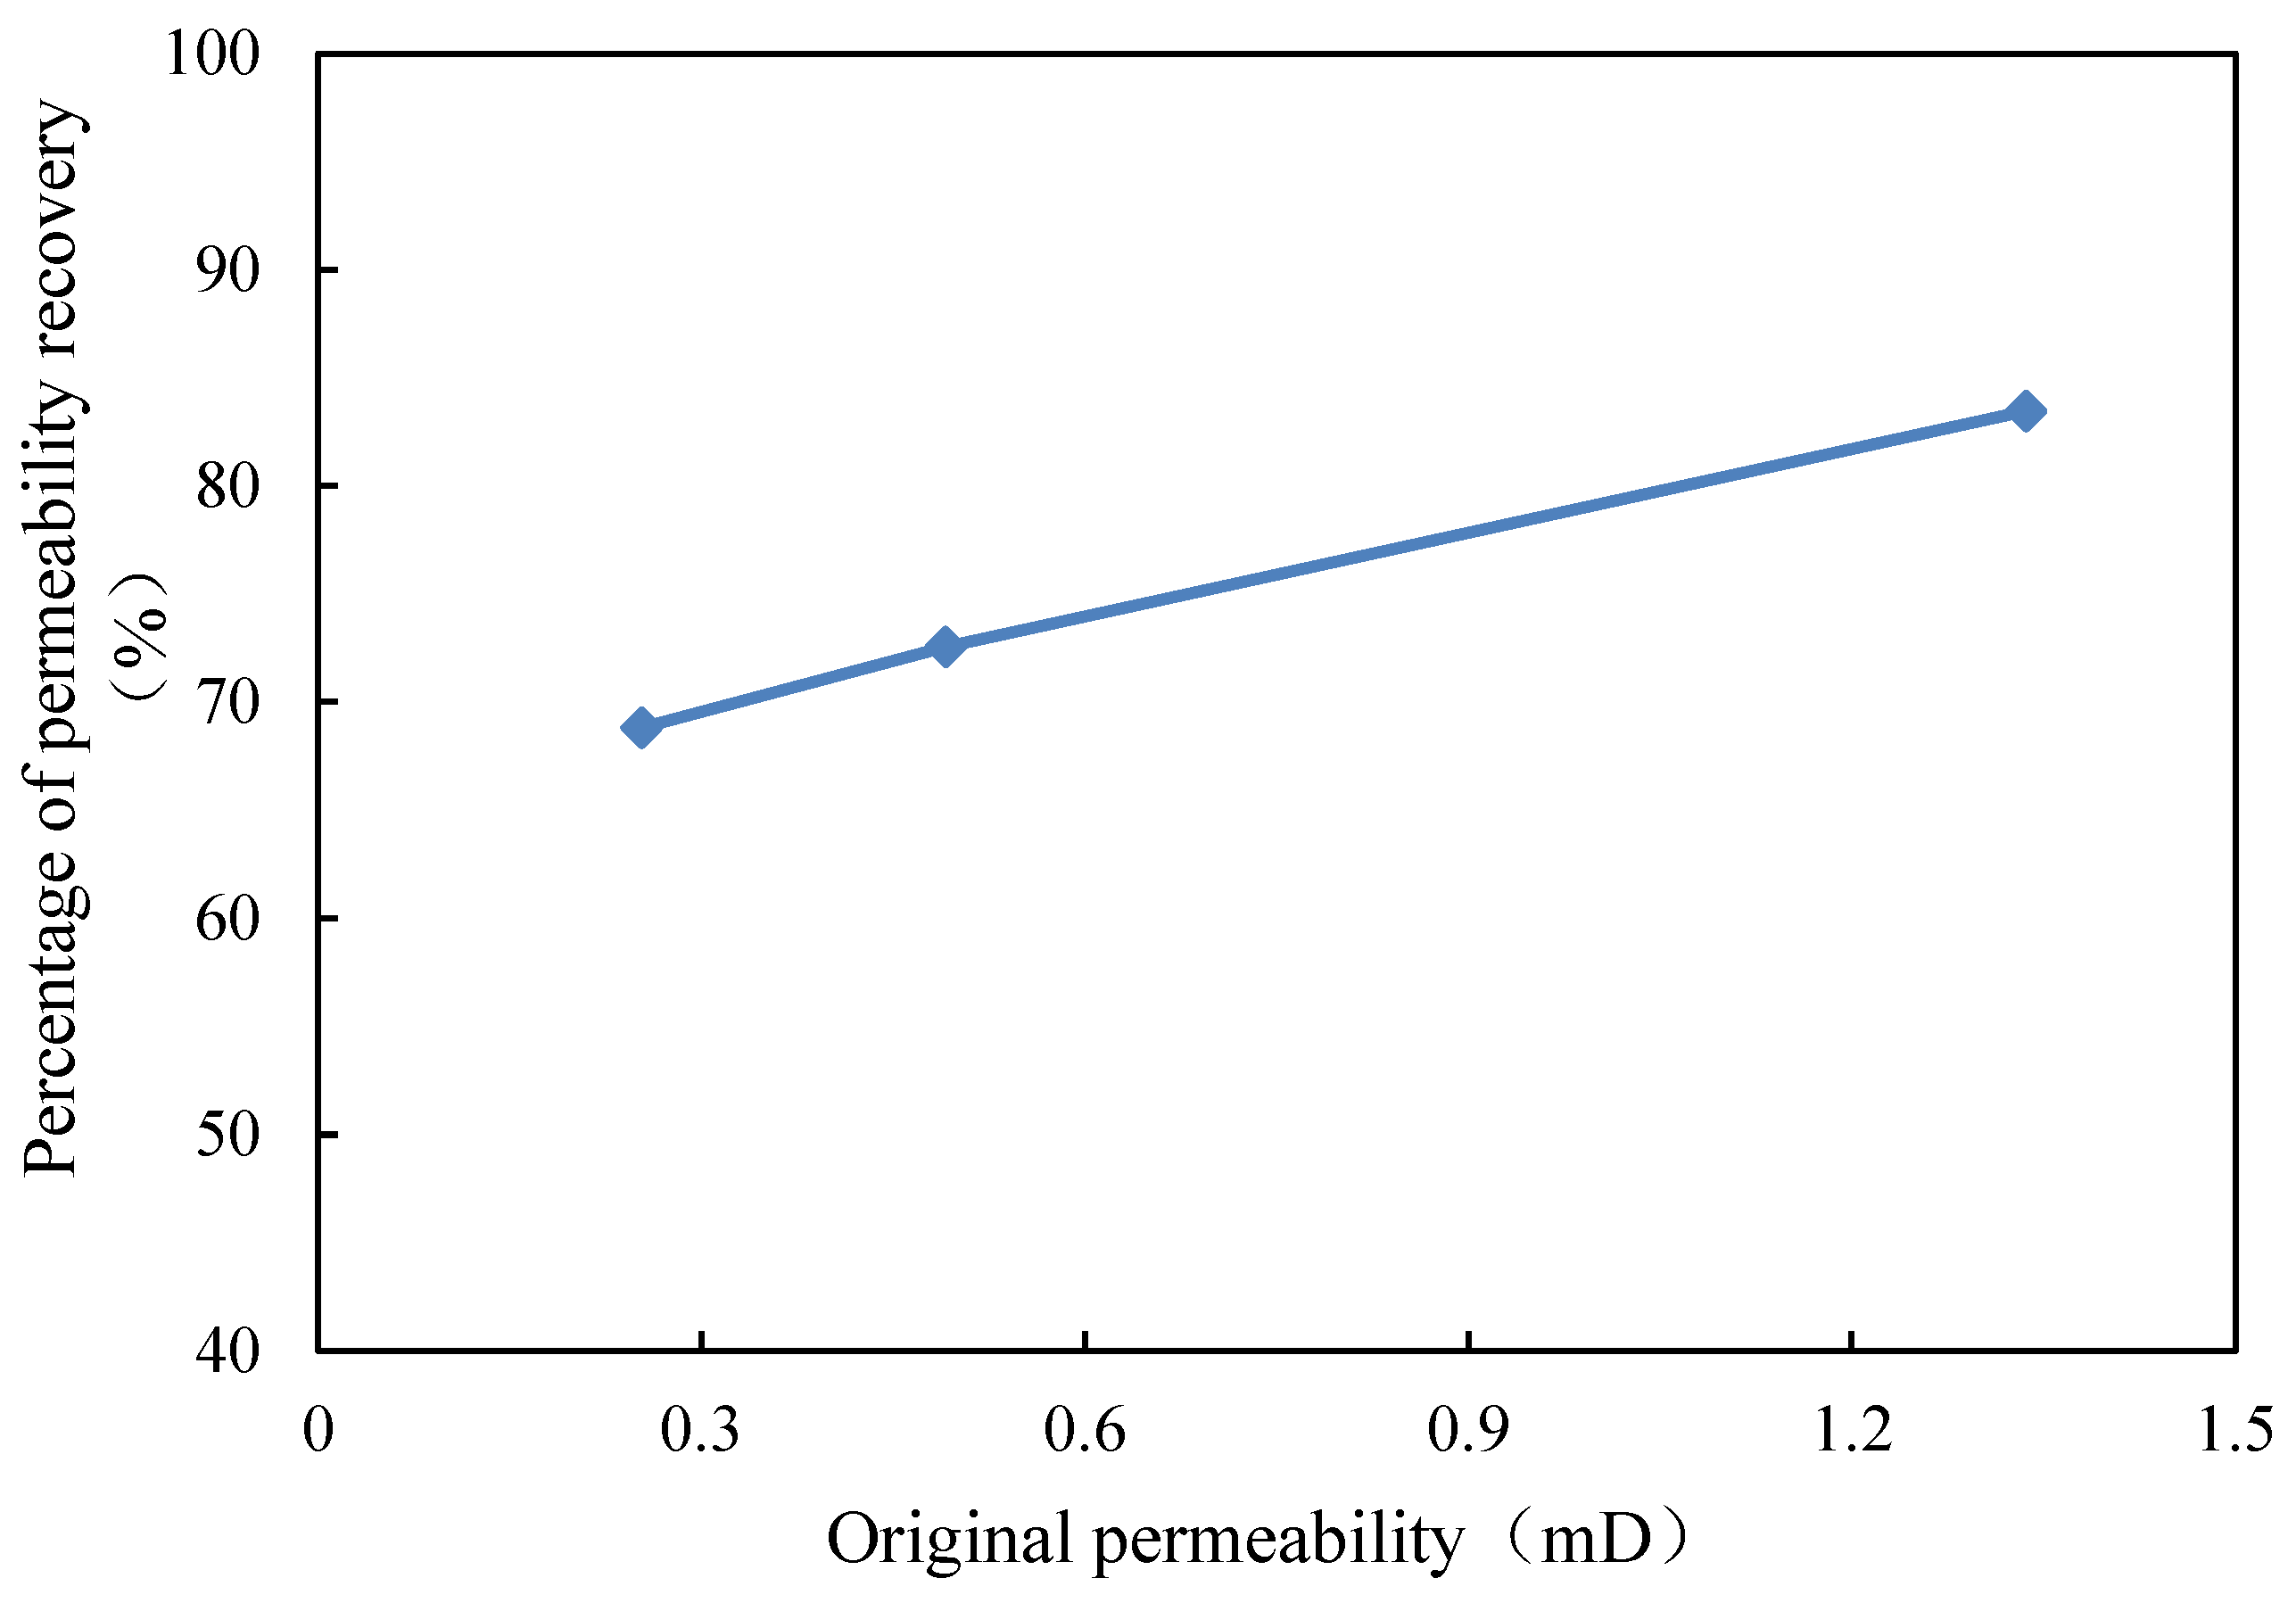
Figure 5 shows the relationship between desiccated core permeability and original permeability. And Figure 6 shows the relationship between the permeability recovery rate and the original permeability. In Figure 5, with the increase of original permeability, the permeability of dried cores increases. In Figure 6, with the increase of original permeability, the core permeability recovery rate increases. The results show that the hydrolytic effect of hot gas is better for cores with higher permeability.
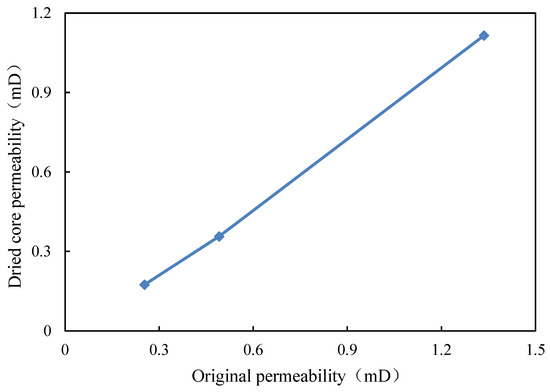
Figure 5.
Relationship between dry core permeability and original permeability.

Figure 6.
Relationship between permeability recovery rate and original permeability.
3. Numerical Simulation of Hot-Gas Injection
After the feasibility of hot-gas injection, the water lock is studied experimentally, and the concrete influence of hot-gas injection water lock is further studied by numerical simulation. The simulation has been conducted by using the commercial finite element simulation software COMSOL. The model’s hypotheses and boundary conditions are as follows:
- (1)
- The temperature distribution is uniform at the initial time;
- (2)
- The stress sensitivity on the permeability can be ignored;
- (3)
- The gravity effect is ignored;
- (4)
- Homogeneous porosity and permeability distribution in the core;
- (5)
- Constant injection rate of methane and carbon dioxide at the inlet boundary.
- (6)
- The outlet boundary is set as constant pressure boundary with pressure equal to 1 atm.
- (7)
- The initial water phase of the core is in a static state, and the flow of the water phase follows the Darcy equation when it is driven by gas, and the effect of adsorbed water on the pore surface of the core on fluid flow is not considered.
Since fluid flow and heat conduction are involved in the simulation process, the coupling of gas flow field and thermal field is selected to realize the simulation in this paper. The equations for simulation are as follows:
where Equation (1) is the heat conduction equation of temperature field; Equation (2) is the seepage field equation; is source term of seepage field; refers to specific heat capacity, J/(kg.K); refers to heat conduction coefficient, W/(m.K);
The simulation does not take into account the stress sensitivity of permeability, and the formula for calculating permeability is as follows:
The permeability of the heating zone is as follows:
where refers to the permeability of the heating zone, mD; refers to the permeability growth coefficient caused by microcracks caused by thermal stress. Table 2 lists the required parameters for solving equations.
Table 2.
Parameters for solving equations.
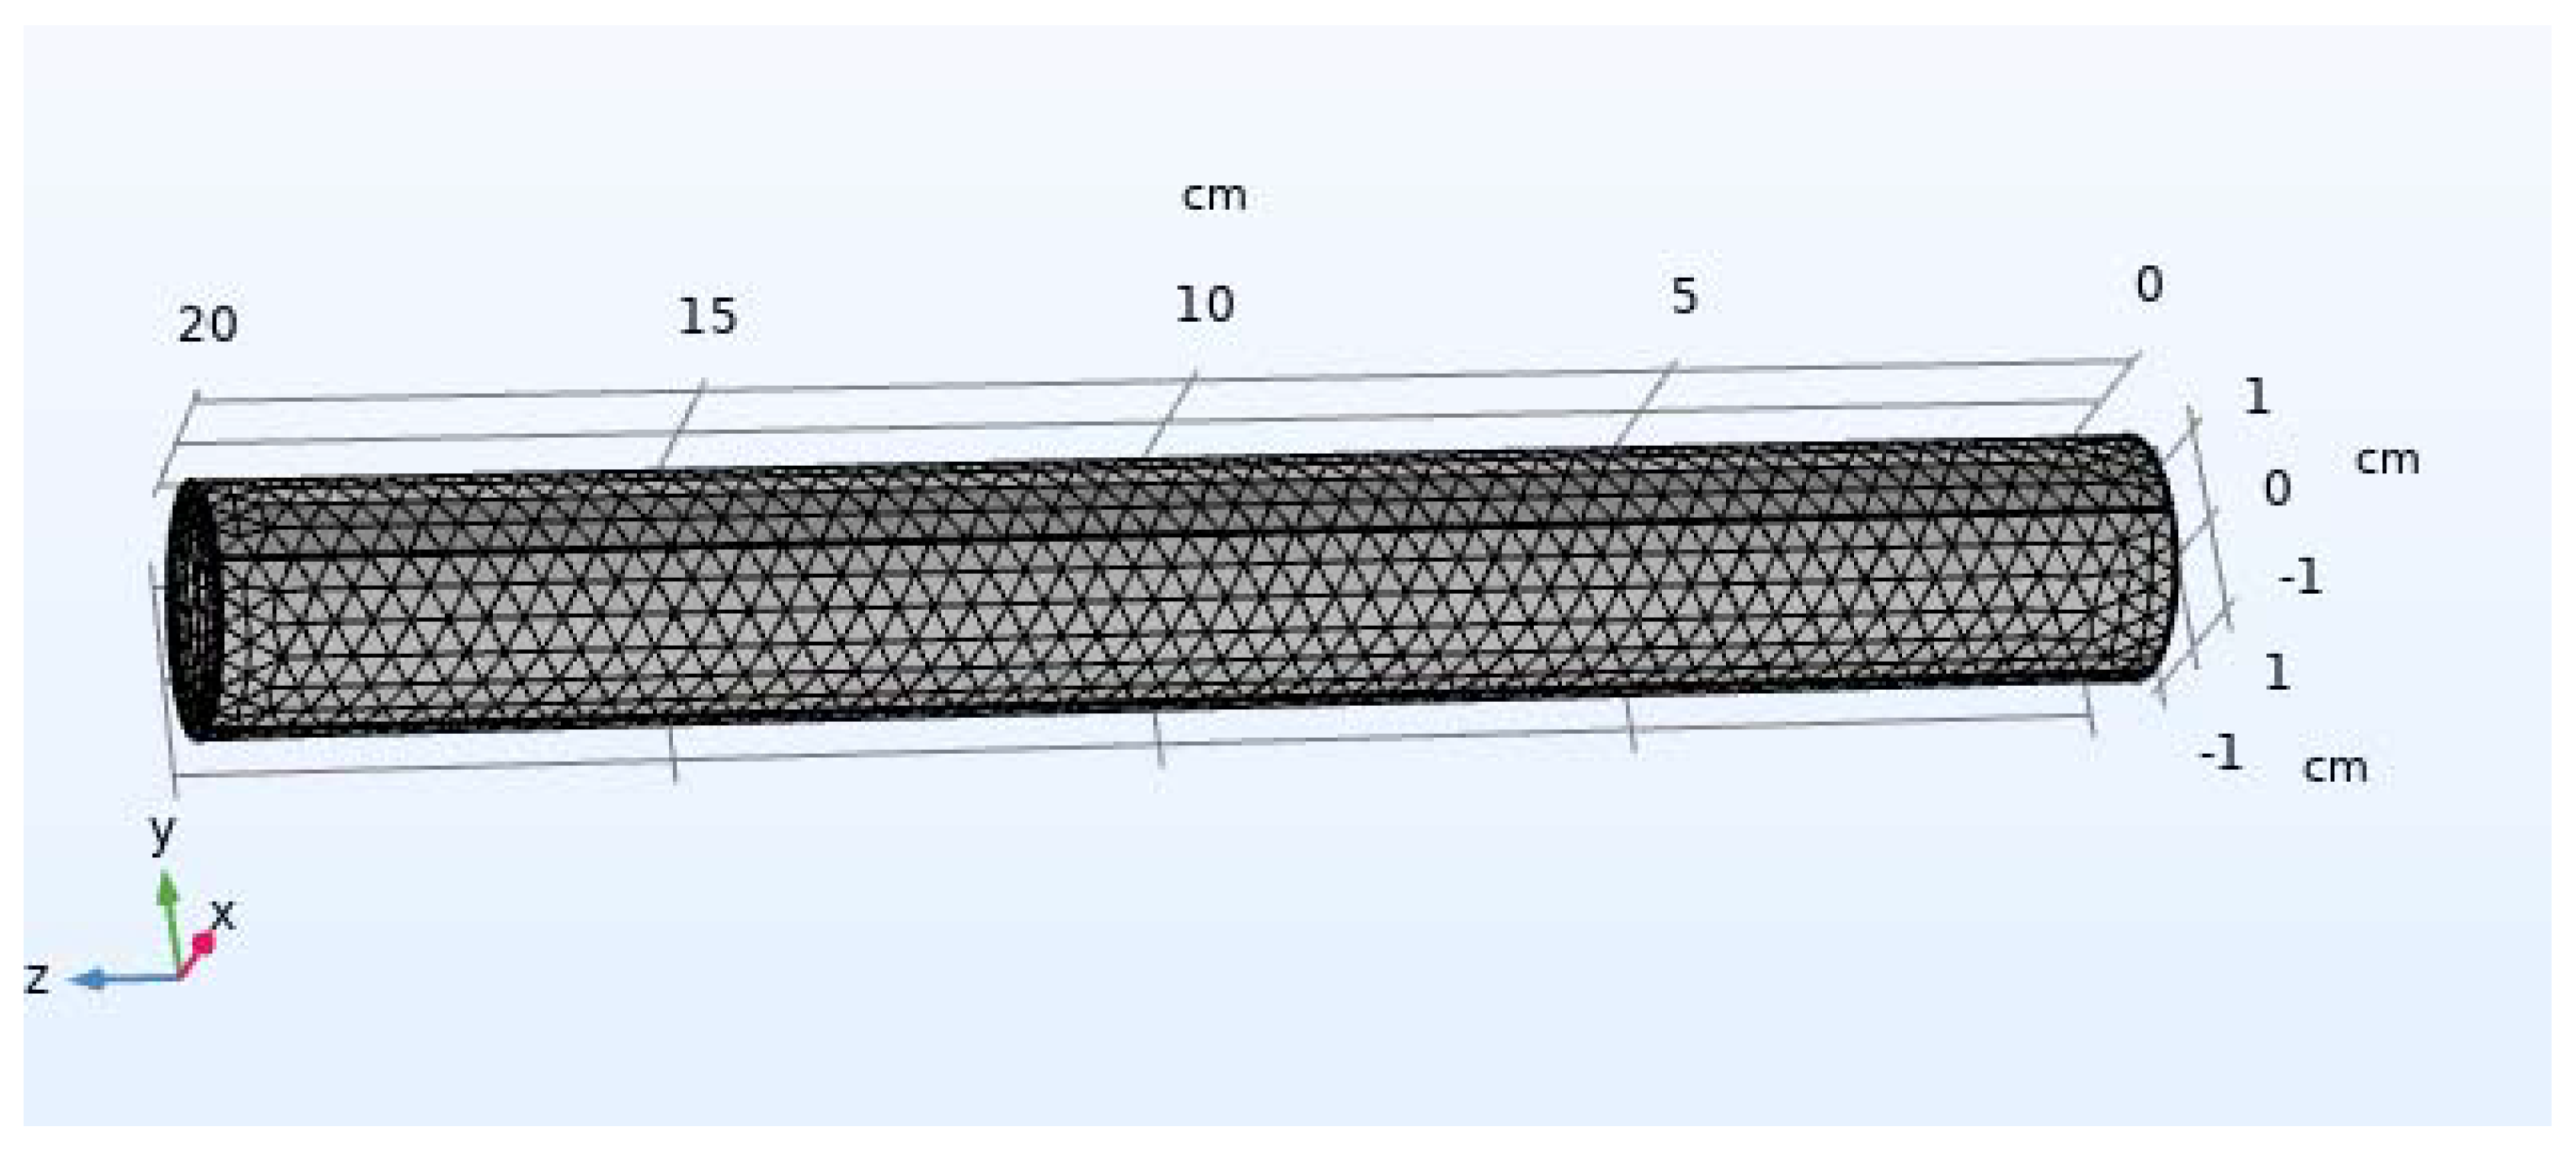
The geometric model is shown in Figure 7.
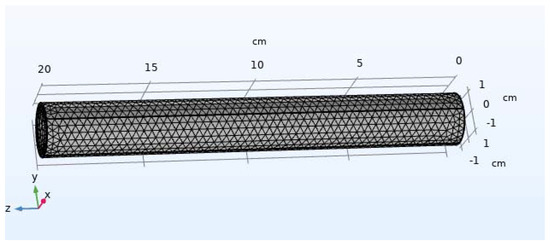
Figure 7.
The geometric model used for the simulation study.
3.1. Core Temperature Change
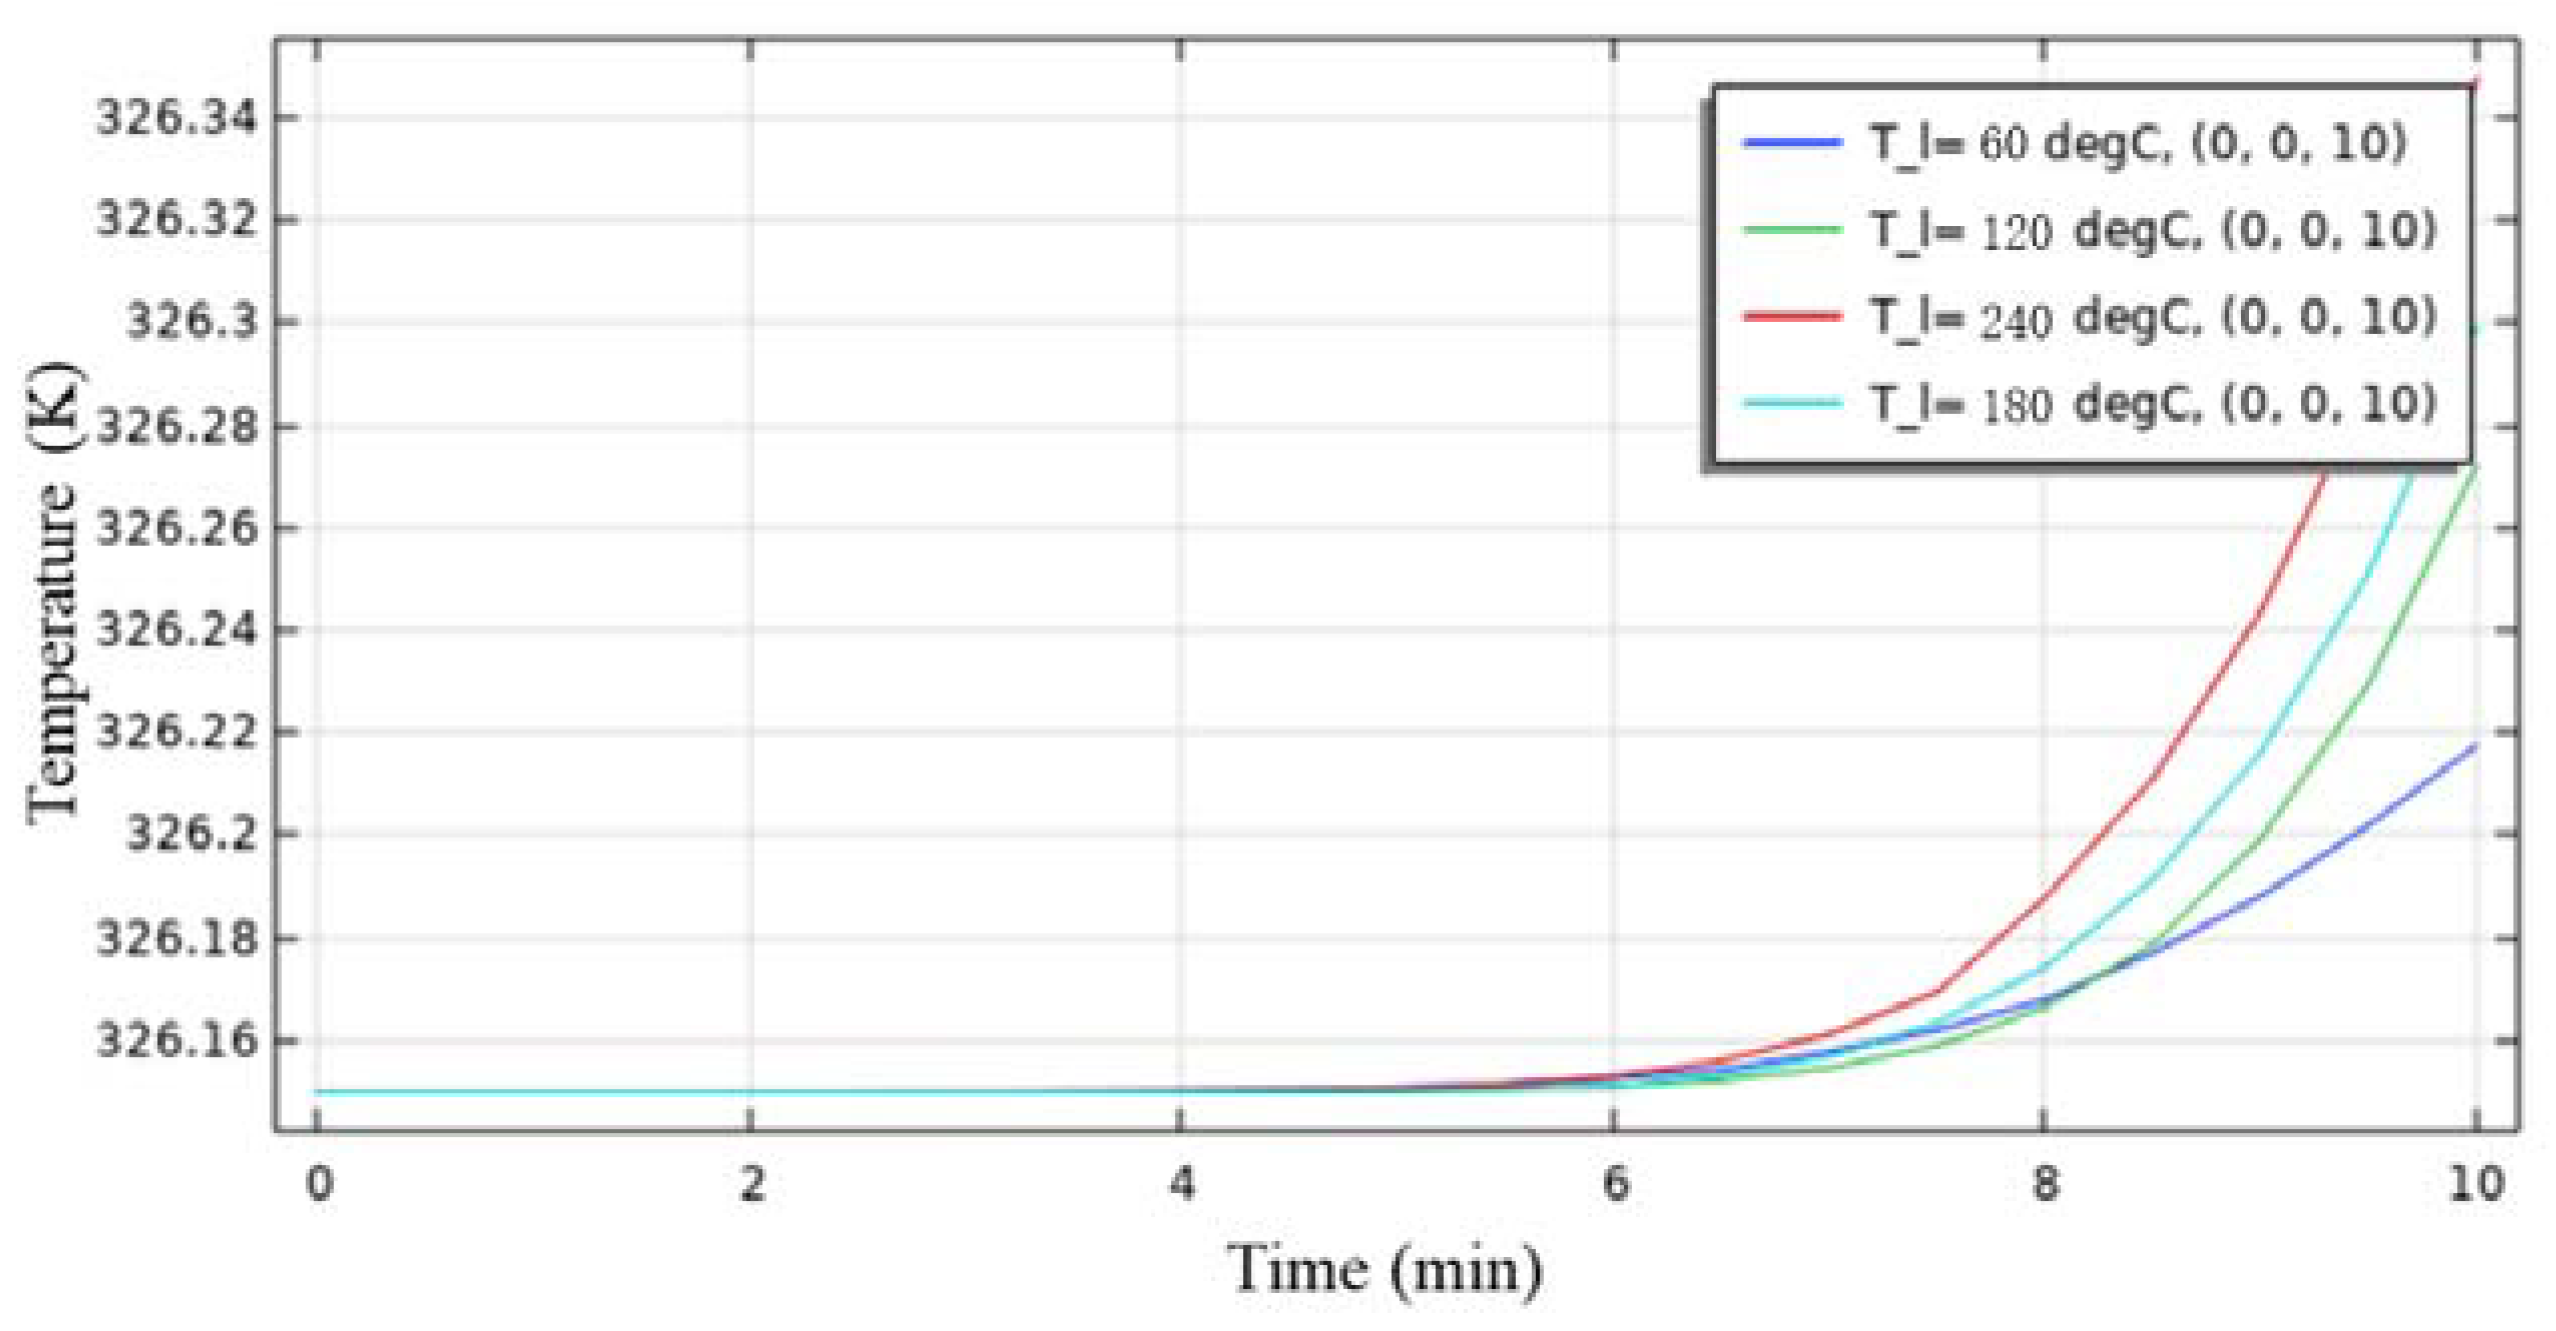
The initial temperature of core is 35 °C. When the original water saturation of the core is 35%, carbon dioxide gas at 60 °C, 120 °C, 180 °C, and 240 °C is injected, and the core’s temperature changes with different cumulative injection times. In Figure 8, the temperature of the core increases gradually with the time of carbon dioxide injection.
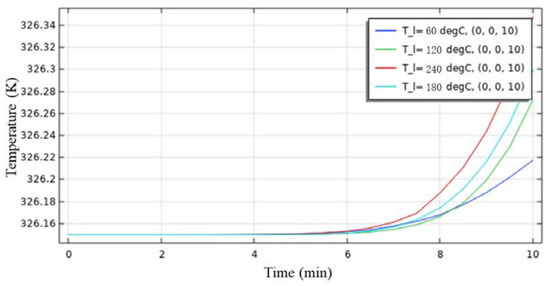
Figure 8.
Comparison of temperature changes in cores with carbon dioxide injected under different injection gas temperatures when the initial water saturation is 35%.
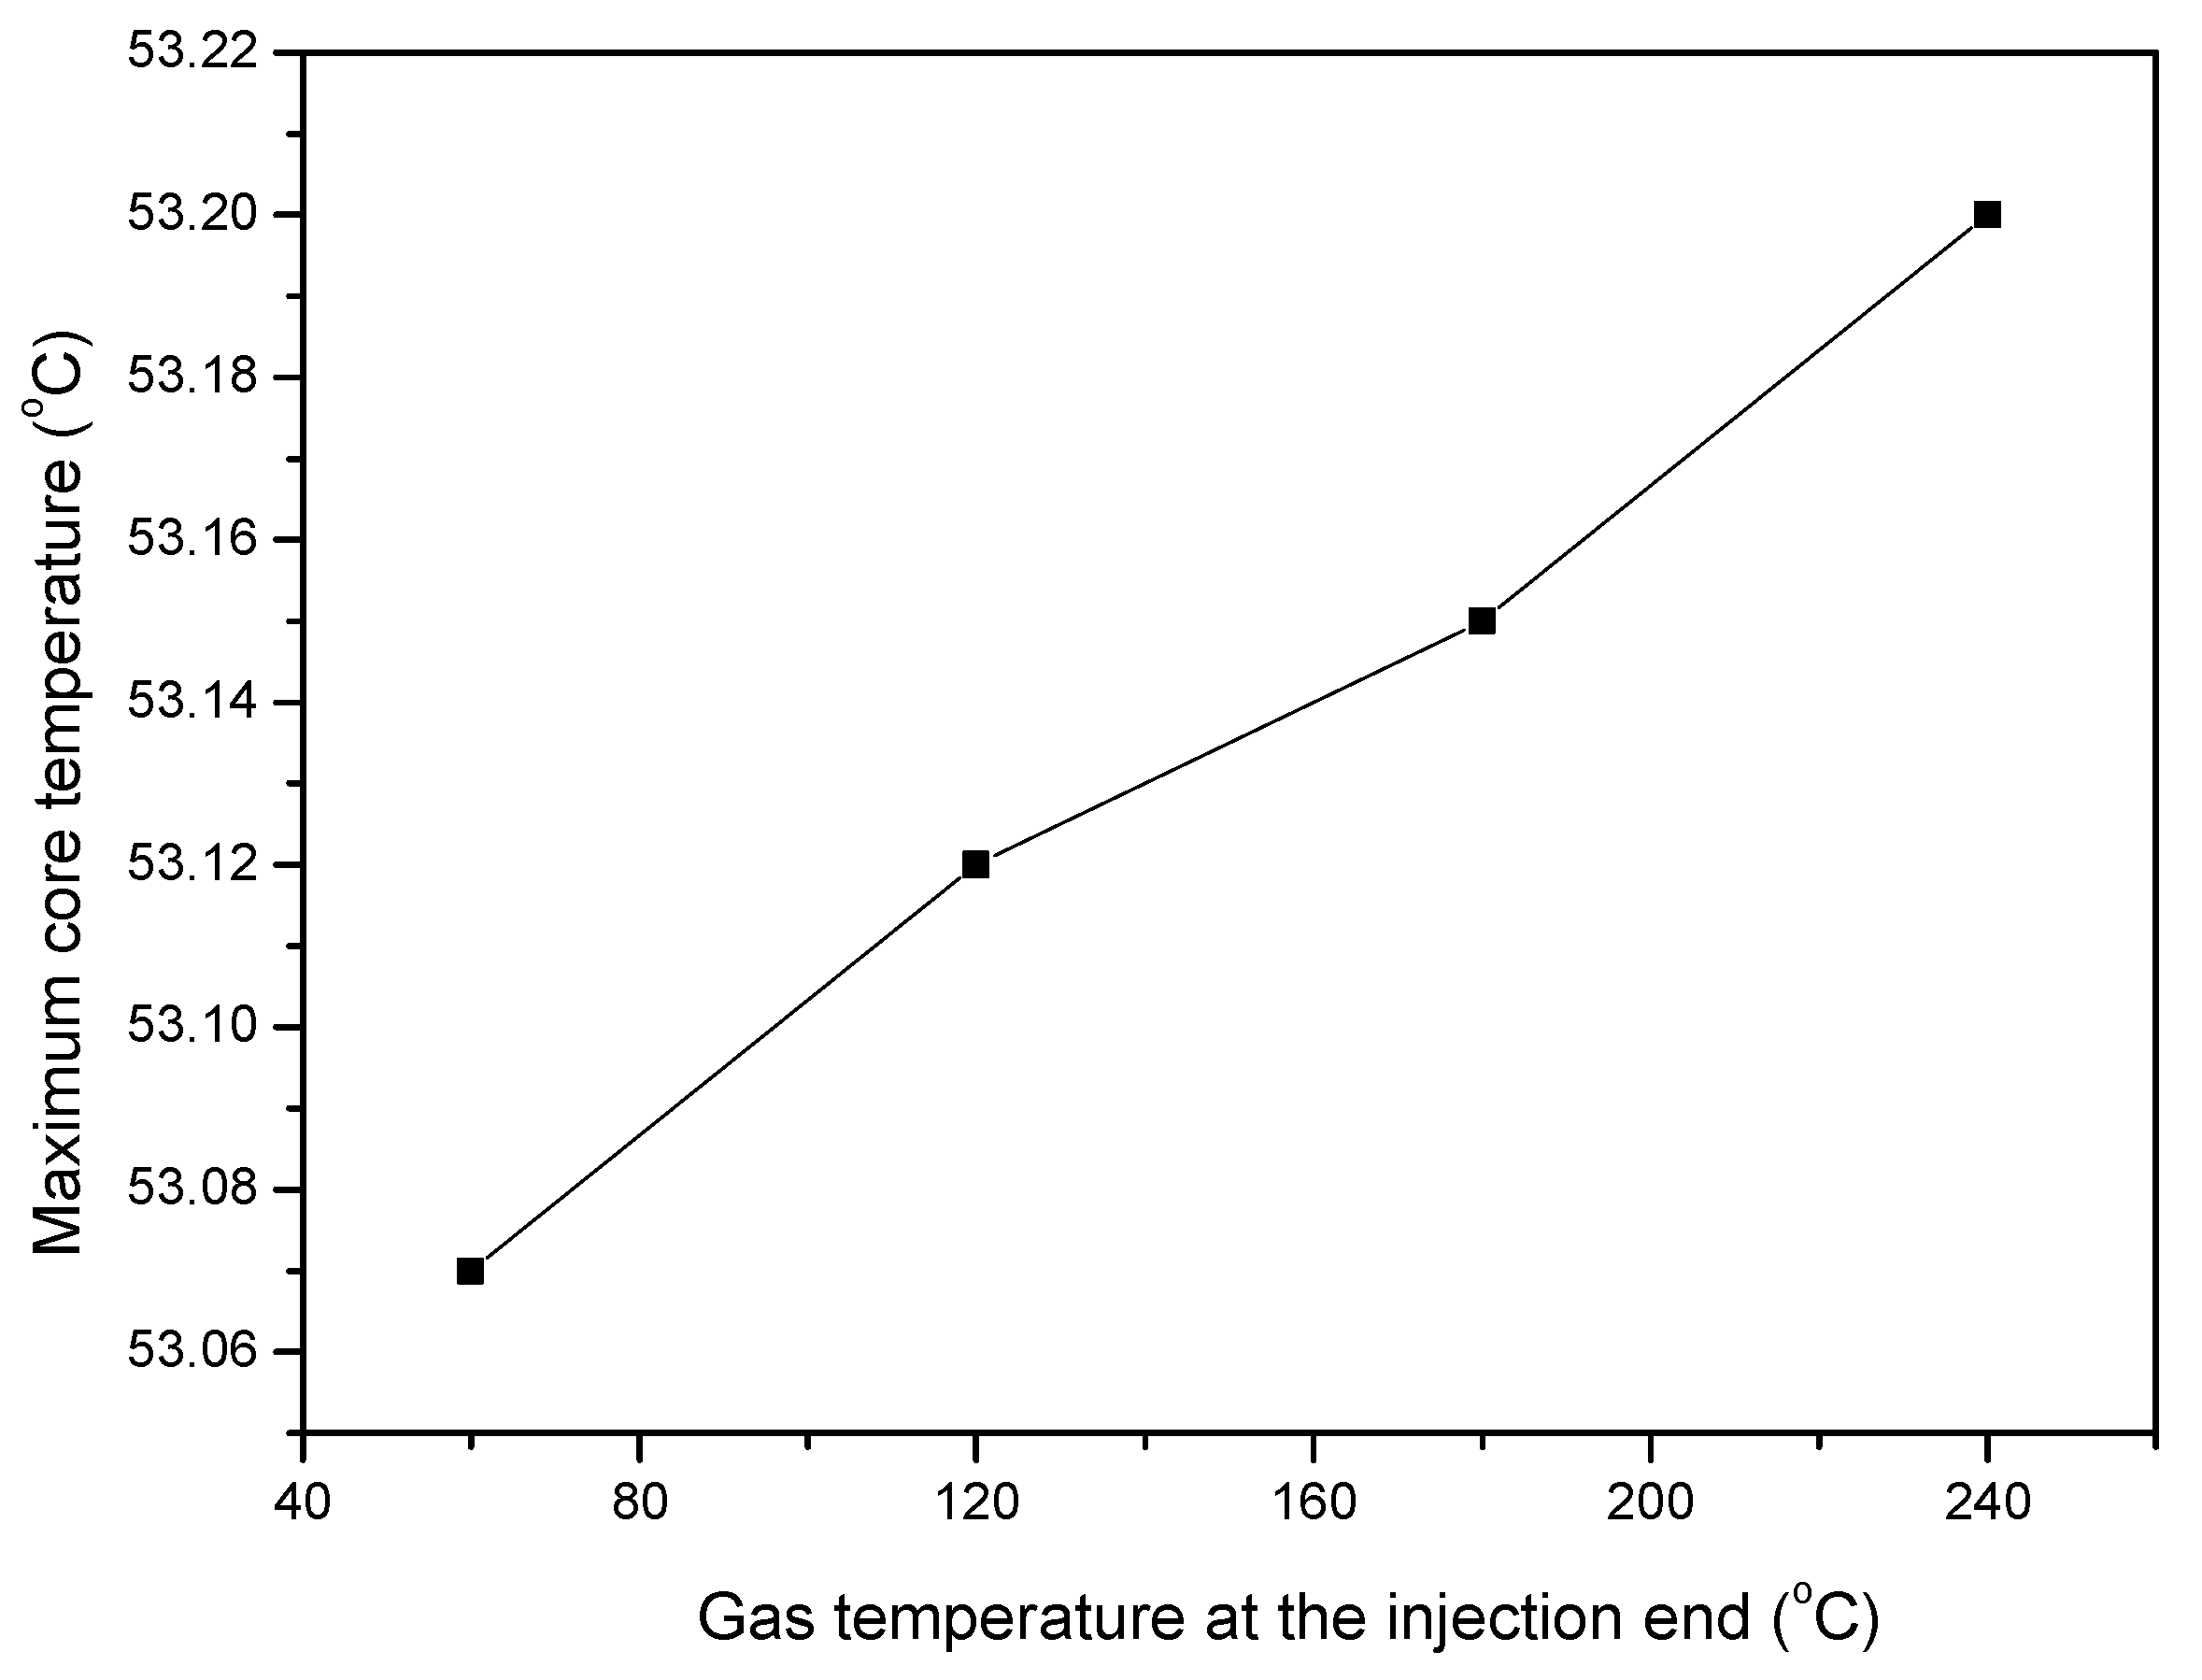
Figure 9 shows the maximum temperature in cores with different injection gas temperature. In Figure 9, when the injection temperature is 60 °C, the core temperature increases continuously, and the maximum value is 53.07 °C. When the injection temperature is 120 °C, the maximum core temperature is 53.12 °C. When the injection temperature is 180 °C, the maximum core temperature is 53.15 °C. When the injection temperature is 240 °C, the maximum core temperature is 53.2 °C.
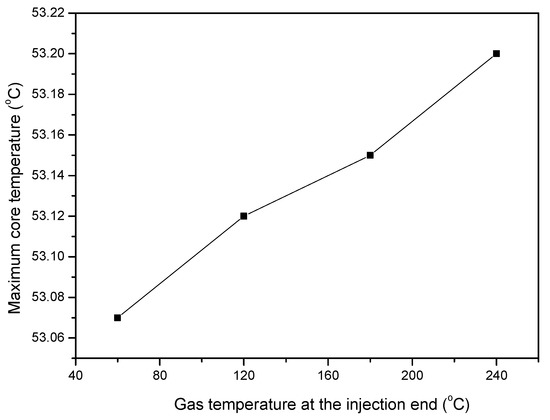
Figure 9.
Maximum temperature in cores with different injection gas temperatures.
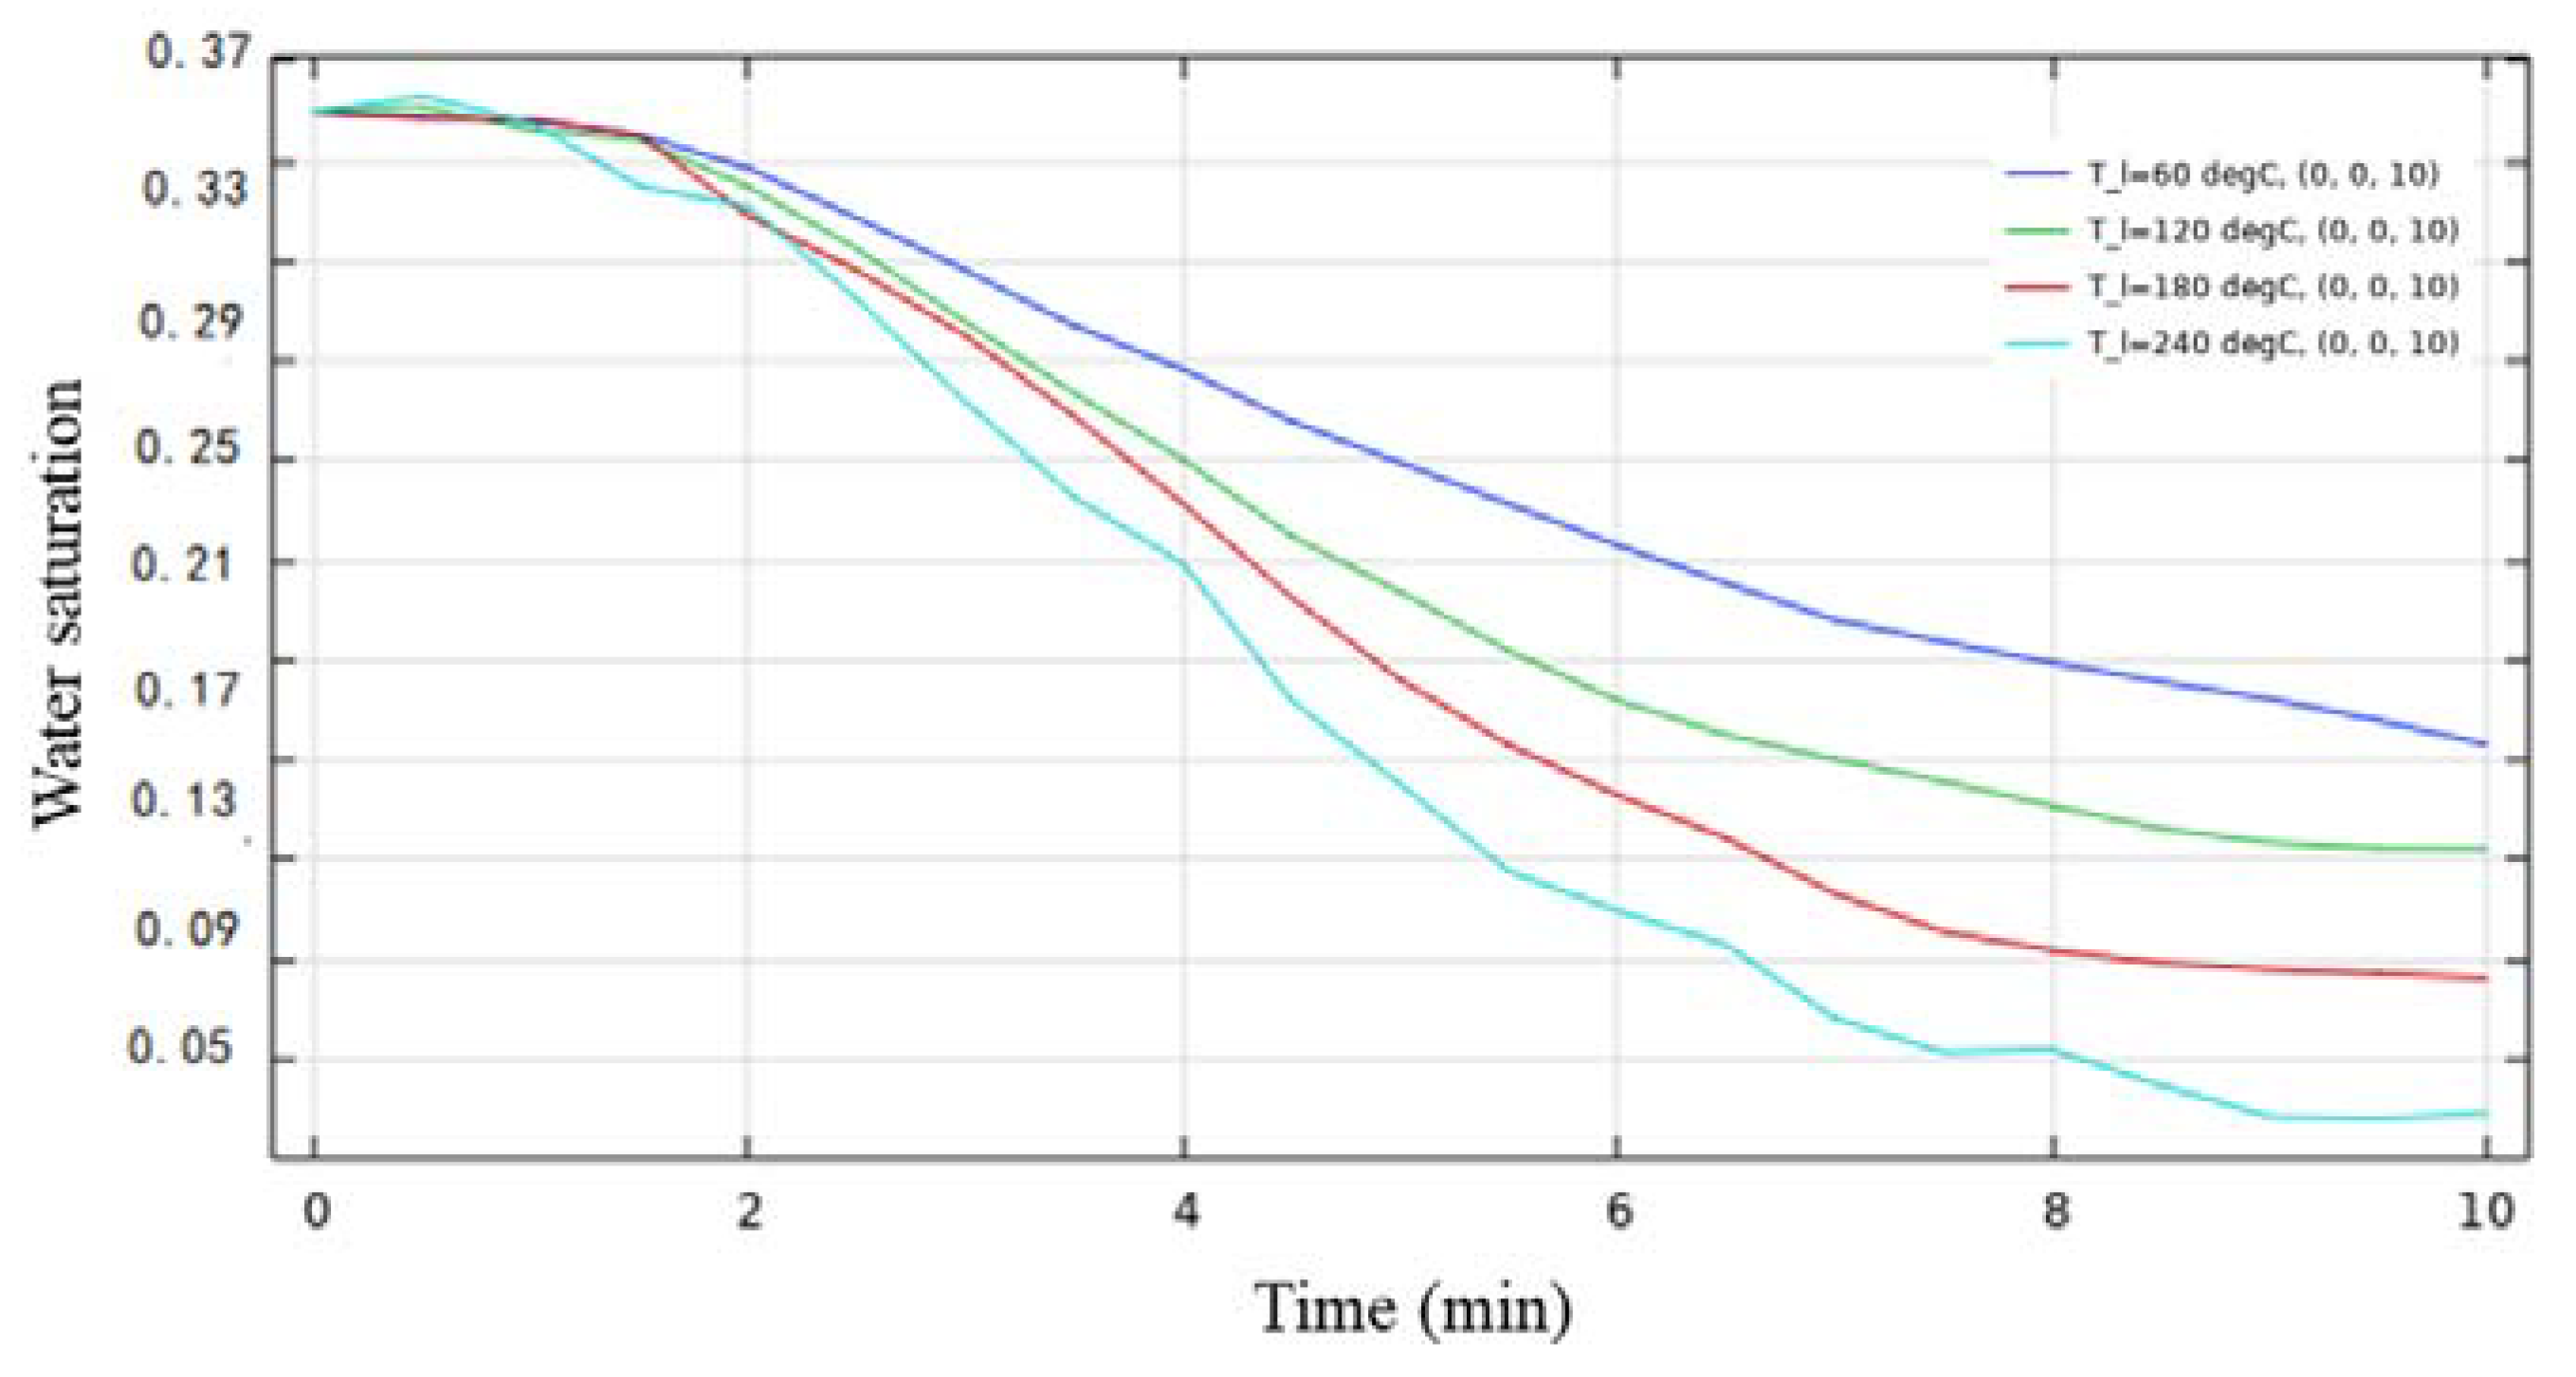
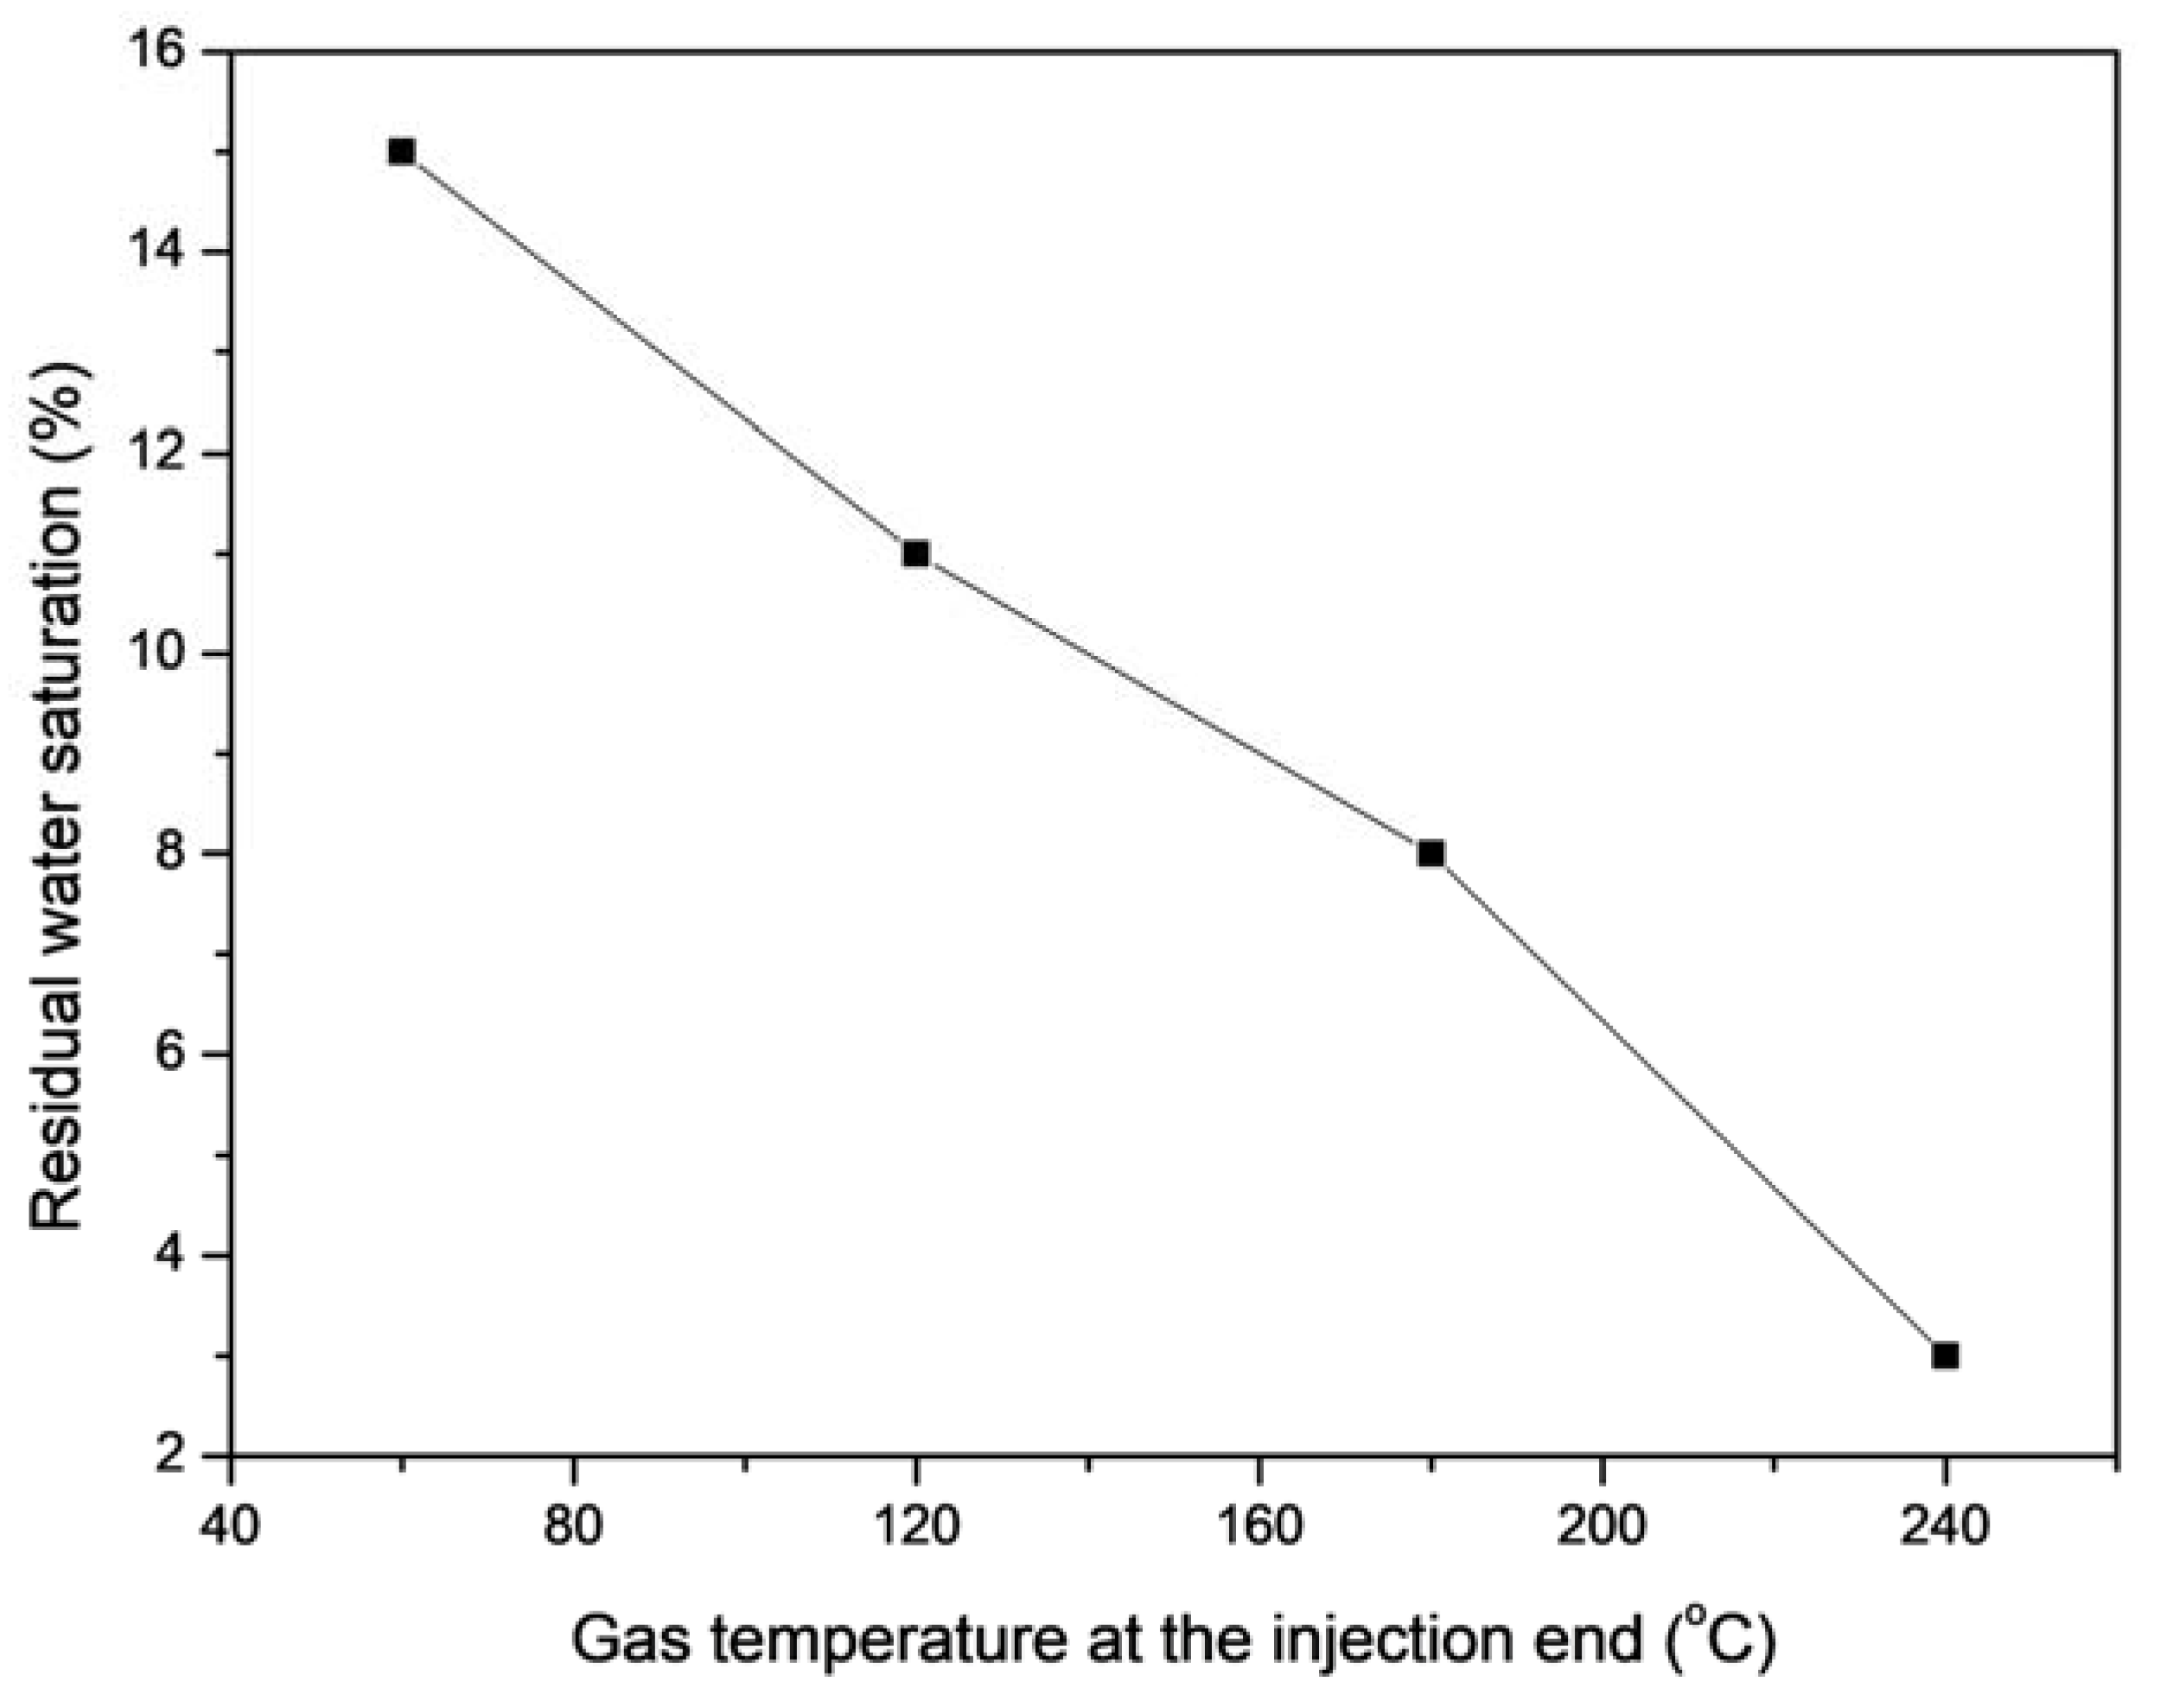
3.2. Residual Water Saturation
When the original water saturation of the core is 35%, carbon dioxide gas at 60 °C, 120 °C, 180 °C, and 240 °C is injected, and the water saturation content in the core changes with different cumulative injection times. As observed in Figure 10, with the increase in carbon dioxide injection times, the remaining water saturation in the core decreases gradually. When the cumulative injection time is 2 min, 4 min, 6 min, and 8 min, the distribution of core residual water saturation is as shown in the figure; thus the temperature injection of carbon dioxide directly affects the water cut of the core. When the injection temperature is 60 °C, the core’s residual water saturation decreases continuously, and the minimum value is 15%. When the injection temperature is 120 °C, the core’s residual water saturation decreases continuously, and the minimum value is 11%. When the injection temperature is 180 °C, the core’s residual water saturation decreases continuously, and the minimum value is 8%. When the injection temperature is 240 °C, the core’s residual water saturation decreases continuously, and the minimum value is 3%, which is shown in Figure 11.
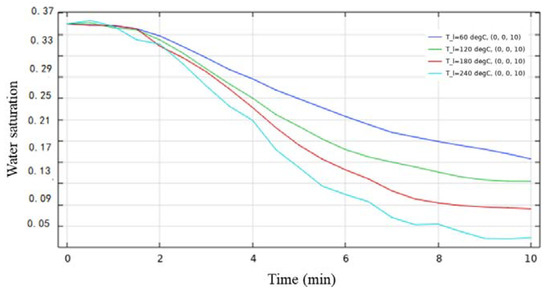
Figure 10.
Residual water saturation of cores at different temperatures.

Figure 11.
Relationship between residual water saturation with injection gas temperatures.
4. Conclusions
- (1)
- During the hot gas injection, with the increase of gas injection temperature, the recovery rate of core permeability increases. Compared with carbon dioxide, the effect of methane hydrolyzing water block is better. While with the increase of methane injection, the recovery rate of permeability increases, but its increasing trend slows down gradually.
- (2)
- The numerical simulation results for hot gas injection show that the temperature of carbon dioxide injection directly affects the core temperature, and the core temperature changes from the injection end, and the core temperature increases gradually.
- (3)
- With the injection of carbon dioxide, the residual water saturation of the core changes continuously, and remaining water saturation continuously decreases. It further illustrates the feasibility of drying by hot-gas injection.
Author Contributions
Data curation, Z.Y.; Funding acquisition, Z.Y. and C.G.; Investigation, Z.Y.; Methodology, Z.Y.; Writing—original draft, H.L.; Writing—review & editing, H.L. and C.G. All authors have read and agreed to the published version of the manuscript.
Funding
PetroChina Innovation Foundation: No. 2019D-5007-0205; National Natural Science Foundation of China: No. 51704265.
Institutional Review Board Statement
Not applicable.
Informed Consent Statement
Not applicable.
Data Availability Statement
The data can be obtained with reasonable request.
Acknowledgments
The authors acknowledge supports from PetroChina Innovation Foundation: No. 2019D-5007-0205; the National Natural Science Foundation of China: No. 51704265; and the Outstanding Talent Development Project of China University of Geosciences (CUG20170614).
Conflicts of Interest
The authors declare no conflict of interest.
References
- Jiang, Z.-X.; Li, Z.; Li, F.; Pang, X.-Q.; Yang, W.; Liu, L.-F.; Jiang, F.-J. Tight sandstone gas accumulation mechanism and development models. Pet. Sci. 2015, 12, 587–605. [Google Scholar] [CrossRef]
- Han, H.Y.; Wang, Z.Z.; Sun, X.X.; Wang, W.J. A New Method to Predict Favorable Gas-Rich Area in Tight Sandstone Gas Reservoir in Daniudi Area. Appl. Mech. Mater. 2013, 295, 3328–3332. [Google Scholar] [CrossRef]
- Huang, S.; Yu, C.; Gong, D.; Wu, W.; Liao, F. Stable Carbon Isotopic Characteristics of Alkane Gases in Tight Sandstone Gas Fields and the Gas Source in China. Energy Explor. Exploit. 2014, 32, 75–92. [Google Scholar] [CrossRef]
- Ma, X. “Extreme utilization” development theory of unconventional natural gas. Pet. Explor. Dev. 2021, 48, 381–394. [Google Scholar] [CrossRef]
- Siemek, J.; Nagy, S. Energy carriers use in the world: Natural gas-conventional and unconventional gas resources. Arch. Min. Sci. 2012, 57, 283–312. [Google Scholar]
- Lai, J.; Wang, G.; Wang, Z.; Chen, J.; Pang, X.; Wang, S.; Zhou, Z.; He, Z.; Qin, Z.; Fan, X. A review on pore structure characterization in tight sandstones. Earth-Sci. Rev. 2018, 177, 436–457. [Google Scholar] [CrossRef]
- Su, X.; Wang, Q.; Song, J.; Chen, P.; Yao, S.; Hong, J.; Zhou, F. Experimental study of water blocking damage on coal. J. Pet. Sci. Eng. 2017, 156, 654–661. [Google Scholar] [CrossRef]
- Bahrami, H.; Rezaee, R.; Clennell, B. Water blocking damage in hydraulically fractured tight sand gas reservoirs: An example from Perth Basin, Western Australia. J. Pet. Sci. Eng. 2012, 88, 100–106. [Google Scholar] [CrossRef]
- Mojarad, R.S.; Settari, A. Velocity-based Formation Damage Characterization Method for Produced Water Re-injection: Application on Masila Block Core Flood Tests. Pet. Sci. Technol. 2008, 26, 937–954. [Google Scholar] [CrossRef]
- Wang, J.; Zhou, F.-J. Cause analysis and solutions of water blocking damage in cracked/non-cracked tight sandstone gas reservoirs. Pet. Sci. 2020, 18, 219–233. [Google Scholar] [CrossRef]
- Holditch, S.A. Factors Affecting Water Blocking and Gas Flow from Hydraulically Fractured Gas Wells. J. Pet. Technol. 1979, 31, 1515–1524. [Google Scholar] [CrossRef]
- Bennion, D.B.; Thomas, F.B.; Ma, T. Formation Damage Processes Reducing Productivity of Low Permeability Gas Reservoirs. In Proceedings of the SPE Rocky Mountain Regional/Low-Permeability Reservoirs Symposium and Exhibition, Denver, CO, USA, 12–15 March 2000. [Google Scholar]
- Cimolai, M.; Gies, R.; Bennion, D.; Myers, D. Mitigating Horizontal Well Formation Damage in a Low-Permeability Conglomerate Gas Reservoir. In Proceedings of the SPE Gas Technology Symposium, Calgary, AB, Canada, 28–30 June 1993; p. SPE-26166-MS. [Google Scholar]
- Li, K.; Horne, R.N. Characterization of Spontaneous Water Imbibition into Gas-Saturated Rocks. In Proceedings of the SPE/AAPG Western Regional Meeting, Long Beach, CA, USA, 19–22 June 2001; pp. 375–384. [Google Scholar]
- Mahadevan, J.; Sharma, M.M.; Yortsos, Y.C. Evaporative cleanup of water blocks in gas wells. SPE J. 2007, 12, 209–216. [Google Scholar] [CrossRef]
- Abass, H.; Ortiz, I.; Khan, M.; Beresky, J.; Sierra, L. Understanding Stress Dependant Permeability of Matrix, Natural Fractures, and Hydraulic Fractures in Carbonate Formations. In Proceedings of the SPE Saudi Arabia Section Technical Symposium, Dhahran, Saudi Arabia, 7–8 May 2007; p. SPE-110973-MS. [Google Scholar]
- LLe, D.H.; Hoang, H.N.; Mahadevan, J. Gas Recovery from Tight Sands: Impact of Capillarity. SPE J. 2012, 17, 981–991. [Google Scholar] [CrossRef]
- Tian, J.; Kang, Y.; Luo, P.; You, L.; Zhang, D. A new method of water phase trapping damage evaluation on tight oil reservoirs. J. Pet. Sci. Eng. 2018, 172, 32–39. [Google Scholar] [CrossRef]
- You, L.; Kang, Y. Prediction of Water Phase Trapping Damage in Tight Gas Reservoirs. Flow in Porous Media-From Phenomena to Engineering and Beyond. In Proceedings of the International Forum on Porous Flow and Applications, Wuhan, China, 24–26 April 2009; pp. 568–573. [Google Scholar]
- Zhang, L.; Zhou, F.; Zhang, S.; Li, Z.; Wang, J.; Wang, Y. Evaluation of permeability damage caused by drilling and fracturing fluids in tight low permeability sandstone reservoirs. J. Pet. Sci. Eng. 2019, 175, 1122–1135. [Google Scholar]
- Davis, B.; Wood, W. Maximizing Economic Return by Minimizing or Preventing Aqueous Phase Trapping During Completion and Stimulation Operations. In Proceedings of the SPE Annual Technical Conference and Exhibition, Houston, TX, USA, 26–29 September 2004; p. SPE-90170-MS. [Google Scholar]
- Golman, B.; Takigawa, T.; Shinohara, K.; Ohzeki, K. Kinetics of liquid penetration into bottom edge of cast tape. Colloids Surf. A Physicochem. Eng. Asp. 2005, 254, 9–16. [Google Scholar] [CrossRef]
- Mirzaei-Paiaman, A.; Dalvand, K.; Kohshour, I.O.; Masihi, M.; Moghadasi, J. A Study on the Key Influential Factors of a Gas Reservoir’s Potential for Aqueous Phase Trapping. Energy Sources Part A Recovery Util. Environ. Eff. 2012, 34, 1541–1549. [Google Scholar] [CrossRef]
- Akin, S.; Schembre, J.; Bhat, S.; Kovscek, A. Spontaneous imbibition characteristics of diatomite. J. Pet. Sci. Eng. 2000, 25, 149–165. [Google Scholar] [CrossRef]
- Somerton, W.; Mehta, M.; Dean, G. Thermal Alteration of Sandstones. J. Pet. Technol. 1965, 05, 589–593. [Google Scholar] [CrossRef]
- Murphy, H. Thermal stress cracking and the enhancement of heat extraction from fractured geothermal reservoirs. U.S. Dep. Energy Off. Sci. Tech. Inf. 1978, 7, 22–29. [Google Scholar]
- Homandetienne, F.; Houpert, R. Thermally induced microcracking in granites-Characterization and analysis. Int. J. Rock Mech. Min. Sci. Geomech. Abstr. 1989, 26, 125–134. [Google Scholar] [CrossRef]
- Noh, M.H.; Firoozabadi, A. Wettability Alteration in Gas-Condensate Reservoirs to Mitigate Well Deliverability Loss by Water Blocking. SPE Reserv. Evaluation Eng. 2008, 11, 676–685. [Google Scholar] [CrossRef]
- Xiong, Y.; Mo, J.; Li, P.; Jiang, J.; Zhang, L. Difference analysis and evaluation of irreducible water drying reaction and drying effect in tight reservoir. Chem. Bull. 2018, 7, 646–652. [Google Scholar]
- Zhao, Y.; Liu, X.; Zhang, L.; Tang, H.; Xiong, Y.; Guo, J.; Shan, B. Gas-water flow law and reservoir desiccation mechanism of tight sandstone gas reservoir. Nat. Gas Ind. 2020, 9, 70–79. [Google Scholar]

Publisher’s Note: MDPI stays neutral with regard to jurisdictional claims in published maps and institutional affiliations. |
© 2022 by the authors. Licensee MDPI, Basel, Switzerland. This article is an open access article distributed under the terms and conditions of the Creative Commons Attribution (CC BY) license (https://creativecommons.org/licenses/by/4.0/).