
Energy Storage Solutions for Offshore Applications

 ,
,
Abstract
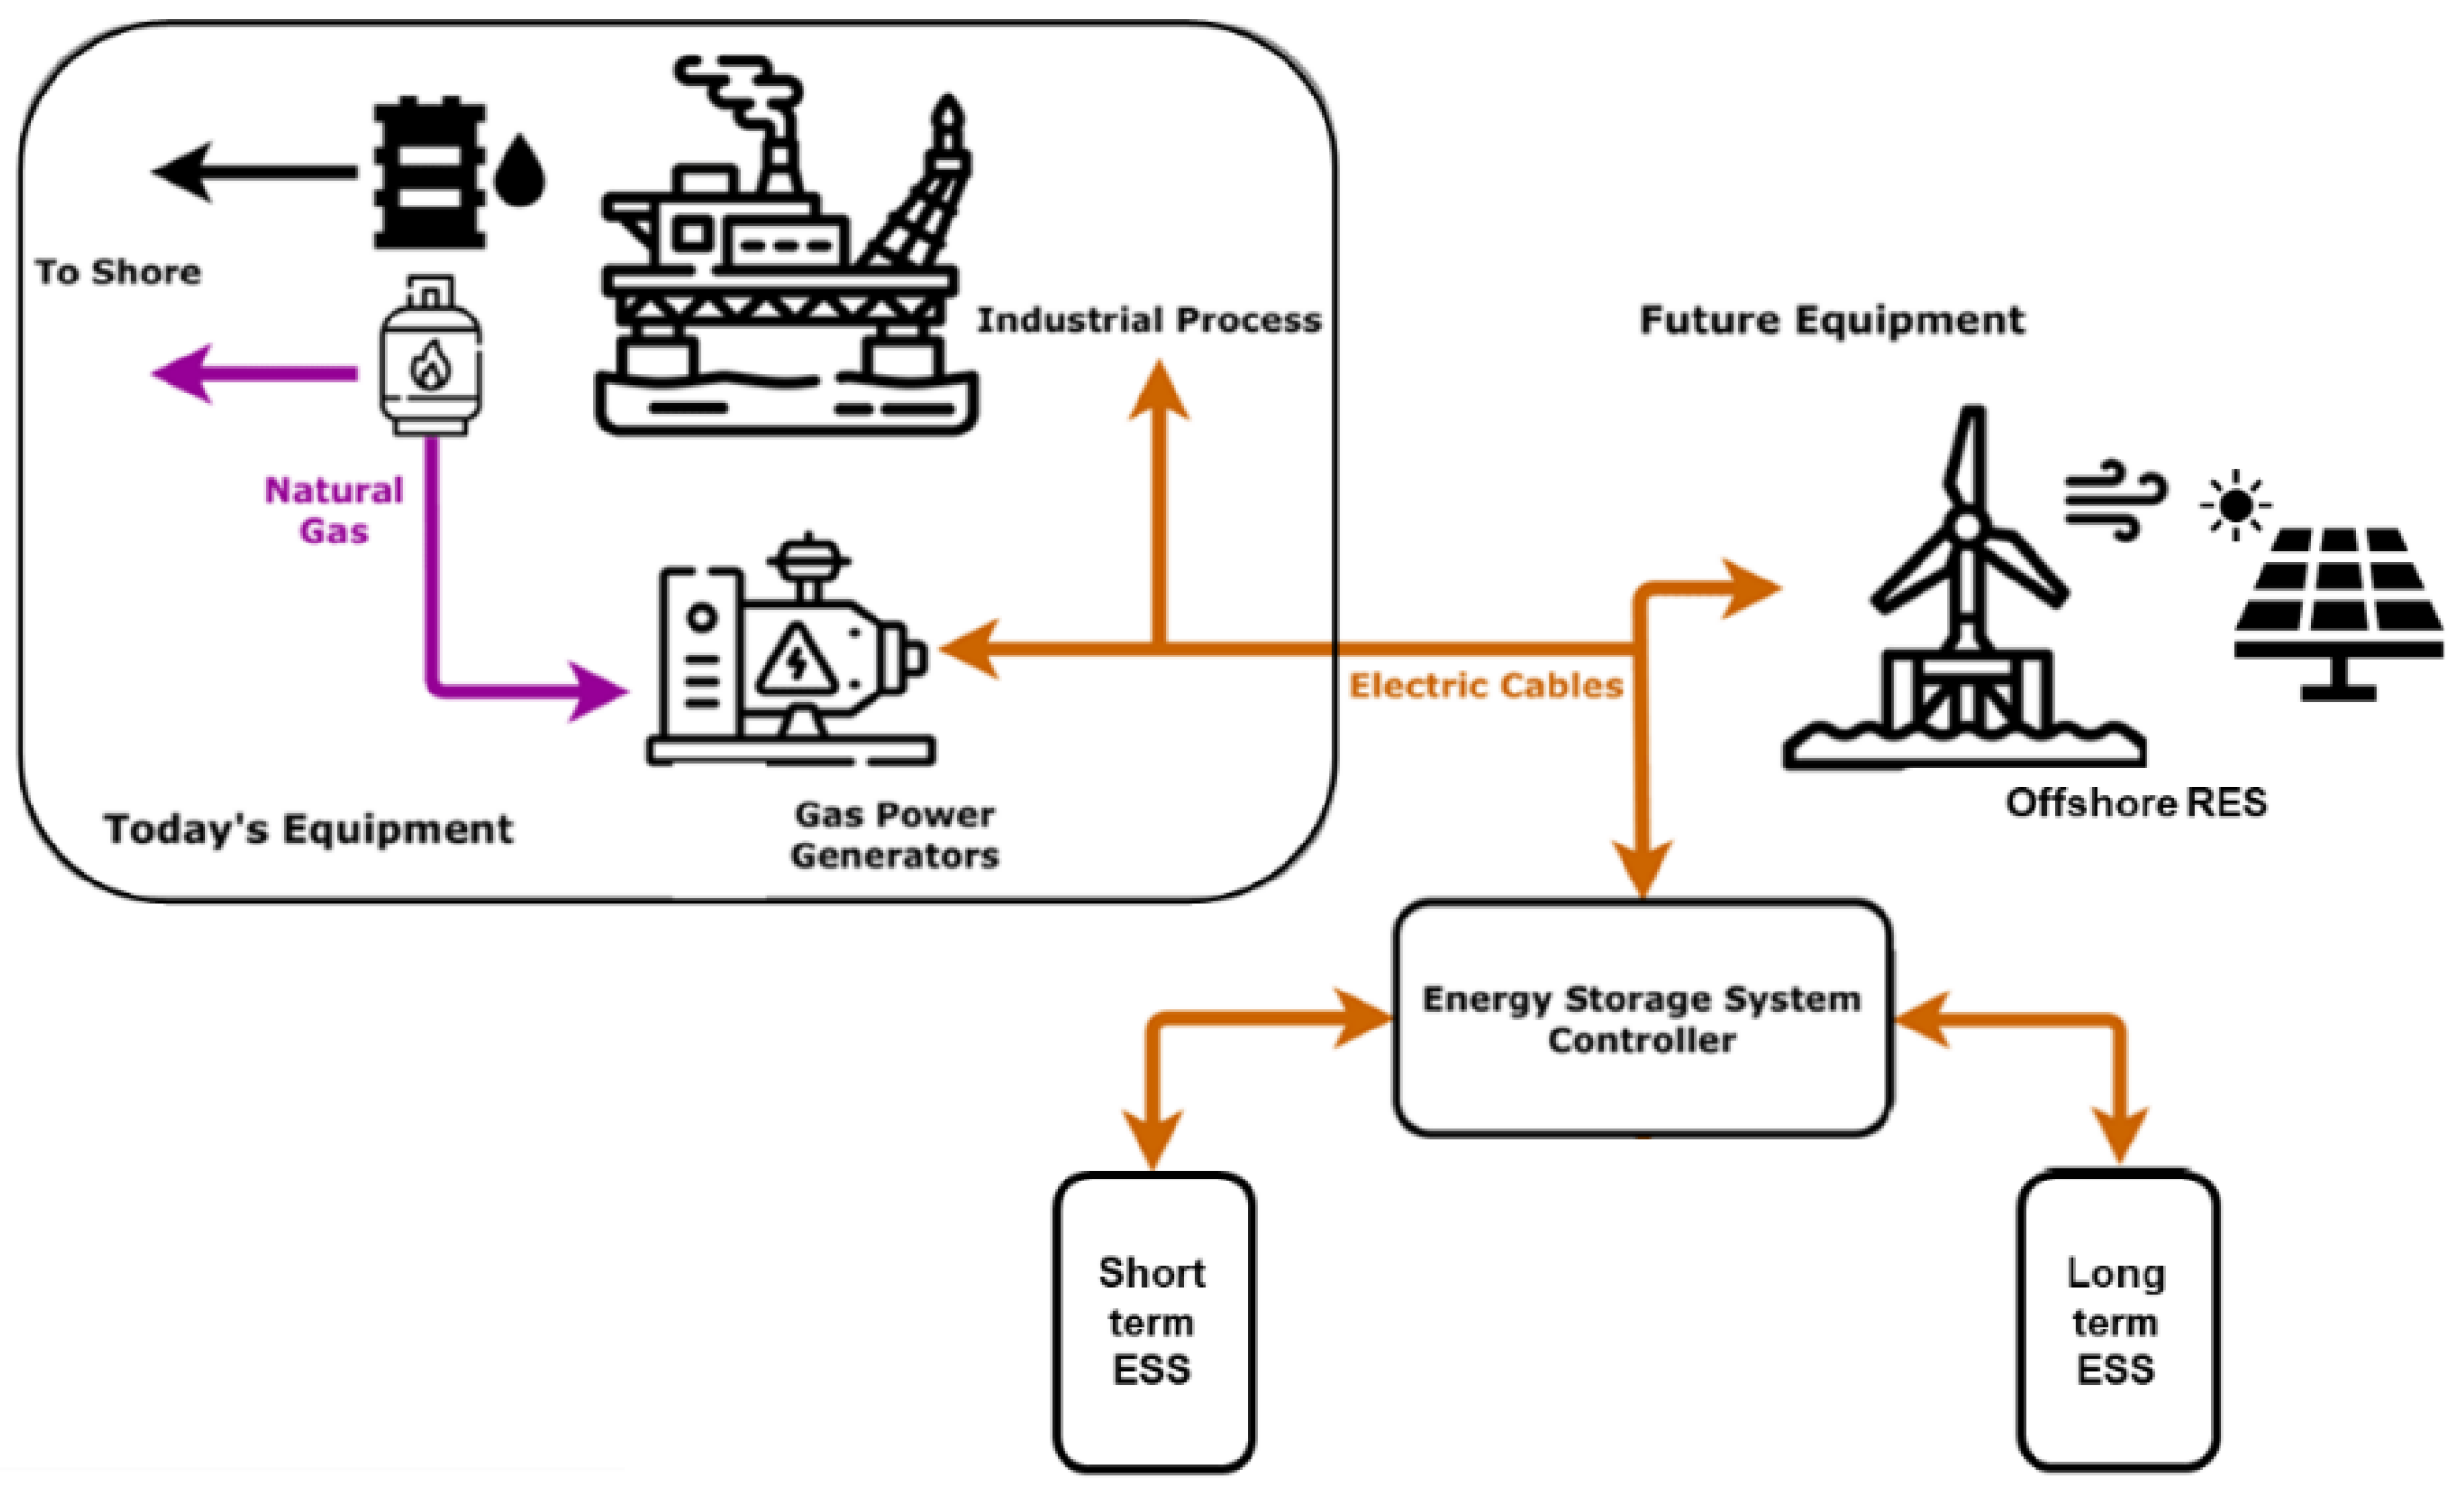
:1. Introduction
2. Methods
2.1. Offshore Energy Storage Requirements
- The maximum power required per platform is often in the order of tens of MWs (30–60 MW) rather than hundreds of MWs of the conventional land-based storage systems.
- Space and weight constraints onboard are challenging.
- Offshore installations and their load flexibility tend to be use-case specific and sometimes more challenging to predict; hence, it is difficult to identify a one-fits-all approach. Such demanding predictability is due to the large variety of offshore assets (e.g., production units typically have a lower degree of flexibility than drilling assets) and the lower margin for load aggregation.
- Offshore assets must include features such as black-start, continuous voltage support and frequency regulation.
- Due to the high operational costs, offshore energy storage technologies need to be sturdier and less maintenance intensive than their onshore counterparts.
- Seasonal storage is necessary if the renewable energy supply does not match yearly demand.
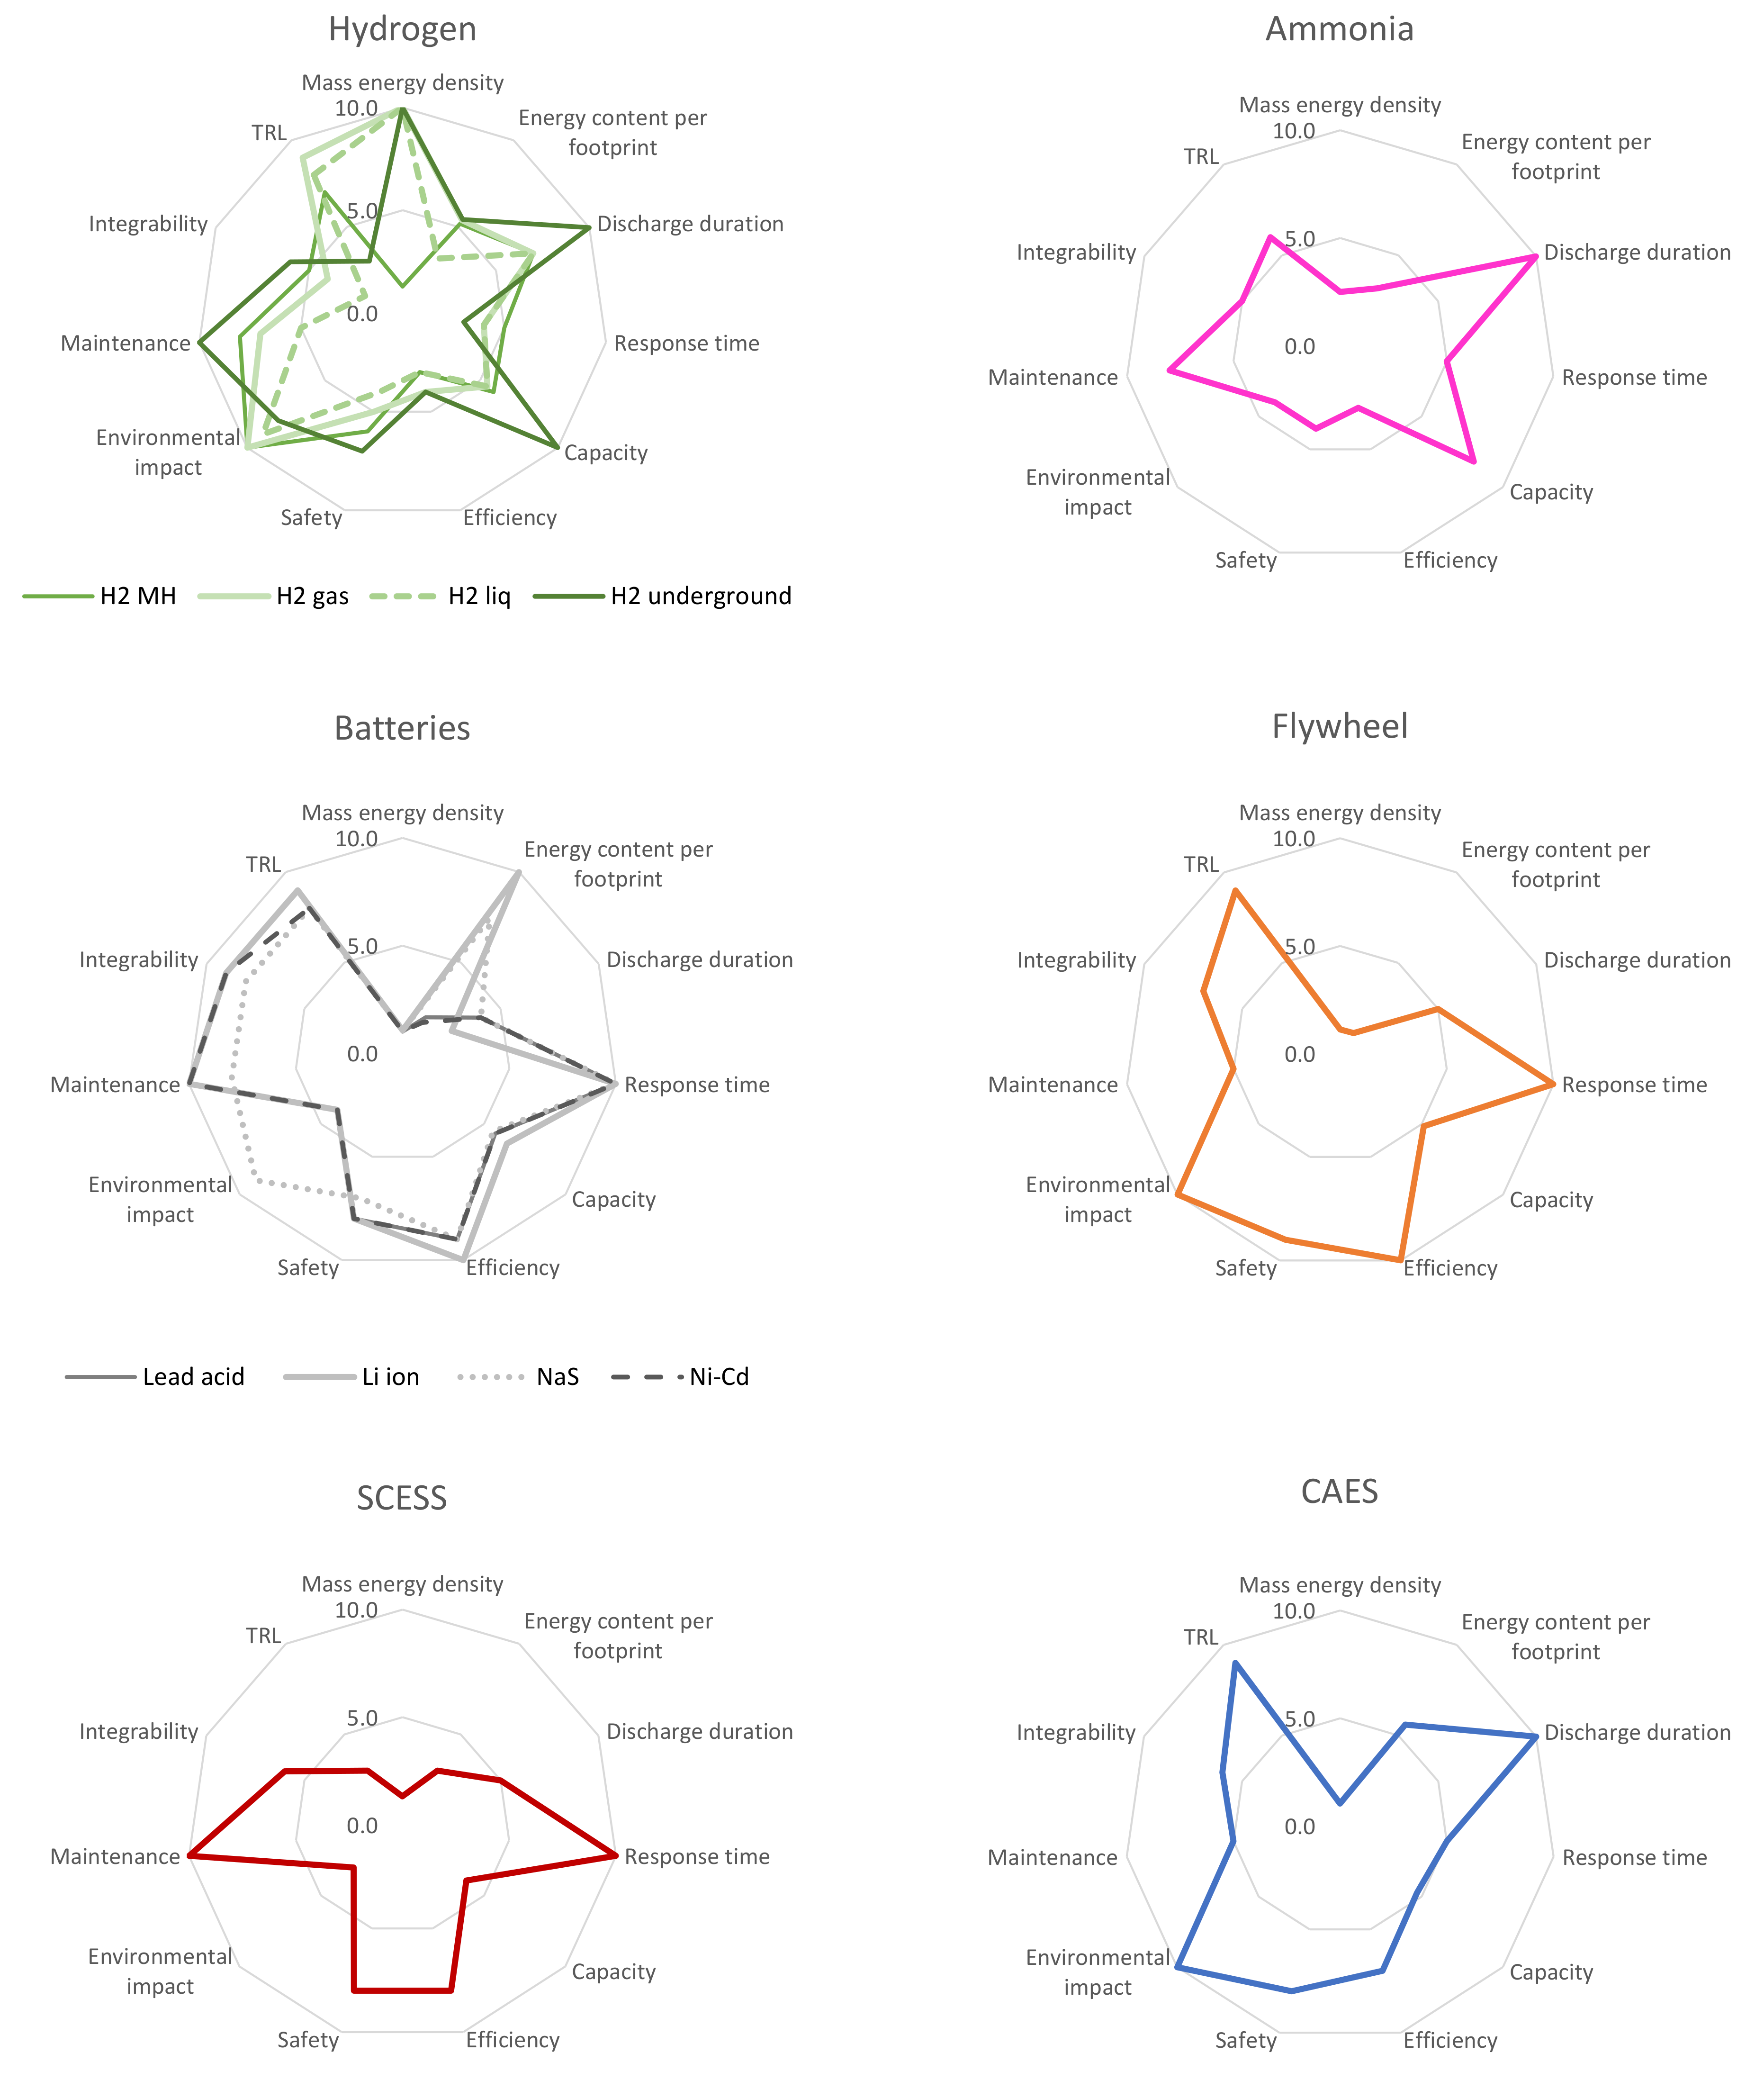
2.2. Definition of the Key Performance Indicators (KPI)
2.3. Definition of Energy Storage Technologies
2.4. Analysis of Potential Use of Storage Technologies for Various Operation Scenarios
3. Energy Storage Solutions
3.1. Batteries
3.1.1. Lead–Acid Batteries
3.1.2. Li-Ion Batteries

3.1.3. Ni–Cd Batteries
3.1.4. NaS Batteries
3.2. Supercapacitors (SCESS)
3.3. Flywheels Energy Storage (FEES)
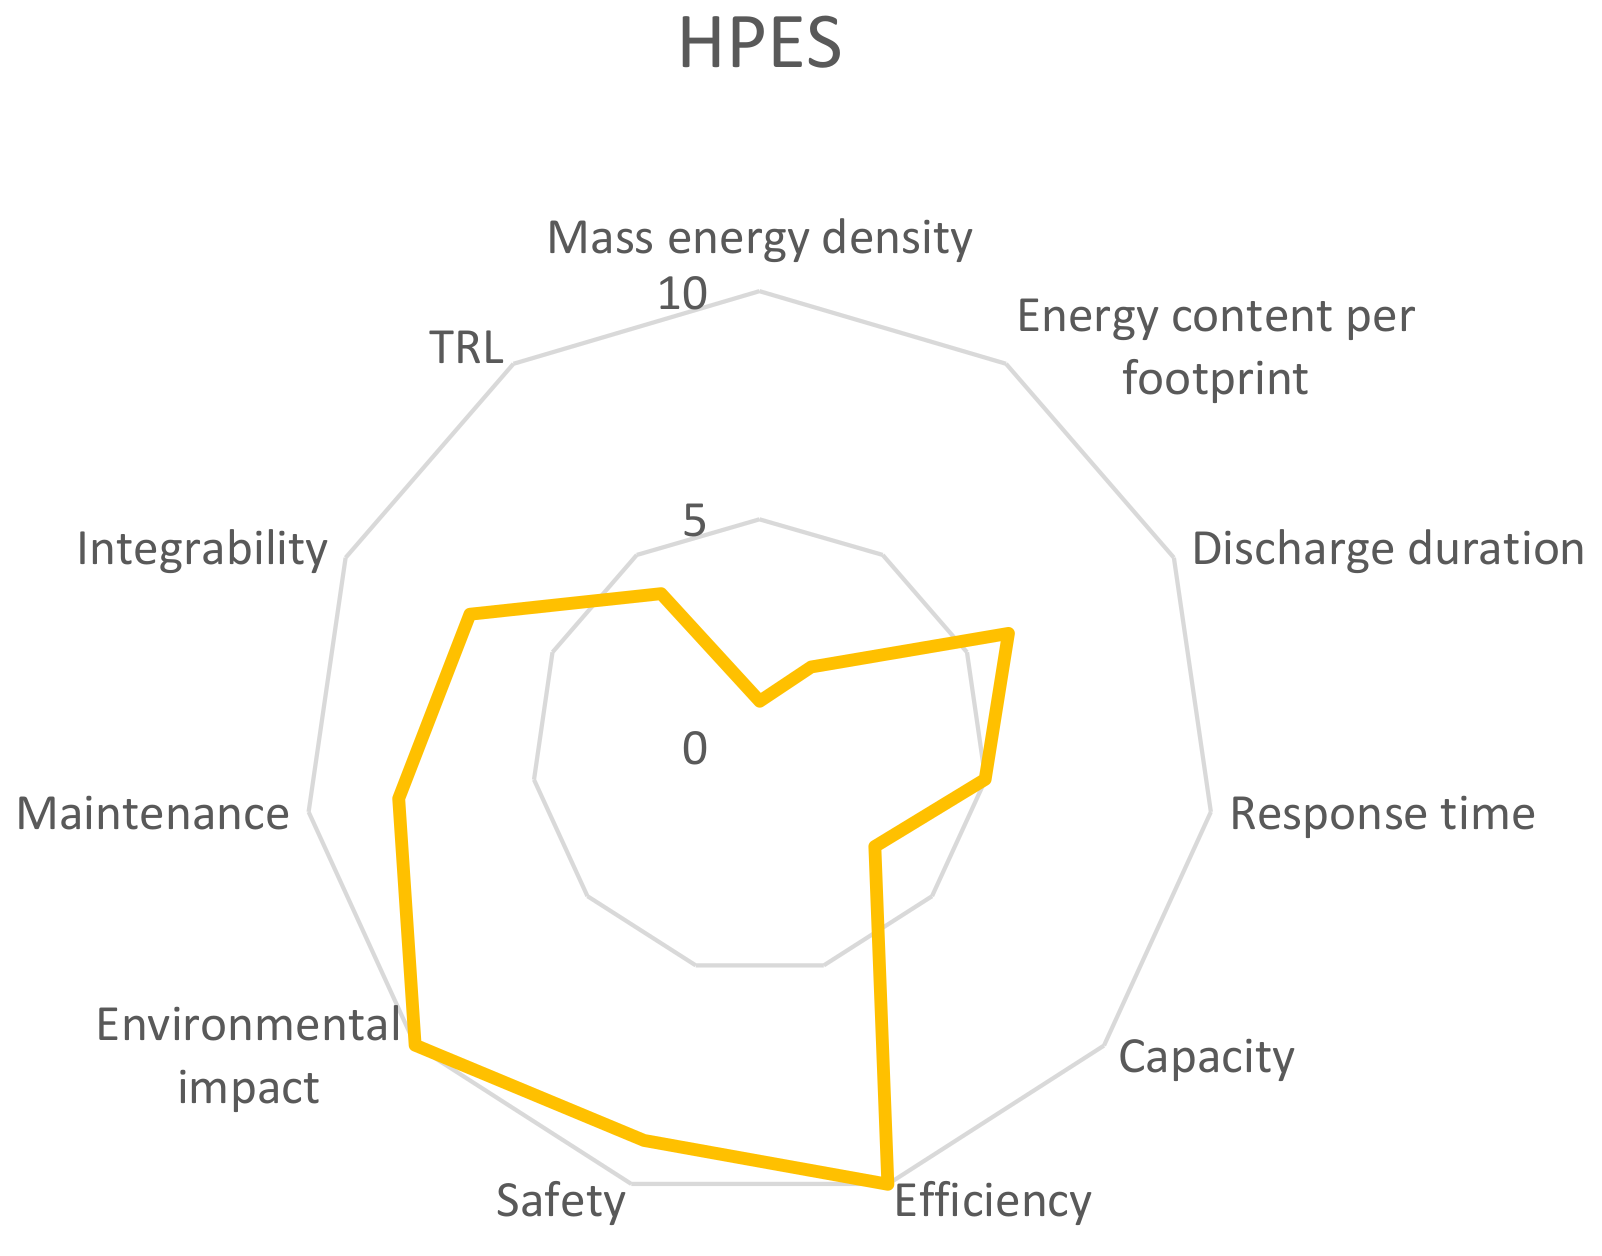
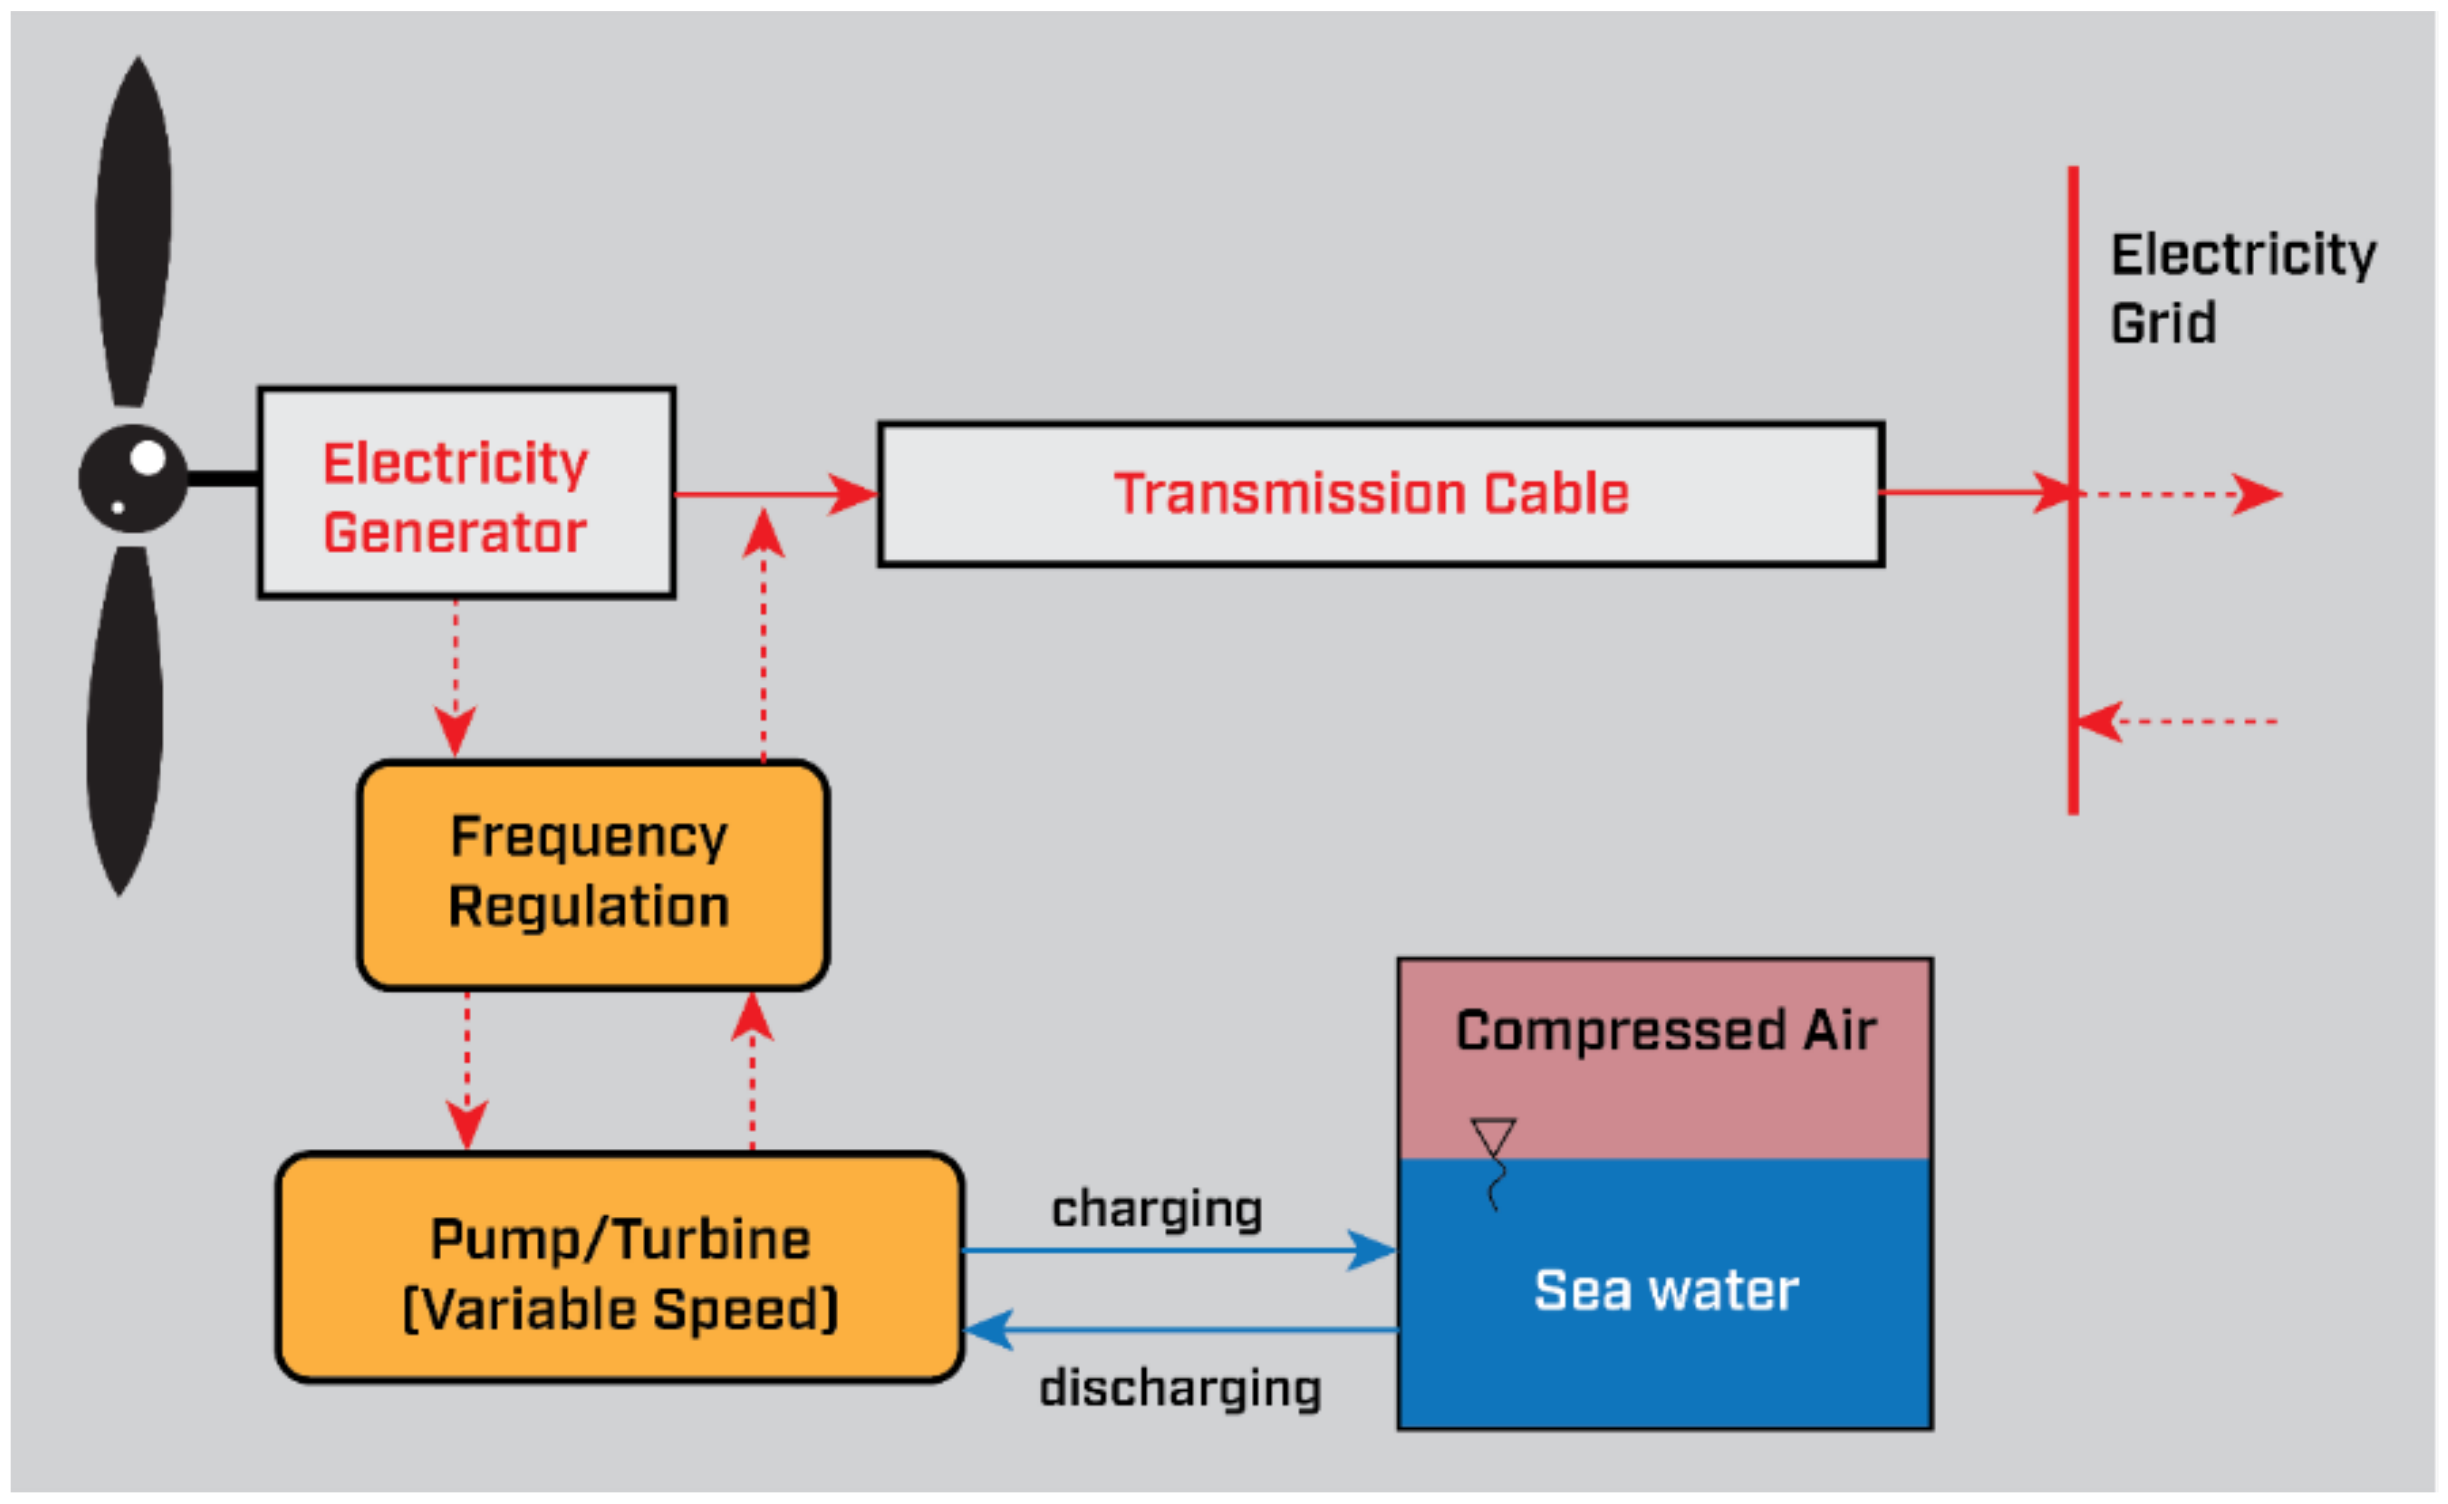
3.4. Hydro-Pneumatic Energy Storage (HPES)
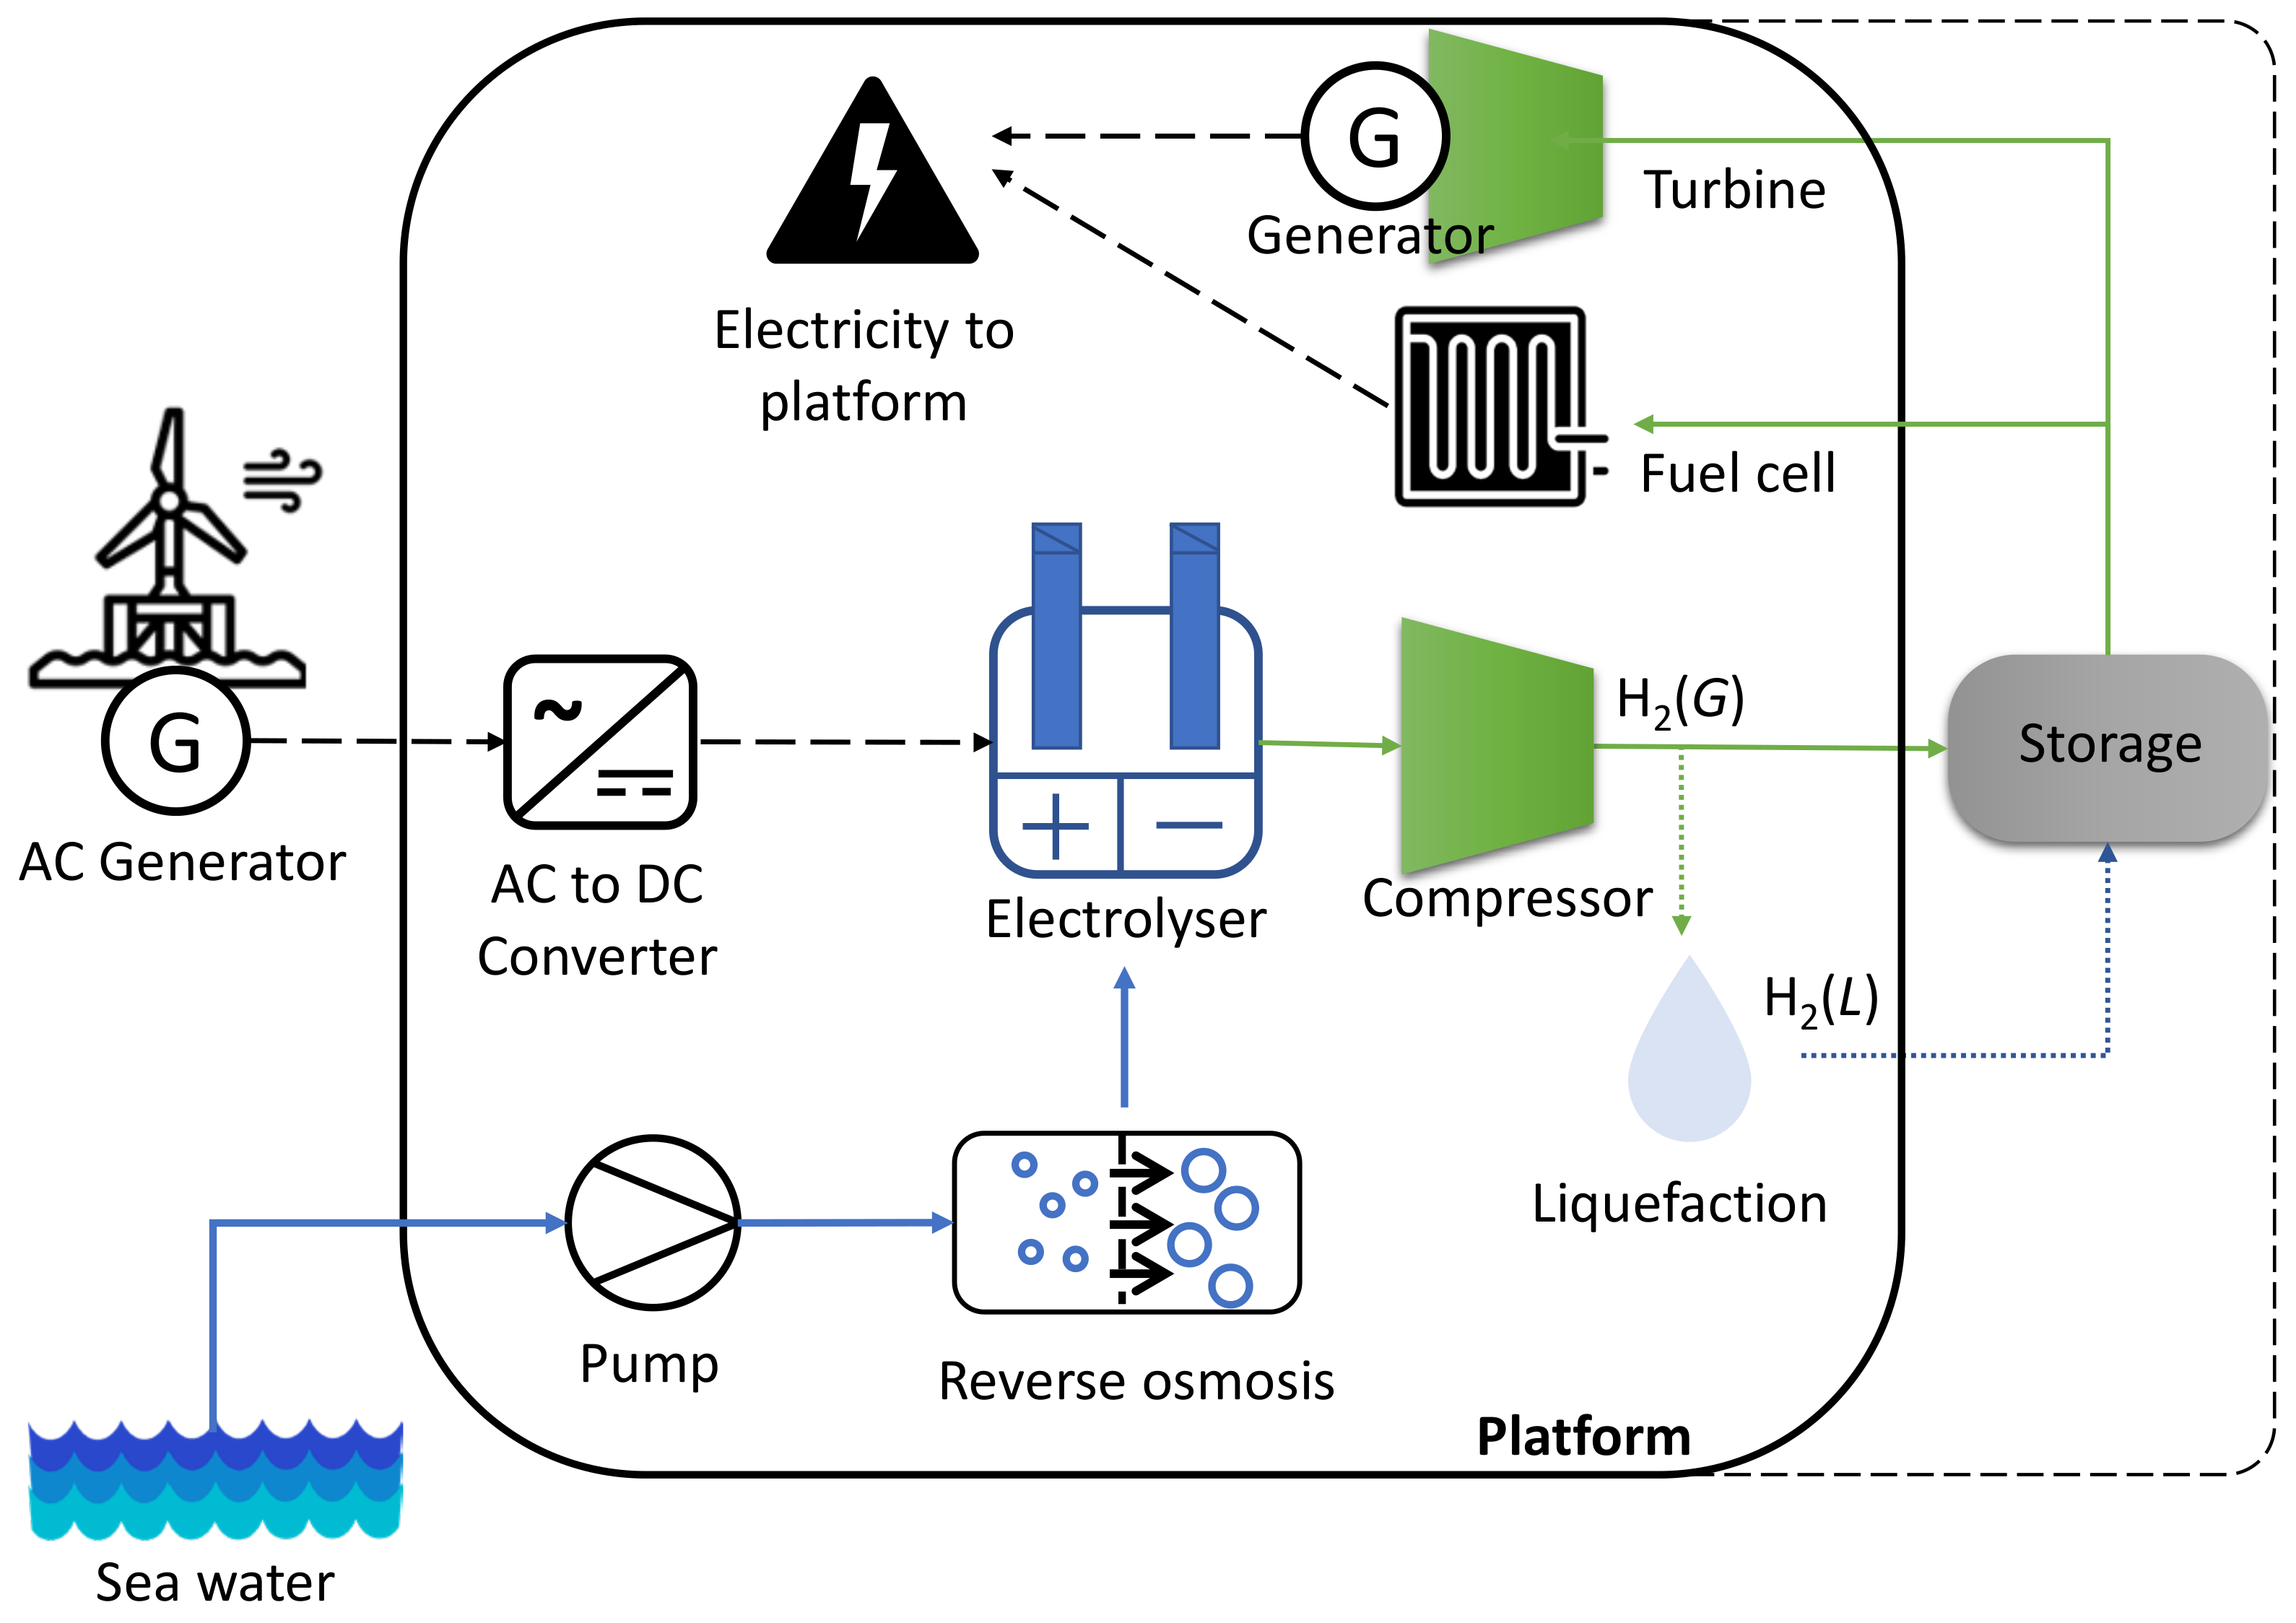
3.5. Hydrogen
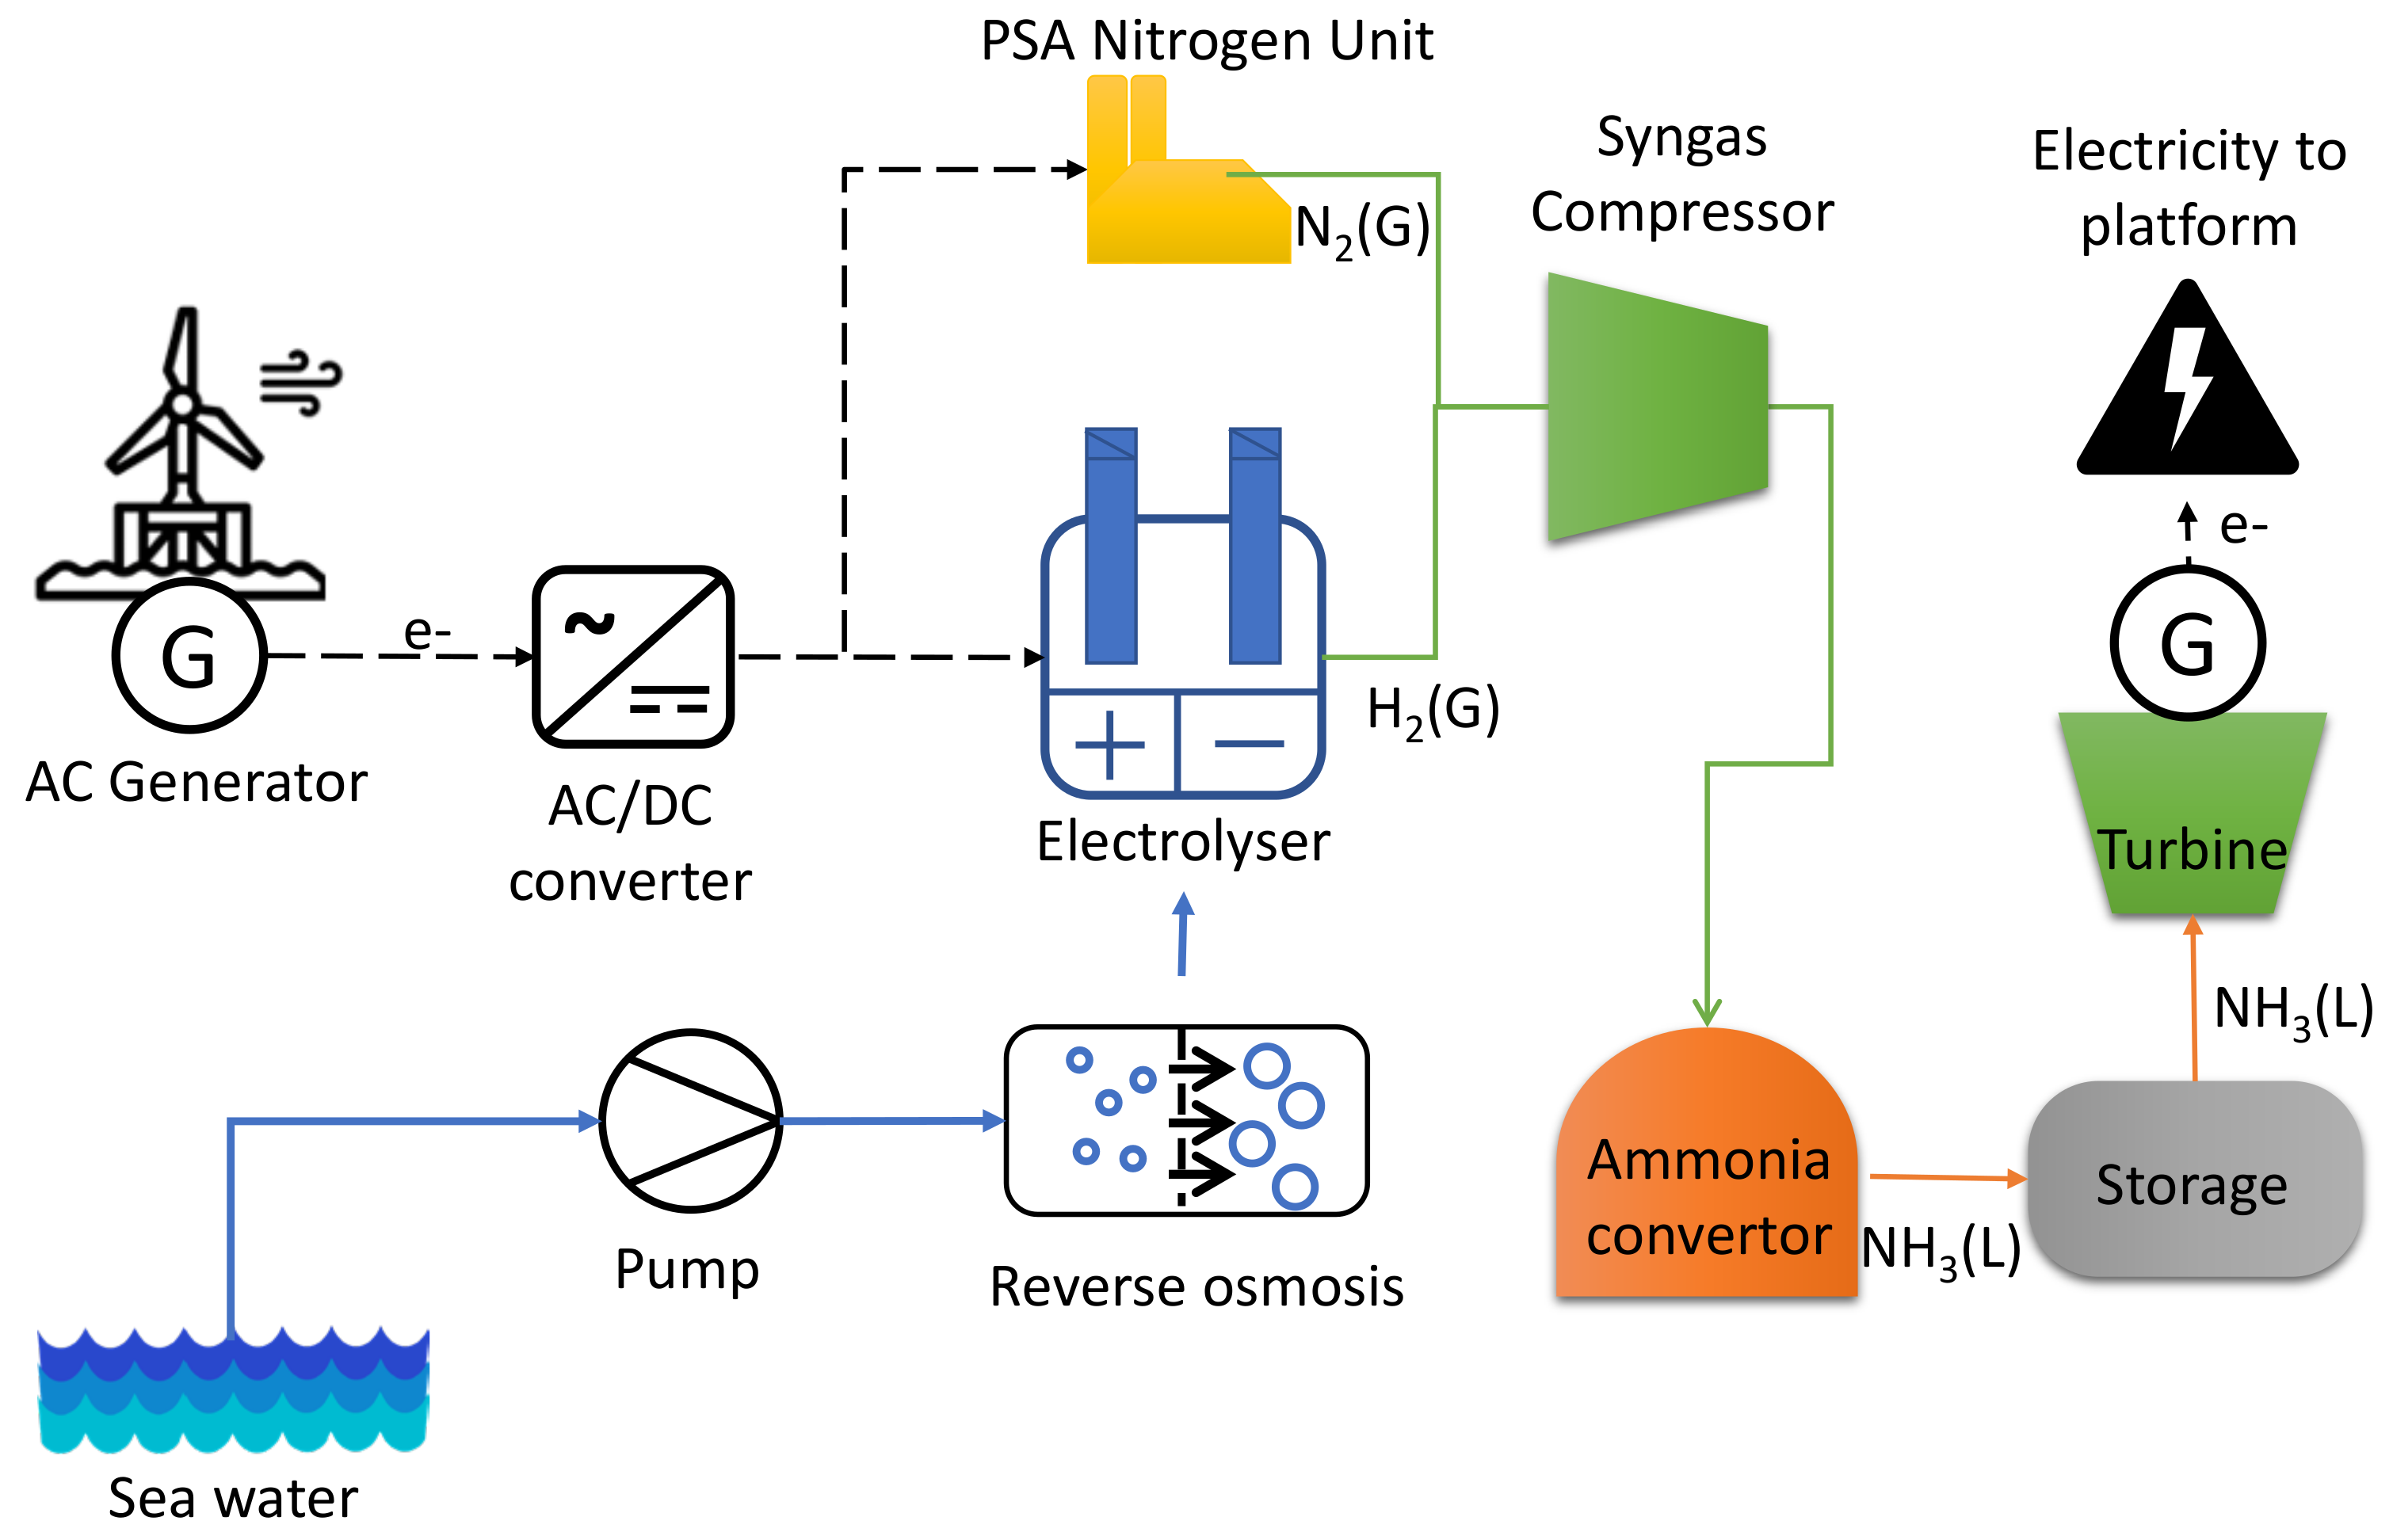
3.6. Ammonia

| Carrier | Temperature | Pressure |
|---|---|---|
| Hydrogen | Gas: ambient temperature Liquid: −252 °C | Gas: 350–700 barg Liquid: ambient pressure |
| Ammonia [57] | Refrigerated: −33 °C to −50 °C Semi-refrigerated: −10 °C Pressurised: <45 °C | Refrigerated: ambient Semi-refrigerated: 4–8 barg Pressurised: 17–18 barg |
3.7. Compressed Air Energy Storage (CAES)
4. Analysis
4.1. Scenario A (40% Powered by Renewable Energy)
- Energy content per footprint and maintenance are highly relevant, as they reflect the use of the technologies in challenging environments, such as offshore facilities.
- Discharge duration and response time are less relevant for Scenario A, where only 40% penetration is foreseen. Hence, gas turbines will support the energy system if high discharge time and low response time are needed.
- Given the partial penetration rate, limited to 40%, the capacity is seemingly less relevant than other performance indicators.
- Technology readiness and integrability are essential for the viability of Scenario A, which lacks the time for significant technology advancements and scale optimisation.
- Safety and environmental impact were highly valued, in agreement with the interest of the consulted stakeholders as per industrial workshops undertaken in the context of the OFFLEX project [79].
4.2. Scenario B (100% Powered by Renewable Energy)
- Safety and environmental impact are very relevant to focusing on sustainable technologies.
- The discharge duration is of great relevance, as it reflects the feasibility of long-term storage (seasonal).
- Without the use of turbines, the response time becomes highly relevant in the present scenario.
- Capacity is of the utmost importance in Scenario B, as the totality of the energy needs is to be covered by the energy stored.
- Technology readiness and integrability are less relevant than in Scenario A. The time gap between both scenarios is assumed to provide sufficient room for technology advancements and scale optimisation.

5. Conclusions
Author Contributions
Funding
Institutional Review Board Statement
Informed Consent Statement
Data Availability Statement
Acknowledgments
Conflicts of Interest
Appendix A. Multiple Binary Decision Method
- Each KPI is compared to one another based on the specificity of the scenario, that is, (A) 40% renewable energy by 2030 and (B) 100% renewable by 2050. As a result, two matrices, and hence, KPIs’ ranks, will be obtained, one for each scenario.
- For every row pertinent to a KPI, the said KPI is contrasted with every other KPI. If the KPI under evaluation is more relevant, the interjecting matrix element is assigned the value of “1”. Otherwise, if such KPI is less relevant, the matrix element is rendered “0”. The KPIs comparison yields a binary triangular matrix, where the upper triangle is opposite to the lower one.
- If two KPIs are equally relevant, the interjecting matrix elements on both pertinent rows are assigned a value of “1”. In such a case, the resulting upper and lower triangles will not be exact opposites.
| KPIs | A | B | C | D | E | F | G | H | I | J | K | |
|---|---|---|---|---|---|---|---|---|---|---|---|---|
| Mass energy density | A | 0 | 1 | 1 | 1 | 0 | 0 | 0 | 0 | 0 | 0 | |
| Energy per footprint | B | 1 | 1 | 1 | 1 | 0 | 0 | 0 | 0 | 0 | 0 | |
| Discharge duration | C | 0 | 0 | 1 | 1 | 0 | 0 | 1 | 0 | 0 | 0 | |
| Response time | D | 0 | 0 | 0 | 1 | 1 | 0 | 0 | 0 | 0 | 0 | |
| Capacity | E | 0 | 0 | 0 | 0 | 0 | 0 | 0 | 0 | 0 | 0 | |
| Efficiency | F | 1 | 1 | 1 | 0 | 1 | 0 | 0 | 1 | 0 | 0 | |
| Safety | G | 1 | 1 | 1 | 1 | 1 | 1 | 1 | 1 | 1 | 1 | |
| Environmental impact | H | 1 | 1 | 0 | 1 | 1 | 1 | 0 | 1 | 0 | 0 | |
| Maintenance | I | 1 | 1 | 1 | 1 | 1 | 1 | 0 | 0 | 0 | 0 | |
| Integrability | J | 1 | 1 | 1 | 1 | 1 | 1 | 0 | 1 | 1 | 0 | |
| TRL | K | 1 | 1 | 1 | 1 | 1 | 1 | 0 | 1 | 1 | 1 |
| KPIs | A | B | C | D | E | F | G | H | I | J | K | |
|---|---|---|---|---|---|---|---|---|---|---|---|---|
| Mass energy density | A | 0 | 0 | 0 | 0 | 0 | 0 | 0 | 0 | 1 | 1 | |
| Energy per footprint | B | 1 | 0 | 0 | 0 | 0 | 0 | 0 | 1 | 1 | 1 | |
| Discharge duration | C | 1 | 1 | 0 | 0 | 1 | 0 | 0 | 1 | 1 | 1 | |
| Response time | D | 1 | 1 | 1 | 1 | 0 | 0 | 0 | 1 | 1 | 1 | |
| Capacity | E | 1 | 1 | 1 | 1 | 1 | 0 | 0 | 1 | 1 | 1 | |
| Efficiency | F | 1 | 1 | 0 | 1 | 0 | 0 | 1 | 1 | 1 | 1 | |
| Safety | G | 1 | 1 | 1 | 1 | 1 | 1 | 1 | 1 | 1 | 1 | |
| Environmental impact | H | 1 | 1 | 1 | 1 | 1 | 0 | 0 | 1 | 1 | 1 | |
| Maintenance | I | 1 | 0 | 0 | 0 | 0 | 1 | 0 | 0 | 1 | 1 | |
| Integrability | J | 0 | 0 | 0 | 0 | 0 | 0 | 0 | 0 | 0 | 1 | |
| TRL | K | 0 | 0 | 0 | 0 | 0 | 0 | 0 | 0 | 0 | 0 |
- 5.
- Once the one-to-one comparison is completed, and the indicative “ones” and “zeros” are obtained, the parameter weighting factors () are computed by applying the following equation:
| A | B | C | D | E | F | G | H | I | J | K | ||||
|---|---|---|---|---|---|---|---|---|---|---|---|---|---|---|
| A | 0 | 1 | 1 | 1 | 0 | 0 | 0 | 0 | 0 | 0 | 3.0 | 5.4% | ||
| B | 1 | 1 | 1 | 1 | 0 | 0 | 0 | 0 | 0 | 0 | 4.0 | 7.1% | ||
| C | 0 | 0 | 1 | 1 | 0 | 0 | 1 | 0 | 0 | 0 | 3.0 | 5.4% | ||
| D | 0 | 0 | 0 | 1 | 1 | 0 | 0 | 0 | 0 | 0 | 2.0 | 3.6% | ||
| E | 0 | 0 | 0 | 0 | 0 | 0 | 0 | 0 | 0 | 0 | 0.0 | 0.0% | ||
| F | 1 | 1 | 1 | 0 | 1 | 0 | 0 | 1 | 0 | 0 | 5.0 | 8.9% | ||
| G | 1 | 1 | 1 | 1 | 1 | 1 | 1 | 1 | 1 | 1 | 10.0 | 17.9% | ||
| H | 1 | 1 | 0 | 1 | 1 | 1 | 0 | 1 | 0 | 0 | 6.0 | 10.7% | ||
| I | 1 | 1 | 1 | 1 | 1 | 1 | 0 | 0 | 0 | 0 | 6.0 | 10.7% | ||
| J | 1 | 1 | 1 | 1 | 1 | 1 | 0 | 1 | 1 | 0 | 8.0 | 14.3% | ||
| K | 1 | 1 | 1 | 1 | 1 | 1 | 0 | 1 | 1 | 1 | 9.0 | 16.1% | ||
| 56 |
| A | B | C | D | E | F | G | H | I | J | K | ||||
|---|---|---|---|---|---|---|---|---|---|---|---|---|---|---|
| A | 0 | 0 | 0 | 0 | 0 | 0 | 0 | 0 | 1 | 1 | 2 | 3.5% | ||
| B | 1 | 0 | 0 | 0 | 0 | 0 | 0 | 1 | 1 | 1 | 4 | 7.0% | ||
| C | 1 | 1 | 0 | 0 | 1 | 0 | 0 | 1 | 1 | 1 | 6 | 10.5% | ||
| D | 1 | 1 | 1 | 1 | 0 | 0 | 0 | 1 | 1 | 1 | 7 | 12.3% | ||
| E | 1 | 1 | 1 | 1 | 1 | 0 | 0 | 1 | 1 | 1 | 8 | 14.0% | ||
| F | 1 | 1 | 0 | 1 | 0 | 0 | 1 | 1 | 1 | 1 | 7 | 12.3% | ||
| G | 1 | 1 | 1 | 1 | 1 | 1 | 1 | 1 | 1 | 1 | 10 | 17.5% | ||
| H | 1 | 1 | 1 | 1 | 1 | 0 | 0 | 1 | 1 | 1 | 8 | 14.0% | ||
| I | 1 | 0 | 0 | 0 | 0 | 1 | 0 | 0 | 1 | 1 | 4 | 7.0% | ||
| J | 0 | 0 | 0 | 0 | 0 | 0 | 0 | 0 | 0 | 1 | 1 | 1.8% | ||
| K | 0 | 0 | 0 | 0 | 0 | 0 | 0 | 0 | 0 | 0 | 0 | 0.0% | ||
| 57 |
- 6.
- Once the parameters’ weighting factors are obtained, the storage solutions are evaluated. All alternatives are contrasted with each other in reference to an alternately defined KPI. The technology with the best performance (according to the evaluation in Table 2) obtains a “1”, otherwise a “0”. If both technologies score the same, they are both assigned a “1” (indicated in yellow cells below).
- 7.
- Similar to the parameter weighting factors, the technology weighting factors per KPI () are computed by applying the following equation:
- 8.
- The result is one matrix per every KPI, with the corresponding weights. Table A5 illustrates the procedure for parameter A: mass energy density.
| Technology | I | II | III | IV | V | VI | VII | VIII | IX | X | XI | XII | XIII | ||||
|---|---|---|---|---|---|---|---|---|---|---|---|---|---|---|---|---|---|
| Lead–acid | I | 0 | 1 | 0 | 0 | 1 | 1 | 0 | 0 | 0 | 0 | 0 | 0 | 3 | 3.30% | ||
| Li-ion | II | 1 | 1 | 1 | 0 | 1 | 1 | 0 | 1 | 0 | 0 | 0 | 0 | 6 | 6.59% | ||
| Ni–Cd | III | 1 | 0 | 0 | 0 | 1 | 1 | 0 | 0 | 0 | 0 | 0 | 0 | 3 | 3.30% | ||
| NaS | IV | 1 | 1 | 1 | 0 | 1 | 1 | 0 | 1 | 0 | 0 | 0 | 0 | 6 | 6.59% | ||
| Ammonia | V | 1 | 1 | 1 | 1 | 1 | 1 | 1 | 1 | 1 | 0 | 0 | 0 | 9 | 9.89% | ||
| CAES | VI | 1 | 0 | 1 | 0 | 0 | 1 | 0 | 0 | 0 | 0 | 0 | 0 | 3 | 3.30% | ||
| HPES | VII | 1 | 0 | 1 | 0 | 0 | 1 | 0 | 0 | 0 | 0 | 0 | 0 | 3 | 3.30% | ||
| SCESS | VIII | 1 | 1 | 1 | 1 | 0 | 1 | 1 | 1 | 1 | 0 | 0 | 0 | 8 | 8.79% | ||
| FESS | IX | 1 | 1 | 1 | 1 | 0 | 1 | 1 | 0 | 0 | 0 | 0 | 0 | 6 | 6.59% | ||
| H2 MH | X | 1 | 1 | 1 | 1 | 0 | 1 | 1 | 1 | 1 | 0 | 0 | 0 | 8 | 8.79% | ||
| H2 gas | XI | 1 | 1 | 1 | 1 | 1 | 1 | 1 | 1 | 1 | 1 | 1 | 1 | 12 | 13.19% | ||
| H2 Liq | XII | 1 | 1 | 1 | 1 | 1 | 1 | 1 | 1 | 1 | 1 | 1 | 1 | 12 | 13.19% | ||
| H2 Underg. | XIII | 1 | 1 | 1 | 1 | 1 | 1 | 1 | 1 | 1 | 1 | 1 | 1 | 12 | 13.19% | ||
| 91 |
- 9.
- The scores obtained for all KPIs (illustrated in Table A5) are then weighted by the specific weight per parameter within the parameters comparison matrix (refer to Table A3 and Table A4). To exemplify this, take the technology I—Lead–acid battery—weight for parameter A (3.3%), parameter A weights for scenario A 5.4% according to Table A3; thereafter, the solution I score within the general matrix of Scenario A is computed as follows:
| Weight | Lead–Acid | Li-Ion | Ni–Cd | NaS | NH3 | CAES | HPES | SCESS | FESS | H2 MH | H2 Gas | H2 Liq | H2 Underg. | ||
|---|---|---|---|---|---|---|---|---|---|---|---|---|---|---|---|
| Mass energy density | A | 5.4 | 0.2 | 0.4 | 0.2 | 0.4 | 0.5 | 0.2 | 0.2 | 0.5 | 0.4 | 0.5 | 0.7 | 0.7 | 0.7 |
| Energy per footprint | B | 7.1 | 0.2 | 1.1 | 0.1 | 1.0 | 0.5 | 0.9 | 0.3 | 0.4 | 0.0 | 0.6 | 0.8 | 0.6 | 0.8 |
| Discharge duration | C | 5.4 | 0.2 | 0.0 | 0.2 | 0.2 | 0.7 | 0.7 | 0.4 | 0.3 | 0.3 | 0.5 | 0.5 | 0.5 | 0.7 |
| Response time | D | 3.6 | 0.4 | 0.4 | 0.4 | 0.4 | 0.2 | 0.2 | 0.2 | 0.4 | 0.4 | 0.2 | 0.1 | 0.1 | 0.0 |
| Capacity | E | 0.0 | 0.0 | 0.0 | 0.0 | 0.0 | 0.0 | 0.0 | 0.0 | 0.0 | 0.0 | 0.0 | 0.0 | 0.0 | 0.0 |
| Efficiency | F | 8.9 | 0.9 | 1.2 | 0.9 | 0.9 | 0.2 | 0.5 | 1.2 | 0.6 | 1.2 | 0.2 | 0.4 | 0.2 | 0.4 |
| Safety | G | 17.9 | 2.0 | 2.0 | 2.0 | 0.6 | 0.2 | 2.0 | 2.4 | 2.0 | 2.4 | 0.6 | 0.6 | 0.4 | 1.0 |
| Environmental impact | H | 10.7 | 0.5 | 0.5 | 0.5 | 0.8 | 0.5 | 1.4 | 1.4 | 0.0 | 1.4 | 1.4 | 1.4 | 0.8 | 0.6 |
| Maintenance | I | 10.7 | 1.3 | 1.3 | 1.3 | 0.8 | 0.8 | 0.2 | 0.8 | 1.3 | 0.2 | 0.8 | 0.3 | 0.2 | 1.3 |
| Integrability | J | 14.3 | 2.0 | 2.0 | 2.0 | 1.5 | 0.5 | 1.0 | 1.3 | 1.0 | 1.3 | 0.5 | 0.2 | 0.0 | 1.0 |
| TRL | K | 16.1 | 2.1 | 2.1 | 1.2 | 1.2 | 0.5 | 2.1 | 0.3 | 0.2 | 2.1 | 0.7 | 2.1 | 1.2 | 0.2 |
| Score | 100 | 10 | 11 | 9 | 8 | 5 | 9 | 8 | 7 | 10 | 6 | 7 | 5 | 7 | |
| Weight | Lead–Acid | Li-Ion | Ni–Cd | NaS | NH3 | CAES | HPES | SCESS | FESS | H2 MH | H2 Gas | H2 Liq | H2 Underg. | ||
|---|---|---|---|---|---|---|---|---|---|---|---|---|---|---|---|
| Mass energy density | A | 3.5 | 0.1 | 0.2 | 0.1 | 0.2 | 0.3 | 0.1 | 0.1 | 0.3 | 0.2 | 0.3 | 0.5 | 0.5 | 0.5 |
| Energy per footprint | B | 7.0 | 0.2 | 1.0 | 0.1 | 1.0 | 0.5 | 0.9 | 0.3 | 0.3 | 0.0 | 0.6 | 0.8 | 0.6 | 0.8 |
| Discharge duration | C | 10.5 | 0.4 | 0.0 | 0.4 | 0.4 | 1.4 | 1.4 | 0.7 | 0.6 | 0.6 | 1.1 | 1.1 | 1.1 | 1.4 |
| Response time | D | 12.3 | 1.5 | 1.5 | 1.5 | 1.5 | 0.7 | 0.7 | 0.7 | 1.5 | 1.5 | 0.7 | 0.2 | 0.2 | 0.1 |
| Capacity | E | 14.0 | 1.5 | 1.5 | 1.5 | 1.5 | 1.7 | 0.3 | 0.0 | 0.2 | 0.8 | 1.5 | 0.8 | 0.8 | 1.9 |
| Efficiency | F | 12.3 | 1.3 | 1.7 | 1.3 | 1.3 | 0.3 | 0.7 | 1.7 | 0.8 | 1.7 | 0.3 | 0.6 | 0.3 | 0.6 |
| Safety | G | 17.5 | 1.9 | 1.9 | 1.9 | 0.6 | 0.2 | 1.9 | 2.3 | 1.9 | 2.3 | 0.6 | 0.6 | 0.4 | 1.0 |
| Environmental impact | H | 14.0 | 0.6 | 0.6 | 0.6 | 1.0 | 0.6 | 1.8 | 1.8 | 0.0 | 1.8 | 1.8 | 1.8 | 1.0 | 0.7 |
| Maintenance | I | 7.0 | 0.9 | 0.9 | 0.9 | 0.5 | 0.5 | 0.1 | 0.5 | 0.9 | 0.1 | 0.5 | 0.2 | 0.1 | 0.9 |
| Integrability | J | 1.8 | 0.2 | 0.2 | 0.2 | 0.2 | 0.1 | 0.1 | 0.2 | 0.1 | 0.2 | 0.1 | 0.0 | 0.0 | 0.1 |
| TRL | K | 0.0 | 0.0 | 0.0 | 0.0 | 0.0 | 0.0 | 0.0 | 0.0 | 0.0 | 0.0 | 0.0 | 0.0 | 0.0 | 0.0 |
| Score | 100 | 9 | 10 | 8 | 8 | 6 | 8 | 8 | 7 | 9 | 7 | 6 | 5 | 8 | |
Appendix B. Overall Performance of Storage Solutions
Appendix C. Complementary Information of the Energy Storage Technologies
| Technologies | (1) Safety Indicators, (2) Environmental Impact, (3) Maintenance Requirement | Integrability | Costs | Ref. |
|---|---|---|---|---|
| CAES | (1) The main concern with CAES is related to compressed air storage in vessels, i.e., catastrophic rupture of container. Yet, the safety regulations make this a rare occurrence at the cost of higher weight and additional safety features, such as pressure relief valves. (2) The highest negative environmental impact of CAES is related to underground storage in caverns, i.e., excavation process, materials and components used for construction and the structural stability for the membrane. If tanks were to be used for storage, the main impact would derive from abiotic depletion from raw materials used in the manufacturing of the vessels. (3) The maintenance requirements are the same as a simple cycle combustion engine (~USD 0.30/MWh generated). | Integrability of CAES should not be an issue in offshore platforms. The technology is based on conventional gas turbine technology, heat exchangers and underground storage/retrieval, largely customary in the oil and gas industry. | Power conversion system: EUR 696–928/kW Storage component: EUR 97–120/kWh O&M: EUR 3.9/kWh-yr [25] | [25,66,84] |
| H2 stored in metal hydride | (1) Metal hydrides provide good safety features when compared to other hydrogen storage solutions, as they do not explode and may be rendered self-extinguishing. However, an important safety concern is the release temperatures of some metal hydrides, which can reach high temperatures (>500 °C), which can be prohibitive in the vicinity of certain processes and or hazardous areas. (2) It is seen as lacking negative environmental impact; however, the availability of the raw material for large-scale application involving lanthanum poses an environmental factor for consideration. (3) Metal hydrides can operate for decades without major losses. Commercially available systems claim 99% capacity after 3500 cycles. Yet, the charging and discharging of metal hydrides causes stress in the material, yielding tiny defects that eventually degrade the material’s ability to store hydrogen. However, dedicated research is underway to improve the long-term efficiency, including particle size, controlled use of material defects, moisture and oxygen monitoring, thermal control, etc. | All of the key components for hydrogen production are readily available to the industry. Electrolysers are becoming more efficient as the technology further matures. The location of the storage solution withing the platform shall be carefully considered due to the high temperatures achieved during retrieval. | Power conversion system: Electrolysis and small to medium turbine (including balance of plant): EUR 1359–2673/KW Storage in hydrides: Low thermal hydrides: USD 14–200/kWh High-thermal hydrides: USD 10–20/kWh. O&M: EUR 25–45/kW-yr | [25,39,43,85,86,87,88] |
| H2 compressed in tank | (1) Hydrogen has a low molecular size. In the event of a vessel failure, hydrogen will leak through the cracks, triggering an increase in the temperature due to the negative value of the Joule–Thompson coefficient. Once leaked, hydrogen forms an explosive mixture, given its wide range of flammable concentrations in the air and lower ignition energy than, e.g., natural gas. Special flame detectors are required. (2) The environmental impact of hydrogen is related to possible leakage. Hydrogen can be considered as an indirect greenhouse gas with the potential to increase global warming. This is because hydrogen reacts in the atmosphere with tropospheric OH radicals, disrupting the distribution of methane and ozone. However, the potential effects on climate from hydrogen-based energy systems would be over 10 times lower than those from fossil-fuel-based energy systems. (3) Storage vessels should be subjected to non-destructive examination at planned intervals and be recertified periodically with regard to their safety and reliability. Cyclic service is of particular concern due to the potential failure due to fatigue and hydrogen embrittlement. Pressure vessels must follow standards, as well as the manufacturer’s and best practice recommendations and consider the particularities of the location. | Reuse of platforms previously used for the oil and gas industry to accommodate the green hydrogen production is seen as a potential solution for decreased investment costs of energy production from wind turbines, especially as the electrolysers technology advances and costs decrease. | For costs of power conversion system and operation and maintenance, see metal hydrides above. Storage in tanks: USD 438/Kg [45]: ~USD 13.1/kWh | [44,89,90,91] |
| H2 liquefied in tank | The considerations described for compressed hydrogen systems are applicable to liquid systems. In addition: (1) Extremely low temperatures of liquid hydrogen yield air condensation on exposed surfaces, such as vessels and piping. Nitrogen, which has a lower boiling point than oxygen, will evaporate first, leaving oxygen-enriched condensation on the surface. All areas of potential condensation should be free of hydrocarbons (oils, grease, etc), and the insulation material shall be non-combustible to prevent possible ignition. Further, material integrity for low temperature operation should be thoroughly considered; the vessel and the connecting piping must have sufficient flexibility to prevent fatigue failures caused by thermal contraction. (2) For environmental impact, see notes on H2 tanks above. (3) Even if hydrogen is not being drawn from the tank, the evaporation of liquid H2 will take place at a rate of up to 1% per day. Hence, periodical pressure relief shall be accounted for as a normal part of operation. | The use of liquefaction plants within operating oil and gas platforms poses integrability issues that must be thoroughly addressed, such as the space availability and safety concerns. | For costs of power conversion system, see metal hydrides above. Liquefaction costs (including operation and maintenance based on the IDEALHY project): USD 58/kWh Storage: USD 149/kg~USD 4.8/kWh. | [41,42,91,92,93,94] |
| H2 storage underground | (1,2) The main safety and environmental issues of underground storage of hydrogen are related to the unlikely events of unhindered escape of the stored gas in case of a blow-out and leakage through faults or other leakage paths. The former could be prevented by an automatically closing subsurface safety valve (SSSV); the latter has a lower incidence in depleted gas and oil fields, where the tightness is initially known and thoroughly tested. However, knowledge gaps exist regarding the geochemical, mineralogical and microbiological reactions, as well as geomechanical effects in geological stores in the presence of hydrogen. (3) During the operation of depleted oil fields, residual oil may periodically be produced and increase the operation and maintenance efforts of the storage. | Storing hydrogen in depleted gas fields would leverage promising features, such as proximity to reservoirs, proven tightness to gases over geological time periods and the already existing facilities for injection and withdrawal of hydrogen from the reservoir. | For costs of power conversion system and operation and maintenance, see metal hydrides above. Storage in underground caverns: EUR 0.2–11.6/kWh | [45,95] |
| Lead–acid -Flooded LA | (1) Poor performance at low or high temperatures, so they need a thermal management system. They also need appropriate ventilation to manage the off-gassing (hydrogen) or evaporated electrolyte. (2) They contain sulphuric acid, and they depend on hazardous and restricted materials. Lead is a restricted element under the RoHS. (3) Ample manufacturing and operational experience. It needs periodic water replacement. | Batteries for offshore applications are usually offered in container modules. Such modules include the batteries, dual connection shore, AC/DC drives, cooling, ventilation and fire protection. The container can be installed on the platform, or it can be coupled to the wind turbines. For installing the batteries offshore, there are several guidelines and regulations from the Norwegian maritime authority and DNV. | USD 150–500/kWh | [9,12,13,16,96]. |
| Lead–acid -VRLA | (1) Non-flooded electrolyte design, which allows for operation in areas without the need for special ventilation. They are more sensitive to higher temperature environment than flooded lead–acid systems. (2) Similar to flooded LA. (3) Very low maintenance and no water addition required [9]. | USD 106–473/kWh | [9,16] | |
| Ni–Cd | (1,2) Cd is very toxic and is a restricted element under the RoHS. (3) They survive at high-temperature environments. This battery is used for O&G installations. Easy installation and low maintenance. Resistance to mechanical and electrical abuses. | USD 250–1000/kWh | [8,12,16,70,97] | |
| NaS | (1) Since the batteries operate at high temperatures (300–350 °C), they require a thermal enclosure. These batteries are recommended for use in stationary systems, since in the event of a crash, the ceramic electrolyte can be mechanically damaged, and uncontrollable reactions between the molten sodium and molten sulphur can occur. Special containment is required to manage high-temperature sodium and sulphide compounds, which are highly corrosive. (2) They use non-toxic materials and have a recyclability rate of 99%. (3) Low O&M requirement. | USD 263–735/kWh | [9,16,70] | |
| Li-ion batteries | (1) Safety concerns over thermal runaway incidents for LCO. LFP and NMC reduce the risk of thermal runaways. (2) Currently, the recycling schemes and recovery rate are low. Several projects are looking for recycling paths for these batteries, but the diversity in the chemistry of these batteries poses a challenge. The availability of Lithium and cobalt is a concern, in case of aggressive demand scenarios. (3) Low O&M requirement. | USD 200–1260/kWh | [9,16,17] | |
| FESS—flywheels | (1) Flywheels operate at high circumferential speeds, sometimes even up to 800 m/s. The main safety hazard is related to rotor failure with catastrophic effects. Up to a certain energy content, flywheels can be contained and mounted safely, even in the event of a severe rotor burst. Three design options to decrease the consequences and likelihood of failure are: safe housing to avoid penetration, breach or gas release/intake, bunker the system to avoid penetration or bunker destruction in the radial direction and axial direction, safety margin in rotor design. (2) Low environmental impact, as no greenhouse emission or toxic material is produced during operation. (3) Most flywheel systems use sealed, frictionless bearings and may require no lubrication and little maintenance; yet, replacement is often required, every 5 to 8 years. If the flywheel is coupled to a generator, it will require regular maintenance (coolant and oil changes, filters and batteries). | Integrability shall not be a showstopper. Flywheels have been used in numerous applications, including powering of turbomachinery and mechanical batteries in diverse sectors. Further, the presence of flywheels can enhance the batteries’ storage time and, hence, increase their utilisation time [29]. | Power conversion system: (including balance of plant) EUR 284–356/KW Operation and maintenance (variable/fixed): EUR 4.8–5.6/kW-yr/ EUR 1.1–2.9/kWh Storage: EUR 1030–18,159/kWh [26] | [25,27,30,98,99] |
| SCESS—Supercapacitor | (1) A short circuit of a fully charged supercapacitor will cause a quick release of the stored energy, which can cause electrical arcing, with consequences to the integrity of the device. However, the generated heat is too low as to pose a real risk of explosion (unlike batteries). (2) Although supercapacitors are not polluting to the environment, their configuration (and new configurations of Lithium-ion batteries) may include carbon nanotubes, which are known toxic compounds for humans and other living beings. However, large-scale environmental impact on a system level over the entire life cycle requires further investigation. (3) Supercapacitors can be charged and discharged millions of times and have a virtually unlimited life cycle. Further, supercapacitors are considered a maintenance-free technology. | Integrability shall not be an issue. Supercapacitors have been used in numerous applications. The supercapacitor space requires a thorough case-by-case assessment and compliance with relevant guidelines. In cases where the supercapacitor system is integrated into the platform power/energy management system, with other subsystems and components, the integration tests of the whole system are to be carried out. Supercapacitor spaces are not to contain any heat sources or high fire risk objects, nor equipment supporting essential services. | EUR 6800–20,000/kWh | [100,101,102,103,104] |
| Ammonia fuel | (1) Poison gas and corrosive problems during loading. Although if leakage occurs, the ammonia smell can be detected at small concentrations. (2) Toxic gas for humans and for aquatic life. NOx (GHG) emission from ammonia combustion. (3) Ammonia has a 30 times lower cost per unit of stored energy compared to hydrogen. Ammonia fuel blends for gas turbine power generation is an immature field. | Ammonia is a potential marine fuel. There are several projects assessing the use of ammonia as fuel for ships or for producing it in an artificial island. Therefore, ammonia produced in an oil and gas platform can be very well integrated in a future marine fuel system. | Power conversion system: Electrolysis and fuel cell (including balance of plant) EUR 1630–3884/kW Operation and maintenance: EUR 24–39/kW-yr [26] | [25,55,56,61,105] |
| Hydro-Pneumatic Energy Storage (HPES) | (1,2) The technology uses pressurised seawater and compressed air. None of the sub-components or materials are considered hazardous or flammable. (3) There is no information on the maintenance requirement. | The HPES system can stand alone on the sea beside the platform, or it can be coupled with the wind turbines. The deployment depth of the full scale is 100–250 m. | CAPEX: EUR 1800–3000/kWh | [31,32,73] |
References
- Emissions to Air. Available online: https://www.ssb.no/en/natur-og-miljo/forurensning-og-klima/statistikk/utslipp-til-luft (accessed on 18 May 2022).
- Norwegian Petroleum. Emission to Air, Gas Turbines. Available online: https://www.norskpetroleum.no/en/environment-and-technology/emissions-to-air/ (accessed on 18 May 2022).
- Watson, S.; Moro, A.; Reis, V.; Baniotopoulos, C.; Barth, S.; Bartoli, G.; Bauer, F.; Boelman, E.; Bosse, D.; Cherubini, A.; et al. Future emerging technologies in the wind power sector: A European perspective. Renew. Sustain. Energy Rev. 2019, 113, 109270. [Google Scholar] [CrossRef]
- Ringkjøb, H.-K.; Haugan, P.M.; Solbrekke, I.M. A review of modelling tools for energy and electricity systems with large shares of variable renewables. Renew. Sustain. Energy Rev. 2018, 96, 440–459. [Google Scholar] [CrossRef]
- Blanco, H.; Faaij, A. A review at the role of storage in energy systems with a focus on Power to Gas and long-term storage. Renew. Sustain. Energy Rev. 2018, 81, 1049–1086. [Google Scholar] [CrossRef]
- Paris Agreement, “Paris agreement,” 2015. Available online: https://unfccc.int/files/meetings/paris_nov_2015/application/pdf/paris_agreement_english_.pdf (accessed on 18 May 2022).
- Low-Emission’s Research Centre. Available online: https://www.sintef.no/projectweb/lowemission/ (accessed on 18 May 2022).
- Díaz-González, F.; Sumper, A.; Gomis-Bellmunt, O.; Villafafila-Robles, R. A review of energy storage technologies for wind power applications. Renew. Sustain. Energy Rev. 2012, 16, 2154–2171. [Google Scholar] [CrossRef]
- IRENA. Electricity Storage and Renewables: Costs and Markets to 2030; IRENA: Abu Dhabi, United Arab Emirates, 2017. [Google Scholar]
- Ultrabattery. Fukukawa Battery. Available online: https://corp.furukawadenchi.co.jp/en/products/indust/ub.html (accessed on 9 November 2021).
- VRLA Rechargeable Battery MSB-2000. Available online: https://www.battery-direct.com/Datenblaetter/MSB2000.pdf (accessed on 18 May 2021).
- The European Commission. Roadmap on Directive 2011/65/EU on the Restriction of the Use of Certain Hazardous Substances in Electrical and Electronic Equipment (RoHS Directive); The European Commission: Brussels, Belgium, 2018.
- Safety, Operation and Performance of Grid Connected Energy Storage Systems, DNV-GL. 2017. Available online: https://rules.dnv.com/docs/pdf/DNV/rp/2017-09/dnvgl-rp-0043.pdf (accessed on 11 August 2021).
- Rand, D.A.J.; Moseley, P.T. Chapter 13-Energy Storage with Lead–Acid Batteries. In Electrochemical Energy Storage for Renewable Sources and Grid Balancing; Moseley, P.T., Garche, J., Eds.; Elsevier: Amsterdam, The Netherlands, 2015; pp. 201–222. [Google Scholar]
- Pickard, W.F.; Shen, A.Q.; Hansing, N.J. Parking the power: Strategies and physical limitations for bulk energy storage in supply–demand matching on a grid whose input power is provided by intermittent sources. Renew. Sustain. Energy Rev. 2009, 13, 1934–1945. [Google Scholar] [CrossRef]
- DNV GL. Handbook for Maritime and Offshore Battery Systems; DNV-GL: Bærum, Norway, 2016. [Google Scholar]
- Zubi, G.; Dufo-López, R.; Carvalho, M.; Pasaoglu, G. The lithium-ion battery: State of the art and future perspectives. Renew. Sustain. Energy Rev. 2018, 89, 292–308, ISSN 1364-0321. [Google Scholar] [CrossRef]
- Revankar, S.T. Chemical Energy Storage; Academic Press: Cambridge, MA, USA, 2019; pp. 177–227. [Google Scholar] [CrossRef]
- Kousksou, T.; Bruel, P.; Jamil, A.; El Rhafiki, T.; Zeraouli, Y. Energy storage: Applications and challenges. Sol. Energy Mater. Sol. Cells 2014, 120, 59–80. [Google Scholar] [CrossRef]
- Ellis, B.L.; Nazar, L.F. Sodium and sodium-ion energy storage batteries. Curr. Opin. Solid State Mater. Sci. 2012, 16, 168–177. [Google Scholar] [CrossRef]
- Raza, W.; Ali, F.; Raza, N.; Luo, Y.; Kim, K.-H.; Yang, J.; Kumar, S.; Mehmood, A.; Kwon, E.E. Recent advancements in supercapacitor technology. Nano Energy 2018, 52, 441–473. [Google Scholar] [CrossRef]
- Zyga, L. Can Capacitors in Electrical Circuits Provide Large-Scale Energy Storage? Phys. Org. Available online: https://phys.org/news/2014-12-capacitors-electrical-circuits-large-scale-energy.html (accessed on 11 August 2021).
- Berrueta, A.; Ursa, A.; Martin, I.S.; Eftekhari, A.; Sanchis, P. Supercapacitors: Electrical Characteristics, Modeling, Applications, and Future Trends. IEEE Access 2019, 7, 50869–50896. [Google Scholar] [CrossRef]
- Chang, L.; Hu, Y.H. Breakthroughs in Designing Commercial-LevelMass-Loading Graphene Electrodesfor Electrochemical Double-Layer Capacitors. Matter 2019, 1, 596–620. [Google Scholar] [CrossRef]
- Zakeri, B.; Syri, S. Electrical energy storage systems: A comparative life cycle cost analysis. Renew. Sustain. Energy Rev. 2015, 42, 569–596. [Google Scholar] [CrossRef]
- Anvari-Moghaddam, A.; Dragicevic, T.; Meng, L.; Sun, B.; Guerrero, J.M. Optimal planning and operation management of a ship electrical power system with energy storage system. In Proceedings of the IECON 2016-42nd Annual Conference of the IEEE Industrial Electronics Society, Florence, Italy, 23–26 October 2016; pp. 2095–2099. [Google Scholar] [CrossRef]
- Amiryar, M.E.; Pullen, K.R. A Review of Flywheel Energy Storage System Technologies and Their Applications. Appl. Sci. 2017, 7, 286. [Google Scholar] [CrossRef]
- Ramli, M.A.; Hiendro, A.; Twaha, S. Economic analysis of PV/diesel hybrid system with flywheel energy storage. Renew. Energy 2015, 78, 398–405. [Google Scholar] [CrossRef]
- De Groot, W.; Maloney, T.M.; Vanderaar, M.J. Power, Propulsion, and Communications for Microspacecraft Missions. In Microsatellites as Research Tools; Fei-Bin, H., Ed.; No. COSPAR Colloquia Series; Elsevier: Pergamon, Turkey, 1999; Volume 10, pp. 190–199. [Google Scholar]
- Cutler, J.C. (Ed.) Flywheels. In Encyclopedia of Energy; Elsevier: New York, NY, USA, 2004; pp. 695–704. [Google Scholar]
- Buhagiar, D.; Sant, T.; Farrugia, R.N.; Aquilina, L.; Farrugia, D.; Strati, F.M. Small-scale Experimental Testing of a Novel Marine Floating Platform with Integrated Hydro-pneumatic Energy Storage. J. Energy Storage 2019, 24, 100774. [Google Scholar] [CrossRef]
- Sant, T.; Buhagiar, D.; Farrugia, R.N.; Farrugia, D.; Strati, F.M. Cost Evaluation of Two Concepts for the Integration of Hydro-pneumatic Energy Storage in Floating Wind Turbines. J. Phys. Conf. Ser. 2018, 1037, 042019. [Google Scholar] [CrossRef]
- Sheffield, J.; Martin, K.; Folkson, R. Electricity and hydrogen as energy vectors for transportation vehicles. In Alternative Fuels and Advanced Vehicle Technologies for Improved Environmental Performance; Woodhead Publishing: Sawston, UK, 2014; pp. 117–137. [Google Scholar] [CrossRef]
- Office of Energy Efficiency & Renewable Energy. An Office of U.S. Department of Energy, USA. Available online: https://www.energy.gov/eere/fuelcells/hydrogen-storage#:~:text=On%20a%20volume%20basis%2C%20however,based%20on%20lower%20heating%20values (accessed on 26 May 2021).
- Lindtvedt, J.K. Deep Purple. Available online: https://energyvalley.no/wp-content/uploads/2019/04/Deep-Purple-.pdf (accessed on 31 May 2022).
- European Comission. HyStorIES-Hydrogen Storage In European Subsurface. Available online: https://cordis.europa.eu/project/id/101007176 (accessed on 20 May 2021).
- Krishna, R.; Titus, E.; Salimian, M.; Okhay, O.; Rajendran, S.; Rajkumar, A.; Sousa, J.M.G.; Ferreira, A.L.C.; Campos, J.; Gracio, J. Hydrogen Storage for Energy Application; IntechOpen: London, UK, 2012. [Google Scholar] [CrossRef] [Green Version]
- Sainz-Garcia, A.; Abarca, E.; Rubi, V.; Grandia, F. Assessment of feasible strategies for seasonal underground hydrogen storage in a saline aquifer. Int. J. Hydrogen Energy 2017, 42, 16657–16666. [Google Scholar] [CrossRef]
- Davoodabadi, A.; Mahmoudi, A.; Ghasemi, H. The potential of hydrogen hydrate as a future hydrogen storage medium. iScience 2021, 24, 101907. [Google Scholar] [CrossRef]
- Di Profio, P.; Arca, S.; Rossi, F.; Filipponi, M. Comparison of hydrogen hydrates with existing hydrogen storage technologies: Energetic and economic evaluations. Int. J. Hydrogen Energy 2009, 34, 9173–9180. [Google Scholar] [CrossRef]
- Stolzenburg, K.; Berstad, D.; Decker, L.; Elliott, A.; Haberstroh, C.; Hatto, C.; Walnum, H.T.; Klaus, M.; Mortimer, N.D.; Mubbala, R.; et al. “Efficient Liquefaction of Hydrogen: Results of the IDEALHY Project,” in XXth Energie–Symposium, Stralsund/Germany. 2013. Available online: https://www.researchgate.net/publication/335033448_Efficient_Liquefaction_of_Hydrogen_Results_of_the_IDEALHY_Project#fullTextFileContent (accessed on 14 September 2021).
- CleanTech, NCE Maritime. Norwegian Future Value Chains for Liquid Hydrogen. Report. Available online: https://maritimecleantech.no/wp-content/uploads/2016/11/Report-liquid-hydrogen.pdf,2019 (accessed on 14 April 2022).
- Ward, P.A.; Corgnale, C.; Teprovich, J.A.; Motyka, T.; Hardy, B.; Sheppard, D.; Buckley, C.; Zidan, R. Technical challenges and future direction for high-efficiency metal hydride thermal energy storage systems. Appl. Phys. A 2016, 122, 462. [Google Scholar] [CrossRef]
- Kharel, S.; Shabani, B. Hydrogen as a Long-Term Large-Scale Energy Storage Solution to Support Renewables. Energies 2018, 11, 2825. [Google Scholar] [CrossRef]
- Le Duigou, A.; Bader, A.-G.; Lanoix, J.-C.; Nadau, L. Relevance and costs of large scale underground hydrogen storage in France. Int. J. Hydrogen Energy 2017, 42, 22987–23003. [Google Scholar] [CrossRef]
- Lord, A.S.; Kobos, P.H.; Borns, D.J. Geologic storage of hydrogen: Scaling up to meet city transportation demands. Int. J. Hydrogen Energy 2014, 39, 15570–15582. [Google Scholar] [CrossRef]
- Cummins. HyLYZER Water Electrolyzers. Available online: https://www.cummins.com/sites/default/files/2021-08/cummins-hylyzer-1000-specsheet.pdf (accessed on 21 October 2021).
- Zyga, L. First Analysis of the Water Requirements of a Hydrogen Economy; Phys.org; 2007. Available online: https://phys.org/news/2007-10-analysis-requirements-hydrogen-economy.html#:~:text=In%20one%20year%2C%2060%20billion,water%20per%20gallon%20of%20gasoline (accessed on 15 February 2022).
- MWI Pumps. Large-Volume Pumps & Services. 2020. Available online: https://mwipumps.com/wp-content/uploads/Catalog-CIM-MWI-Pumps-9-17-20.pdf (accessed on 9 December 2021).
- Goodwater Warehouse. Frame Mount Vertical. Available online: https://goodwaterwarehouse.com/cat/FMV-Spec-Sheet.pdf. (accessed on 9 December 2021).
- Burckhardt Compression. Process Gas Compressors. Available online: https://www.burckhardtcompression.com/wp-content/uploads/2021/09/bc_bro_Process-Gas-Compressor_210917-v2_en.pdf (accessed on 9 December 2021).
- General Electric. Hydrogen Fueled Gas Turbines. Available online: https://www.ge.com/gas-power/future-of-energy/hydrogen-fueled-gas-turbines?gclid=Cj0KCQiAzMGNBhCyARIsANpUkzM2_KCtV_DT2j5WWpk980DLcr1JmhsRNsXP3Ps6klSrgXKrKf57hYEaAksZEALw_wcB#customers (accessed on 9 December 2021).
- Decker, L. Liquid Hydrogen Distribution Technology: HYPER Closing Seminar. Available online: https://www.sintef.no/globalassets/project/hyper/presentations-day-2/day2_1105_decker_liquid-hydrogen-distribution-technology_linde.pdf (accessed on 21 October 2021).
- GNK. Hydrogen Storage Based on Metal Powder. Available online: https://www.gknpm.com/en/innovation/hydrogen-technology/hy2green/?__hstc=7113133.747ae4652e7716f57c904bef241a51f0.1579119203615.1579119203615.1579121060533.2&__hssc=7113133.2.1579121060533&__hsfp=502694344&_ga=2.97526879.1908624594.1621945332-1316774408.1621945332 (accessed on 25 May 2021).
- Reyes-Lua, A.; Bucelli, M. Reduced-Carbon Operation of Elgin and Franklin O&G Field-Module 2; LowEmission Research Centre: Trondheim, Norway, 2021. [Google Scholar]
- Assessment of Selected Alternative Fuels and Technologies. Group Technology & Research, White Paper. 2020. Available online: https://www.dnv.com/Publications/assessment-of-selected-alternative-fuels-and-technologies-rev-june-2019--116334 (accessed on 18 February 2022).
- Valera-Medina, A.; Xiao, H.; Owen-Jones, M.; David, W.; Bowen, P. Ammonia for power. Prog. Energy Combust. Sci. 2018, 69, 63–102. [Google Scholar] [CrossRef]
- Zhang, H.; Wang, L.; Van Herle, J.; Maréchal, F.; Desideri, U. Techno-economic comparison of green ammonia production processes. Appl. Energy 2019, 259, 114135. [Google Scholar] [CrossRef]
- Enge, M.; Lunde, A. Ammonia as Fuel in Maritime Energy Systems; Høgskulen på Vestlandet: Haugesund, Norway, 2021. [Google Scholar]
- Ammonia as a Marina Fuel. Safety Hankbook. 2020. Available online: https://grontskipsfartsprogram.no/wp-content/uploads/2022/03/Ammonia-as-Marine-Fuel-Safety-Handbook-Rev-01.pdf (accessed on 15 February 2022).
- Linde. Ammonia, Datasheet. Available online: https://www.linde-gas.com/en/images/linde-datasheet-01-ammonia-June-2017_tcm17-417364.pdf (accessed on 14 October 2021).
- Bindra, H.; Revankar, S. Storage and Hybridization of Nuclear Energy: Techno-Economic Integration of Renewable and Nuclear Energy; Academic Press: Cambridge, MA, USA, 2018. [Google Scholar]
- Beaudin, M.; Zareipour, H.; Schellenberglabe, A.; Rosehart, W. Energy storage for mitigating the variability of renewable electricity sources: An updated review. Energy Sustain. Dev. 2010, 14, 302–314. [Google Scholar] [CrossRef]
- Luo, X.; Wang, J.; Dooner, M.; Clarke, J.; Krupke, C. Overview of Current Development in Compressed Air Energy Storage Technology. Energy Procedia 2014, 62, 603–611. [Google Scholar] [CrossRef]
- Howitt, M. CAES or Batteries? Available online: https://www.storelectric.com/caes-or-batteries/ (accessed on 25 May 2021).
- CTCN. Compressed Air Energy Storage (CAES). Available online: https://www.ctc-n.org/technologies/compressed-air-energy-storage-caes (accessed on 15 September 2021).
- Degl’Innocenti, J. Compressed Air Energy Storage for Clean Offshore Energy Supply; Department of Energy and Process Engineering, Norwegian University of Science and Technology: Trondheim, Norway, 2018; Available online: http://hdl.handle.net/11250/2560131 (accessed on 12 May 2022).
- Oldenburg, C.M.; Pan, L. Porous Media Compressed-Air Energy Storage (PM-CAES): Theory and Simulation of the Coupled Wellbore–Reservoir System. Transp. Porous Media 2013, 97, 201–221. [Google Scholar] [CrossRef]
- Luo, X.; Wang, J.; Dooner, M.; Clarke, J. Overview of current development in electrical energy storage technologies and the application potential in power system operation. Appl. Energy 2015, 137, 511–536, ISSN 0306-2619. [Google Scholar] [CrossRef]
- Fan, X.; Liu, B.; Liu, J.; Ding, J.; Han, X.; Deng, Y.; Lv, X.; Xie, Y.; Chen, B.; Hu, W.; et al. Battery Technologies for Grid-Level Large-Scale Electrical Energy Storage. Trans. Tianjin Univ. 2020, 26, 92–103. [Google Scholar] [CrossRef]
- Dias, V.; Pochet, M.; Contino, F.; Jeanmart, H. Energy and Economic Costs of Chemical Storage. Front. Mech. Eng. 2020, 6, 21. [Google Scholar] [CrossRef]
- European Union. European Renewable Energy Network Study, Brussels. 2012. Available online: https://www.europarl.europa.eu/document/activities/cont/201202/20120208ATT37544/20120208ATT37544EN.pdf (accessed on 14 October 2021).
- FLASC. Available online: https://www.offshoreenergystorage.com/ (accessed on 10 September 2021).
- Mordor Intelligence. Global Supercapacitors Market-Growth, Trends, COVID-19 Impact, and Forecasts (2022–2027). 2021. Available online: https://www.mordorintelligence.com/industry-reports/supercapacitors-market (accessed on 10 September 2021).
- Gardiner, M. Energy Requirements for Hydrogen Gas Compression and Liquefaction as Related to Vehicle Storage Needs. DOE Hydrogen and Fuel Cells Program Record; Volume 9013. 2009. Available online: https://www.hydrogen.energy.gov/pdfs/9013_energy_requirements_for_hydrogen_gas_compression.pdf (accessed on 25 November 2021).
- Di Christopher, T. Hydrogen Technology Faces Efficiency Disadvantage in Power Storage Race; S&P Global Market Intelligence: New York, NY, USA, 2021. [Google Scholar]
- NCCS. Hydrogen-Firing of Gas Turbines; SINTEF: Trondheim, Norway, 2019. [Google Scholar]
- Hydrogen Council. How Hydrogen Empowers the Energy Transition. 2017. Available online: https://cdn.hexagongroup.com/uploads/2019/11/Hydrogen-Council-Vision-Document.pdf (accessed on 26 May 2021).
- Warner, N.; Carey, V.; Pierce, M. Quantitative Risk Analysis for Battery Energy Storage Sites; DNV GL: Bærum, Norway, 2019; Available online: https://www.dnv.com/Publications/quantitative-risk-analysis-for-battery-energy-storage-sites-154811 (accessed on 18 August 2022).
- SINTEF. Low Emission/OFFLEX Workshop on Offshore Energy Storage; SINTEF: Trondheim, Norway, 2021. [Google Scholar]
- DNV. Ammonia as a Marine Fuel. Available online: https://www.dnv.com/Publications/ammonia-as-a-marine-fuel-191385 (accessed on 20 May 2021).
- Costamagna, M.; Barale, J.; Carbone, C.; Luetto, C.; Agostini, A.; Baricco, M.; Rizzi, P. Environmental and economic assessment of hydrogen compression with the metal hydride technology. Int. J. Hydrogen Energy 2022, 47, 10122–10136. [Google Scholar] [CrossRef]
- Arellano, Y.; Brito, A.; Trujillo, J.; Cabello, R. Comprehensive Evaluation of Gas-Liquid Cyclonic Separation Technologies. In Computational and Experimental Fluid Mechanics with Applications to Physics, Engineering and the Environment; Springer: Berlin/Heidelberg, Germany, 2014; pp. 397–408. [Google Scholar]
- RICAS 2020. Feasibility Study and Final Conceptual Design-Deliverable D2.2. 2018. Available online: https://ec.europa.eu/research/participants/documents/downloadPublic?documentIds=080166e5bf0ca8f0&appId=PPGMS (accessed on 18 January 2021).
- Conte, M. Hydrogen economy for a sustainable development: State-of-the-art and technological perspectives. J. Power Sources 2001, 100, 171–187. [Google Scholar] [CrossRef]
- GNK Hydrogen. Metal Hydride Energy Storage. Available online: https://www.gknhydrogen.com/ (accessed on 31 May 2022).
- Ulvestad, A.; Welland, M.J.; Cha, W.; Liu, Y.; Kim, J.W.; Harder, R.; Maxey, E.; Clark, J.N.; Highland, M.J.; You, H.; et al. Three-dimensional imaging of dislocation dynamics during the hydriding phase transformation. Nat. Mater. 2017, 16, 565–571. [Google Scholar] [CrossRef]
- Nguyen, H.Q.; Shabani, B. Review of metal hydride hydrogen storage thermal management for use in the fuel cell systems. Int. J. Hydrogen Energy 2021, 46, 31699–31726. [Google Scholar] [CrossRef]
- Utgikar, V.P.; Thiesen, T. Safety of compressed hydrogen fuel tanks: Leakage from stationary vehicles. Technol. Soc. 2005, 27, 315–320. [Google Scholar] [CrossRef]
- DG Environment News Alert Service. Global Environmental Impacts of the Hydrogen Economy; European Commission DG Environment News Alert Service. 2006. Available online: https://ec.europa.eu/environment/integration/research/newsalert/pdf/39na1_en.pdf (accessed on 15 October 2021).
- Hydrogen Tools. Maintenance Requirements for Vessels. Available online: https://h2tools.org/bestpractices/maintenance-requirements-vessels (accessed on 15 September 2021).
- Linde. Hydrogen, Refrigerated Liquid Safety Data Sheet P-4603; Linde Inc.: Tonawanda, NY, USA, 2021. [Google Scholar]
- Kushnir, P. Hydrogen as an Alternative Fuel; Army Logistics University: Fort Lee, VA, USA, 2000; Volume 32, No. 3. [Google Scholar]
- Bonacina, C.N.; Gaskare, N.B.; Valenti, G. Assessment of offshore liquid hydrogen production from wind power for ship refueling. Int. J. Hydrogen Energy 2021, 47, 1279–1291. [Google Scholar] [CrossRef]
- HyUnder. Overview on All Known Underground Storage Technologies for Hydrogen. 2013. Available online: http://hyunder.eu/wp-content/uploads/2016/01/D3.1_Overview-of-all-known-underground-storage-technologies.pdf (accessed on 16 April 2020).
- Pinnangudi, B.; Kuykendal, M.; Bhadra, S. Smart Grid Energy Storage; Academic Press: Cambridge, MA, USA, 2017; pp. 93–135. [Google Scholar] [CrossRef]
- HBL. Nickel Cadmiun Vented Type Batteries. Available online: http://www.hblbatteries.com (accessed on 15 May 2021).
- Vor dem Esche, R. Safety of Flywheel Storage Systems; Stornetic: Jülich, Germany, 2016. [Google Scholar]
- Schairer, K. Flywheel Maintenance—A Checklist. Available online: https://www.qpsolutions.net/2017/08/flywheel-maintenance-a-checklist/ (accessed on 25 November 2021).
- EE Power. Capacitor Guide—Chapter 2: Supercapacitor. Available online: https://eepower.com/capacitor-guide/types/supercapacitor/# (accessed on 30 November 2021).
- Rodriguez-Garcia, G.; Weil, M. Potential Environmental Impacts of Li-ion Batteries and Supercapacitors: Toxicity of Carbon Nanotubes; The Ulm Electrochemical Talks (UECT): Ulm, Germany, 2014; Available online: https://www.researchgate.net/publication/264081052_Potential_environmental_impacts_of_Li-ion_batteries_and_supercapacitors_Toxicity_of_carbon_nanotubes (accessed on 18 May 2022).
- Weil, M.; Dura, H.; Shimon, B.; Baumann, M.; Zimmermann, B.; Ziemann, S.; Lei, C.; Markoulidis, F.; Lekakou, T.; Decker, M. Ecological assessment of nano-enabled supercapacitors for automotive applications. IOP Conf. Ser. Mater. Sci. Eng. 2012, 40, 012013. [Google Scholar] [CrossRef] [Green Version]
- Stepanov, A.; Galkin, I. Development of Supercapacitor Based Uninterruptible Power Supply. 2007. Available online: http://egdk.ttu.ee/files/kuressaare2007/Kuressaare2007_136Stepanov-Galkin.pdf (accessed on 15 June 2021).
- Use of Supercapacitors in the Marine and Offshore Industries; A. B. o. Shipping: Houston, TX, USA. 2017. Available online: https://ww2.eagle.org/content/dam/eagle/rules-and-guides/current/other/288_supercapacitors_2017/Supercapacitors_Guide_e-Dec17.pdf (accessed on 13 February 2022).
- Papadias, D.D.; Peng, J.-K.; Ahluwalia, R.K. H2@Scale: Outlook of Hydrogen Carriers at Different Scales, 2019, Presentation. Available online: https://www.energy.gov/sites/prod/files/2020/03/f72/fcto-hydrogen-carriers-workshop-2019-anl.pdf (accessed on 15 May 2022).


| KPI | Type | Description | Scale, 1–10 |
|---|---|---|---|
| Mass energy density (Wh/kg) | Quant. | Amount of energy stored in a kg of storage solution. | 1: ≤5 10: ≥30,000 |
| Energy Capacity per footprint (kWh/m2) | Quant. | Energy content of a given square metre of an energy storage solution, including the additional equipment needed to generate, store and reconvert the energy in a usable form. | 1: ≤2 10: ≥195 |
| Discharge duration | Quant. | Time of discharge of a technology at full rated capacity. | 1: seconds, 4: minutes 7: hours, 10: months |
| Response time | Quant. | The time it takes for a system to provide energy at its full rated power. | 1: hours, 5: minutes, 8: seconds, 10: milliseconds |
| Capacity (MW) | Quant. | Maximum power output. | 1: ≤0.1, 10: ≥10,000 Log scale |
| Efficiency (%) | Quant. | Percentage of recovered energy divided by the energy stored and the energy used or lost in the storage process. | 1: ≤20, 3: 21–30, 4: 31–40, 5: 41–50, 6: 51–60, 7: 61–70, 8: 71–80, 9: 81–90, 10: 91–100 |
| Safety | Qual. | Measure of the safety of deploying an energy storage solution. | 1: poor, 4: medium, 6: sufficient, 10: no impact |
| Environmental impact | Qual. | Environmental impact related to the procurement, installation, operation and decommissioning of the solution. | 1: high, 4: medium, 6: sufficient, 10: no impact |
| Maintenance requirement | Qual. | Maintenance needs of a technology over its lifetime. | 1: more than once per year, 3: yearly, 5: every three years, 8: every five years, 10: no maintenance |
| Integrability | Qual. | Feasibility of the technology to be integrated in the operational environment. | 1: full redesign required, 6: some redesign required, 10: no or minimal redesign required |
| TRL | Qual. | The Technology Readiness Level. | 1: TRL 1, 10: TRL 9 |
| Technologies | Round-Trip Efficiency (%) | Response Time | Discharge Time | Capacity (MW) | Mass Energy Density (Wh/kg) | Energy Content per Footprint (kWh/m2) | References |
|---|---|---|---|---|---|---|---|
| Lead–acid | 80–82 | msec–sec | sec–hours | 0–40 | 30–50 | 23 | [8,9,19,64,69] |
| Li-ion | 92–96 | msec–sec | min–hours | 0–100 | 100–250 | 194 | [9,19,69] |
| Ni–Cd | 60–85 | msec–sec | sec–hours | 0–40 | 40–75 | 17 | [8,19,69,70] |
| NaS | 75–90 | msec | sec–hours | 0.05–34 | 150–240 | 140 | [8,9,19,69,70] |
| Ammonia | >22 | min | hours | 0.1–1000 | 5000 | 50 | [58,59,71] |
| CAES | 45 | min | hours | 0.003–300 | 3.2–140 | 100 | [8,63,64,72] |
| HPES | 96 | min | hours | 2 | 50 | 25 | [31,73] |
| SCESS | >80 | msec–sec | sec–min | 2 | 1100 | [15,74] | |
| FEES | 78–95 | msec–min | sec–min | 0.1–20 | 5–400 | 5 | [8,63] |
| H2 MH | 15–25 | min–hours | hours | 0.3–50 | 300–964 | 91 | [8,40,75,76,77] |
| H2 gas | 25–40 | min–hours | hours | 30 | 33,000 | 95 | [37,75,76,77,78] |
| H2 Liq | 12–25 | min–hours | hours | 30 | 31,300 | 48 | [76,77,78] |
| H2 Underground | 25–40 | min–hours | months | 10,000 | 33,300 | 96 | [38,76,77,78] |
| Technologies | Safety | Environmental Impact | Maintenance | Integrability | TRL |
|---|---|---|---|---|---|
| Lead–acid |  |  |  |  |  |
| Li-ion |  |  |  |  |  |
| Ni–Cd |  |  |  |  |  |
| NaS |  |  |  |  |  |
| Ammonia |  |  |  |  |  |
| CAES |  |  |  |  |  |
| HPES |  |  |  |  |  |
| SCESS |  |  |  |  |  |
| FEES |  |  |  |  |  |
| H2 MH |  |  |  |  |  |
| H2 gas |  |  |  |  |  |
| H2 Liq |  |  |  |  |  |
| H2 Underground |  |  |  |  |  |
 High performance High performance | |||||
 Medium performance Medium performance | |||||
 Low performance Low performance | |||||
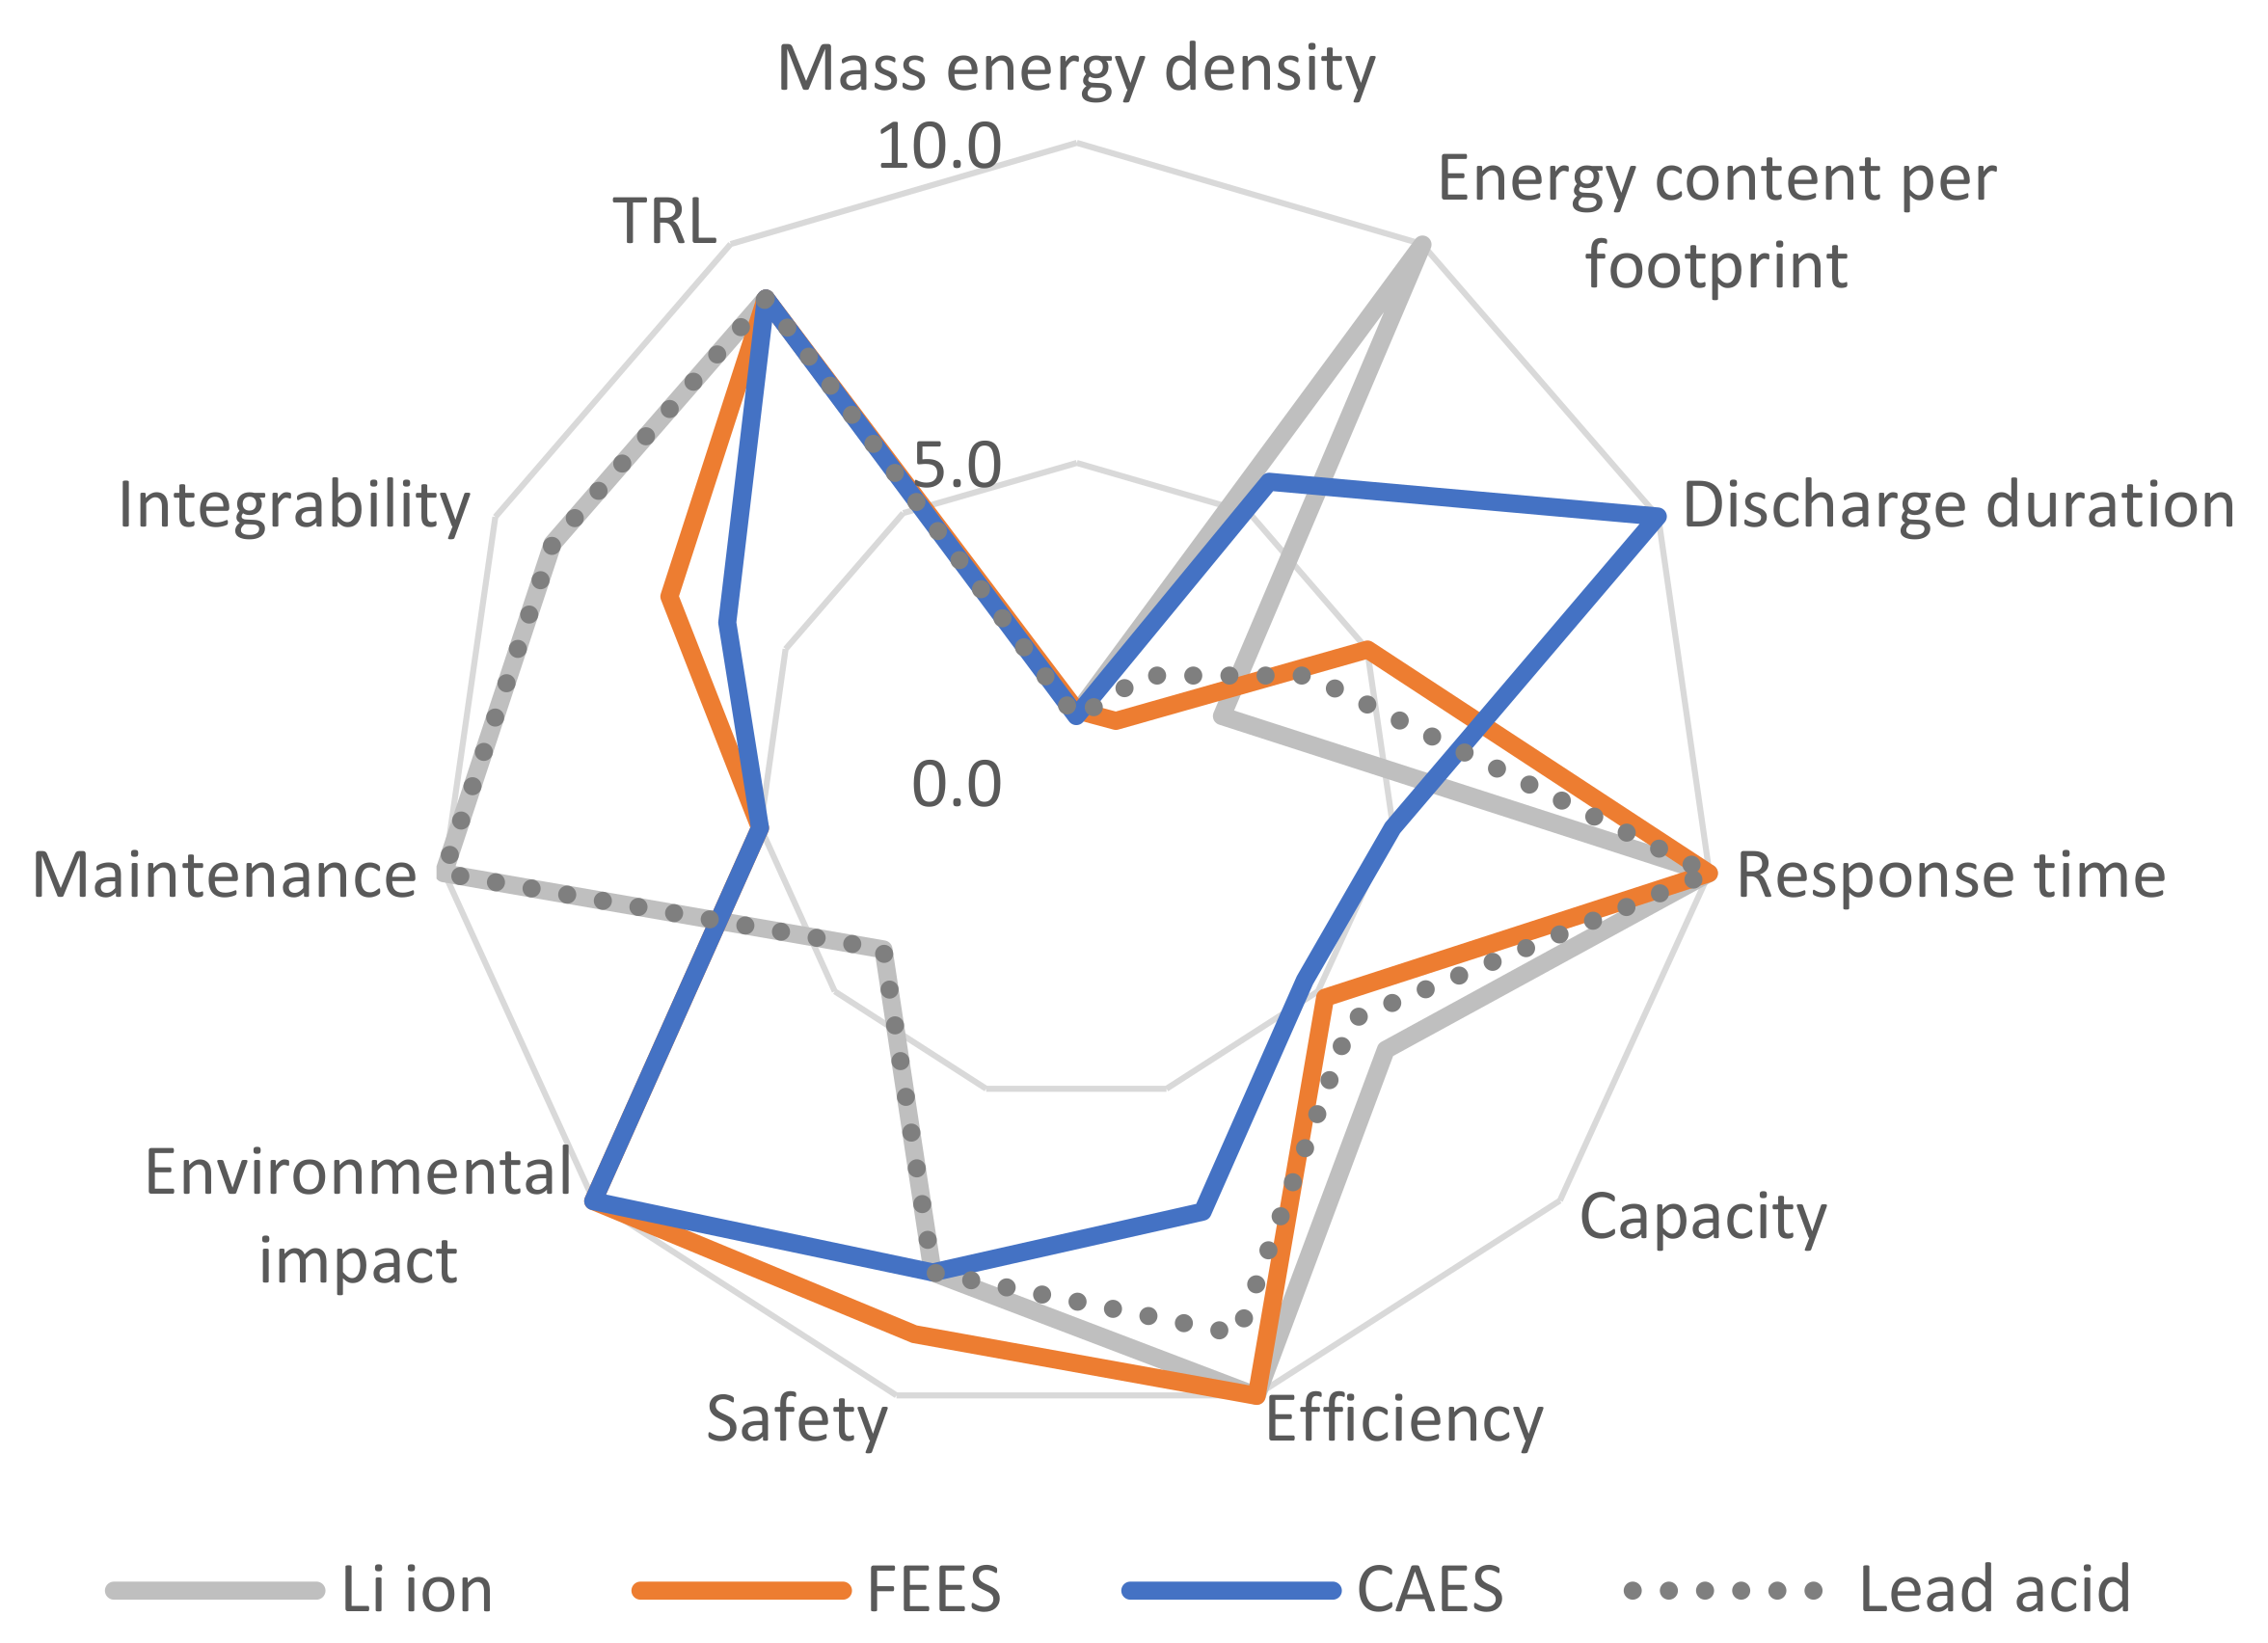
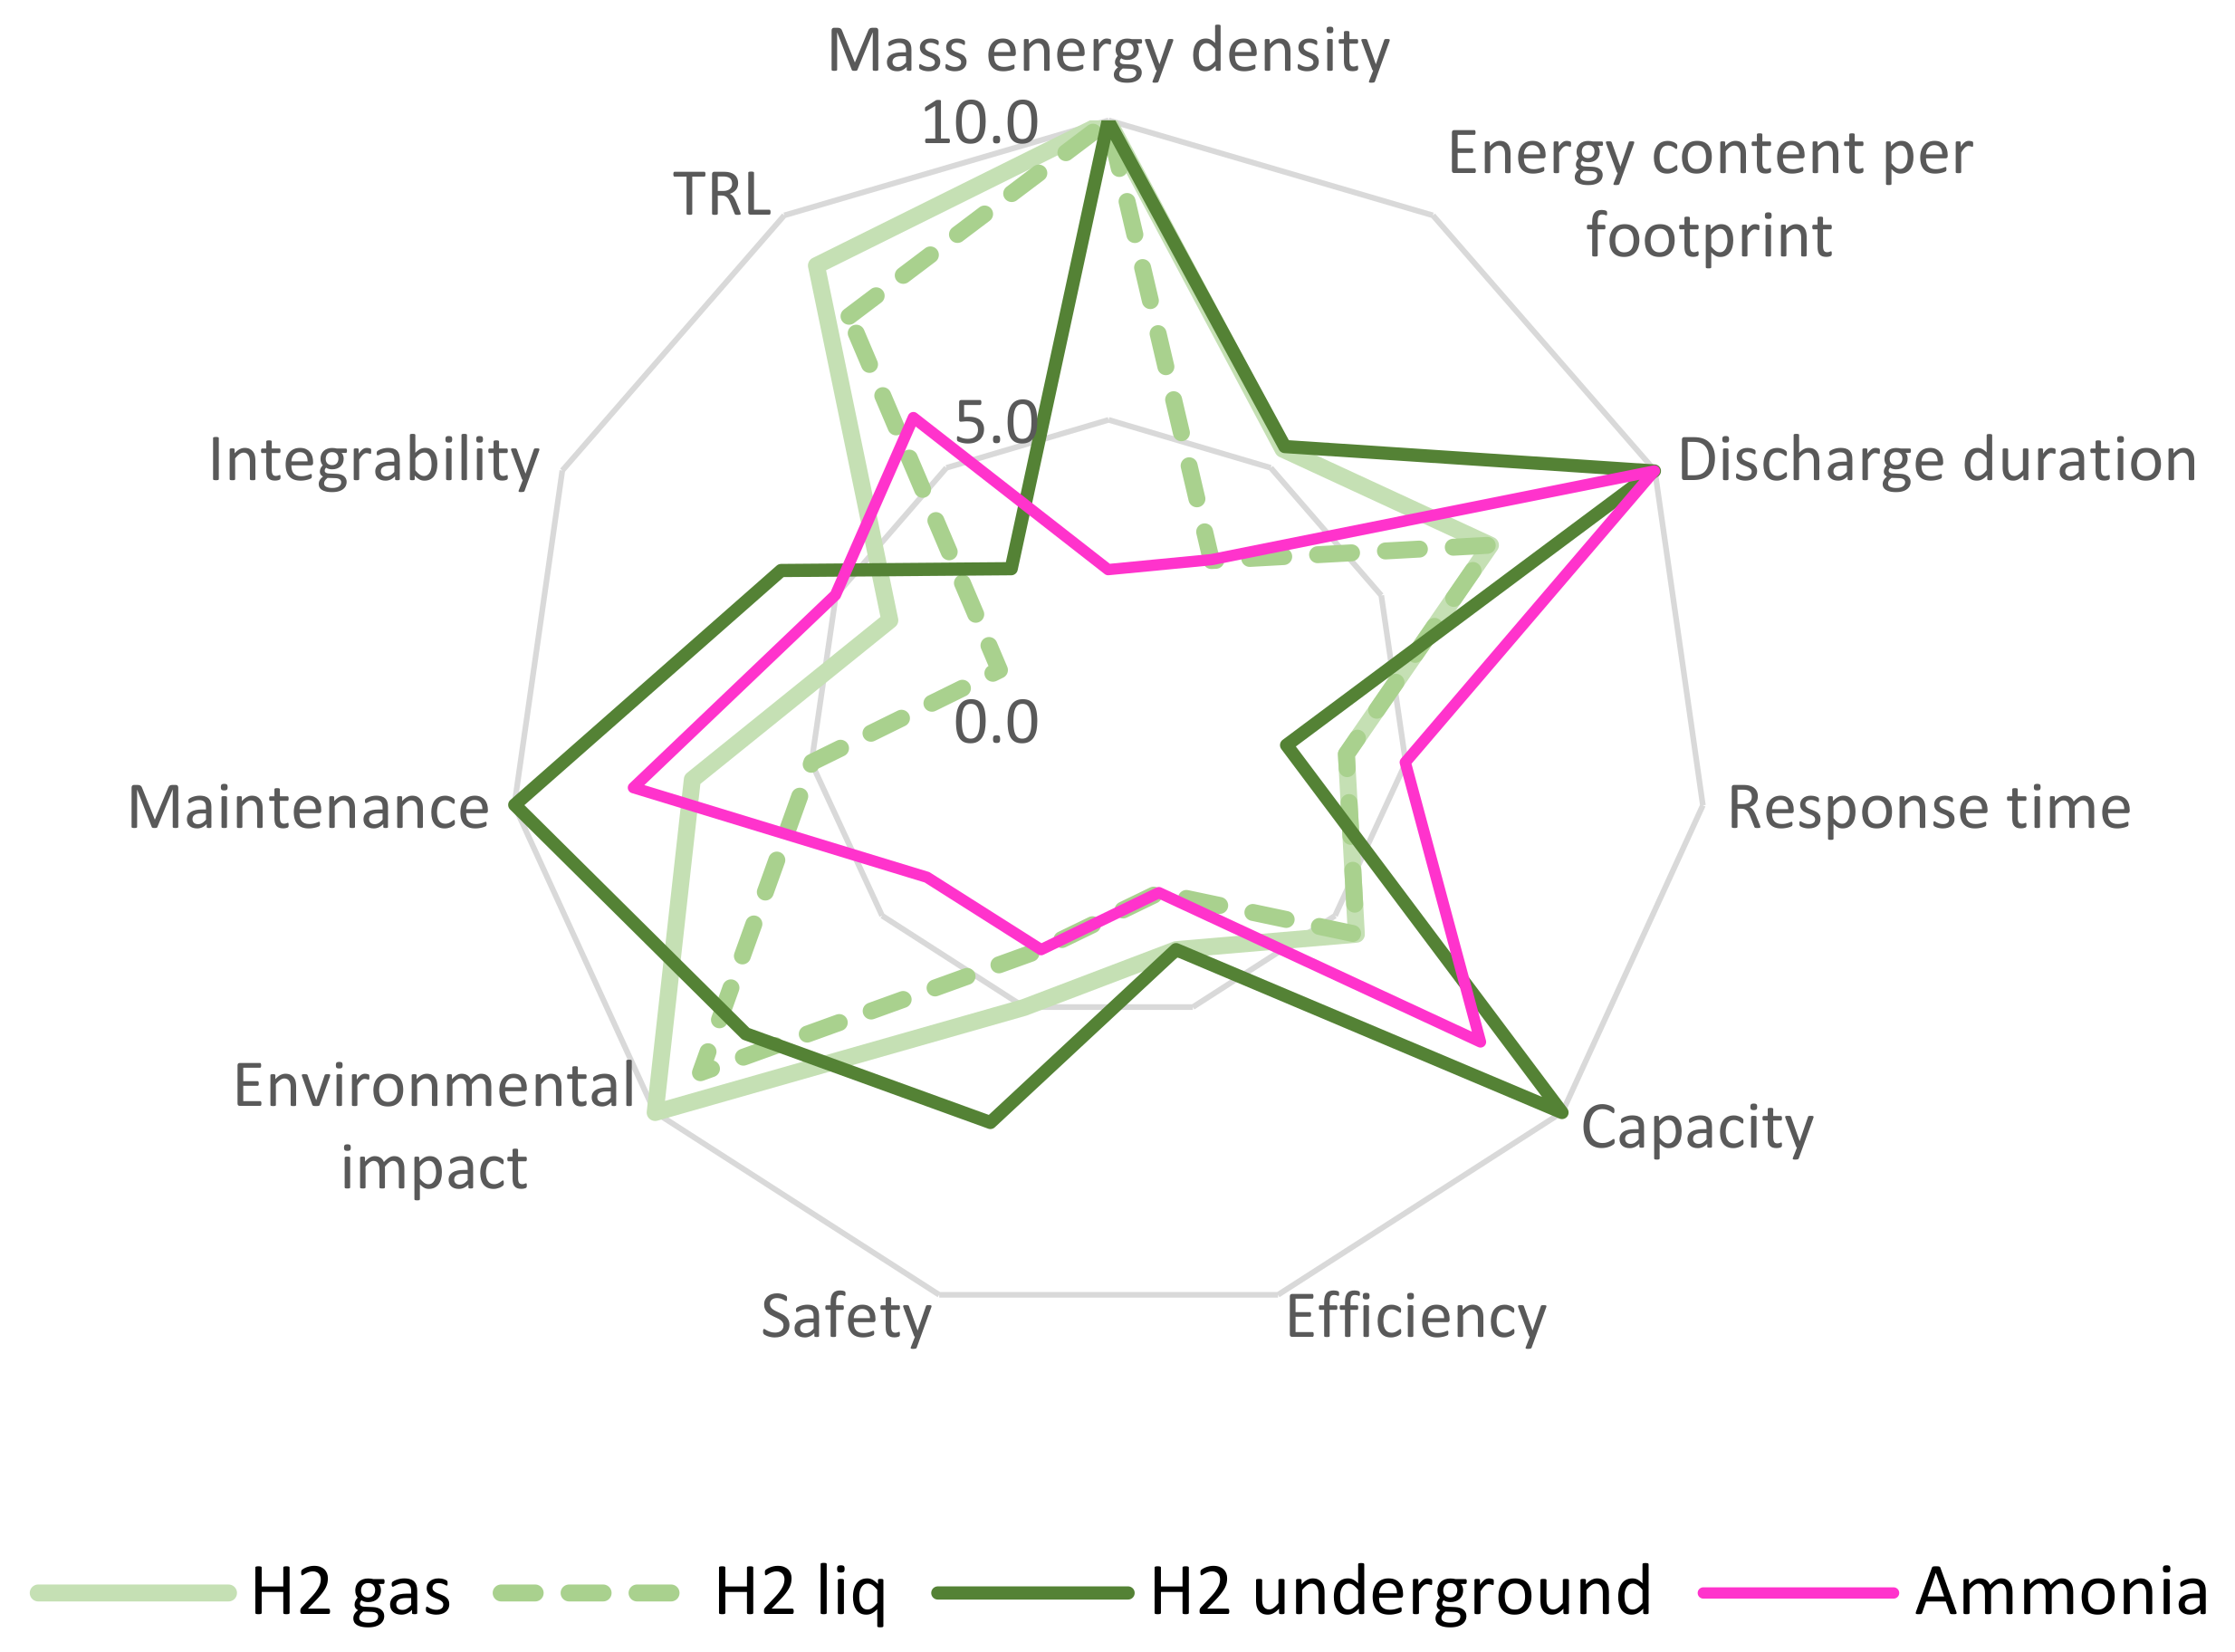
| KPI | Batteries | NH3 | CAES | HPES | SCESS | FEES | Hydrogen Storage | |||||||
|---|---|---|---|---|---|---|---|---|---|---|---|---|---|---|
| Lead–Acid | Li-Ion | Ni–Cd | NaS | MH | Gas | Liq | Undergr | |||||||
| A | Mass energy density | 1 | 1.1 | 1 | 1.1 | 2.5 | 1 | 1 | 1.3 | 1.1 | 1.3 | 10 | 10 | 10 |
| B | Energy content per footprint | 2 | 10 | 1.7 | 7.5 | 3.2 | 5.6 | 2.1 | 3 | 1.1 | 5.2 | 5.4 | 3.2 | 5.4 |
| C | Discharge duration | 4 | 2.5 | 4 | 4 | 10 | 10 | 6 | 5 | 5 | 7 | 7 | 7 | 10 |
| D | Response time | 10 | 10 | 10 | 10 | 5 | 5 | 5 | 10 | 10 | 5 | 4 | 4 | 3 |
| E | Capacity | 6 | 6 | 6 | 6 | 8 | 4.7 | 3 | 4 | 5 | 6 | 5 | 5 | 10 |
| F | Efficiency | 9 | 10 | 9 | 9 | 3 | 7 | 10 | 8 | 10 | 3 | 4 | 3 | 4 |
| G | Safety | 8 | 8 | 8 | 7 | 4 | 8 | 9 | 8 | 9 | 6 | 5 | 4 | 7 |
| H | Environmental impact | 4 | 4 | 4 | 9 | 4 | 10 | 10 | 3 | 10 | 10 | 10 | 9 | 8 |
| I | Maintenance | 10 | 10 | 10 | 8 | 8 | 5 | 8 | 10 | 5 | 8 | 7 | 5 | 10 |
| J | Integrability | 9 | 9 | 9 | 8 | 5 | 6 | 7 | 6 | 7 | 5 | 4 | 2 | 6 |
| K | TRL | 9 | 9 | 8 | 8 | 6 | 9 | 4 | 3 | 9 | 7 | 9 | 8 | 3 |
| Technology Risk | P | C | ESS | Available Risk Mitigation Measures |
|---|---|---|---|---|
| Battery failures leading to gas release, fire and explosion | 1 | 3 | Li-ion | Multiple safeguards and additional on-site mitigating factors have allowed events like this to be in the low-risk zone (likelihood between once in 100,000 years to once in 1,000,000 years) [80]. |
| Exposure to hazardous material leading to poisoning and death | 1 | 2 | Lead–acid | Use maintenance-free sealed battery with no removable caps and leak-proof containers. Keep batteries in a cool, well-ventilated area away from ignition sources. |
| Low recycling | 3 | 1 | Li-ion Lead–acid | Several projects are looking for recycling paths for some batteries. Yet, the use of hazardous materials and the diversity in the chemistry of these batteries pose a challenge. |
| Enclosure failure | 1 | 2 | FEES CAES | Safety regulations make this a rare occurrence at the cost of higher weight and additional safety features, such as pressure relief valves. |
| Poor performance in offshore environment | 2 | 1 | All | Sealed, frictionless bearings with no lubrication and little maintenance are preferred for flywheel systems offshore. Air storage in depleted reservoirs has not been tried offshore. In the short-term, air storage in tanks would be more suitable for offshore locations. Such approach avoids environmental concerns regarding excavation and the structural stability of the membrane. Thermal management systems are required to avoid poor performance at low or high temperatures of Lead–acid batteries. |
Publisher’s Note: MDPI stays neutral with regard to jurisdictional claims in published maps and institutional affiliations. |
© 2022 by the authors. Licensee MDPI, Basel, Switzerland. This article is an open access article distributed under the terms and conditions of the Creative Commons Attribution (CC BY) license (https://creativecommons.org/licenses/by/4.0/).
Share and Cite
Arellano-Prieto, Y.; Chavez-Panduro, E.; Salvo Rossi, P.; Finotti, F. Energy Storage Solutions for Offshore Applications. Energies 2022, 15, 6153. https://doi.org/10.3390/en15176153
Arellano-Prieto Y, Chavez-Panduro E, Salvo Rossi P, Finotti F. Energy Storage Solutions for Offshore Applications. Energies. 2022; 15(17):6153. https://doi.org/10.3390/en15176153
Chicago/Turabian StyleArellano-Prieto, Yessica, Elvia Chavez-Panduro, Pierluigi Salvo Rossi, and Francesco Finotti. 2022. "Energy Storage Solutions for Offshore Applications" Energies 15, no. 17: 6153. https://doi.org/10.3390/en15176153
APA StyleArellano-Prieto, Y., Chavez-Panduro, E., Salvo Rossi, P., & Finotti, F. (2022). Energy Storage Solutions for Offshore Applications. Energies, 15(17), 6153. https://doi.org/10.3390/en15176153