Article

Minimizing Energy Consumption and Powertrain Cost of Fuel Cell Hybrid Vehicles with Consideration of Different Driving Cycles and SOC Ranges

1
School of Electromechanic Engineering, North Minzu University, Yinchuan 750021, China
2
School of Electrical and Information Engineering, North Minzu University, Yinchuan 750021, China
3
Mechanical Engineering Department, University of Kansas, Lawrence, KS 66045, USA
*
Author to whom correspondence should be addressed.
Energies 2022, 15(17), 6167; https://doi.org/10.3390/en15176167
Submission received: 17 June 2022 / Revised: 5 August 2022 / Accepted: 22 August 2022 / Published: 25 August 2022

Abstract

:
Hydrogen consumption is an important performance indicator of fuel cell hybrid vehicles (FCHVs). Previous studies have investigated fuel consumption minimization both under different driving cycles and using various power management strategies. However, different constrains on battery state of charge (SOC) ranges can also affect fuel consumption dramatically. In this study, we develop a power-source sizing model based on the Pontryagin’s Minimum Principle (PMP) to minimize the fuel consumption of FCHVs, considering different driving cycles (i.e., FTP-72 and US06) and SOC ranges (conservative 50–60% and aggressive 20–80%). The different driving cycles and SOC ranges present the real-world circumstances of driving FCHVs to some extent. Fuel consumptions are compared both under different driving cycles and using different SOC ranges. The simulation results show an effective power size map, with outlines of an ineffective sizing zone and an inefficient sizing zone based on vehicle performance requirements (e.g., maximum speed and acceleration) and fuel consumption, respectively. Based on the developed model, an optimal power-source size map can be determined while minimizing both fuel consumption and powertrain cost as well as considering different driving cycles and SOC ranges.

1. Introduction

With the rising demand for lowering carbon footprint, fuel cell hybrid vehicles (FCHVs) that possess good energy efficiency and fuel costs, are being developed as possible alternative transportation vehicles to minimize the adverse environmental impacts of excessive energy consumption. FCHVs have shown to be a promising solution for a more sustainable, next-generation transportation system due to the existence of an on-board hydrogen tank as the main supplier of the energy, thus producing only water and heat at the tailpipe [1,2,3,4]. Furthermore, FCHVs enable longer driving ranges and faster refueling compared to conventional battery electric vehicles (BEVs) [5,6,7]. However, the powertrain and operation costs of hydrogen fuel cells hinder the wide commercialization of FCHVs. According to recent investigations, each fuel cell and battery costs $800/kW [8] and $831.5/kWh [9], respectively. A fuel-cell hybrid system consists of hundreds of fuel cells and batteries, which causes the powertrain cost of FCHVs to be expensive. Meanwhile, the high cost of hydrogen ($13.14/gallon [10]) leads to the high operation cost of FCHVs. For this reason, many investigations have been conducted to study the fuel consumption of HCHVs in order to improve the overall performance, fuel cost and driving range of vehicles. For this purpose, in order to reduce fuel consumption, different power management strategies have been adopted in FCHVs. Yun et al. [11] proposed a novel stiffness coefficient model for a prototype FCHV, which improved the fuel costs by 5.18% while maintaining power balance and stable control. In regard to diverse actual driving conditions, Lqbal et al. [12] proposed a frequency separation method to improve fuel costs and lifespan. Moreover, references [2,13,14,15,16] focused on combining intelligent algorithms for optimization of energy management strategies. To further improve the robustness and adaptability of power management strategies, references [4,17,18,19,20,21,22] studied the enhancement and controllability of these strategies. A key step in designing an optimal HEV control strategy for blended regime corresponds to the synthesis of the battery SOC reference trajectory [23]. Xiao et al. [24] proposed a strategic approach to maximize the efficiency of energy use by controlling the state of safety (SOS) of the battery’s state of charge. In this context, recently, optimal control strategies based on the Pontryagin’s Minimum Principle (PMP) have been widely used to minimize the fuel consumption and power system costs based on the optimality of the solution and the real-time nature of the computation [8,25,26,27,28]. Following a PMP approach, Zheng et al. [8] resolved the SOC constrain problem and increased the fuel cell lifespan by introducing a cost function. Song et al. [25] presented a real-time estimated optimal energy management strategy based on PMP to determine the approximate optimal hydrogen consumption by controlling the state of charge of batteries within a certain range for various driving conditions. Cristian et al. [29] investigated the fuel consumption of hybrid electric vehicles (HEVs) under different driving cycles using different power management strategies. Furthermore, in addition to energy management strategies, power-source sizing has an impact on fuel consumption and powertrain costs [1,30,31,32,33,34,35,36,37,38]. Liu et al. [30] developed a power-source sizing model for FTP-72 driving conditions to compare and analyze the total powertrain cost, battery life, battery energy loss, and fuel consumption with and without battery current constraints for different effective power-source sizes. Hou et al. [33] compares and analyzes the battery size optimization and energy management strategies based on dual-loop DP and CP in NEDC and UDDS, considering the fuel-cell transient response constraint, using the Dongfeng X37 model as the research object. Ceschia et al. [39] evaluated the reliability of fuel cell hybrid electric vehicles; a method of linear trend extrapolation of battery SOH based on date test analysis was proposed to study the correlation between energy constraints and reliability under different driving cycles and operating conditions, which showed that the battery lifetime loss was affected by the dynamic range.
These studies show that different energy management strategies and battery sizes have a correlation with fuel consumption, especially in evaluating the power management strategies. Two factors that can significantly affect the fuel consumption should also be taken into consideration: driving condition and battery state of charge (SOC) range. When the vehicle operates in urban and non-urban areas, the fuel consumption can significantly vary in each case, which ultimately affects the power-source sizing design of FCHVs. In the meanwhile, SOC range constraint determines the amount of power that can be obtained from the battery pack, and the amount of power extracted from the battery pack can have a significant impact on fuel consumption. As a major power-source component, battery SOC range constraint also plays a critical role in determining fuel consumption and powertrain cost.
To address the aforementioned challenges, this study attempts to investigate fuel consumption minimization considering different driving cycles and SOC range constraints. For this purpose, we constructed the vehicle drivetrain model, compared the fuel consumption under different driving cycles and SOC ranges, and used the PMP to optimize the power distribution between fuel cell and battery. Moreover, the results of this investigation determined the effective power-source size distribution map, fully utilized the power performance of fuel cell and battery system and improved the fuel economy.

2. Materials and Methods

2.1. Vehicle Drivetrain Model

In the proposed vehicle drivetrain model, the variations in vehicle powertrain mass are taken into account. The required motor power is calculated at each time step with the given vehicle speed. In order to get a better vehicle performance, a PMP-based power management strategy is used that optimizes the power split between batteries and fuel cells in order to obtain necessary motor power.
Motor speed N can be described by Equation (1) [30]:
N = V e i o i g 60 η 2 π R w
where, V e is the velocity of vehicle, io represents the final drive ratio, i g represents the transmission gear ratio, R w is the radius of wheel, and η is the efficiency of drivetrain.
The air drag force F d , rolling resistance force F r , acceleration force F a and total force F t of the vehicle can be expressed by Equations (2)–(5) [30]:
F d = ρ air A C d V e 2 2
F a = V e T M e
F r = μ M e g
F t = F r + F a + F d
where, ρ air is the density of air, A is the front area of vehicle, C d is the drag coefficient, M e is the mass of vehicle, μ represents the rolling resistance coefficient, and g is the gravitational acceleration.
The torque T m and required power P m of motor can be calculated using Equations (6) and (7) [30]:
T m = F t R w i o i g
P m = 2 π N T m 60 1000 η motor
where R w is the radius of wheel, η motor is the efficiency of motor. In the FCHVs, the required motor power P m comes from both fuel-cell stack power output P fcs and battery pack power output P batt .
P m = P fcs + P batt
P fcs is the control variable in this study.   P fcs and P batt are calculated using PMP-based power split control described in the following Section 2.2.

2.2. PMP-Based Power Management Strategy

In this investigation, PMP optimal control is used to optimize the power split between fuel cells and batteries in FHCVs. The control variable of fuel-cell power output P fcs is determined by the PMP management strategy at each time to minimize the fuel consumption.
In order to calculate the fuel consumption rate with each given P fcs , the corresponding fuel-cell stack current needs to be derived. The relationship between fuel-cell stack current and the FCS net power can be found in reference [8]. The fuel consumption rate is a function of stack current, as indicated by Equation (9):
m ˙ H 2 = N cell M H 2 I stack γ n F
where, m ˙ H 2 is the fuel consumption rate (g/s), M H 2 is the molar mass of hydrogen (g/mol), N cell is the number of cells, I stack is the stack current (A), γ is the hydrogen excess ratio, n is the number of electrons acting in the reaction, and F is the faraday constant.
A battery internal resistance model [8] is adopted to calculate the rate of SOC of the battery, which can be expressed as below:
SOC ˙ = V SOC V SOC 2 4 R SOC P m P fcs 2 R Q bat
In this equation, SOC ˙ is the rate of SOC, Q batt is the rate of battery capacity and P fcs is the fuel-cell power output, which is a control variable in the PMP optimal control. V and R stand for the open circuit voltage and internal resistance. They are both related to the battery SOC, and the characteristics of V-SOC and R-SOC are provided by the battery manufacturing company [9]. This equation shows the relationship between the SOC and the control variable P fcs . It is the state equation for this control problem.
Equation (10) is a constraint of the control system, which shows the relationship between the control variable P fcs and the state variable SOC . Equation (10) can be expressed as a general function f [30]:
SOC ˙   t = f   SOC t , P fcs t ,   t
Equation (11) is the state equation of PMP optimal control. State variable SOC ˙ t is a function of battery SOC t , P fcs t and time t. Using the above expressions, the Hamiltonian function of PMP optimal control can be defined as below [30]:
H = m ˙ H 2 P fcs t + p t SOC ˙ t + S
The Hamiltonian function here is adopted to solve the optimal control problem. The first term ( m ˙ H 2 P fcs t is the optimal control objective with the purpose of minimizing the hydrogen consumption rate. The second component in the equation consists of the state equation, SOC ˙ t , and the Lagrange multiplier p which is the co-state. The cost function of battery SOC constraint S is defined by the equation below [30]:
S = α P fcs t ,     SOC t     SOC min       β P fcs t ,     SOC t SOC max                             0 ,                                                               Otherwise
where, α and β a are constant values defined as turning parameters. Once the SOC crosses its upper/lower boundary, SOC constraint starts to be involved in the PMP optimal control and less/more power will be distributed from the fuel cell system to make sure battery SOC stays in its operation range due to the imposed SOC constraint. For the aggressive SOC range, the SOC min equals to 0.2, and SOC max equals to 0.8. For the conservative SOC range, SOC min equals to 0.5, and SOC max equals to 0.6.
H p = SOC ˙
H SOC ˙ = p ˙
H P fcs = 0
Equations (14)–(16) describe the conditions that need to be included in the model. The first necessary condition (Equation (14)) is the state equation which shows the relationship between P fcs and SOC ˙ . The second condition (Equation (15)) is the dynamic equation of co-state that deals with determining the co-state p. The third condition (Equation (16)) implies that the control variable P fcs needs to minimize the Hamiltonian function at each time step. We can rewrite the third condition (Equation (16)) as below:
H SOC ˙ t , P fcs t , t   H SOC ˙ t , P fcs t * , t
In Equation (17), P fcs t * is the optimal fuel-cell power output at each time step, which can be found from admissible P fcs . The admissible P fcs is determined by the fuel-cell stack size of the FCHV. The P fcs that causes the minimal value from Equation (12) is the optimal fuel-cell power output at this time step. Following such a procedure, the optimal fuel-cell power output at each time step to minimize the fuel consumption of FHCVs can be obtained.

3. Results

The system considered in this study is not the typical fuel cell hybrid electric vehicle with a standard electric motor and a single gear for the design purpose of simplicity and low cost. Inspired by the reference [40], to further optimize motor propulsion and traction, and minimize fuel consumption and efficiency, we used an electric drive system consisting of battery, motor, inverter, changeable or fixed gear, and differential gear. In addition, In this study, the change of vehicle powertrain mass is considered, where the masses of the fuel cell and battery are 335 g/cell and 0.013· P fcs 0.867 kg, respectively. The simulation parameters are shown in Table 1.

3.1. Effective Power Source Size

The powertrain configurations of FCHVs are chosen from the red region in the effective power-source map, as shown in Figure 1. The low boundary of the map is selected by two constraints, i.e., the maximum speed of 120 km/h and the 0–100 km/h acceleration time of 12 s. Another constraint is that FCHVs should be able to store the kinetic energy of the vehicle in the battery pack during vehicle braking, thus a threshold number of batteries is needed to meet this constraint. In order to avoid increasing the powertrain cost, the upper boundary of the battery number and fuel cell is set as 200 and 150 kW, respectively. From Figure 1, it can be seen that the battery selection range for the above constraint is 60~200, and the fuel cell selection range is 62~150.
The different power-source combinations are tested under FTP-72 and US06 driving cycles to compare hydrogen consumption and powertrain costs using different SOC constraints.
Aggressive SOC with a range of 0.2–0.8 is applied, which is shown in Figure 2a,c. The initial value of battery SOC in both cases starts at 0.8 and the final measured SOC is at 0.44 and 0.22, respectively. The difference between the final SOC is due to the highway driving condition, which needs higher power output from the power sources. Hence, the battery SOC in Figure 2c drops to the 0.22 mark. Under the urban driving condition (Figure 2a), FCHVs operate with relatively lower speed, and less power output than normal is needed to be obtained from battery pack.
Conservative SOC with a range of 0.5–0.6 is considered and shown in Figure 2b,d, with an initial value of battery SOC in both tests of 0.6. Due to the small SOC range, although different driving cycles are applied, the final SOCs in Figure 2b,d both end at 0.5. The fuel cell that provides most of power to drive the vehicle after battery SOC reaches its lower boundary.

3.2. Comparison of Fuel Consumption

As shown in Figure 3, fuel consumption has a rising tendency with increasing size of power sources, but a different value of fuel consumption can be observed in each figure. In Figure 3a, the minimal fuel consumption is 89.4 g at (200, 62) (battery size [unit cell], fuel cell size [kW]) and the maximum fuel consumption is 148.4 g when the power-source combination is (200, 150). In Figure 3b, the fuel consumption is analyzed under the same driving condition, similar to Figure 3a, but with a conservative battery SOC range. For this case, the minimal fuel consumption is observed to be 113.6 g at (200, 62). The maximum fuel consumption is 420.5 g at (200, 150). Similar to Figure 3a,b, in Figure 3c,d, the minimal and maximum points are still at (200, 62) and (200, 150), respectively. The minimal fuel consumption is 147 g and 148.9 g at (200, 150) in Figure 3c,d, respectively. The maximum fuel consumption is 216.6 g in Figure 3c and 831.1 g in Figure 3d.
When the driving condition and SOC range are the same, the fuel consumption slightly increases with the battery size. For example, if we set the fuel cell size to 150 kW, according to the graph shown in Figure 3b, the fuel consumption reaches 388.2 g at (60, 150). Similarly, when the battery size increases to 200 units, the fuel consumption is equal to 420 g at location (200, 150). Hence, an additional 31.8 g hydrogen is consumed when the battery size increases from 60 units to 200 units. However, the fuel consumption significantly increases by enlarging the fuel cell size. For example, in Figure 3b, if the battery size is selected as 160 units, the fuel consumption is 141 g at (160, 80) and 409.7 g at (160, 150). Also, 268.7 g more hydrogen is consumed when fuel cell size increases from 80 kW to 150 kW. This observation can be attributed to the fact that in instances that the fuel cell is heavier than the battery cell; according to Table 1, each battery cell is 0.335 kg/cell and there is only a 46.9 kg mass change when the battery size changes from 60 units to 200 units. However, according to fuel cell mass, which equals to 0.013· P fcs 0.867 kg, P fcs [w] is the fuel cell power output with a 167.9 kg mass change when fuel cell size changes from 80 kW to 150 kW. Also, larger fuel cell size allows for a bigger power output, which leads to higher fuel consumption (Equation (9)).
Under the FTP-72 driving cycle, the maximum fuel consumption in Figure 3b, is 2.8 times higher than the one in Figure 3a. Under the US06 driving cycle, the maximum fuel consumption in Figure 3d is 3.8 times higher than that in Figure 3c. Hence, the high-speed driving condition will cause more substantial fuel consumption in FCHVs. Furthermore, excessive battery SOC range allows for more power consumption in the battery during the driving cycle. Therefore, less power output from the fuel cell leads to lower fuel consumption. Conversely, applying a conservative SOC range leads to more power consumption from the fuel cell, thus the fuel consumption in Figure 3b,d is much higher.
If a FCHV needs to be designed to have fuel consumption less than 200 g in both FTP-72 and US06 driving cycles, we can apply the fuel consumption distribution maps in Figure 3 to acquire new power-source sizing maps (Figure 4). For the FTP-72 driving cycle, based on Figure 4a, it is witnessed that the fuel consumption of all the effective combinations are under 200 g. Hence, the power-source combination can be selected in the entire effective region. On the other hand, when a conservative SOC range is applied, as shown in Figure 4b, part of the effective region has fuel consumption higher than 200 g. Thus, we can conjecture that the region has fuel consumption higher than 200 g as the inefficient region, which means that the power-source combinations chosen from this region cannot meet the fuel consumption requirement. By applying this method to define inefficient sizing region in Figure 4c,d, we found that the effective region shrinks further when highway driving cycle and conservative SOC range are applied. In Figure 4d, most of the efficient power-source sizing region becomes the inefficient region. This results as the highway driving condition has an average speed of 77.89 km/h (the average speed is 31.54 km/h in FTP-72 urban driving cycle) and needs more power output, and when SOC crosses its upper and lower bounds, the SOS constraint is involved in the PMP optimal control according to Equations (12) and (13). Thus, the power management strategy distributes more power from the fuel cell stack. Therefore, higher fuel consumption is observed in Figure 4d.

3.3. Comparison of Powertrain Cost

Powertrain cost [ $ 10 3 ] equals total battery pack cost plus total fuel cell stack cost. Without considering the inefficient area cost, the powertrain cost was calculated for a conservative SOC range and the FTP-72 driving cycles. Table 2 shows the different powertrain costs of each power-source combination. The table shows that the powertrain cost increases with fuel cell and battery size. The larger fuel cell provides more power output but is often accompanied by higher fuel consumption and high cost, while the smaller fuel cell size costs less but more of the power output comes from the battery and the endurance capacity lacks. Therefore, the combination of effective power-source size should be a comprehensive consideration of cost, endurance capacity, fuel economy and other factors to select a reasonable size.

4. Conclusions

This study investigated the variation of the mass of the vehicle powertrain as well as power-source dimensions of the fuel cell hybrid vehicle based on Pontryagin’s Minimize Principle. Based on the results, the major conclusions can be drawn as follows:
(1)
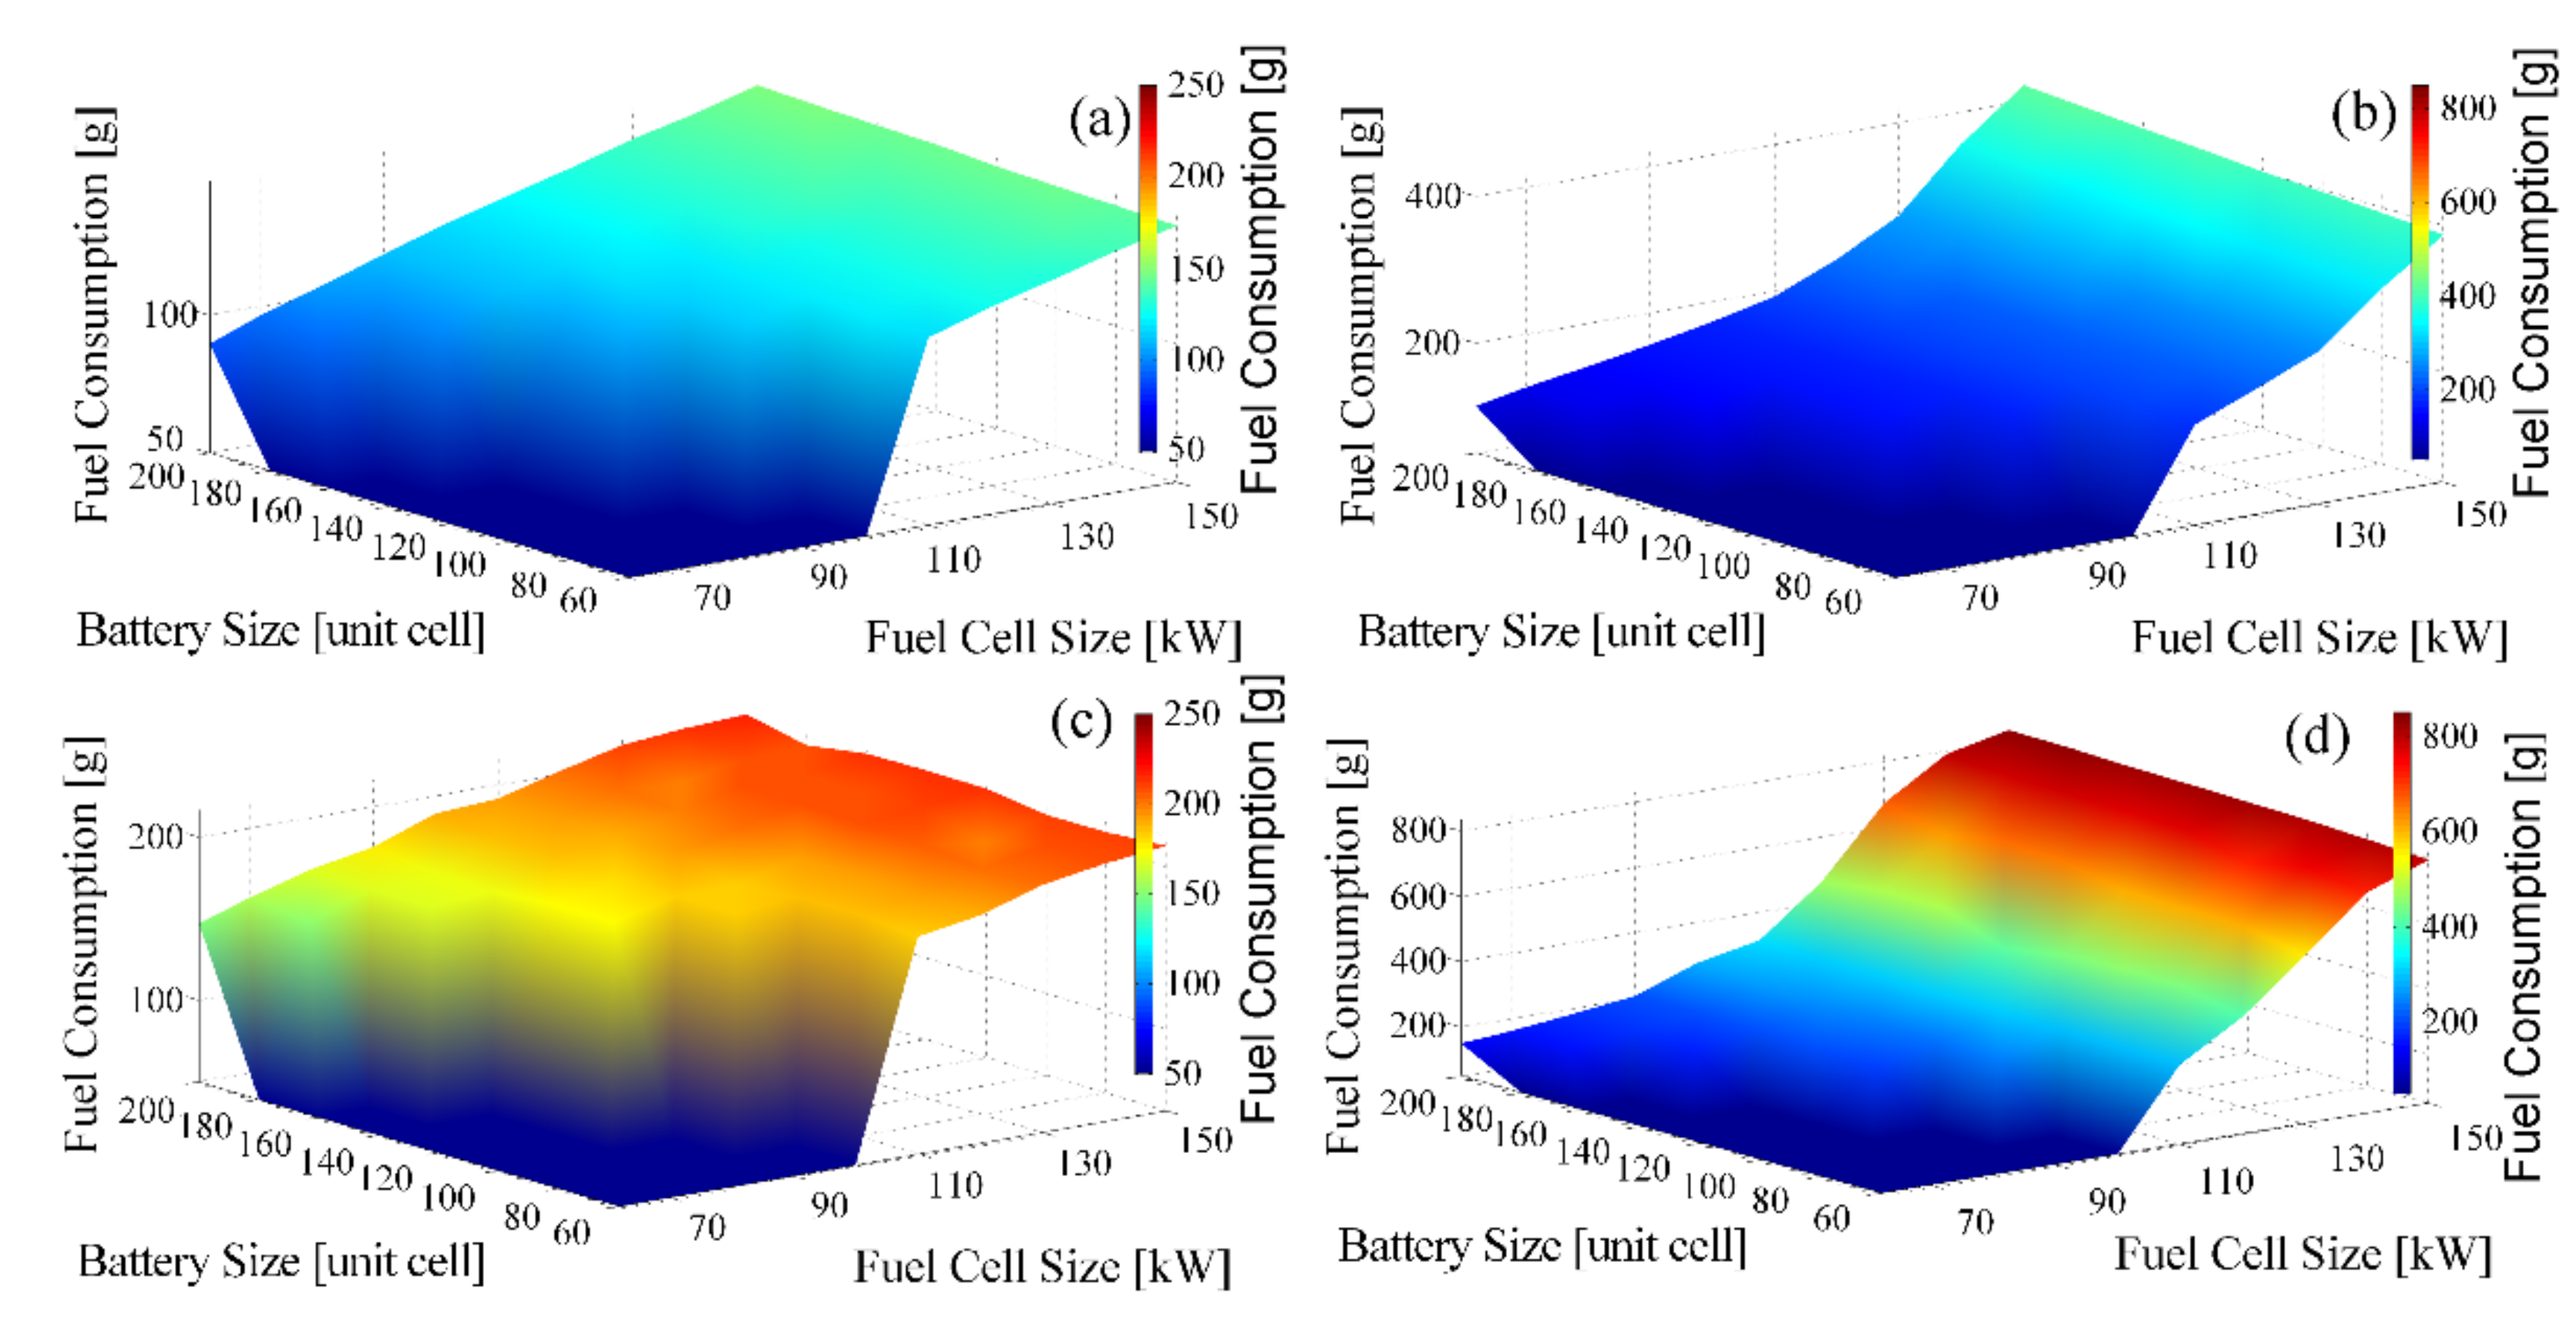
The article compares the fuel consumption and power cost for different energy source combinations at different SOC ranges (aggressive: 0.2–0.8, conservative: 0.5–0.6) for different driving cycles. The simulation results have revealed that fuel consumption of the aggressive SOC range at a power-source combination of (200,150) (battery size [unit], fuel cell size [kW]) is approximately 3.8 times higher than that of the conservative SOC range for the same driving cycle.
(2)
To find the effective power-source combinations, based on the entire vehicle powertrain model, PMP optimal control was used to determine the power-source size according to the minimum fuel consumption corresponding to the optimal power output of the FCHV at the time of calculation. The simulation results have shown that the power-source size is positively correlated with fuel consumption for the same driving cycle and SOC range, and the effect of fuel cell size on fuel consumption is more significant than that of the battery.
In conclusion, this paper based on the Pontryagin’s Minimize Principle derived the new effective power size map, and in order to achieve good fuel economy, the power-source combination needs to be selected in the region of high-efficiency power-source size, which provides a feasible method for other power-source combination selections.
In the future, we will consider the impact of different battery sizes and fuel cells on fuel consumption after degradation in our next project. In addition, temperature changes will affect the power output of the battery, and this factor will be considered in the energy management strategy study in our future work.

Author Contributions

Conceptualization, Y.G., Y.L. and S.K.H.; Methodology, C.L.; Software, C.L. and S.K.H.; Validation, C.L., Y.G. and S.K.H.; Formal analysis, Y.G. and S.K.H.; Investigation, B.B. and Y.L.; Resources, B.B. and Y.L.; Data curation, C.L.; Writing—original draft preparation, C.L.; Writing—review and editing, F.W. and S.K.H.; Visualization, C.L.; Supervision, B.B. and Y.L.; Project administration, Y.G.; Funding acquisition, F.W. All authors have read and agreed to the published version of the manuscript.

Funding

This research was funded by key research projects of North Minzu University in 2019 (Grant No. 2019KJ35); lateral research projects of North Minzu University in 2019 (Grant No. 2019H LZ09).

Data Availability Statement

Not applicable.

Conflicts of Interest

The authors declare no conflict of interest.

Abbreviations

Avehicle front area
cturning parameter
d air air density
d eff effective discharge
F a acceleration force
F d air drag force
F t vehicle traction force
Ffaraday constant
H Hamiltonian function
Ibattery operation current
I stack Stack current
Mvehicle mass
m . H 2 fuel consumption rate
N cell number of cells
nthe number of electrons acting in the reaction
Nmotor speed rpm
pco-state
Pbattbattery power output
P fcs net power
P m required of motor
P motor required motor power
P stack fuel cell stack power
R w wheel radius
Rbattery internal resistance
S SOC constraint cost function
SOCstate of charge
SOC ˙ rate of state of charge
T m torque of motor
T time step
Vbattery open circuit voltage
η m o t o r motor efficiency
μ rolling resistance coefficient
η drivetrain efficiency
β turning parameters
α turning parameters
γ Hydrogen excess ratio

References

  1. Palani, S.; Subramanian, S.C.; Chetty, R. Component Sizing Based on Multi-Objective Optimization for a Fuel Cell Hybrid Vehicle. In Proceedings of the 6th International Conference on Control, Decision and Information Technologies (CoDIT), Paris, France, 23–26 April 2019; pp. 434–439. [Google Scholar] [CrossRef]
  2. Lü, X.; Wu, Y.; Lian, J.; Zhang, Y.; Chen, C.; Wang, P.; Meng, L. Energy management of hybrid electric vehicles: A review of energy optimization of fuel cell hybrid power system based on genetic algorithm. Energy Convers. Manag. 2020, 205, 112474. [Google Scholar] [CrossRef]
  3. Lipman, T.E.; Elke, M.; Lidicker, J. Hydrogen fuel cell electric vehicle performance and user-response assessment: Results of an extended driver study. Int. J. Hydrogen Energy 2018, 43, 12442–12454. [Google Scholar] [CrossRef]
  4. Jondhle, H.; Nandgaonkar, A.B.; Nalbalwar, S.L.; Kadam, P.; Jondhle, S. A Novel Control Approach for Fuel Cell Hybrid Electric Vehicle. In Proceedings of the 2021 International Conference on Communication, Control and Information Sciences (ICCISc), Idukki, India, 16–18 June 2021; pp. 1–5. [Google Scholar] [CrossRef]
  5. Du, Z.; Zhan, H. Analysis of Related Technologies Used in Fuel Cell Vehicles. J. Phys. Conf. Ser. 2021, 2125, 012011. [Google Scholar] [CrossRef]
  6. Hosseinpour, J.; Chitsaz, A.; Liu, L.; Gao, Y. Simulation of eco-friendly and affordable energy production via solid oxide fuel cell integrated with biomass gasification plant using various gasification agents. Renew. Energy 2020, 145, 757–771. [Google Scholar] [CrossRef]
  7. Liu, C.; Gao, Y.; Liu, L. Toward safe and rapid battery charging: Design optimal fast charging strategies thorough a physics-based model considering lithium plating. Int. J. Energy Res. 2020, 45, 2303–2320. [Google Scholar] [CrossRef]
  8. Zheng, C.; Cha, S.W.; Park, Y.-I.; Lim, W.S.; Xu, G. PMP-based power management strategy of fuel cell hybrid vehicles considering multi-objective optimization. Int. J. Precis. Eng. Manuf. 2013, 14, 845–853. [Google Scholar] [CrossRef]
  9. LiFePO4 40152S Cell: 3.2V 15 Ah, 150A Surge Rate, 48Wh with 6M Screw Terminal—UN38.3 Passed. 2022. Available online: https://www.batteryspace.com/lifepo4-40152s-cell-3-2v-15-ah-150a-surge-rate-48wh-with-6m-screw-terminal---un38-3-passed.aspx (accessed on 23 August 2022).
  10. Sampson, J. New California Hydrogen Station Retailing at $13.14/kg. 2021. Available online: https://www.h2-view.com/story/new-california-hydrogen-station-retailing-at-13-14-kg/ (accessed on 23 August 2022).
  11. Yun, H.; Liu, S.; Zhao, Y.; Xie, J.; Liu, C.; Hou, Z.; Wang, K. Energy management for fuel cell hybrid vehicles based on a stiffness coefficient model. Int. J. Hydrogen Energy 2015, 40, 633–641. [Google Scholar] [CrossRef]
  12. Iqbal, M.; Ramadan, H.S.; Becherif, M. Health-aware frequency separation method for online energy management of fuel cell hybrid vehicle considering efficient urban utilization. Int. J. Hydrogen Energy 2021, 46, 16030–16047. [Google Scholar] [CrossRef]
  13. Ahmadi, S.; Bathaee, S. Multi-objective genetic optimization of the fuel cell hybrid vehicle supervisory system: Fuzzy logic and operating mode control strategies. Int. J. Hydrogen Energy 2015, 40, 12512–12521. [Google Scholar] [CrossRef]
  14. Chen, Z.; Guo, N.; Zhang, Q.; Shen, J.; Xiao, R. An Optimized Rule Based Energy Management Strategy for a Fuel Cell/Battery Vehicle. In Proceedings of the 2017 IEEE Vehicle Power and Propulsion Conference (VPPC), Belfort, France, 11–14 December 2017; pp. 1–6. [Google Scholar] [CrossRef]
  15. Liu, Y.; Liu, J.; Zhang, Y.; Wu, Y.; Chen, Z.; Ye, M. Rule learning based energy management strategy of fuel cell hybrid vehicles considering multi-objective optimization. Energy 2020, 207, 118212. [Google Scholar] [CrossRef]
  16. Li, W.; Ye, J.; Cui, Y.; Kim, N.; Cha, S.W.; Zheng, C. A Speedy Reinforcement Learning-Based Energy Management Strategy for Fuel Cell Hybrid Vehicles Considering Fuel Cell System Lifetime. Int. J. Precis. Eng. Manuf. Technol. 2021, 9, 859–872. [Google Scholar] [CrossRef]
  17. Zeng, T.; Zhang, C.; Zhang, Y.; Deng, C.; Hao, D.; Zhu, Z.; Ran, H.; Cao, D. Optimization-oriented adaptive equivalent consumption minimization strategy based on short-term demand power prediction for fuel cell hybrid vehicle. Energy 2021, 227, 120305. [Google Scholar] [CrossRef]
  18. Teng, T.; Zhang, X.; Dong, H.; Xue, Q. A comprehensive review of energy management optimization strategies for fuel cell passenger vehicle. Int. J. Hydrogen Energy 2020, 45, 20293–20303. [Google Scholar] [CrossRef]
  19. Zheng, C.; Li, W.; Xiao, Y.; Zhang, D.; Cha, S.W. A Deep Deterministic Policy Gradient-Based Energy Management Strategy for Fuel Cell Hybrid Vehicles. In Proceedings of the 2021 IEEE Vehicle Power and Propulsion Conference (VPPC), Gijon, Spain, 25–28 October 2021; pp. 1–6. [Google Scholar] [CrossRef]
  20. Zhao, Z.; Wang, T.; Li, M.; Wang, H.; Wang, Y. Optimization of fuzzy control energy management strategy for fuel cell vehicle power system using a multi-islandgenetic algorithm. Energy Sci. Eng. 2020, 9, 548–564. [Google Scholar] [CrossRef]
  21. Tang, X.; Zhou, H.; Wang, F.; Wang, W.; Lin, X. Longevity-conscious energy management strategy of fuel cell hybrid electric Vehicle Based on deep reinforcement learning. Energy 2022, 238, 121593. [Google Scholar] [CrossRef]
  22. Samia, B.; Toufik, A.; Kamel-Eddine, H. Frequency splitting approach using wavelet for energy management strategies in fuel cell ultra-capacitor hybrid system. J. Meas. Eng. 2022, 10, 15–26. [Google Scholar] [CrossRef]
  23. Soldo, J.; Škugor, B.; Deur, J. Synthesis of Optimal Battery State-of-Charge Trajectory for Blended Regime of Plug-in Hybrid Electric Vehicles in the Presence of Low-Emission Zones and Varying Road Grades. Energies 2019, 12, 4296. [Google Scholar] [CrossRef]
  24. Xiao, W.; Wang, L.; Liu, D.; Zhang, W. An optimized energy management strategy for fuel cell hybrid vehicles. IOP Conf. Ser. Mater. Sci. Eng. 2019, 612, 042088. [Google Scholar] [CrossRef]
  25. Song, K.; Wang, X.; Li, F.; Sorrentino, M.; Zheng, B. Pontryagin’s minimum principle-based real-time energy management strategy for fuel cell hybrid electric vehicle considering both fuel economy and power source durability. Energy 2020, 205, 118064. [Google Scholar] [CrossRef]
  26. Ettihir, K.; Cano, M.H.; Boulon, L.; Agbossou, K. Design of an adaptive EMS for fuel cell vehicles. Int. J. Hydrogen Energy 2017, 42, 1481–1489. [Google Scholar] [CrossRef]
  27. Li, X.; Wang, Y.; Yang, D.; Chen, Z. Adaptive energy management strategy for fuel cell/battery hybrid vehicles using Pontryagin’s Minimal Principle. J. Power Sources 2019, 440, 227105. [Google Scholar] [CrossRef]
  28. Zhang, J.; Zheng, C.; Cha, S.W.; Duan, S. Co-state variable determination in Pontryagin’s Minimum Principle for energy management of hybrid vehicles. Int. J. Precis. Eng. Manuf. 2016, 17, 1215–1222. [Google Scholar] [CrossRef]
  29. Musardo, C.; Rizzoni, G.; Guezennec, Y.; Staccia, B. A-ECMS: An Adaptive Algorithm for Hybrid Electric Vehicle Energy Management. Eur. J. Control 2005, 11, 509–524. [Google Scholar] [CrossRef]
  30. Liu, C.; Liu, L. Optimal power source sizing of fuel cell hybrid vehicles based on Pontryagin’s minimum principle. Int. J. Hydrogen Energy 2015, 40, 8454–8464. [Google Scholar] [CrossRef]
  31. Feroldi, D.; Carignano, M. Sizing for fuel cell/supercapacitor hybrid vehicles based on stochastic driving cycles. Appl. Energy 2016, 183, 645–658. [Google Scholar] [CrossRef]
  32. Huang, Y.; Wang, H.; Khajepour, A.; Li, B.; Ji, J.; Zhao, K.; Hu, C. A review of power management strategies and component sizing methods for hybrid vehicles. Renew. Sustain. Energy Rev. 2018, 96, 132–144. [Google Scholar] [CrossRef]
  33. Hou, S.; Gao, J.; Zhang, Y.; Chen, M.; Shi, J.; Chen, H. A comparison study of battery size optimization and an energy management strategy for FCHEVs based on dynamic programming and convex programming. Int. J. Hydrogen Energy 2020, 45, 21858–21872. [Google Scholar] [CrossRef]
  34. Sadek, H.; Chedid, R.; Fares, D. Power sources sizing for a fuel cell hybrid vehicle. Energy Storage 2020, 2, e124. [Google Scholar] [CrossRef]
  35. Fletcher, T.; Ebrahimi, K. The Effect of Fuel Cell and Battery Size on Efficiency and Cell Lifetime for an L7e Fuel Cell Hybrid Vehicle. Energies 2020, 13, 5889. [Google Scholar] [CrossRef]
  36. Martin-Lozano, A.; Barrado, A.; Rodriguez-Lorente, A.; Lazaro, A.; Fernandez, C. Energy Management System Optimization for a Fuel Cell Hybrid Vehicle based on Power Losses Minimization. In Proceedings of the IEEE 14th International Conference on Compatibility, Power Electronics and Power Engineering (CPE-POWERENG), Setubal, Portugal, 8–10 July 2020. [Google Scholar] [CrossRef]
  37. Bernard, J.; Delprat, S.; Buchi, F.N.; Guerra, T.M. Fuel-Cell Hybrid Powertrain: Toward Minimization of Hydrogen Consumption. IEEE Trans. Veh. Technol. 2009, 58, 3168–3176. [Google Scholar] [CrossRef]
  38. Sundström, O.; Stefanopoulou, A. Optimal power split in fuel cell hybrid electric vehicle with different battery sizes, drive cycles, and objectives. In Proceedings of the 2006 IEEE International Conference on Control Applications, Munich, Germany, 4–6 October 2006. [Google Scholar]
  39. Ceschia, A.; Azib, T.; Bethoux, O.; Alves, F. Optimal Sizing of Fuel Cell Hybrid Power Sources with Reliability Consideration. Energies 2020, 13, 3510. [Google Scholar] [CrossRef]
  40. Maggetto, G.; Mierlo, J.V. Electric vehicles, hybrid electric vehicles and fuel cell electric vehicles: State of the art and perspectives. Ann. Chim. Sci. Mater. 2001, 26, 17. [Google Scholar] [CrossRef]
Figure 1. Power source sizing map.
Energies 15 06167 g001
Figure 2. SOC plots under driving cycles with different SOC range constraints: (a) FTP-72 driving cycle, SOC 0.2–0.8; (b) FTP-72 driving cycle, SOC 0.5–0.6; (c) US06 driving cycle, SOC 0.2–0.8; (d) US06 driving cycle, SOC 0.5–0.6.
Energies 15 06167 g002
Figure 3. Fuel consumption maps under driving cycles with different SOC ranges: (a) FTP-72 driving cycle, SOC 0.2–0.8; (b) FTP-72 driving cycle, SOC 0.5–0.6; (c) US06 driving cycle, SOC 0.2–0.8; (d) US06 driving cycle, SOC 0.5–0.6.
Energies 15 06167 g003
Figure 4. Power source sizing maps under driving cycles with different SOC ranges: (a) FTP-72 driving cycle, SOC 0.2–0.8; (b) FTP-72 driving cycle, SOC 0.5–0.6; (c) US06 driving cycle, SOC 0.2–0.8; (d) US06 driving cycle, SOC 0.5–0.6.
Energies 15 06167 g004
Table 1. Parameters of simulation.
Vehicle Mass (without Power Source)1400 kgShift Point2000 [rpm]
Air density1.21 kg/m3Maximum Motor input voltage500 [V]
Front area1.12 [m2]Maximum Motor speed8250 [rpm]
Radius of Wheel0.29 [m]Battery type L i F e P O 4
First gear ratio3.78Voltage3.2 V
Second gear ratio2.06Capacity15 Ah
Third gear ratio1.58Cycle Life2500 (charge and discharge at 1 C 80% capacity)
Fourth gear ratio1.21Fast Discharge Current15 A
Fifth gear ratio0.82Maximum Discharge Current45 A
Final driving ratio4.125Charge Current15 A
Driving line efficiency0.95Battery cell mass335 g/cell
Air drag coefficient0.37Cost of battery$831.5/kWh
Rolling resistance coefficient0.014Cost of fuel cell$800/kW
Motor efficiency0.95Fuel cell mass0.013· P fcs 0.867 kg
Table 2. The cost of different power-source combinations.
Fuel Cell Size [kW]
62708090100110120130140150
Battery size [unit cell]60XXXXX90.4098.40106.40114.40122.40Cost of power-source combination [$103]
80XXXXX91.2099.20107.20115.20123.20
100XXXX84.0092.00100.00108.00116.00124.00
120XXX76.7984.7992.79100.79108.79116.79124.79
140XXX77.5985.5993.59101.59109.59117.59125.59
160XX70.3978.3986.3994.39102.39110.3911839126.39
180X63.1971.1979.1987.1995.19103.19111.19119.19127.19
20057.5963.9971.9979.9987.9995.99103.99111.99119.99127.99
X: ineffective combinations.
Publisher’s Note: MDPI stays neutral with regard to jurisdictional claims in published maps and institutional affiliations.

