Article

Micro-Displacement and Storage Mechanism of CO2 in Tight Sandstone Reservoirs Based on CT Scanning

1
State Key Laboratory of Reservoir Geology and Development, Southwest Petroleum University, Chengdu 610500, China
2
School of Petroleum Engineering, Xi’an Shiyou University, Xi’an 710065, China
3
Changqing Oilfield Company, Petro China, Xi’an 710018, China
4
Institute of Unconventional Oil and Gas Science and Technology, China University of Petroleum (Beijing), Beijing 102249, China
5
Changqing Engineering Design Co., Ltd., Petro China, Xi’an 710018, China
*
Author to whom correspondence should be addressed.
Energies 2022, 15(17), 6201; https://doi.org/10.3390/en15176201
Submission received: 28 July 2022 / Revised: 20 August 2022 / Accepted: 22 August 2022 / Published: 26 August 2022
(This article belongs to the Section H1: Petroleum Engineering)

Abstract

:
Tight sandstone reservoirs are ideal locations for CO2 storage. To evaluate the oil displacement efficiency and storage potential of CO2 in the tight sandstone reservoir in the Huang 3 area of the Changqing Oilfield, four kinds of displacement experiments were conducted on core samples from the Chang 8 Formation in the Huang 3 area. These experiments were performed using micro-displacement equipment, digital core technology, and an online CT scanning system; the different oil displacement processes were recorded as three-dimensional images. The results show that the CO2 flooding alternated with water scheme can improve crude oil recovery the most. Comparing the cores before and after the displacement shows that the amount of crude oil in pores with larger sizes decreases more. The remaining oil is mainly in thin films or is dispersed and star-shaped, indicating that the crude oil in the medium and large pores is swept and recovered. The CO2 displacement efficiency is 41.67~55.08%, and the CO2 storage rate is 38.16~46.89%. The proportion of remaining oil in the throat of the small and medium-sized pores is still high, which is the key to oil recovery in the later stages.

1. Introduction

CO2 is a major greenhouse gas generated by human activities and the main cause of global climate change. Carbon capture, utilization, and storage (CCUS) technology can help to reduce CO2 emissions [1]. CO2-enhanced oil recovery (CO2-EOR) technology has both economic and environmental benefits, and can help to achieve carbon storage and improve crude oil recovery, especially in tight sandstone reservoirs; CO2-EOR, therefore, has broad application prospects. Tight sandstone reservoirs have strong heterogeneity, low permeability and porosity, and complex micro-pore structures, and when they are subject to water flooding, a large amount of oil often remains in these reservoirs. CO2 flooding can effectively improve the resources produced from these reservoirs and increase both single and multi-well production. However, the micro-displacement mechanism of hydrocarbons after these reservoirs is subject to water flooding, and the enhanced oil recovery mechanism after subjecting these reservoirs to CO2 flooding alternating with water is not clear. Therefore, research on CO2–oil displacement and storage technology can not only greatly improve the recovery of tight reservoirs, but also reduce greenhouse gas emissions. The Huang 3 area of the Changqing Oilfield is located in the midwest of the Ordos Basin [2]. The reservoir in this area was put into production in 2009. The main oil producing layer is composed of Triassic sediments, and the main oil-producing layer is Chang 8. The sand bodies in the reservoirs are connected well and the oil is present mainly in channel sand body deposits with a formation temperature of 85 °C. The initial formation pressure is 19.74 MPa. The reservoir has the characteristics of low porosity or ultra-low porosity and low permeability or ultra-low permeability.
During core flooding oil displacement, it is difficult to characterize the actual oil displacement mechanism. Based on the micro-pore structure, the micro-oil displacement mechanism can be revealed by analyzing the seepage characteristics and residual oil distribution in the rock core through CT scanning technology. CT technology can be used to conduct quantitative and image analysis on the micro-pore structure without damaging the external shape and internal structure of the core. The displacement process can be observed, and the oil displacement mechanism can be revealed [3,4,5,6]. Deng Shiguan [7] applied CT scanning technology to study the distribution characteristics of gravel porosity and performed online CT scanning monitoring of water flooding and polymer flooding, after which, they obtained the variation characteristics of the core water saturation. Hou Jian [8] constructed a core model with artificial quartz sand and scanned the core model with the help of a micro-focus CT system, after which the three-dimensional pore throat structure and oil–water distribution of the core were obtained. Senyou An [9] designed a crude oil displacement experiment using CT scanning, calculated the total amount and average volume of the remaining oil at the pore scale, classified the shape of the remaining oil according to the shape factor and the Euler number, and adjusted the streamline after water flooding and polymer flooding to effectively enhance the oil recovery. Chaohua Guo [10] used digital core and high-resolution micro-CT scanning technology to quantitatively study the influence of pore structure and permeability on oil displacement efficiency in the high water cut stage. Large coordination numbers improve the oil displacement efficiency, but large tortuosity and pore throat ratios reduce it. Li Junjian [11,12] proposed a method to reconstruct the three-dimensional mineral distribution based on CT scanning experiments to study the mechanism of water-sensitive damage and obtained the change characteristics of the relative permeability curve before and after water-sensitive damage. Jinju Han [13] studied the changes in the main flow paths (macropores) and rock properties after CO2 injection into carbonate rocks by combining X-ray CT imaging with mercury injection capillary pressure analysis. Yongfei Yang [14] reconstructed the real micro-CT scanning image of carbonate rock and established a single connected pore space model to simulate the oil–water two-phase flow process at the pore scale. In the process of water flooding, the complex pore structure led to the remaining oil, and the high number of capillaries was conducive to reducing the saturation of the remaining oil. Based on micro-CT scanning technology, Wang Zhouhua [15] carried out tests on pore structure characteristics and oil phase distribution after water flooding on cores of the Mishrif reservoir with different physical properties. Adebayo [16] measures X-ray CT-scan for performance evaluation of CO2 injection in carbonate rocks. Dissolution of rock grains and slight changes in rock pore structure observed in the CT scan images after the injection of CO2. Micro-CT and finite element mothed were used to study water and CO2 (carbon dioxide) flooding of Berea sandstone. Gunde [17] observed that continuous displacement of oil occurs during water flooding, but CO2 is able to displace oil at certain locations in the pores. Saraf [18] summarized pore-scale modeling and CT scan technique to characterize the trapped CO2 in impermeable reservoir, also discusses the challenges of CO2 storage in pore modeling and CT characterization. CT scanning technology has been applied in the study of the enhanced oil recovery mechanism and there is a lack of a systematic study on the distribution characteristics after CO2 flooding and CO2 flooding alternating with water flooding of the residual oil in the micro-pores of tight sandstone [19,20,21,22,23].
Using the Chang-8 cores in the Huang 3 area of the Ordos Basin, this study digitally reconstructs the three-dimensional multi-scale core using a core displacement system and CT scanning technology and explores the oil displacement mechanism and CO2 storage rate under different displacement modes in the tight sandstone cores. The multi-scale distribution characteristics of the micro-residual oil and the mechanism of CO2 flooding followed by CO2 flooding alternating with water flooding to enhance oil recovery and CO2 storage are also investigated. The results of this study provide a theoretical basis for the formulation of suitable oilfield development plans and CO2 storage designs.

2. Core Flooding Experiment

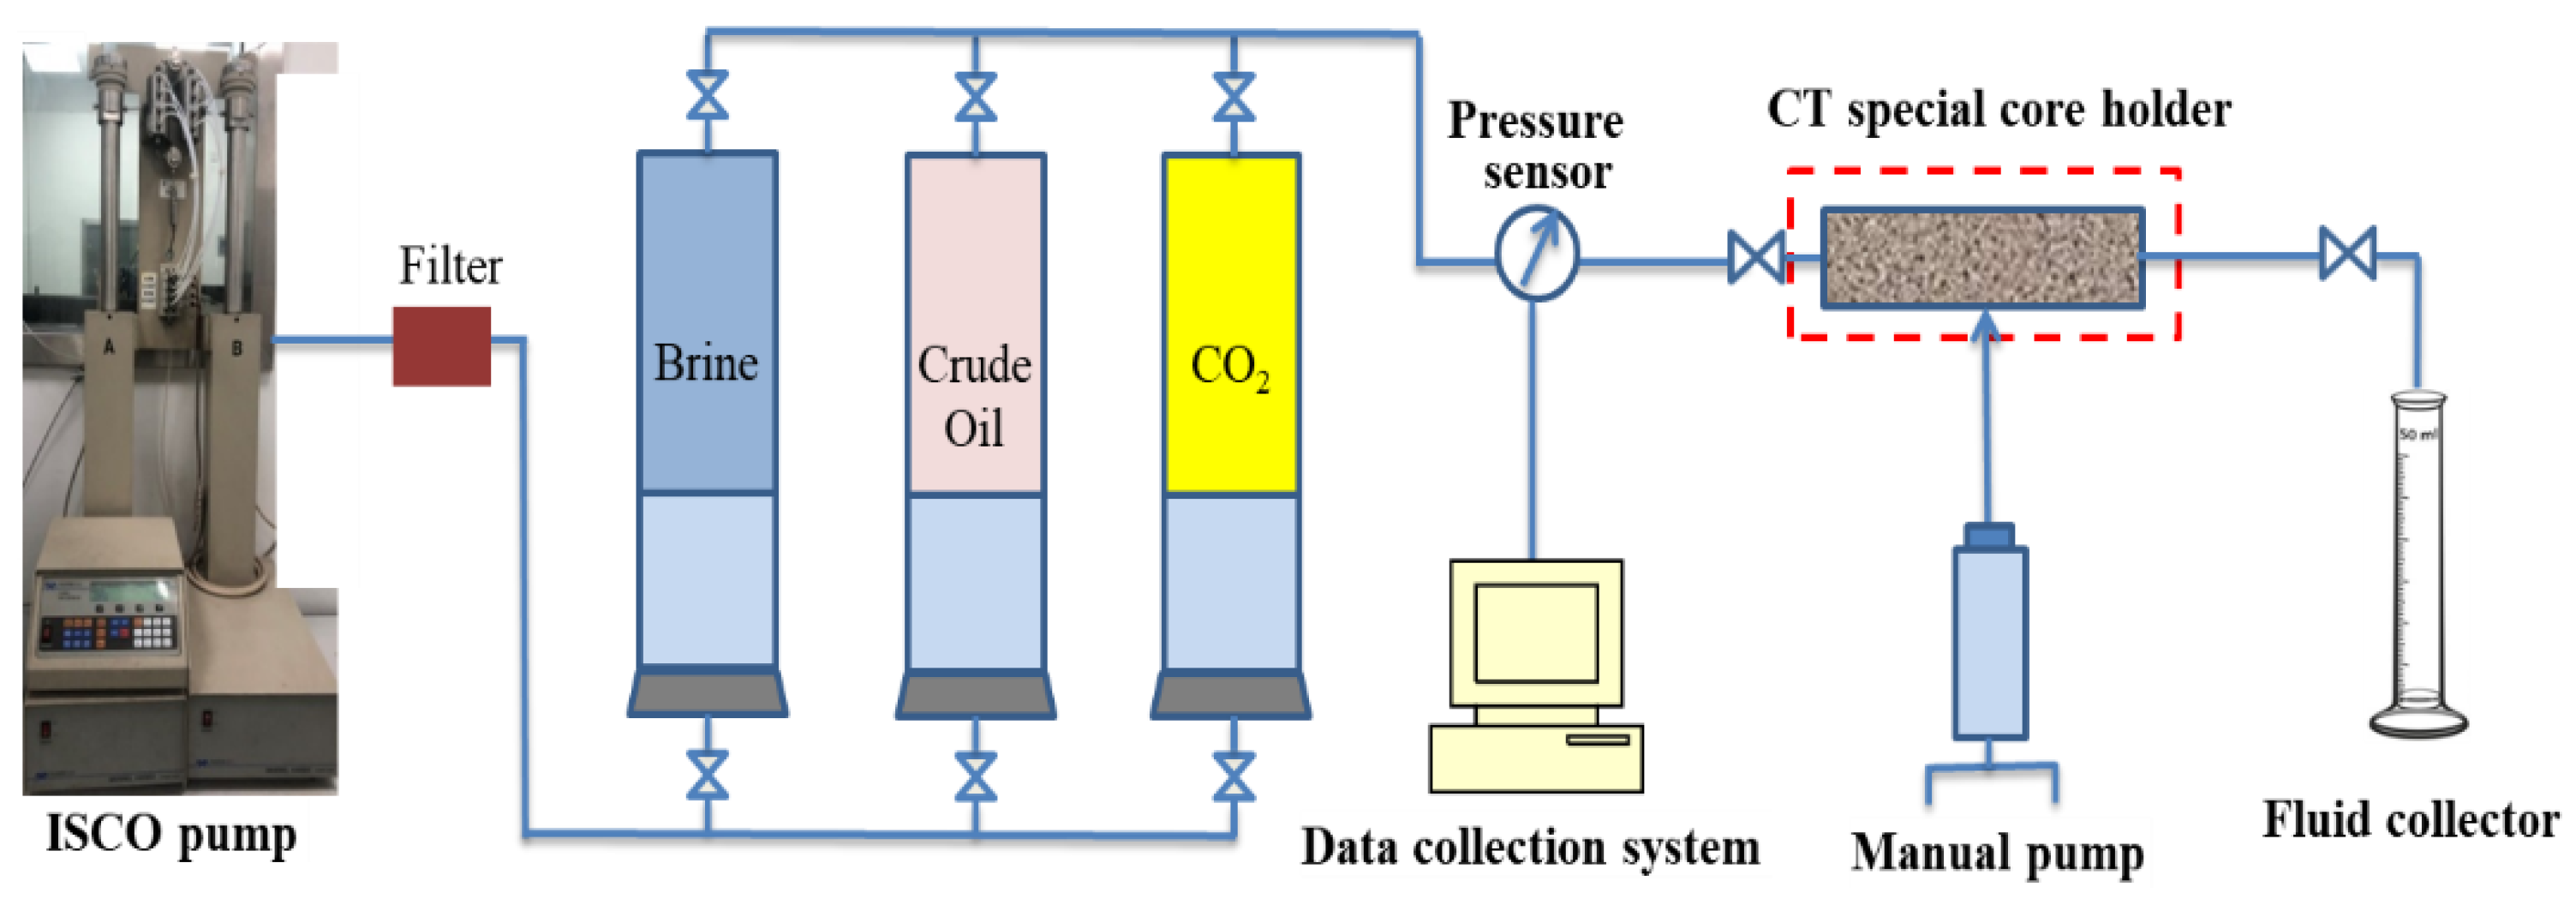
2.1. Experimental Setup

This experiment adopts micro-CT scanning equipment independently developed by the ‘Laboratory of Advanced Stimulation Technology for Oil & Gas Reservoirs’ of the Xi’an University of Petroleum (Figure 1). The scanning voltage is 60 kV, the power is 5 mA, and the 3D spatial resolution is less than 0.7 μm. The maximum multiple pixel size is 0.34 μm. The moving range of the X-ray source is 215 mm and that of the detector is 290 mm. The displacement device can carry out online CT scanning of the core displacement process, and record the inlet and outlet pressure and the flow rate of the core during the displacement process. Finally, the data were processed by image analysis software.

2.2. Experimental Core and Fluid

Four core samples from the Chang 8 layer in the Huang 3 area of the Ordos Basin were selected to carry out CT scanning experiments under specific pressure and temperature conditions, and the image processing of the test results was performed and completed. Based on the CT scanning values, the porosity, oil saturation, and water saturation of the cores can be calculated [20].
ϕ = C T N 1 C T N 2 C T N w C T N a × 100 %
S o = C T N 2 C T N 3 C T N w C T N o × C T N w C T N a C T N 1 C T N 2 × 100 %
S w = ( 1 C T N 2 C T N 3 C T N w C T N o × C T N w C T N a C T N 1 C T N 2 ) × 100 %
where: ϕ is porosity, %; CTN1 is the CT value of the core after completely being saturated with water; CTN2 is the CT value of the dry core; CTNw is the CT value of the water phase; CTNa is the CT value of the air phase; So is the oil saturation, %; CTN3 is the core’s CT value at a certain time in the displacement process; CTNo is the CT value of the oil phase; Sw is the water saturation, %.
(1) Core samples
The porosity and permeability of the four cores were measured, and the distribution characteristics of the remaining oil in the cores under different displacement modes were studied and their values are listed in Table 1. A small hole was drilled into the large core sample and ground into a CT special core holder that was suitable for the size of the core sample (cylinder length of 6 mm and a diameter of 5 mm) (Figure 2).
(2) Experimental fluid.
The selected displacement fluid was iodo-n-butane which is soluble in oil. The weight of the iodine atom is large, and the attenuation coefficient is also large when an X-ray passes through. The gray value difference between the oil and water can be increased in the reconstructed image. It is suitable to be used as the contrast phase to obtain the multiphase fluid distribution in the imaging study of microscopic oil–water distributions.

2.3. Experimental Steps

(1)
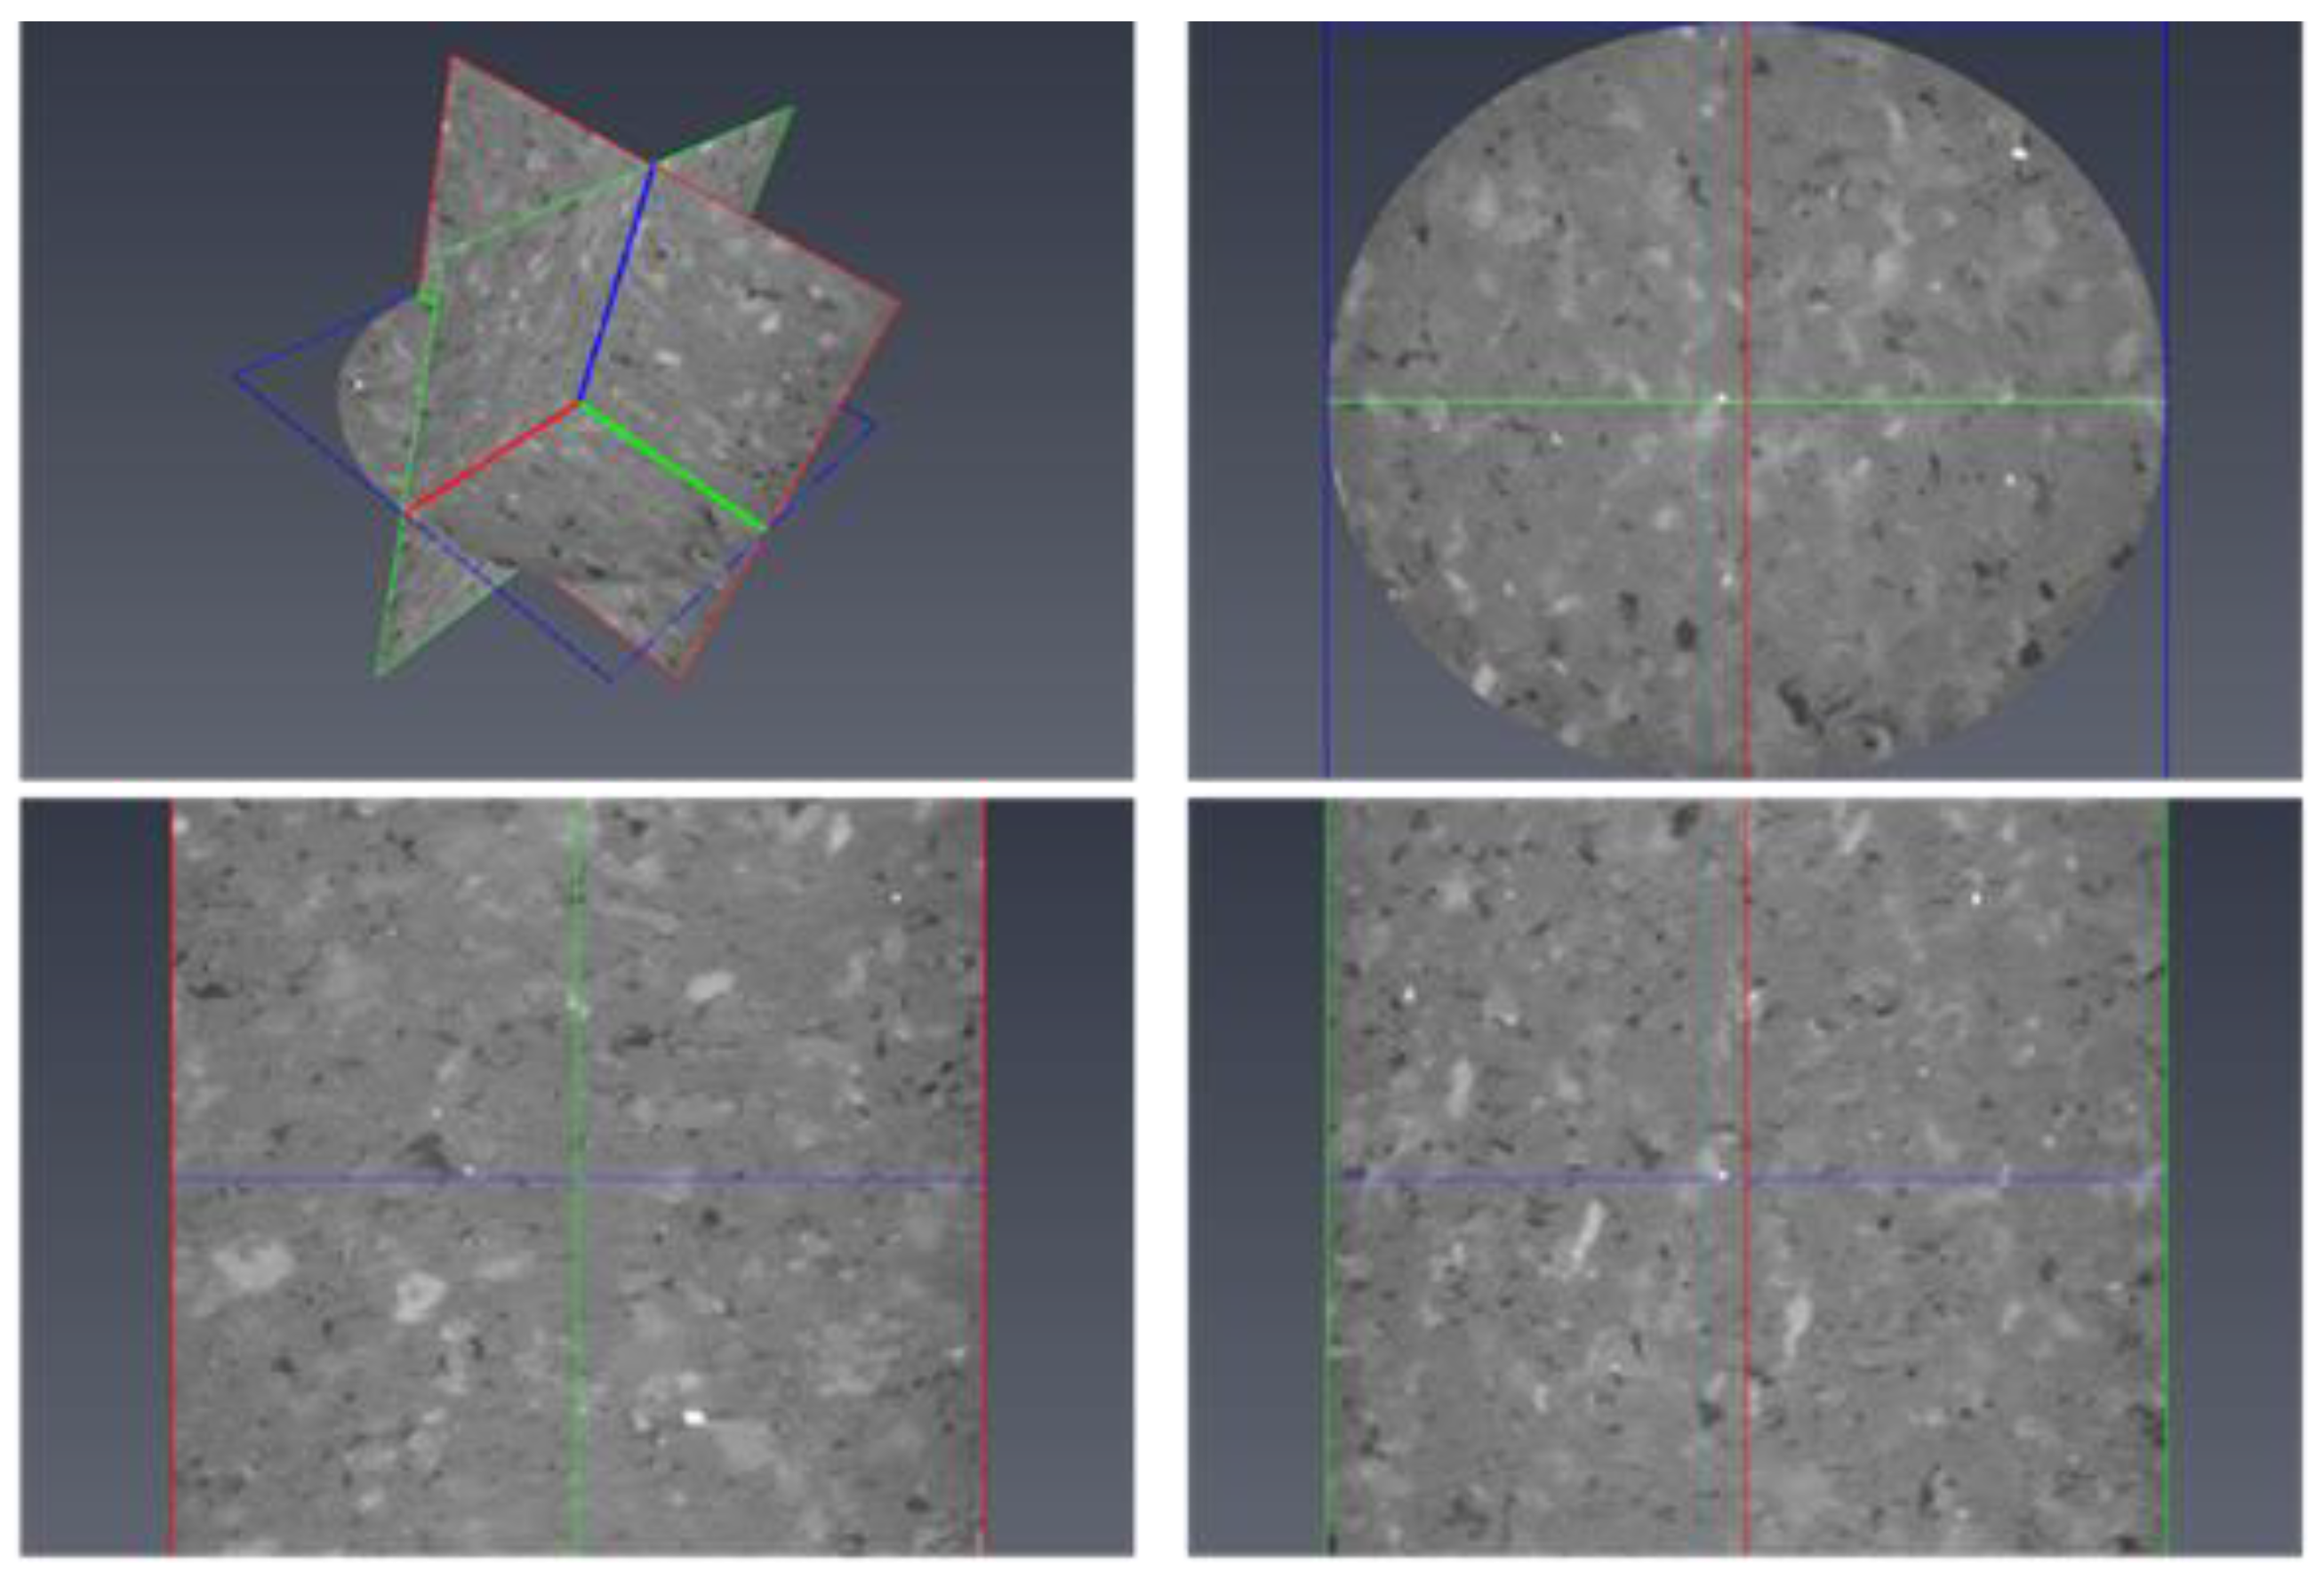
Imaging of the dry core
The rock sample was placed into the CT core holder and connected to the displacement equipment. The confining pressure was increased to 3 MPa and the CT core holder was sealed with a plug for dry sample scanning under the specified pressure. To improve the image quality, the X-ray source and the probe were placed close to the core holder to obtain the pore space structure.
(2)
CT scanning procedure
① The sample table was rotated to the initial position and the distance between the detector and the ray source was adjusted. Then, the sample was fixed on the sample table as vertically as possible, and the detector and X-ray source were aligned with the sample;
② The power of the X-ray source was turned on and the sample was shot with a low magnification lens, and the voltage and current intensity required for scanning were determined;
③ The multiple high-power detection lens and the number of images to be taken were selected according to the required image resolution;
④ The scanning procedure was established and the scanning was performed.
(3)
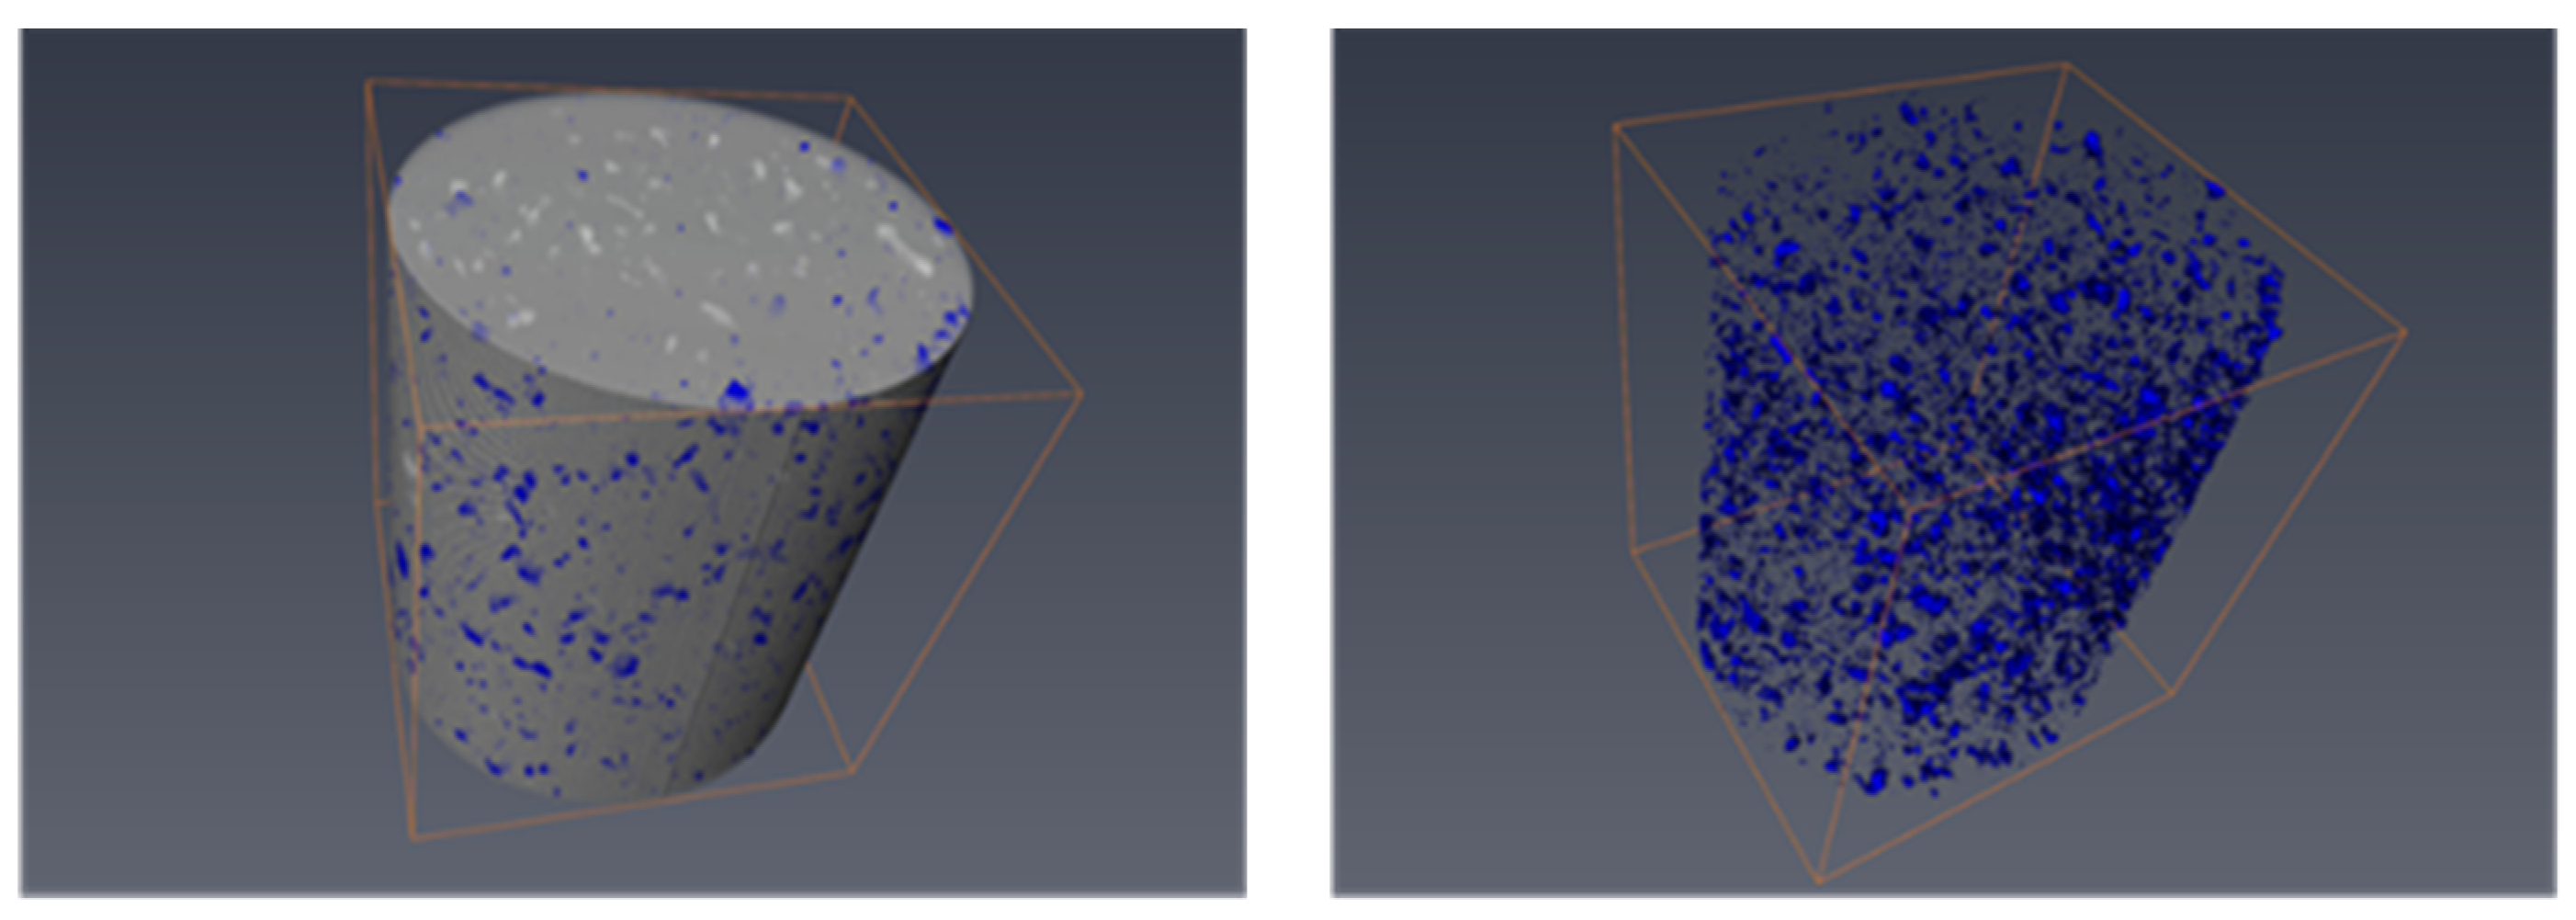
Fluid distribution under the condition of irreducible water (initial oil saturation)
① The gripper was removed from the micro-CT scanning equipment and reconnected to the experimental displacement device; flooding was performed for 5 h at a displacement speed of 0.1 mL/min, and the confining pressure of the displacement device was set at 3 MPa to saturate the rock pores with formation water.
② At the displacement rate of 0.1 mL/min, the crude oil dissolved with the imaging agent was displaced to the outlet without water, and the original oil saturation and irreducible water saturation of the three-dimensional pores of the core were obtained.
③ After the saturation displacement process, the outlet valve, inlet valve, and confining pressure valve were completely closed with matching plugs to keep the core under the specified confining pressure (3 MPa). The CT scanning table was turned under pressure, the scanning program was established, CT scanning was performed, the average irreducible water saturation of the core sample was calculated according to Equation (3), and the fluid distribution under the irreducible water (initial oil saturation) state was established.
(4)
During the test, the specific temperature and pressure were set, the CO2 core displacement experiment was performed, the core holder was transferred to the CT scanning experimental device, and the CT scanning experiment was carried out.
(5)
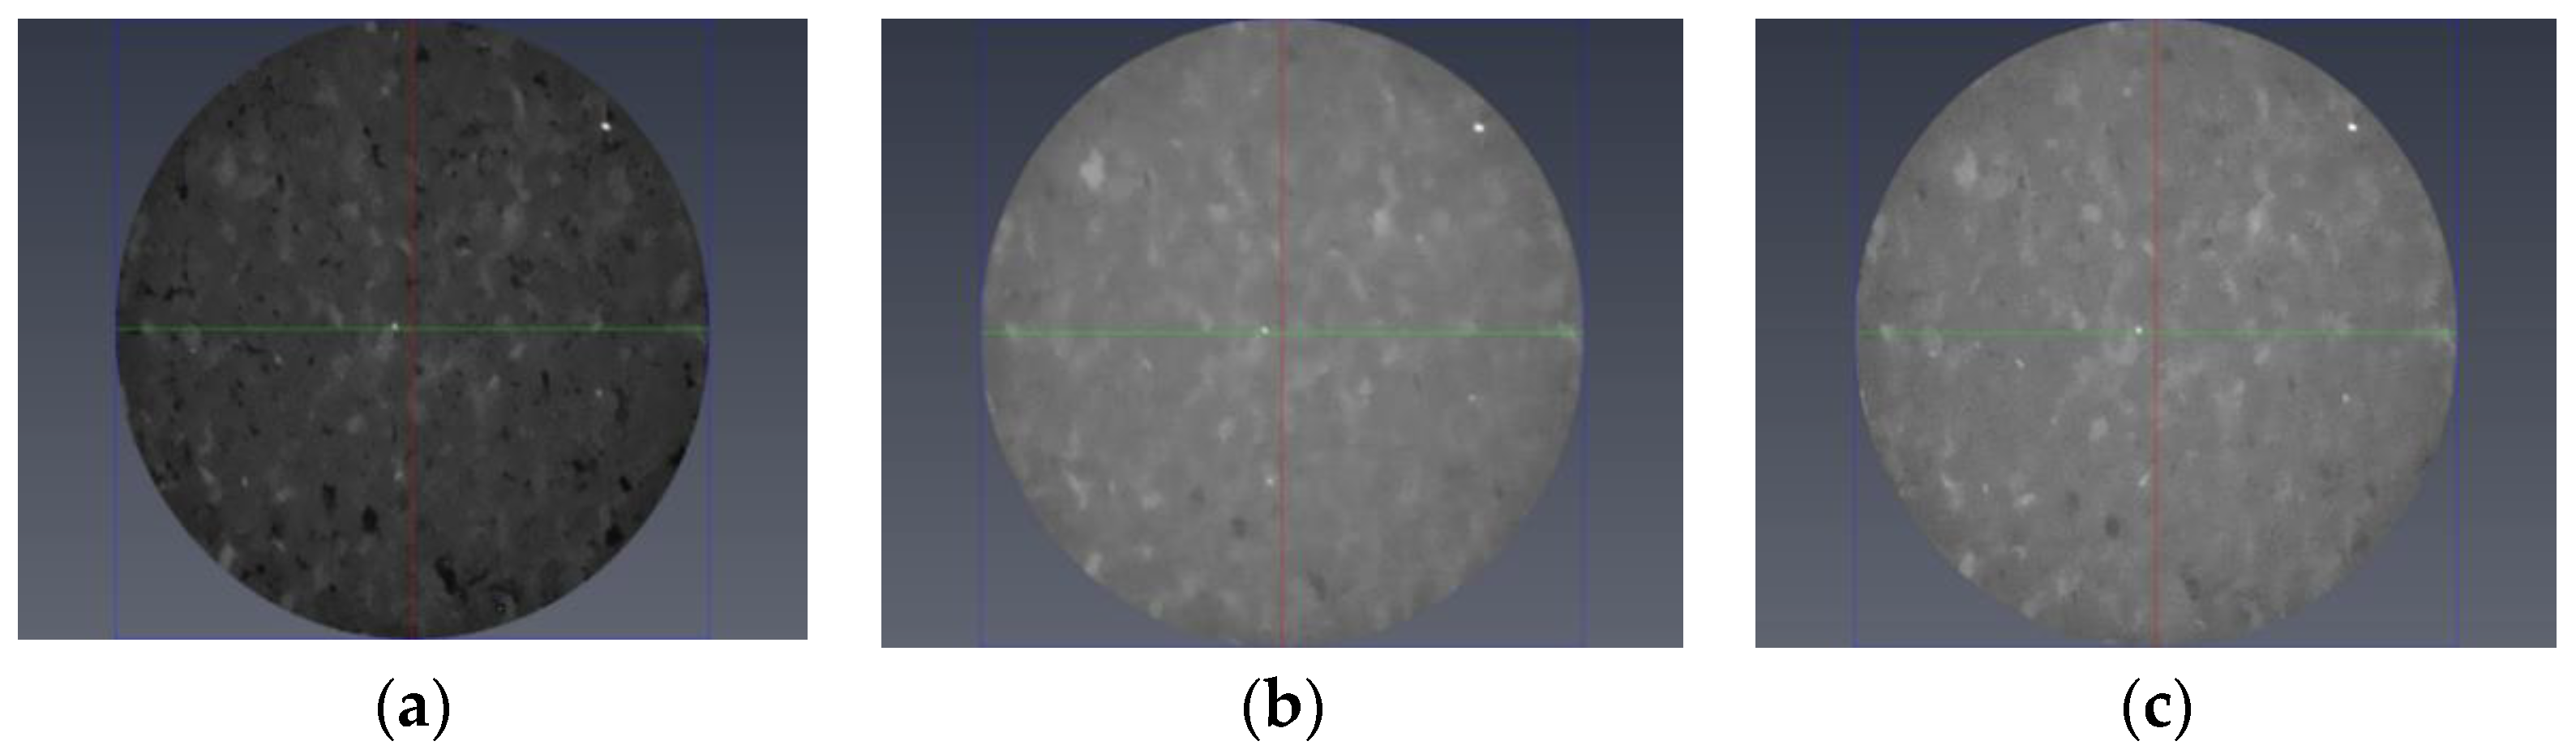
During the CT scanning, the data of several time points were recorded, including the original saturated oil, the completion of CO2 flooding, and the completion of the subsequent water flooding, and the change of the formation liquid saturation was analyzed. Then, the distribution and burial rate of CO2 in the rock core were inversely calculated;
(6)
The above steps were repeated to carry out the core displacement and CT scanning experiments for the different cores.

3. CT Scanning Core Experiment

According to the above experimental process, the three-dimensional diagrams of the dry sandstone samples are obtained. During the shooting process, the CT holder rotated 360° with the sample table, and each group was composed of 1080 projection images. With the help of the image preprocessing program (reconstruction program) provided by the CT scanning equipment, the gray slice image was obtained (Figure 3 and Figure 4).
The dried core was vacuumed and saturated with formation water. At first, the oil displacement water test speed was set at 0.1 mL/min and this was then gradually increased until there was no water at the outlet end of the core. Then, the irreducible water saturation and the CT scanning diagram of the core containing the irreducible water were obtained (Figure 5).

4. Core Flooding Experiment
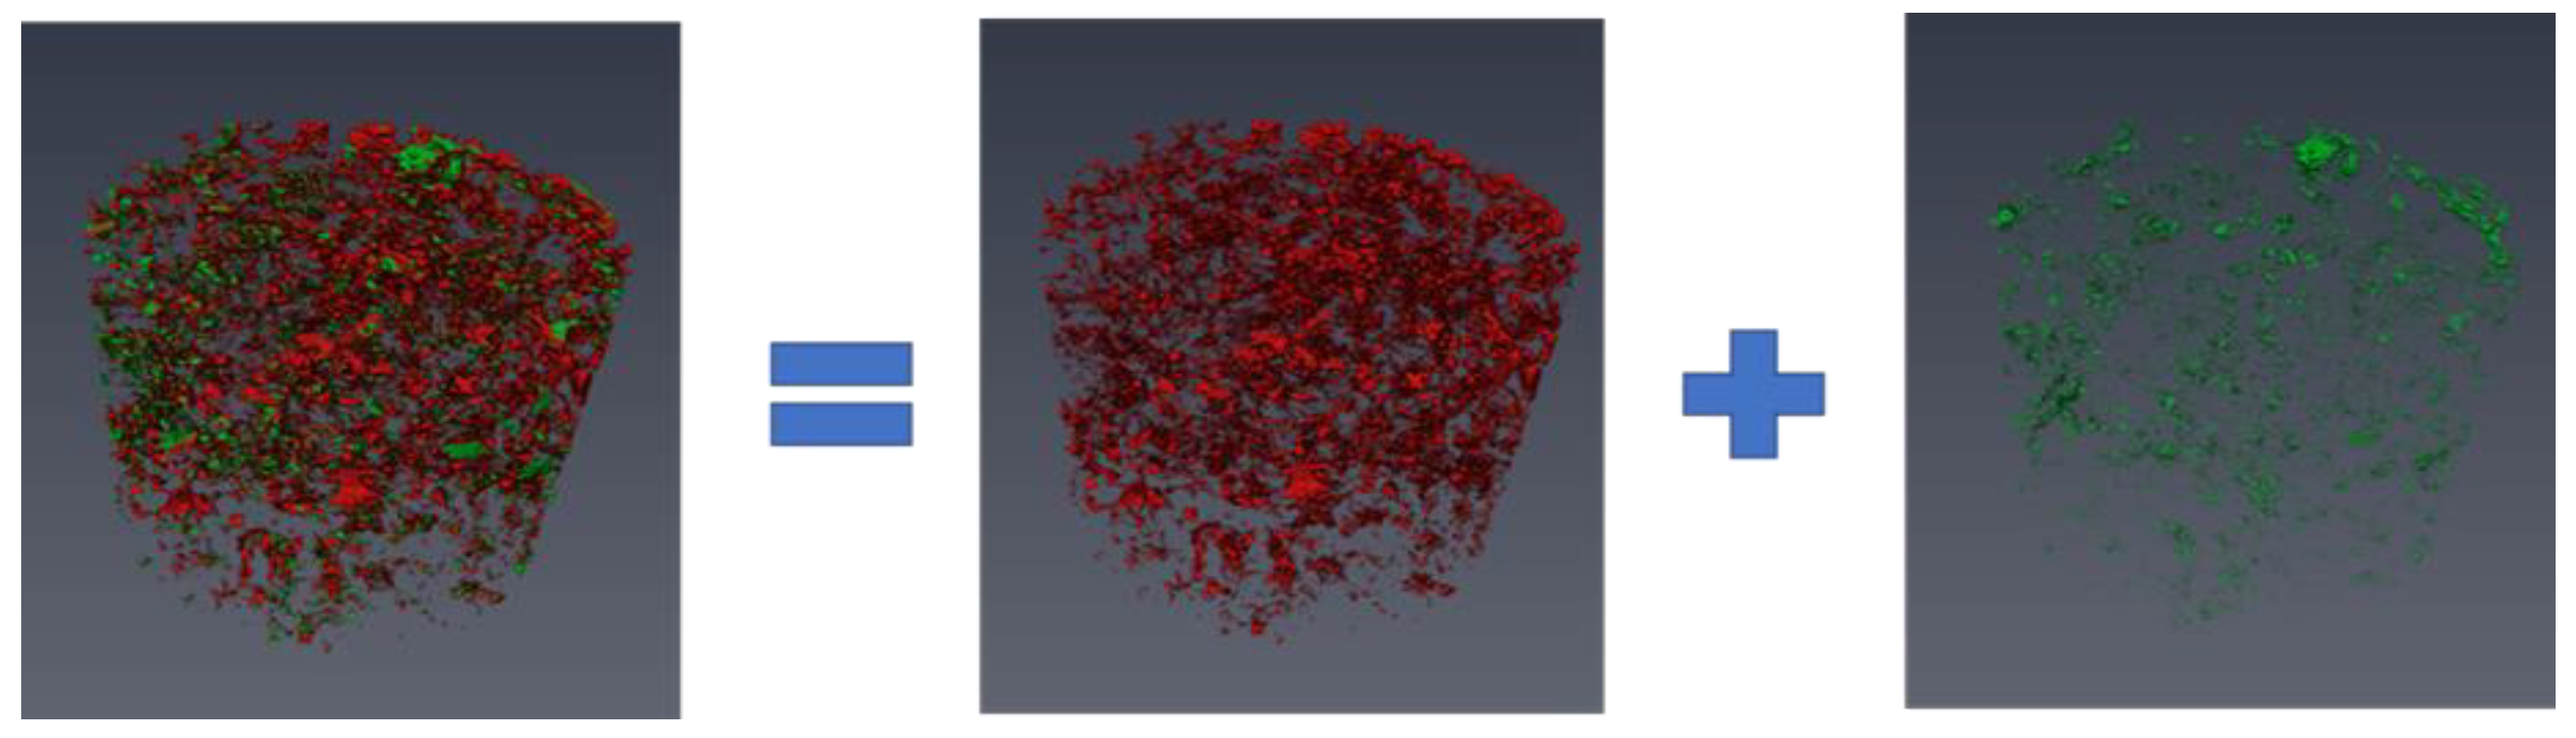
4.1. CO2 Flooding

During the miscible phase experiments, the injection pressure was kept at 20 MPa (MMP 16 MPa), the return pressure at the outlet end was 15 MPa, and the temperature was kept at 84 °C to ensure that the oil and gas were always in (near) miscible phase. The injection and return pressures for the immiscible phase experiments were 13 MPa and 8 MPa, respectively. The Y29–100 core was displaced by CO2 until no oil was present at the core outlet and then the CO2 oil displacement process was completed. The CT scanning table was rotated under pressure for scanning and imaging, and the distribution diagram of each phase of the fluid in the core pore space under the state of residual oil saturation was obtained (Figure 6).
The experimental results of the residual oil + gas (CO2) + water phase distribution at the end of the gas flooding of the cores show that the pores of the tight sandstone were well developed and that the seepage resistance was large; additionally, the micro-heterogeneity of the porous media caused the capillary force produced by the displacement to have obvious differences. Fingering and around flow were the main oil displacement mechanisms, and the residual oil after CO2 flooding was mainly distributed in thin films and as continuous oil. The thin-film oil was comprised mainly of the gas water interlayer and corner oil in the pores that were affected by CO2 flooding. The continuous oil was mainly composed of the oil that was not affected by CO2 flooding and it was present in the small pores (Figure 7).
The CO2 storage rate (Sc) is the ratio of the CO2 volume retained in the rock core to the CO2 volume injected after displacement:
S c = Volume   of   CO 2   trapped   in   rock   core Volume   of   CO 2   injected × 100 %
The Y29–100 rock sample has poor physical properties, low porosity, and low permeability. Micro-CT identification shows that the percentage of the porosity that is greater than 1 μm was only 5.3%, and that the oil saturation was 32.18%. The oil increase efficiency after CO2 flooding was 9.58%, and the final oil displacement efficiency was 41.67%. Therefore, CO2 flooding can achieve relatively high oil displacement efficiency, but its contribution to cumulative oil production is limited. After CO2 was injected with 0.6 PV, the CO2 burial rate was about 46.89% (Figure 8).

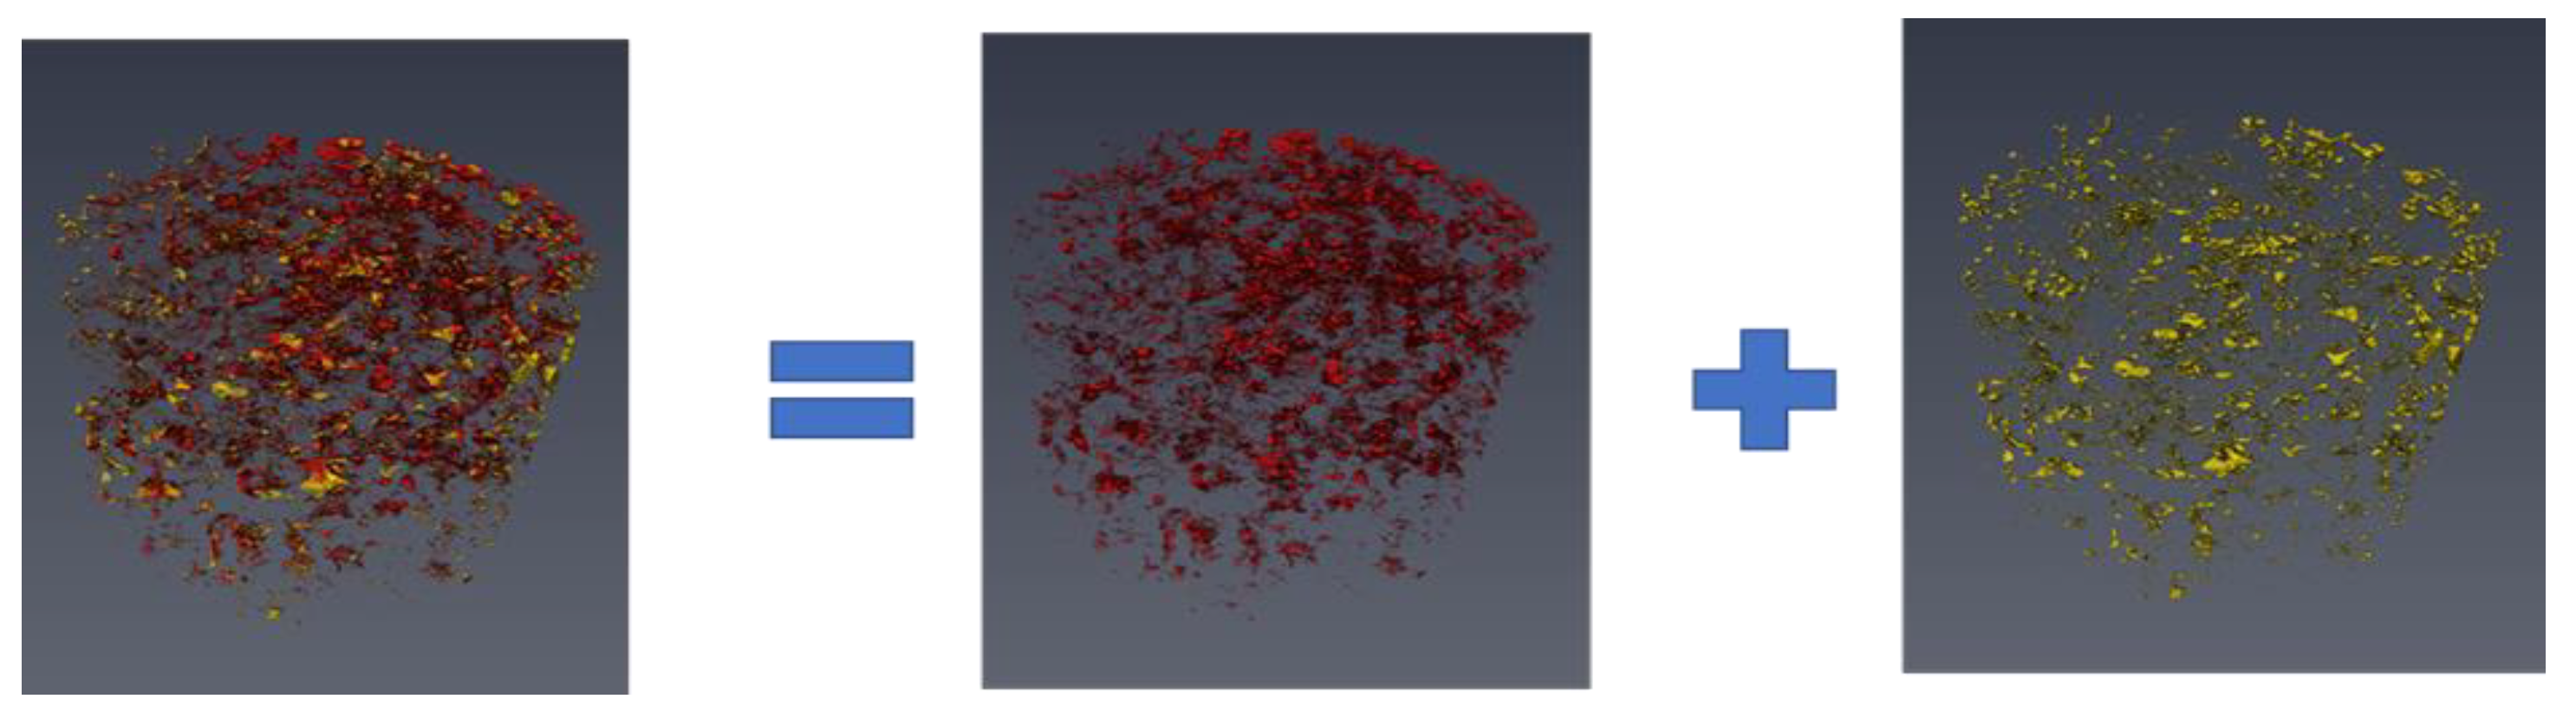
4.2. CO2 Flooding → Water Flooding

The Y40–92 core was displaced by CO2 until no oil was produced at the outlet. Then, the CO2 oil displacement process was completed. The CT scanning table was rotated under pressure, the core was scanned and imaged again, and the distribution diagram of each phase fluid (oil and gas) in the core pore space after CO2 displacement was established. Then, the core was continued to be displaced with formation water until no oil was produced at the outlet. At this time, the subsequent water flooding process was completed and the CT scanning table was rotated under pressure. Then, the core was scanned and imaged again, and the distribution diagram of each fluid phase (oil, gas, and water) in the core pore under the condition of residual oil saturation was established (Figure 9).
(1) Residual oil + gas (CO2) distribution after CO2 flooding: the gray map after CO2 flooding shows that CO2 first displaces and recovers the crude oil in the macropores, but there is still a lot of crude oil remaining in the pores, and the form of residual oil is mainly characterized as occurring in thin films and as continuous oil (Figure 10).
(2) The gray-scale diagram after water flooding shows that water enters the macropores and displaces the residual oil film along the pore wall, and the residual oil in the pore space is further displaced and recovered. However, there is a large amount of trapped oil after jamming, and the residual oil is mainly of the surface adsorption and corner type (Figure 11).
The micro-CT scanning of the Y40–92 core shows that the percentage of porosity greater than 1 μm is 7.07%, and the percentage of the saturated crude oil is about 84.38%. Although the core heterogeneity is strong, after CO2 miscible displacement, the overall displacement efficiency can reach about 30.87%, and the subsequent water flooding effect can increase it by about 13.55%. The total injection volume of CO2 is about 0.6 PV of the effective pore, and the volume proportion of CO2 in the rock core is 1.84%; that is, in the miscible state, the buried proportion of CO2 is about 38.92% (Figure 12).

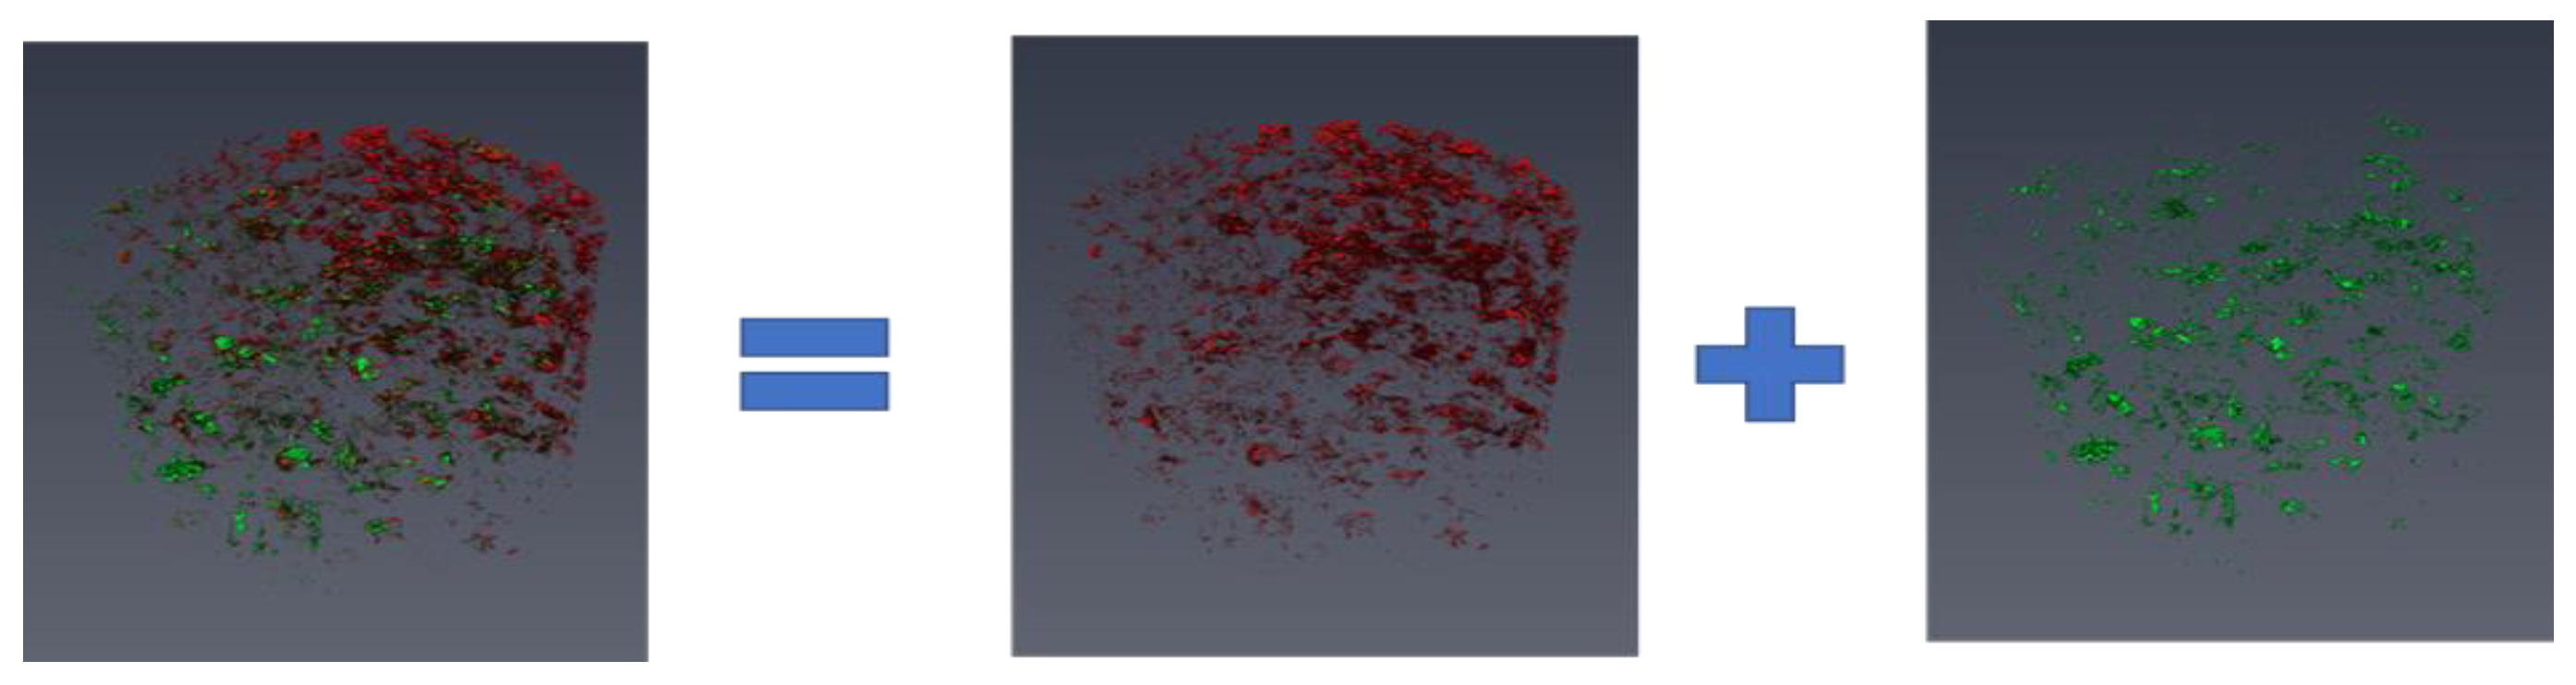
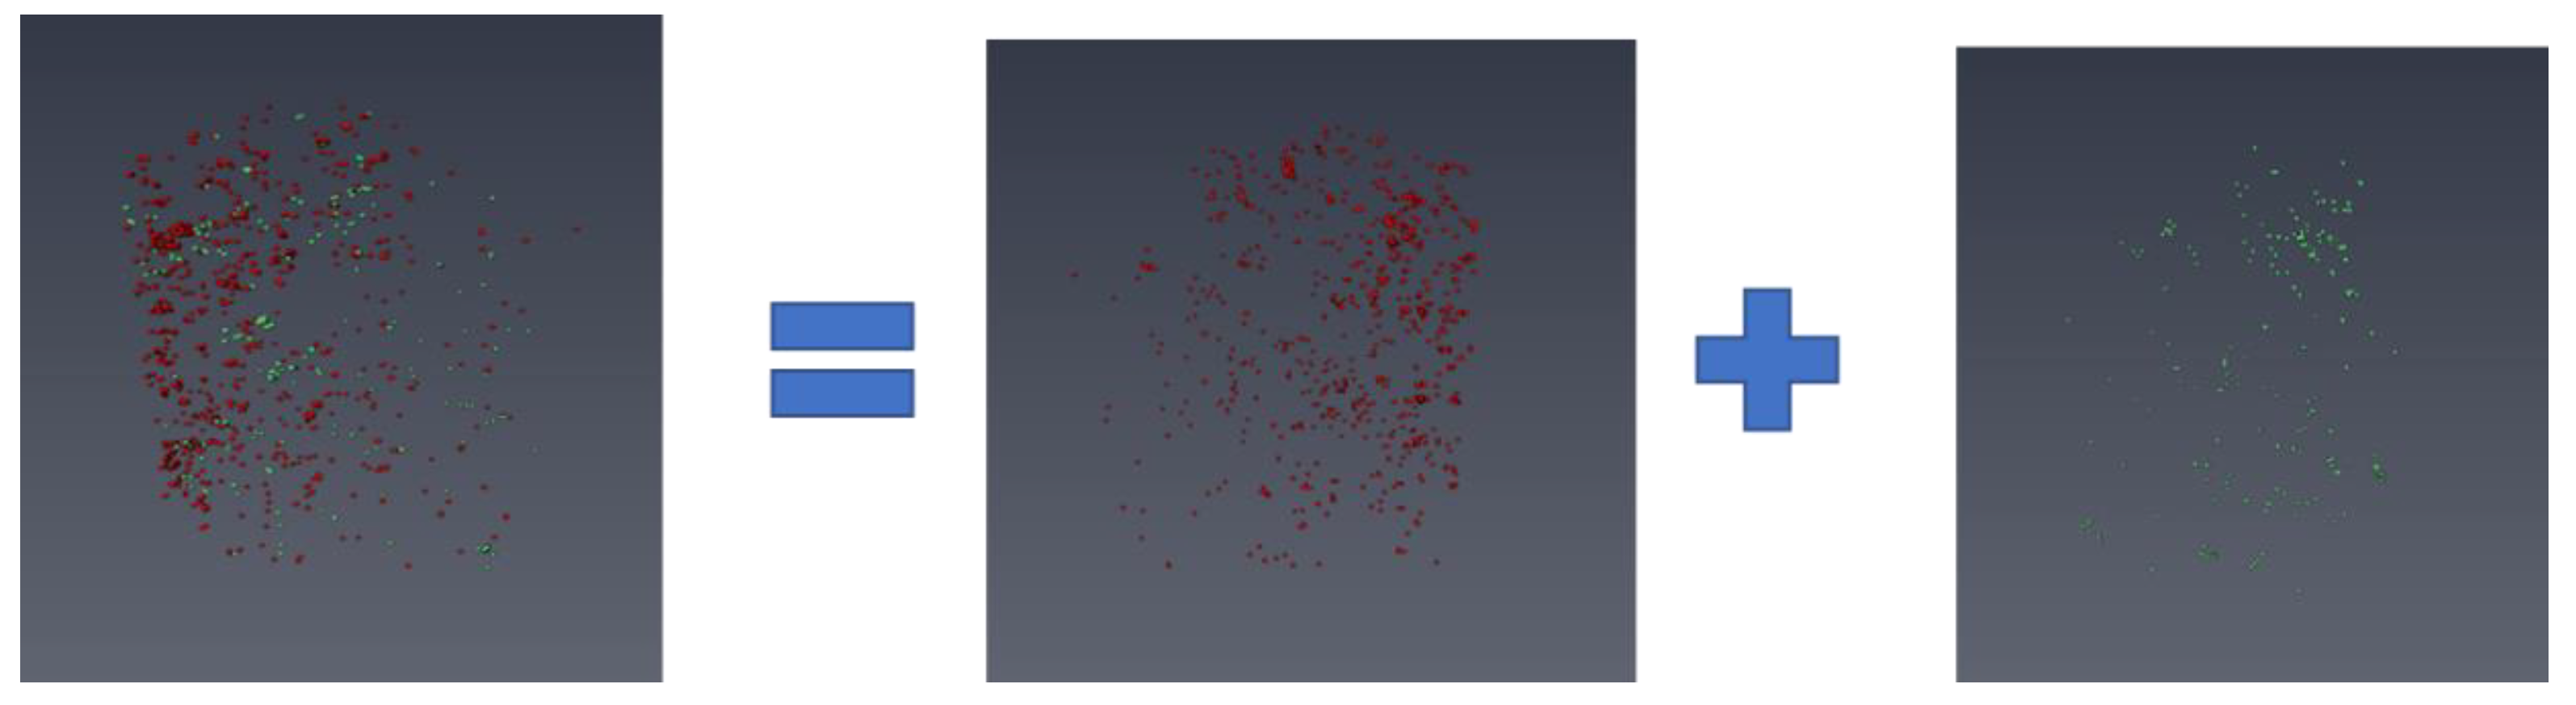
4.3. Firstst Water Flooding → CO2 Flooding → 2nd Water Flooding

The test process for the Y53–89 core was as follows: dry sample → saturated crude oil → 1st water flooding → CO2 flooding → 2nd water flooding. The specific operation of each step was the same as that for the Y40–92 core, except that the Y53–89 core had one more water flooding process between the saturated crude oil and CO2 flooding (Figure 13).
(1) The 1st water flooding: the results of the first water flooding show that a certain amount of crude oil in the macropores was produced by water flooding, and the injected water at the throat of the small hole failed to be affected. There was still a lot of crude oil residue in the small pores, and the residual oil was mainly in the form of thin films and continuous oil (Figure 14).
(2) CO2 flooding: after water flooding, the three-dimensional core diagram of the CO2 continuous displacement shows that after the water flooding and gas flooding, the residual oil in the pores was again displaced and recovered by CO2. The CO2 could enter the small pore channel, open up a new seepage channel, expand the swept area, and utilize part of the remaining oil in the pore channel. After CO2 injection, the capillary forces of the gas in the oil-bearing and water-bearing pore channels were different. CO2 preferentially entered the oil-bearing pores with small capillary resistance and displaced the oil in a manner similar to that of a piston, which improved the oil displacement efficiency in the unit pores. The residual oil was mainly distributed in the small oil droplets and dispersion states, while the continuous crude oil basically ceased to exist (Figure 15).
(3) The 2nd water flooding: the three-dimensional diagram of the second water flooding shows that the residual crude oil in the pore space after gas flooding was further produced by water flooding, but after the gas flooding and water flooding, there was still a lot of oil left in the small pores. The residual oil was mainly dispersed in the hole and the corner (Figure 16).
Micro-CT scanning of the Y53–89 core shows that the percentage of the porosity greater than 1 μm was 8.80%, that of the saturated crude oil was 83.41%, the oil displacement efficiency after the first water flooding was about 24.99%, the oil displacement efficiency after CO2 flooding increased by 16.85%, and the oil recovery after the second water flooding increased by about 7.6%. The total amount of CO2 injected was about 0.6 PV, the CO2 volume remaining in the rock core accounted for about 2.09%, and the buried CO2 proportion in the sample was about 39.97% (Figure 17).

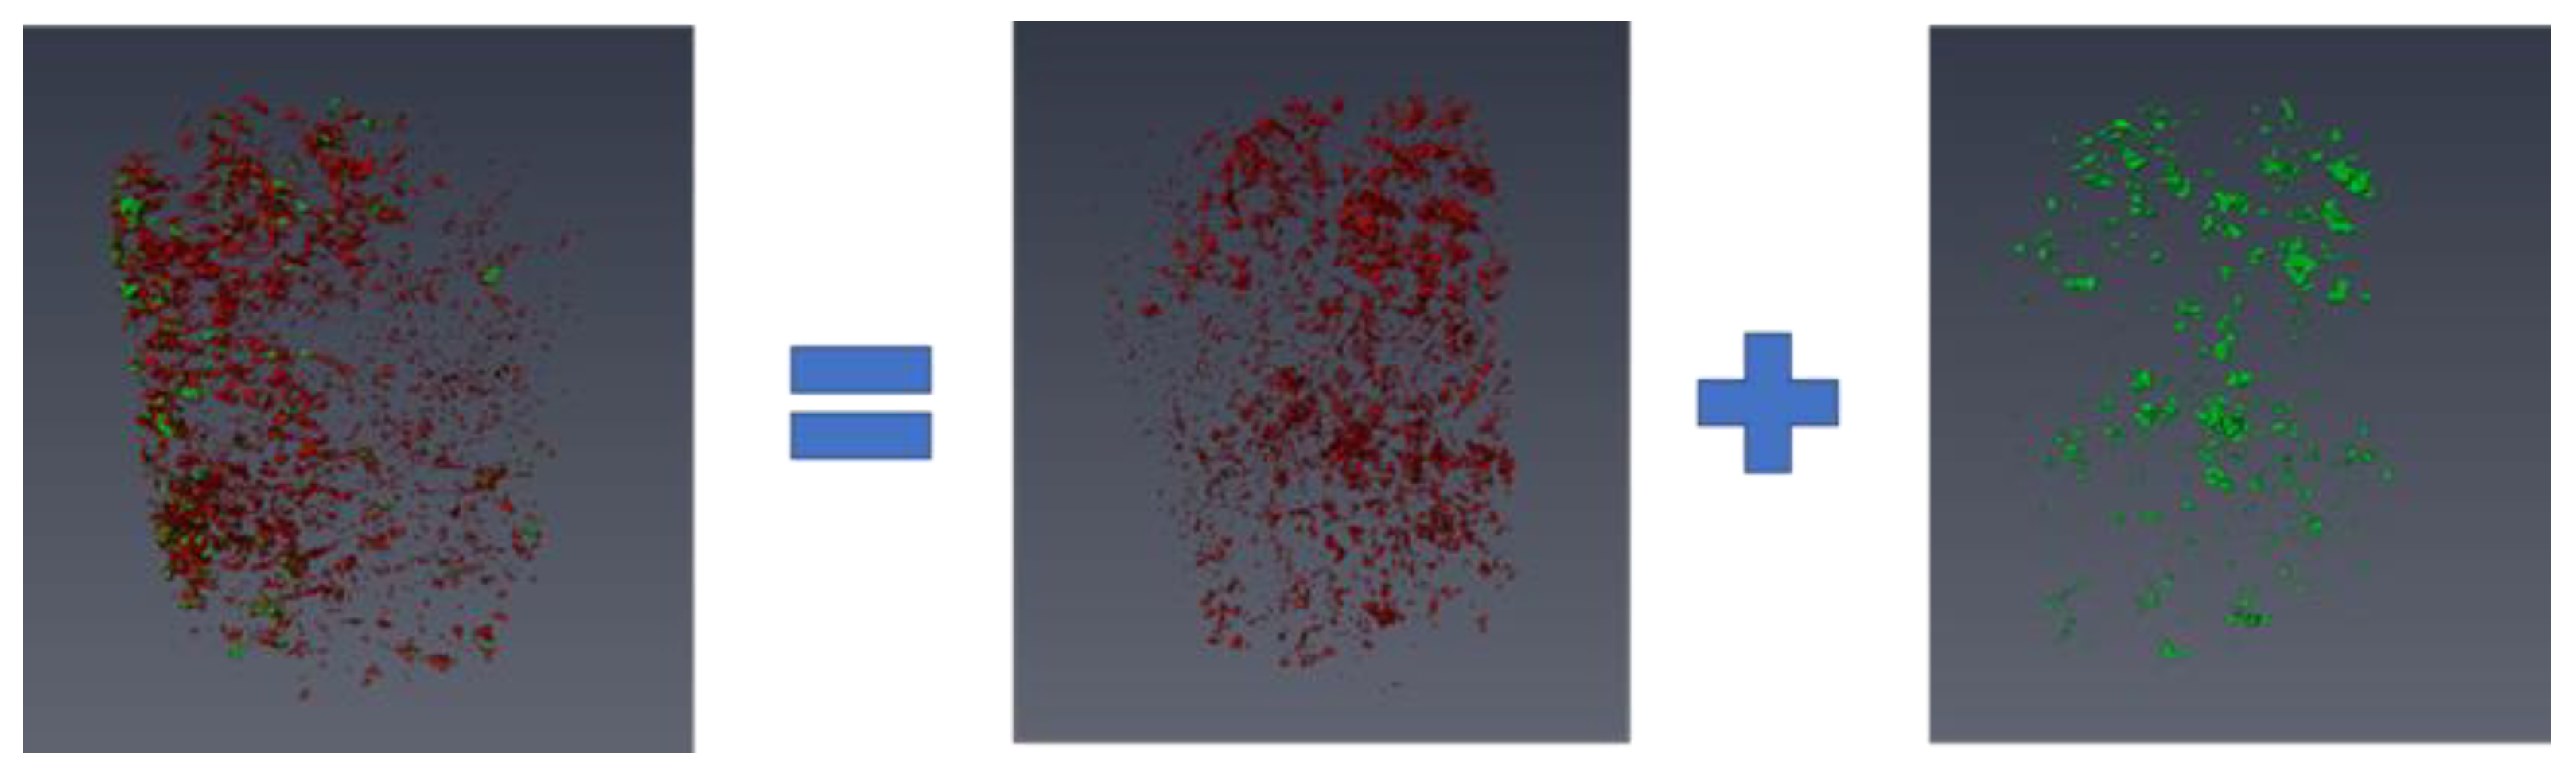
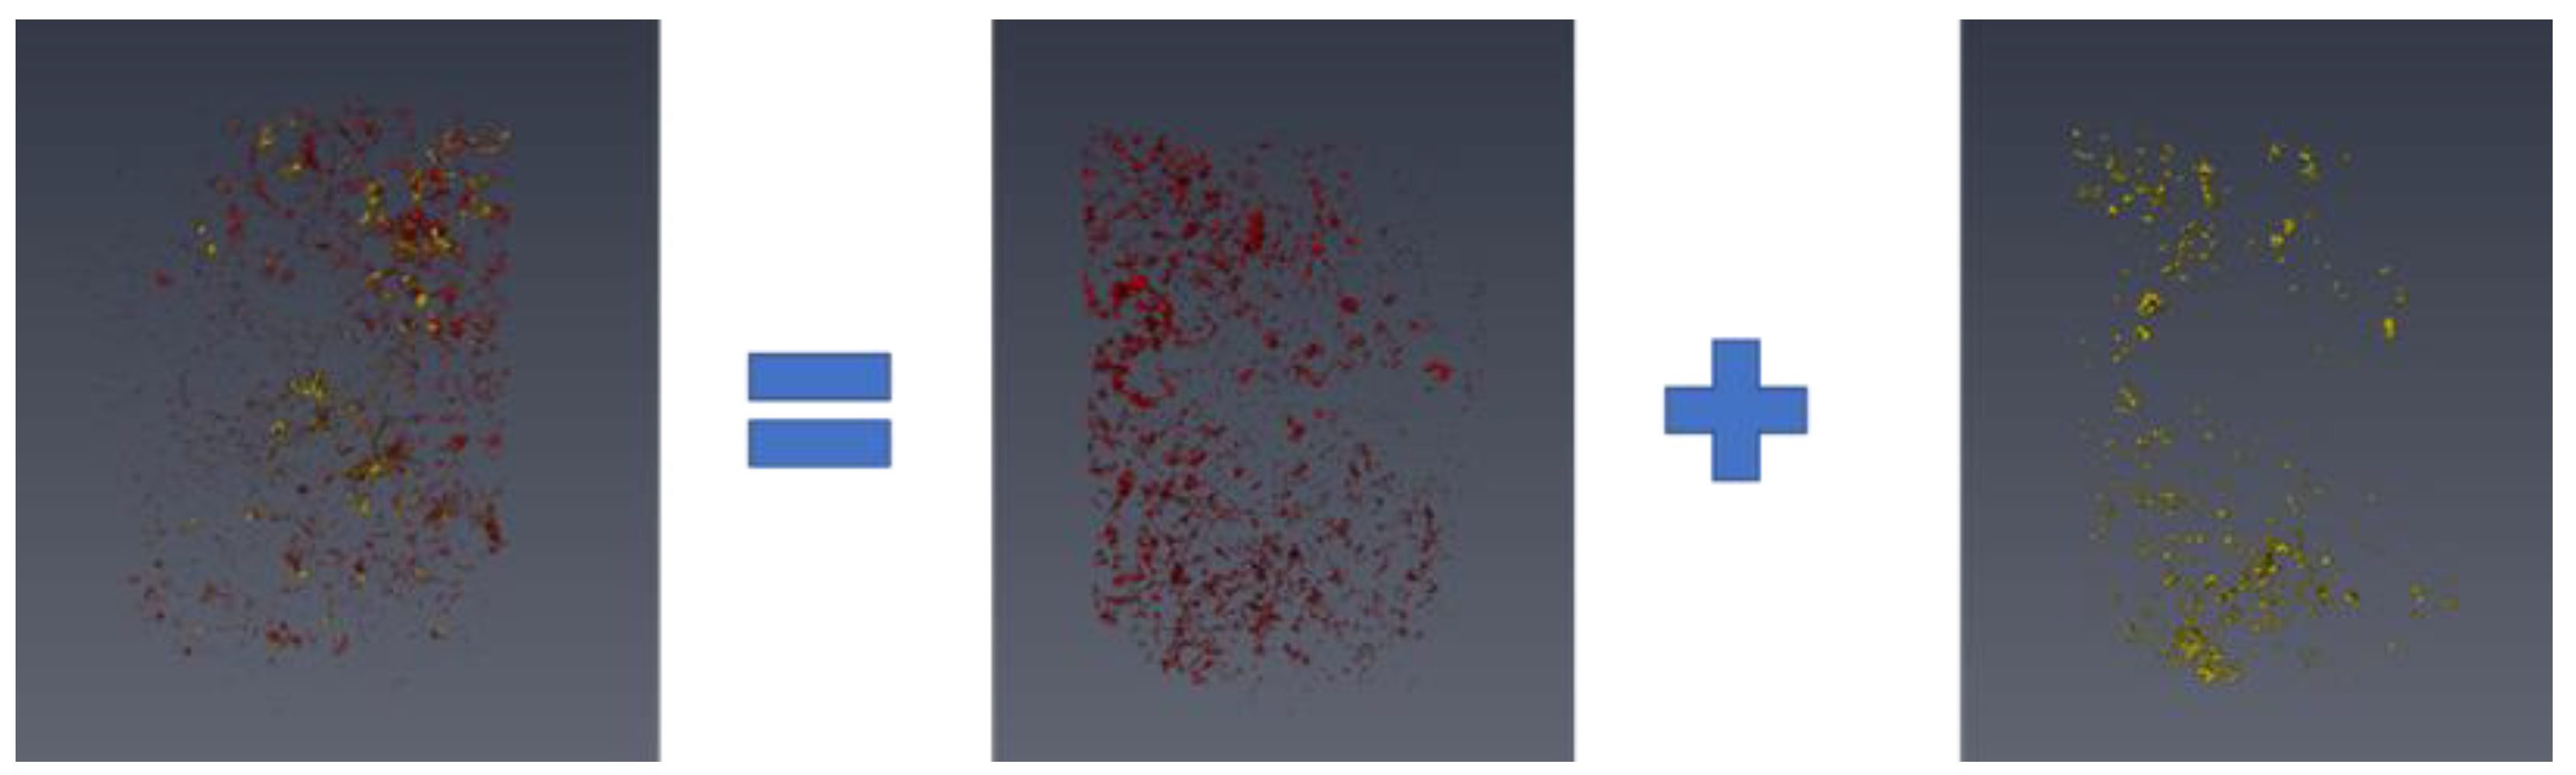
4.4. Saturated Crude Oil →1st Water Flooding → CO2 Flooding → 2nd Water Flooding

Y56–19 core test process: dry sample → saturated formation water → saturated crude oil → 1st water flooding → CO2 flooding → 2nd water flooding. The specific operation of each step was the same as that of the Y53–89 core, except that the Y56–19 core was subject to an additional step of formation water saturation between the dry core and the saturated crude oil (Figure 18).
(1) The first water flooding: a certain amount of crude oil in the pores was produced by water flooding, and the capillary force played a major role in water flooding, but there were still a lot of crude oil residue in the pore space. The micro-oil displacement mechanism was mainly of the stuck or crawling type. The existence of irreducible water promoted the occurrence of the stuck state and improved the saturation of the residual oil. The residual oil was mainly in thin films and as continuous oil (Figure 19).
(2) The CO2 flooding: The three-dimensional diagram of the CO2 continuous flooding shows that the crude oil remaining in the pore space was again displaced and recovered by CO2, and the gas buoyancy made the CO2 displace the crude oil in the rock core in the upward direction, which spread the crude oil in the pores perpendicularly to the mainstream line, thereby improving the oil displacement efficiency. The form of the residual oil was mainly in thin films and as isolated oil (Figure 20).
(3) The second water flooding: the three-dimensional image of the second water flooding shows that the residual crude oil was further displaced and produced by water flooding; the residual oil was further reduced, and the residual oil was mainly distributed in dispersed and star shapes and as isolation oil (Figure 21).
The micro-CT identification of the Y56–19 core shows that the percentage of the porosity greater than 1 μm was 9.20%, that of the saturated crude oil was 84.22%, and that of the oil displacement efficiency after primary water flooding was about 26.21%; the oil displacement efficiency after CO2 flooding increased by 18.89%, and the oil recovery after continuous water flooding increased by about 9.98%. The total amount of CO2 injected was about 0.6 PV, the CO2 remaining in the rock core accounted for about 1.99%, and the buried CO2 proportion was about 38.16% (Figure 22).

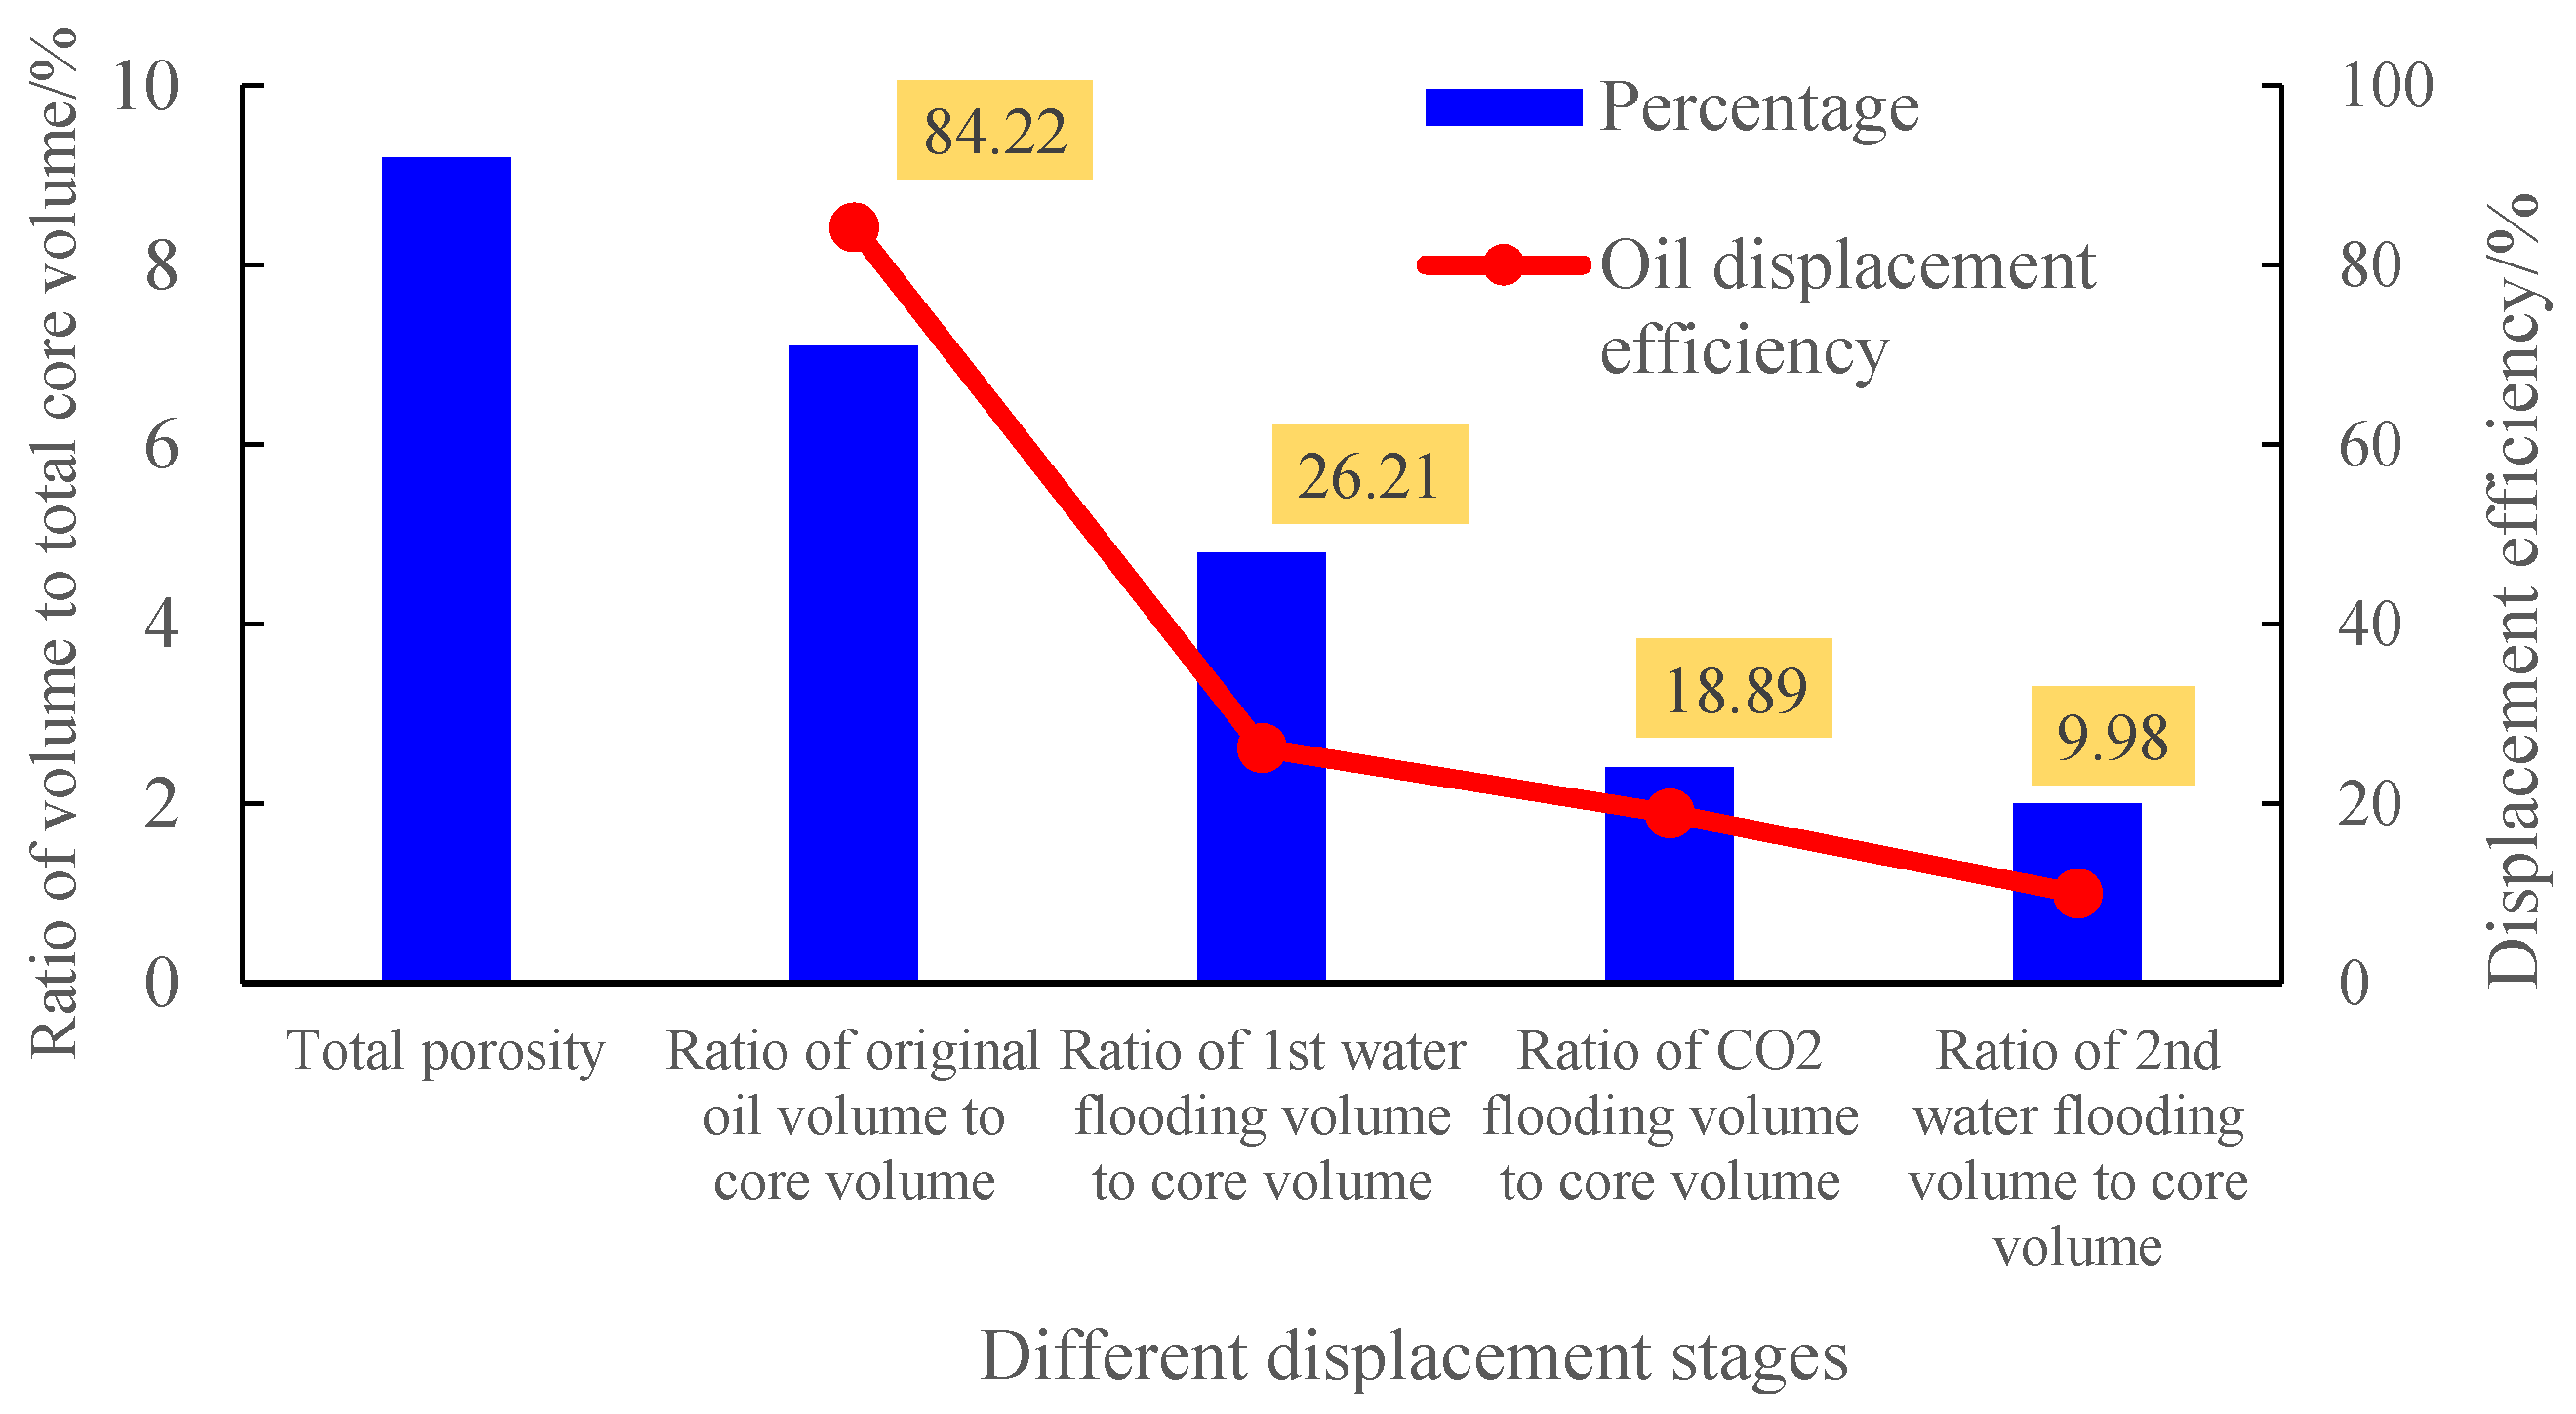
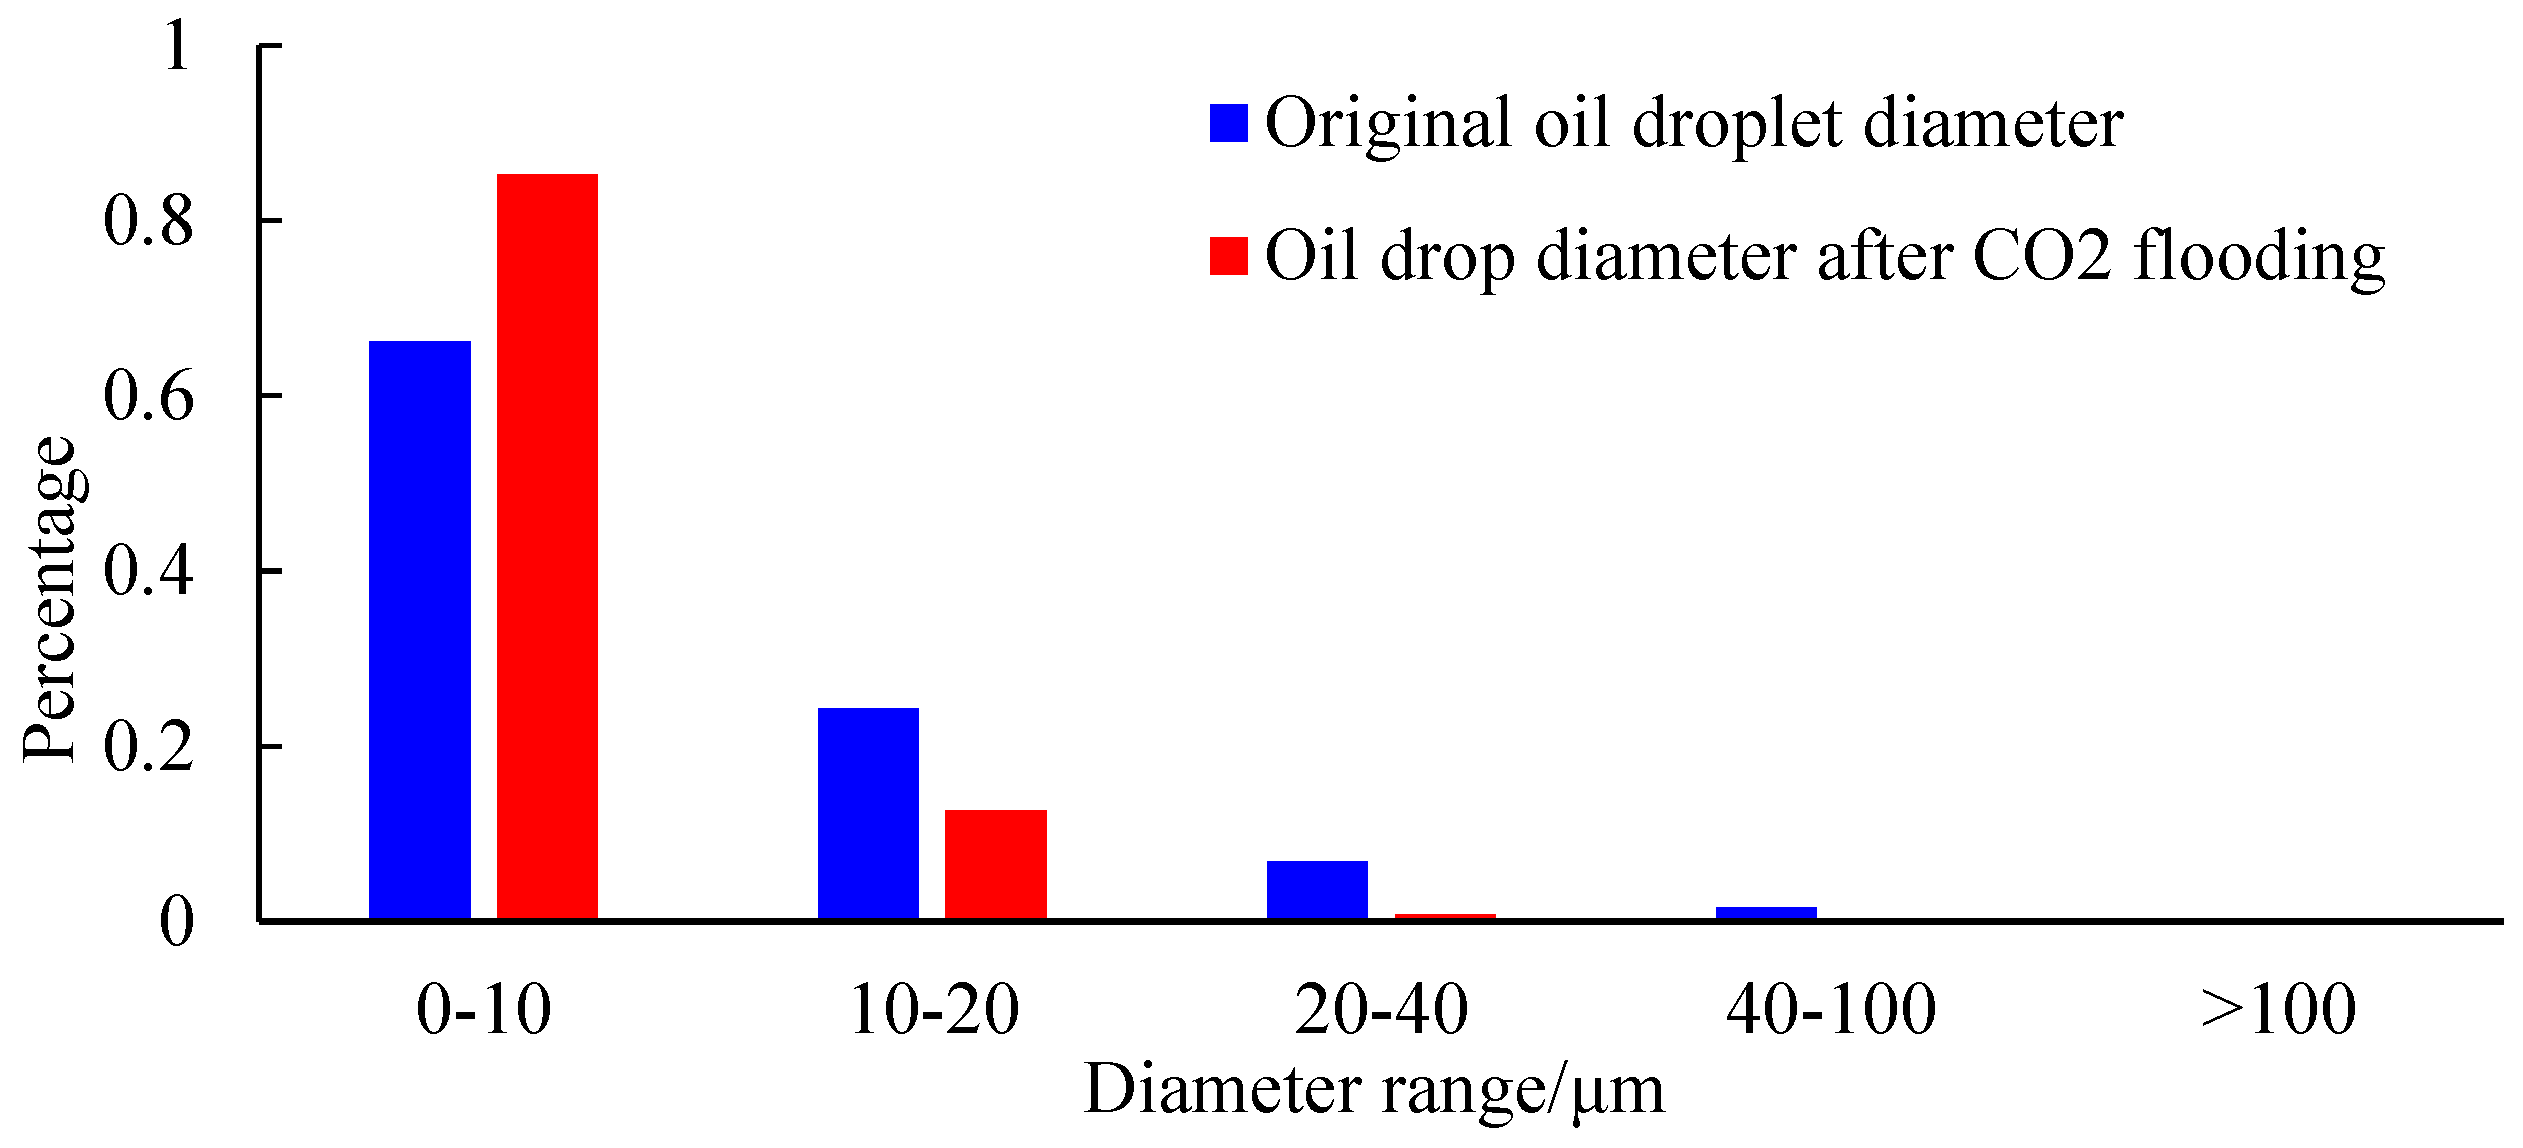
4.5. Discussion of Flooding of the Cores

The comparison of the different cores before and after displacement shows that the crude oil in the larger pores decreased after the displacement as shown in Figure 23, Figure 24, Figure 25 and Figure 26, indicating that the oil in the macropores and mesopores was recovered, and that the remaining oil was transformed into smaller oil droplets; the number of oil droplets with a diameter greater than 10 μm was reduced, while the number of oil droplets with a diameter less than 10 μm increased. The remaining oil in the produced pores was mainly present in the form of oil films or corner oil. The alternate injection of gas and water further reduced the remaining oil in the macropores. The proportion of the remaining oil in the medium and small pores was large, which is the key object of tapping the production potential in the later stage.
Micro-CT can identify pores with sizes greater than 1 μm; the lower the permeability and porosity, the lower the saturable crude oil. The micro-CT identifiable pore amounts in the Y29–100, Y40–92, Y53–89, and Y56–19 cores were 5.3%, 7.07%, 8.8%, and 9.1%, respectively; the percentage of the saturated crude oil in the cores was 32%, 81%, 84%, and 86%, respectively. The lower the core permeability, the worse the oil displacement efficiency; this is because the micro-heterogeneity of porous media makes the capillary force of displacement quite different, and fingering and around flow become the main oil displacement mechanism. In the alternating water gas displacement experiment, the different surface tension between oil, gas, and water leads to different capillary forces, and different forces are generated in the displacement process, which breaks the original water flow channel, forms a new oil displacement channel and unstable pressure field, suppresses gas channeling, increases the sweep coefficient, and is conducive to improving the crude oil recovery. After CO2 displacement in the experimental core, the three-dimensional volume ratio of oil, gas, and water obtained by the micro-CT experiment shows that the buried rate of CO2 was 38.16~46.89%.

5. Conclusions

(1) Micro-CT can identify smaller pores with sizes larger than 1 μm; the lower the core porosity and permeability of the tight sandstone, the lower the corresponding initial oil saturation and oil displacement efficiency.
(2) After CO2 flooding, gas flooding, or gas flooding alternating with water displacement, the volume and diameter of the oil droplets gradually decrease, and the remaining oil is distributed continuously in thin films. The thin-film oil is swept into the pores by CO2 flooding, and oil films and corner oil generally exist in pores with sizes less than 10 μm. Contiguous oil that is not swept after gas flooding and water flooding exists mainly in pores with sizes less than 10 μm. There is more residual oil in tshe small and medium pores, which are the key target in the later stage of oilfield development.
(3) The different displacement methods show that the oil displacement efficiency after CO2 miscible displacement is 41.67%, after CO2 flooding → water flooding is 44.42%, after the first water flooding → CO2 flooding → second water flooding is 49.44%, and after saturated crude oil → first water flooding → CO2 flooding → second water flooding is 55.08%. The higher the core permeability, the better the oil displacement effect.
(4) The storage rate of CO2 measured by micro-CT is 38.16~46.89%. Low-permeability formations and gas flooding alternating with water are conducive to CO2 storage.

Author Contributions

Conceptualization, methodology, software, data curation, visualization, supervision and funding acquisition, P.Y.; validation, formal analysis, project administration and writing—original draft preparation F.L.; review and editing, K.Y., C.H., X.L. and L.D. investigation, C.R., J.Z.; resources, X.W.; Methodology, Q.F. All authors have read and agreed to the published version of the manuscript.

Funding

This research was funded by the National Natural Science Foundation of China (Grant No. 51804253, No. 51974253, No. 51874239, No. 52074226), Innovation Capability Support Program of Shaanxi (Grant No. 2022KJXX-63).

Institutional Review Board Statement

Not applicable.

Informed Consent Statement

Not applicable.

Data Availability Statement

Not applicable.

Conflicts of Interest

The authors declare no conflict of interest.

References

  1. Hu, W.; Lv, C.; Wang, R.; Yang, Y.; Wang, X. Mechanism of CO2 immiscible flooding and distribution of remaining oil in water drive oil reservoir. Pet. Geol. Recovery Effic. 2017, 24, 99–105. [Google Scholar] [CrossRef]
  2. Li, K.; Li, P.; Wei, M.; Qiang, X.; Li, X. A pilot project of CO2 enhanced oil recovery and storage in Chang 8 extra-low permeability reservoir in Huang 3 district of Changqing oilfield. J. Eng. Geol. 2021, 29, 1488–1496. [Google Scholar] [CrossRef]
  3. Gao, J.; Han, D.; Wang, J.-L.; Wu, K.-Y.; Liu, L. Application of CT scanning image technique to study of oil saturation distribution in core displacement test. Xinjiang Pet. Geol. 2009, 30, 269–271. [Google Scholar]
  4. Guo, Y.; Ou, Y.C.X. Experimental study on improving oil displacement efficiency of low-permeability core with CT scan. China Sci. Pap. 2020, 15, 476–480. [Google Scholar]
  5. Li, J.; Jiang, H.; Wang, C.; Zhao, Y.; Gao, Y.; Pei, Y.; Wang, C.; Dong, H. Pore-scale investigation of microscopic remaining oil variation characteristics in water-wet sandstone using CT scanning. J. Nat. Gas Sci. Eng. 2017, 48, 36–45. [Google Scholar] [CrossRef]
  6. Liu, Y.; Wang, C.S.; Sun, Q.J. Digital core construction and seepage simulation of low permeability sandstone reservoir. Fault-Block Oil Gas Field 2017, 24, 817–821. [Google Scholar] [CrossRef]
  7. Deng, S.; Lv, W.; Liu, Q.; Leng, Z.; Tong, T.L. Research on displacement mechanism in conglomerate using CT scanning method. Pet. Explor. Dev. 2014, 41, 330–335. [Google Scholar] [CrossRef]
  8. Hou, J.; Luo, F.; Li, Z.; Bing, S.; Zhang, Y.; Li, J. The critical description scale study on core microscopic and reservoir macroscopic remaining oil. Pet. Geol. Recovery Effic. 2014, 21, 95–99. [Google Scholar] [CrossRef]
  9. An, S.; Yao, J.; Yang, Y.; Zhang, W.; Zhao, J.; Li, A. The microscale analysis of reverse displacement based on digital core. J. Nat. Gas. Sci. Eng. 2017, 48, 138–144. [Google Scholar] [CrossRef]
  10. Guo, C.; Wang, X.; Wang, H.; He, S.; Liu, H.; Zhu, P. Effect of pore structure on displacement efficiency and oil-cluster morphology by using micro computed tomography (μCT) technique. Fuel 2018, 230, 430–439. [Google Scholar] [CrossRef]
  11. Li, J.; Jiang, H.; Zhou, D.; Yang, Z.; Chen, W. Experimental study on the microscopic displacement mechanism of remaining oil by low salinity water flooding in the paleo-oil reservoir. Pet. Geol. Recovery Effic. 2018, 25, 104–109. [Google Scholar] [CrossRef]
  12. Li, J.; Cheng, B.; Liu, R.; Meng, F.; Liu, Y.; Gao, Y.; Ma, K.; Jiang, H. Microcosmic mechanism of water sensitivity in pore-scale conglomerate based on digital core. Acta Pet. Sin. 2019, 40, 594–603. [Google Scholar]
  13. Han, J.; Han, S.; Kang, D.H.; Kim, Y.; Lee, J.; Lee, Y. Application of digital rock physics using X-ray CT for study on alteration of macropore properties by CO2 EOR in a carbonate oil reservoir. J. Pet. Sci. Eng. 2020, 189, 1–12. [Google Scholar] [CrossRef]
  14. Yang, Y.; Cai, S.; Yao, J.; Zhong, J.; Zhang, K.; Song, W.; Zhang, L.; Sun, H.; Lisitsa, V. Pore-scale simulation of remaining oil distribution in 3D porous media affected by wettability and capillarity based on Volume of Fluid method. Int. J. Multiph. Flow. 2021, 143, 1–14. [Google Scholar] [CrossRef]
  15. Wang, Z.; Zhao, H.; Zhu, G. Storage characteristics of residual oil in water drive of porous bioclastic limestone reservoir. Fault-Block Oil Gas Field 2021, 28, 392–396. [Google Scholar] [CrossRef]
  16. Adebayo, A.R.; Kandil, M.E.; Okasha, T.M.; Sanni, M.L. Measurements of electrical resistivity, NMR pore size and distribution, and x-ray CT-scan for performance evaluation of CO2 injection in carbonate rocks: A pilot study. Int. J. Greenh. Gas Control 2017, 63, 1–11. [Google Scholar] [CrossRef]
  17. Gunde, A.C.; Bera, B.; Mitra, S.K. Investigation of water and CO2 (carbon dioxide) flooding using micro-CT (micro-computed tomography) images of Berea sandstone core using finite element simulations. Energy 2010, 35, 5209–5216. [Google Scholar] [CrossRef]
  18. Saraf, S.; Bera, A. A Review on pore-scale modeling and CT scan technique to characterize the trapped carbon dioxide in impermeable reservoir rocks during sequestration. Renew. Sustain. Energy Rev. 2021, 144, 110986. [Google Scholar] [CrossRef]
  19. Cao, Y.N. Study on core micro-displacement process by CT scanning technology. Sci. Technol. Eng. 2015, 15, 64–69. [Google Scholar]
  20. Yu, Y.; Xu, H.; Gao, X.; Jiang, T.; Fang, H.; Sun, T. Distribution and occurrence of microscopic remaining oil at different scales in Marine clastic reservoir: A case study of Donghe sandstone in Hudson Oilfield. Acta Pet. Sin. 2018, 39, 1397–1409. [Google Scholar] [CrossRef]
  21. Tang, J.; Vincent-Bonnieu, S.; Rossen, W.R. CT coreflood study of foam flow for enhanced oil recovery: The effect of oil type and saturation. Energy 2019, 188, 1–11. [Google Scholar] [CrossRef]
  22. Xie, M.Y.; Dai, Z.; Luo, D.H. A new method for residual oil characteristics analysis of heavy oil reservoirs based on micron CT scanning displacement experiment. Unconv. Oil Gas 2020, 7, 102–107. [Google Scholar]
  23. Lv, W.; Leng, Z.; Zhang, Z.; Ma, D.; Liu, Q.; Wu, K.; Li, T. Study on water flooding mechanism of low permeability core using CT scanning technology. Pet. Geol. Recovery Effic. 2013, 20, 87–91. [Google Scholar]
Figure 1. Core displacement and online CT scanning device.
Energies 15 06201 g001
Figure 2. The flow chart of preparing the small core sample for CT scanning.
Energies 15 06201 g002
Figure 3. Three-dimensional slice of the pores and mineral skeleton of the initial dry sample (gray map).
Energies 15 06201 g003
Figure 4. The initial dry sample (blue represents the pores of the rock sample).
Energies 15 06201 g004
Figure 5. CT diagram of the saturated oil sample (blue is the irreducible water and red is oil).
Energies 15 06201 g005
Figure 6. Distribution of fluid in the pore space under different states (gray represents rock, black represents oil, white represents minerals). (a) Dry rock sample. (b) Saturated oil (irreducible water). (c) Residual oil (CO2 flooding oil).
Energies 15 06201 g006
Figure 7. CT scanning distribution of the oil (residual oil), gas (CO2), and water (yellow is gas, red is residual oil, and blue is irreducible water).
Energies 15 06201 g007
Figure 8. The Y29–100 core displacement efficiency and ratio of volume to core total volume in different stages.
Energies 15 06201 g008
Figure 9. CT scanning images under different displacement states in rock samples. (a) Dry rock sample. (b) Saturated crude oil. (c) CO2 flooding. (d) Water flooding.
Energies 15 06201 g009
Figure 10. CO2 flooding in the rock samples (red is the distribution of crude oil after CO2 flooding, and yellow is the injected CO2).
Energies 15 06201 g010
Figure 11. The rock sample after water flooding (green is the injected water and red is the remaining oil after water flooding).
Energies 15 06201 g011
Figure 12. The Y40–92 core displacement efficiency and ratio of volume to total core volume in different stages.
Energies 15 06201 g012
Figure 13. CT scanning results of the Y53–89 core under different displacement states. (a) Dry rock sample. (b) Saturated crude oil. (c) First water flooding. (d) CO2 flooding. (e) Second water flooding.
Energies 15 06201 g013
Figure 14. Y53–89 core after the first water flooding.
Energies 15 06201 g014
Figure 15. Y53–89 core after CO2 flooding (red is the distribution of crude oil after gas flooding and yellow is the injected CO2).
Energies 15 06201 g015
Figure 16. Y53–89 core after the 2nd water flooding (green is the injected water and red is the remaining oil after water flooding).
Energies 15 06201 g016
Figure 17. Displacement efficiency of the Y53–89 core and ratio of volume to total core volume in different stages.
Energies 15 06201 g017
Figure 18. CT scanning results of the Y56–19 core under different displacement states. (a) Dry rock sample. (b) Saturated crude oil. (c) First water flooding. (d) CO2 flooding. (e) Second water flooding.
Energies 15 06201 g018
Figure 19. The first water flooding of the Y56–19 core.
Energies 15 06201 g019
Figure 20. Y56–19 core after CO2 flooding (red is the distribution of crude oil and yellow is the injected CO2).
Energies 15 06201 g020
Figure 21. Three-dimensional schematic diagram of the Y56–19 core after the second water flooding (red is the distribution of the crude oil and yellow is the injected CO2).
Energies 15 06201 g021
Figure 22. The Y56–19 core displacement efficiency and ratio of volume to total core volume in different stages.
Energies 15 06201 g022
Figure 23. Distribution of the residual oil drop diameter of the Y29–100 core.
Energies 15 06201 g023
Figure 24. Distribution of the residual oil drop diameter of the Y40–92 core.
Energies 15 06201 g024
Figure 25. Distribution of the residual oil drop diameter of the Y53–89 core.
Energies 15 06201 g025
Figure 26. Distribution of the residual oil drop diameter of the Y56–19 core.
Energies 15 06201 g026
Table 1. Physical properties and displacement mode of the four core samples.
Well NamePorosity
(%)
Permeability
(mD)
Displacement Modes
Y29–1007.740.16Saturated crude oil → CO2 flooding
Y40–9210.220.59Saturated crude oil → CO2 flooding → water flooding
Y53–89 11.580.97Saturated crude oil → 1st water flooding → CO2 flooding → 2nd water flooding
Y56–1912.680.99Saturated formation water → saturated crude oil → 1st water flooding → CO2 flooding → 2nd water flooding
Publisher’s Note: MDPI stays neutral with regard to jurisdictional claims in published maps and institutional affiliations.

