Article

Performance Analysis and Optimization of a Cooling System for Hybrid Solar Panels Based on Climatic Conditions of Islamabad, Pakistan

1
Department of Mechanical Engineering, Institute of Space Technology, Islamabad 44000, Pakistan
2
Department of Electrical Engineering, College of Engineering, Taif University, Al-Hawiyah, Taif 11099, Saudi Arabia
*
Authors to whom correspondence should be addressed.
Energies 2022, 15(17), 6278; https://doi.org/10.3390/en15176278
Submission received: 21 July 2022 / Revised: 19 August 2022 / Accepted: 20 August 2022 / Published: 28 August 2022

Abstract

:
The unconvertible portion of incident radiation on solar panels causes an increase in their temperature and a decrease in efficiency due to the negative temperature coefficient of the maximum power. This problem is dealt with through the use of cooling systems to lower the temperature of photovoltaic (PV) panels. However, the developments are focused on the loss of efficiency or extract the heat out of the solar panel, rather than optimizing the solution to produce a net gain in the electric power output. Therefore, this study proposes the analytical model for the cell temperature, irradiance and design of absorbers. Furthermore, the cooling systems for the hybrid solar panels were developed through analytical modeling of the solar cell temperature behavior and heat exchange between the fluid and back surface of the PV module in MATLAB. The design parameters such as mass flow rate, input power, solar cell temperature, velocity, height, number of passes and maximum power output were optimized through a multi-objective, multivariable optimization algorithm to produce a net gain in the electrical power. Three layouts of heat absorbers were considered—i.e., single-pass ducts, multi-pass ducts, and tube-type heat absorbers. Water was selected as a cooling medium in the three layouts. The optimized results were achieved for the multi-pass duct with 31 passes that delivered a maximum power output of 186.713 W at a mass flow rate of 0.14 kg/s. The maximum cell temperature achieved for this configuration was 38.810 °C at a velocity of 0.092 m/s. The results from the analytical modeling were validated through two-way fluid-solid interaction simulations using ANSYS fluent and thermal modules. Analyses revealed that the multi-pass heat absorber reduces the cell temperature with the least input power and lowest fluid mass flow rate to produce the highest power output in the hybrid PV system.

1. Introduction

Fossil fuels supply most of the energy needs across the globe. Even though this source of energy is relatively easy to use, global warming and limited supply raise questions about its reliability. Solar panels converting solar energy to the electrical power are one of the most popular solutions to this problem. However, their efficiency decreases when their surface temperature increases, i.e., by 0.45% per degree increase from 25 °C [1]. Most solar panels are designed to work at 25–65 °C during normal operation. Hybrid solar panels have been developed that utilize a cooling system to control the temperature of solar panels and extract useful thermal energy [2]. A few studies have predicted the temperature behavior of solar panels [3] and efficiency loss due to heating [4,5], but the design of a suitable cooling system is mostly neglected. Cooling techniques are applied to reduce the efficiency loss. Numerous studies have divulged the development of hybrid solar panels in the 21st century. Arif et al. [6] researched back-surface air and water cooling techniques in 2010. Sargunanathan et al. [7] explained the front-surface passive and liquid emersion cooling techniques, and Waelia et al. [8] compared the efficiency output of different cooling methods. These authors investigated the optimization of the input power of photovoltaic/thermal (PV/T) systems as the major shortcoming in this field [7,8]. Garcı’a et.al analyzed the nominal operating conditions of the solar panels, and the results were validated with the experimental data [9]. Kurnik et al. [10] evaluated the performance of solar panels under different mounting conditions. Roof-mounted panels showed an elevated temperature difference of 55 °C in comparison to the ground-mounted systems. Later, the theoretical model was proposed to assess the electrical and the thermal characteristics of the solar panels [11]. The influences of various cooling systems (e.g., TEM and PCM) were experimentally investigated by Fatih et al. [12]. They reported that these cooling systems have a positive impact on PV panels.
Numerous researchers selected air as a cooling medium because it is a relatively cheaper technique that uses airflow to cool solar panels [13,14]. Tonui et al. [15] used airflow to improve the heat transfer process inside the thermal collector. The results for the glazed and unglazed single-pass collectors and a single pass collector with a suspended metal sheet/fins showed a high airflow rate and lower heat extraction due to a reduced convection coefficient. Some experimental investigations revealed that the cell temperature could be limited to 60 °C under enhanced natural air convection [13]. Arvind et al. [16] reduced the temperature of PV panels by duct air cooling. Cooling by one fan was more efficient than two fans, as the increased flow rate had very little influence on energy production. Some researchers used analytical 1D steady heat transfer energy balance modeling and experimental results [17,18]. Sarhaddi et al. [19] numerically modeled the glass-to-glass PV/T module and compared it with the experimental results of Joshi [17] to increase the performance. Hasan et al. [20] experimentally studied the PV/T solar panel with air intake from the center and achieved thermal and electrical efficiency of 48% and 6%, respectively, at 3 cm channel depth. However, the electrical and thermal efficiencies using integrated fin thermal collectors were increased to 13.75% and 56.19%, respectively [21]. A few researchers used water as a cooling medium [22,23,24], but [25,26,27] particularly used a water channel on the back surfaces of the solar panels. An experimental study was carried out for amorphous and polycrystalline solar panels with air and water collectors. The pc-PV panel achieved higher electrical efficiency with water cooling, but the amorphous panel showed more thermal efficiency [28]. In 2013, a numerical and experimental study was performed on water-cooled monocrystalline solar panels that delivered a 3% increase in electrical efficiency in comparison to ordinary solar panels [25]. Fudholi et al. [29] used multiple cooling layouts for water heat absorbers. The results revealed that the spiral tube system, with a mass flow rate of 0.01 kg/s, was the most efficient layout. In 2016, MATLAB simulations of glazed and unglazed PV/T panels were performed under the laminar and turbulent regimes. The unglazed solar panel with a turbulent flow regime showed higher thermal energy efficiency [30]. Other cooling techniques include liquid immersion [31,32,33] and spray/water film cooling [22] from the front surface of the solar panel. Abdolzadeh and Ameri [34] and Tabaei and Ameri [35] used a water pump to spray water on the front surface of the solar panel. Odeh and Behnia [36] experimentally investigated the performance of trickling down water on a panel’s front surface. The temperature was reduced to 32 °C, and the output was also increased. Rafal and Maciej [37] worked on a hybrid solar system with various configurations for climatic conditions. Their research shows that the efficiency of the solar system is enhanced by the right configurations. Another study by Rafal and Maciej [38] used experimental and numerical techniques to analyze a hybrid heating and cooling system under different climatic conditions to increase the system’s performance. A solar-driven hybrid adsorption–compression cooling system was theoretically investigated in three configurations by Mohamed et al. [39]. They concluded that the hybridization of new solar-powered adsorption vapor compression cooling systems is proficient and economically advantageous for the advancement and commercialization of cooling applications.
A background study revealed that the methods developed to cool solar panels include air and water cooling systems, liquid immersion techniques, and passive cooling systems. The shortcomings are in the design of the cooling system. Researchers have used cooling techniques to validate their models or prove an increase in efficiency by pure experimental studies. The solar to electrical conversion efficiency of solar panels decreases with temperature, and in months where most of the solar energy is available, it starts to lose potential. This research was focused on finding a solution to this problem and working on the development of hybrid solar panels to increase the efficiency of this renewable energy source. Therefore, this work applied mathematical modeling and simulation techniques to design and analyze a suitable cooling system for PV panels. The layout of this paper is as follows. Section 2 discusses the description of the problem and provides a brief overview of the methodology. Section 3 provides the mathematical modeling for single, multi-pass, and tube-type absorbers. Section 4 optimizes the solution using the multivariable genetic algorithm available as a MATLAB function. Section 5 validates the results through ANSYS CAE simulations, followed by a discussion on results, conclusions, and future recommendations.

2. Problem Description and Methodology

The efficiency of solar panels decreases as the temperature increases. Therefore, the goal is to minimize the effect of increases in temperature due to absorbed solar radiation and the ambient temperature (based on the climatic conditions of Islamabad, Pakistan). The specifications of the PV module used for analysis are given in Table 1. A cooling system for PV panels was designed using a mathematical and simulation approach. The factors such as cooling medium, heat transfer area, mass flow rates, and heat exchanger layouts were analyzed to develop a better configuration for thermal collectors that delivers a net gain. The problem with hybrid solar panels is the input required for cooling or extraction of solar energy. Therefore, cooling techniques have been optimized to ascertain a better energy production per unit area.

3. Mathematical Modeling

The analytical modeling of the solar panel consisted of energy balancing its components. It was carried out with the assumption [40] that there was only 1D heat input to the system; all the processes involved were in a quasi-steady state; and the densities, heat transfer coefficients, heat capacities, and viscosities were treated as constants. Heat transfer occurs in two modes, i.e., (1) due to solar radiation absorbed by solar panels; (2) convective heat transfer between the solar panel and ambient air. Initially, the solar radiation falls on highly transparent glass that allows the light radiation to pass to the solar panel. The radiation transferred to the panel is τ g I (t), where I is the incident radiation and τ g is the transmissivity of the glass cover. The incident radiation is converted to electrical power with an efficiency of ɳ , and the rest is absorbed by solar panels with absorptivity, α c . The remaining fraction of the radiation, 1 − β, is absorbed by packing material. Tedlar is used as packing material: β is the packing factor and absorptivity is α t . The thermal circuit of the PV module is shown in Figure 1.

3.1. Analytical Model of a PV Panel

Energy balancing was carried out using the mathematical function from ziapour et al. [41]. Energy absorbed and lost by convection and conduction was equated to form a relationship for cell temperature Tc in terms of irradiance and ambient temperature.
T c = I ( t ) × τ g ( α c β ɳ α c β α t + α t β ) + ( U t + U T ) T a U t + U T
The values for ambient temperature and irradiance on solar panels change with time during the whole day. The mathematical procedure for analysis is discussed below.

3.1.1. Temperature Modeling

The sin linking days model [42] is used to find the hourly values of ambient temperature.
T ( t ) = ( T e m p ( n e x t ) + T e m p ( p r e v ) 2 ) [ ( T e m p ( n e x t ) T e m p ( p r e v ) 2 ) × cos ( π ( t t ( p r e v ) t ( n e x t ) t ( p r e v ) ) ]
where Temp(next) and Temp(prev) are known values of temperatures and t(next) and t(prev) is the time at which these temperatures occur. “t” is the time at which temperature is desired.

3.1.2. Irradiance Modeling

The hourly extraterrestrial radiation (I0) [43] to find the irradiance near the horizon is given by
I 0 = 12 × 3.6 π I s c E 0   × ( ( sin φ cos δ ) × ( sin ω 2 sin ω 1 ) + π ( ω 2 ω 1 ) 180 ( sin φ sin δ ) )
δ = ( 0.006918 0.399912 cos Γ + 0.070257 sin Γ 0.006758 cos 2 Γ + 0.000907 sin 2 Γ 0.002697 cos 3 Γ + 0.00148 sin 3 Γ ) ( 180 π )
E o = 1.000110 + 0.034221 cos Γ + 0.001280 sin Γ + 0.000719 cos 2 Γ + 0.000077 sin 2 Γ
The day angle Γ is calculated as
Γ = 2 π ( n 1 365 )
where n in Equation (6) is the day number.
The hour angle ω and the local solar time ST are given in Equations (7) and (8), respectively.
ω = 15 ( 12 S T )
S T = L T + E T 60 + 4 60 [ L s L L ]
where LT is the local standard time, L s is the standard meridian, L L is the longitude of the location under study, and EoT, the equation of time, is found by the following equation.
E o T = 9.87 sin 2 B 7.53 cos B 1.5 sin B
B = 360 ( n 81 ) 365
Considering the experimental values of irradiance from the metrological stations in specified locations, the hourly irradiance on the horizontal surface can be calculated [44]. The Erbs model [45] was developed by the US stations for 32° to 42° in latitude. Islamabad has a latitude of 33°. This model is suitable for a subtropical climate which is the same as that of Islamabad. The model is discussed below.
F o r   0 < M t 0.22 , I d = ( 1 0.09 M t ) I H
F o r   0.22 < M t 0.8   ,   I d = ( 0.9511 0.1604 M t + 3.388 M t 2 16.638 M t 3 + 12.336 M t 4 ) I H
F o r   0.8 < M t 1 , I d = 0.165 I H
M t = I H I 0
where Mt is clearness index. For this case, Mt is considered constant during the whole day.
I H = I b + I d
where IH, Ib, and Id are in turn the horizontal surface, and direct and diffused beam irradiance on the horizontal surface. Solar panels are placed at an angle to the horizontal axis. The Liu and Jordan isentropic model [46] gives satisfactory values of irradiance for the tilted surface in Pakistan.
I d β = ( 1 + cos β 2 ) × I d
I d β = r b I b
r b = I 0 β I 0 cos θ cos θ 2
θ z = cos 1 ( sin δ sin φ + cos δ cos φ cos ω )
I β β = I d β + I b β
where β is the tilt angle. The equations are solved for β = 23. To get smooth curves, the step size for the equation is 0.25 h instead of a whole hour.

3.2. Design of Absorber: Hybrid PV Panel

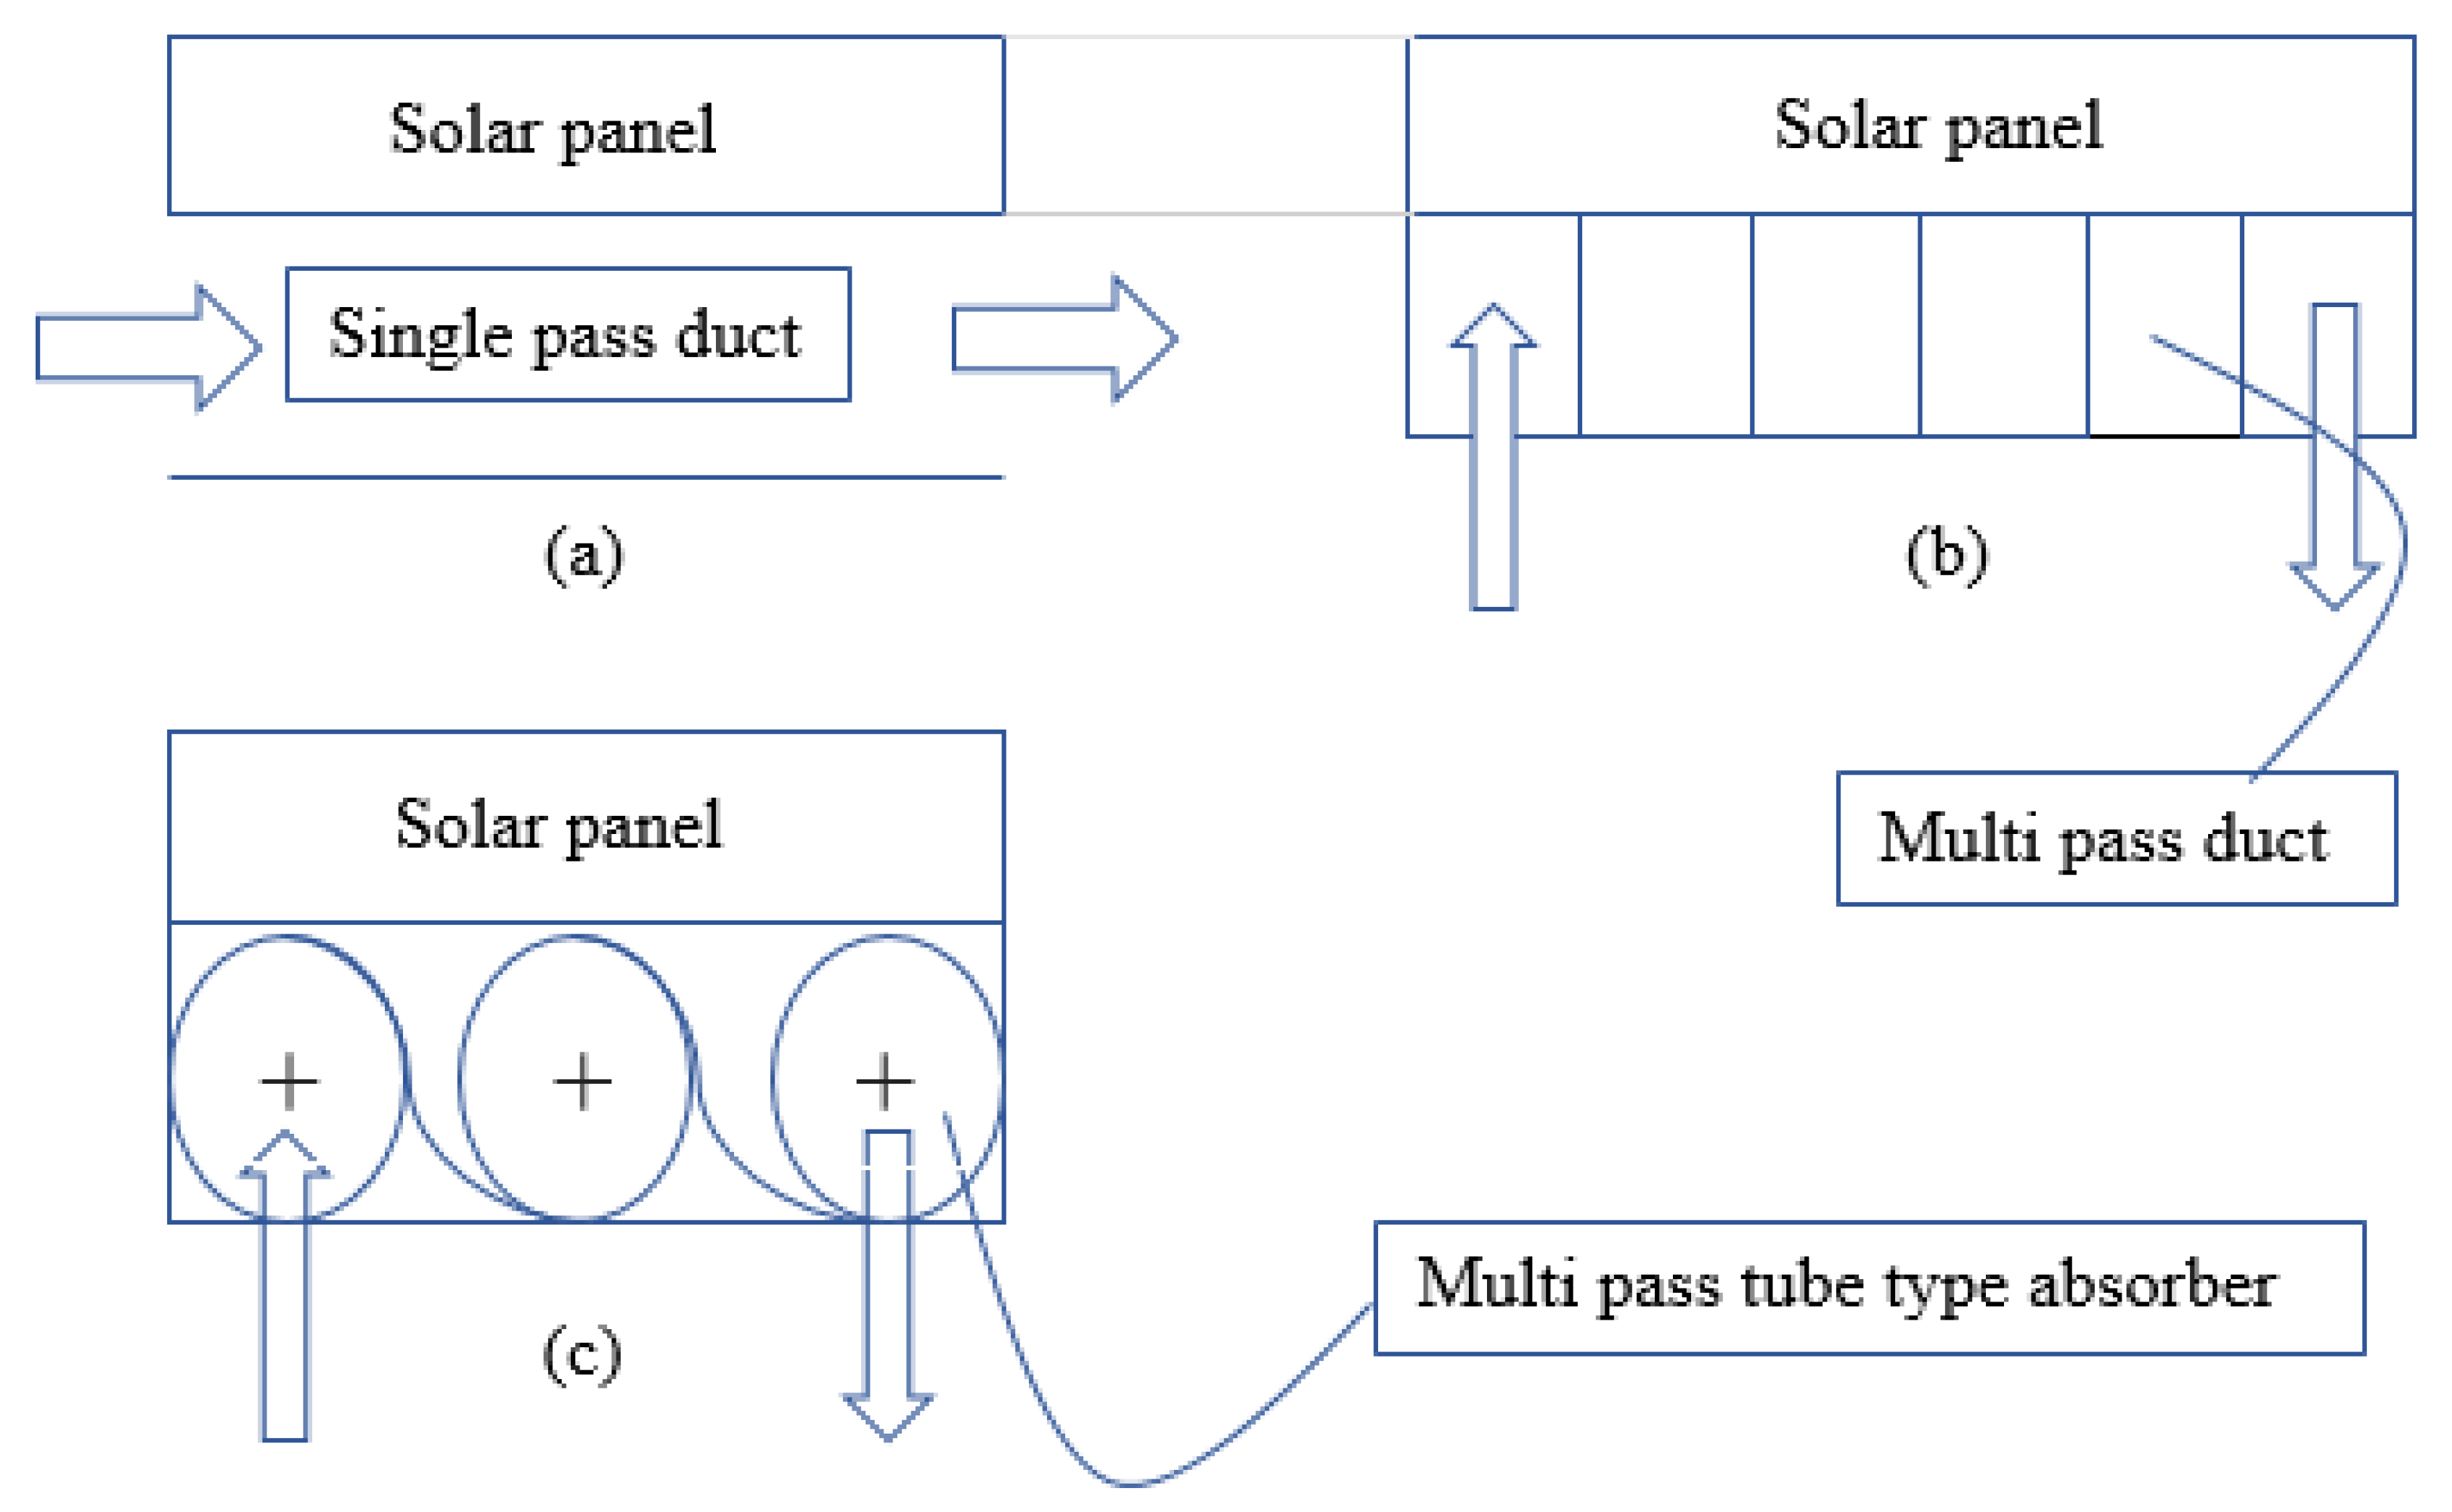
An absorber in the solar panel removes heat through the temperature difference and heat capacity of the fluid. The generalized layouts and the thermal circuit of PV/T for this study are depicted in Figure 2 and Figure 3, respectively. Figure 2a shows a single-pass duct in which fluid enters from one side and leaves without recirculating in the absorber. Figure 2b shows a multi-pass duct in which fluid circulates in the absorber many times before leaving. Figure 2c shows a tube-type absorber with multiple tubes.

3.2.1. Single-Pass Duct

In a single pass duct, fluid enters from one side and leaves without recirculating in the absorber. The energy balances across the solar cell, back surface, and absorber [41] are given in Equations (21)–(23), respectively.
I ( t ) τ g ( α c β ) + I ( t ) τ g α t ( 1 β ) = ( T c T a ) U t + U T ( T c T b s ) + I ( t ) τ g ɳ α c β
U T ( T c T b s ) b d x = h f ( T b s T f a v g ) b d x
h f ( T b s T f a v g ) = m C p d T f d x d x + U b ( T f T a ) b d x
Equation (24) provides the mathematical relation for back surface temperature.
T b s = h p 1 × I ( t ) × τ g ( α c β n α c β α t + α t β ) + U t T T a + h f T f a v g U t T + h f
Fluid outlet and average temperature are calculated using Equations (25) and (26), respectively.
T f o u t = ( h p 2 × h p 1 × I ( t ) × τ g ( α c β n α c β α t + α t β ) U L + T a ) × ( 1 e U L b L m C p ) + T f i n × e U L b L m C p
T f a v g = ( h p 2 × h p 1 × I ( t ) × τ g ( α c β n α c β α t + α t β ) U L + T a ) × ( 1 ( 1 e U L b L m C p U L b L m C p ) ) + T f i n ( 1 e U L b L m C p U L b L m C p )
    h p 2 = h f U t T + h f
U L = U t f + U b  
h p 1 = U T U t + U T

3.2.2. Multi-Pass Duct

In multi-pass ducts, the fluid circulates in the absorber “n” times. The fluid is supposed to enter in such a way that it does not have to face excessive elevation head losses during circulation. In this case, the solar panel is considered to be tilted along its length, so fluid enters from the long side and moves along the width. The final form of energy balance, fluid outlet, and average temperature equations for this type of absorber are very similar to those of the single-pass duct absorber, except for the flow cross-sectional area and total fluid flow length, which becomes n × width of the solar panel. The cross-sectional area of fluid flow is l × h and l = L/n. L is the total length, h is the height of the duct, and n is the number of passes.

3.2.3. Tube-Type Absorber

A tube-type absorber consists of a fluid flow in a single tube with “n” turns. The tubes considered in this case are rectangular, and these will have a large contact area with the back surface. If an absorber has n tubes each having contact d with the back surface, then n × d is the contact length of the solar panel and tubes and Lnd is the uncovered length. Consider a small segment that is equal to z + d, where z = (L − nd)/(n − 1), and using the same approach, the energy balance relations for the tube-type absorber are derived. Energy balances across the back surface and absorber are given in Equations (30) and (31), respectively.
U T ( T c T b s ) d . d x + U T ( T c T b s ) z . d x = h f ( T b s T f a v g ) d . d x + U b ( T b s T a ) z . d x
h f ( T b s T f a v g ) d . d x = m C p d T f d x d x + U b ( T f T a ) d . d x
By solving these equations and integrating results over the whole length, one can get
T c = I ( t ) × τ g ( α c β n α c β α t + α t β ) + U t T a + U T T b s U t + U T
T b s = h p 1 × I ( t ) × τ g ( α c β n α c β α t + α t β ) ( d + z ) + ( U t T ( d + z ) + h a z ) T a + h f T f a v g d U t T ( d + z ) + h a z + h f d
T f o u t = ( h p 2 × h p 1 × I ( t ) × τ g ( α c β n α c β α t + α t β ) U L + T a ) × ( 1 e U L n b d m C p ) + T f i n × e U L n b d m C p
T f a v g = ( h p 2 × h p 1 × I ( t ) × τ g ( α c β n α c β α t + α t β ) U L + T a ) × ( 1 ( 1 e U L n b d m C p U L n b d m C p ) ) + T f i n ( 1 e U L n b d m C p U L n b d m C p )  
U L = ( U t T ( d + z ) + h a z ) h f U t T ( d + z ) + h a z + h f d + U b
h p 2 = h f d U t T ( d + z ) + h a z + h f d
h p 1 = U T U t + U T
Table 2 shows the predefined constants and material dimensions for the PV module. The fill factor (FF) in Table 2 corresponds to the measure of the work performance of a solar PV module. EVA is ethylene vinyl acetate, a thermoplastic polymer material that is used in solar modules as an encapsulating agent; i.e., after the application of heat it forms a sealing and insulating film around the solar cells. Tedlar, on the other hand, is used as a backing material for the photovoltaic panel.
As shown in the table, Aluminum was chosen for the absorber’s structure due to its high conductivity, availability, and light weight. All designing and optimization were carried out according to the weather conditions for the month of June, the peak month for Islamabad. The inlet water temperature was set to 25 °C in analyses, unless mentioned otherwise.

4. Optimization

Optimization is a technique that enables us to find the best possible solutions available. The analytical equations can give infinite many solutions as the velocity and height of the duct are changed, and in the case of a multi-pass duct, there is another factor, i.e., the number of passes. The equations were solved at each value of velocity, and while keeping the other variables constant, relationships were found between maximum cell temperature and velocity and also between power and velocity. A similar procedure was followed for height and number of passes.
(i)
Expressions for Duct-Type Absorber
The independent variables are velocity and height of the duct, and the output variables are temperature and power input. The mathematical expressions, Equations (39)–(42), for the vast number of data points are given below.
x   ( 1 ) = H e i g h t , x ( 2 ) = V e l o c i t y ;
T c m a x = 9.18 × 10 6 x ( 1 ) 5 + 2.685 × 10 6 x ( 1 ) 4 2.997 × 10 5 x ( 1 ) 3 + 1.543 × 10 4 x ( 1 ) 2 160 x ( 1 ) + 40.15
P o w e r = ( 2.9484 × 10 4 x   ( 1 ) 2.7393 + 01.997 )
T c m a x = 0.1962 x   ( 2 ) ( 0.6781 ) + 35.53
P o w e r = 4438 x   ( 2 ) ( 2.832 ) + 2.467
(ii)
Expressions for Multi-Pass Duct
The independent variables are velocity, passes, and height of duct; and the output variables are temperature and power input. The expression generated from the data points is shown in Equations (43)–(48).
x   ( 1 ) = H e i g h t ,   x ( 2 ) = v e l o c i t y ,   x ( 3 ) = P a s s e s ;
T c m a x = 9.18 × 10 6 x ( 1 ) 5 + 2.685 × 10 6 x ( 1 ) 4 2.997 × 10 5 x ( 1 ) 3 + 1.543 × 10 4 x ( 1 ) 2 160 x ( 1 ) + 40.15
P o w e r = ( 2.9484 × 10 4 x   ( 1 ) 2.7393 + 01.997 )
T c m a x = 0.1962 x   ( 2 ) ( 0.6781 ) + 35.53
P o w e r = 4438 x   ( 2 ) ( 2.832 ) + 2.467
T c ( m a x ) = 0.1936 x ( 3 ) 0.949 + 36.73
P o w e r = 34.9 x 2.285 + 0.2964
(iii)
Expressions for Tube-Type Absorber
The independent variables are velocity and number of passes; and the output variables are temperature and the power input. The expression generated from the vast amount of data points is given in Equations (49)–(52).
x ( 1 ) = v e l o c i t y ,   x ( 2 ) = N u m b e r   o f   P a s s e s
T c ( m a x ) = 1.763 x ( 1 ) 0.7751 + 35.73
P o w e r = 6.173 x ( 1 ) 2.522 + 0.7508
P o w e r = 0.004039 x ( 1 ) + 0.6969
T c ( m a x ) = 45.47 x ( 3 ) 1.151 + 37.65

4.1. Genetic Algorithm

The genetic algorithm is a type of evolutionary algorithm. It belongs to the category of modern algorithms used commonly in the optimization of heat transfer problems, along with other applications. The equations defined above for duct-type, tube-type, and multi-pass duct absorbers are known as fitness functions. The analytical equations provide many solutions by varying the parameters such as the velocity, duct height, and the number of passes (multi-pass duct). The multi-objective, multivariable genetic optimization algorithm that is available as a MATLAB function can be applied to obtain the best results. A genetic algorithm chooses a vast population of input variables, and the population size is user-defined [47]. This population is checked according to fitness functions and refined. The constraints terminate the algorithm to get the data points that are the fittest according to the criteria. For example, in the mentioned problem, the constraints T c m a x and power input should be less than 40 °C and 10 W. The genetic algorithm chooses a random population and checks its fitness by testing them in fitness functions and refining the individuals with the fittest values, and repeating the process for the next generation of values until the terminating criteria are met.
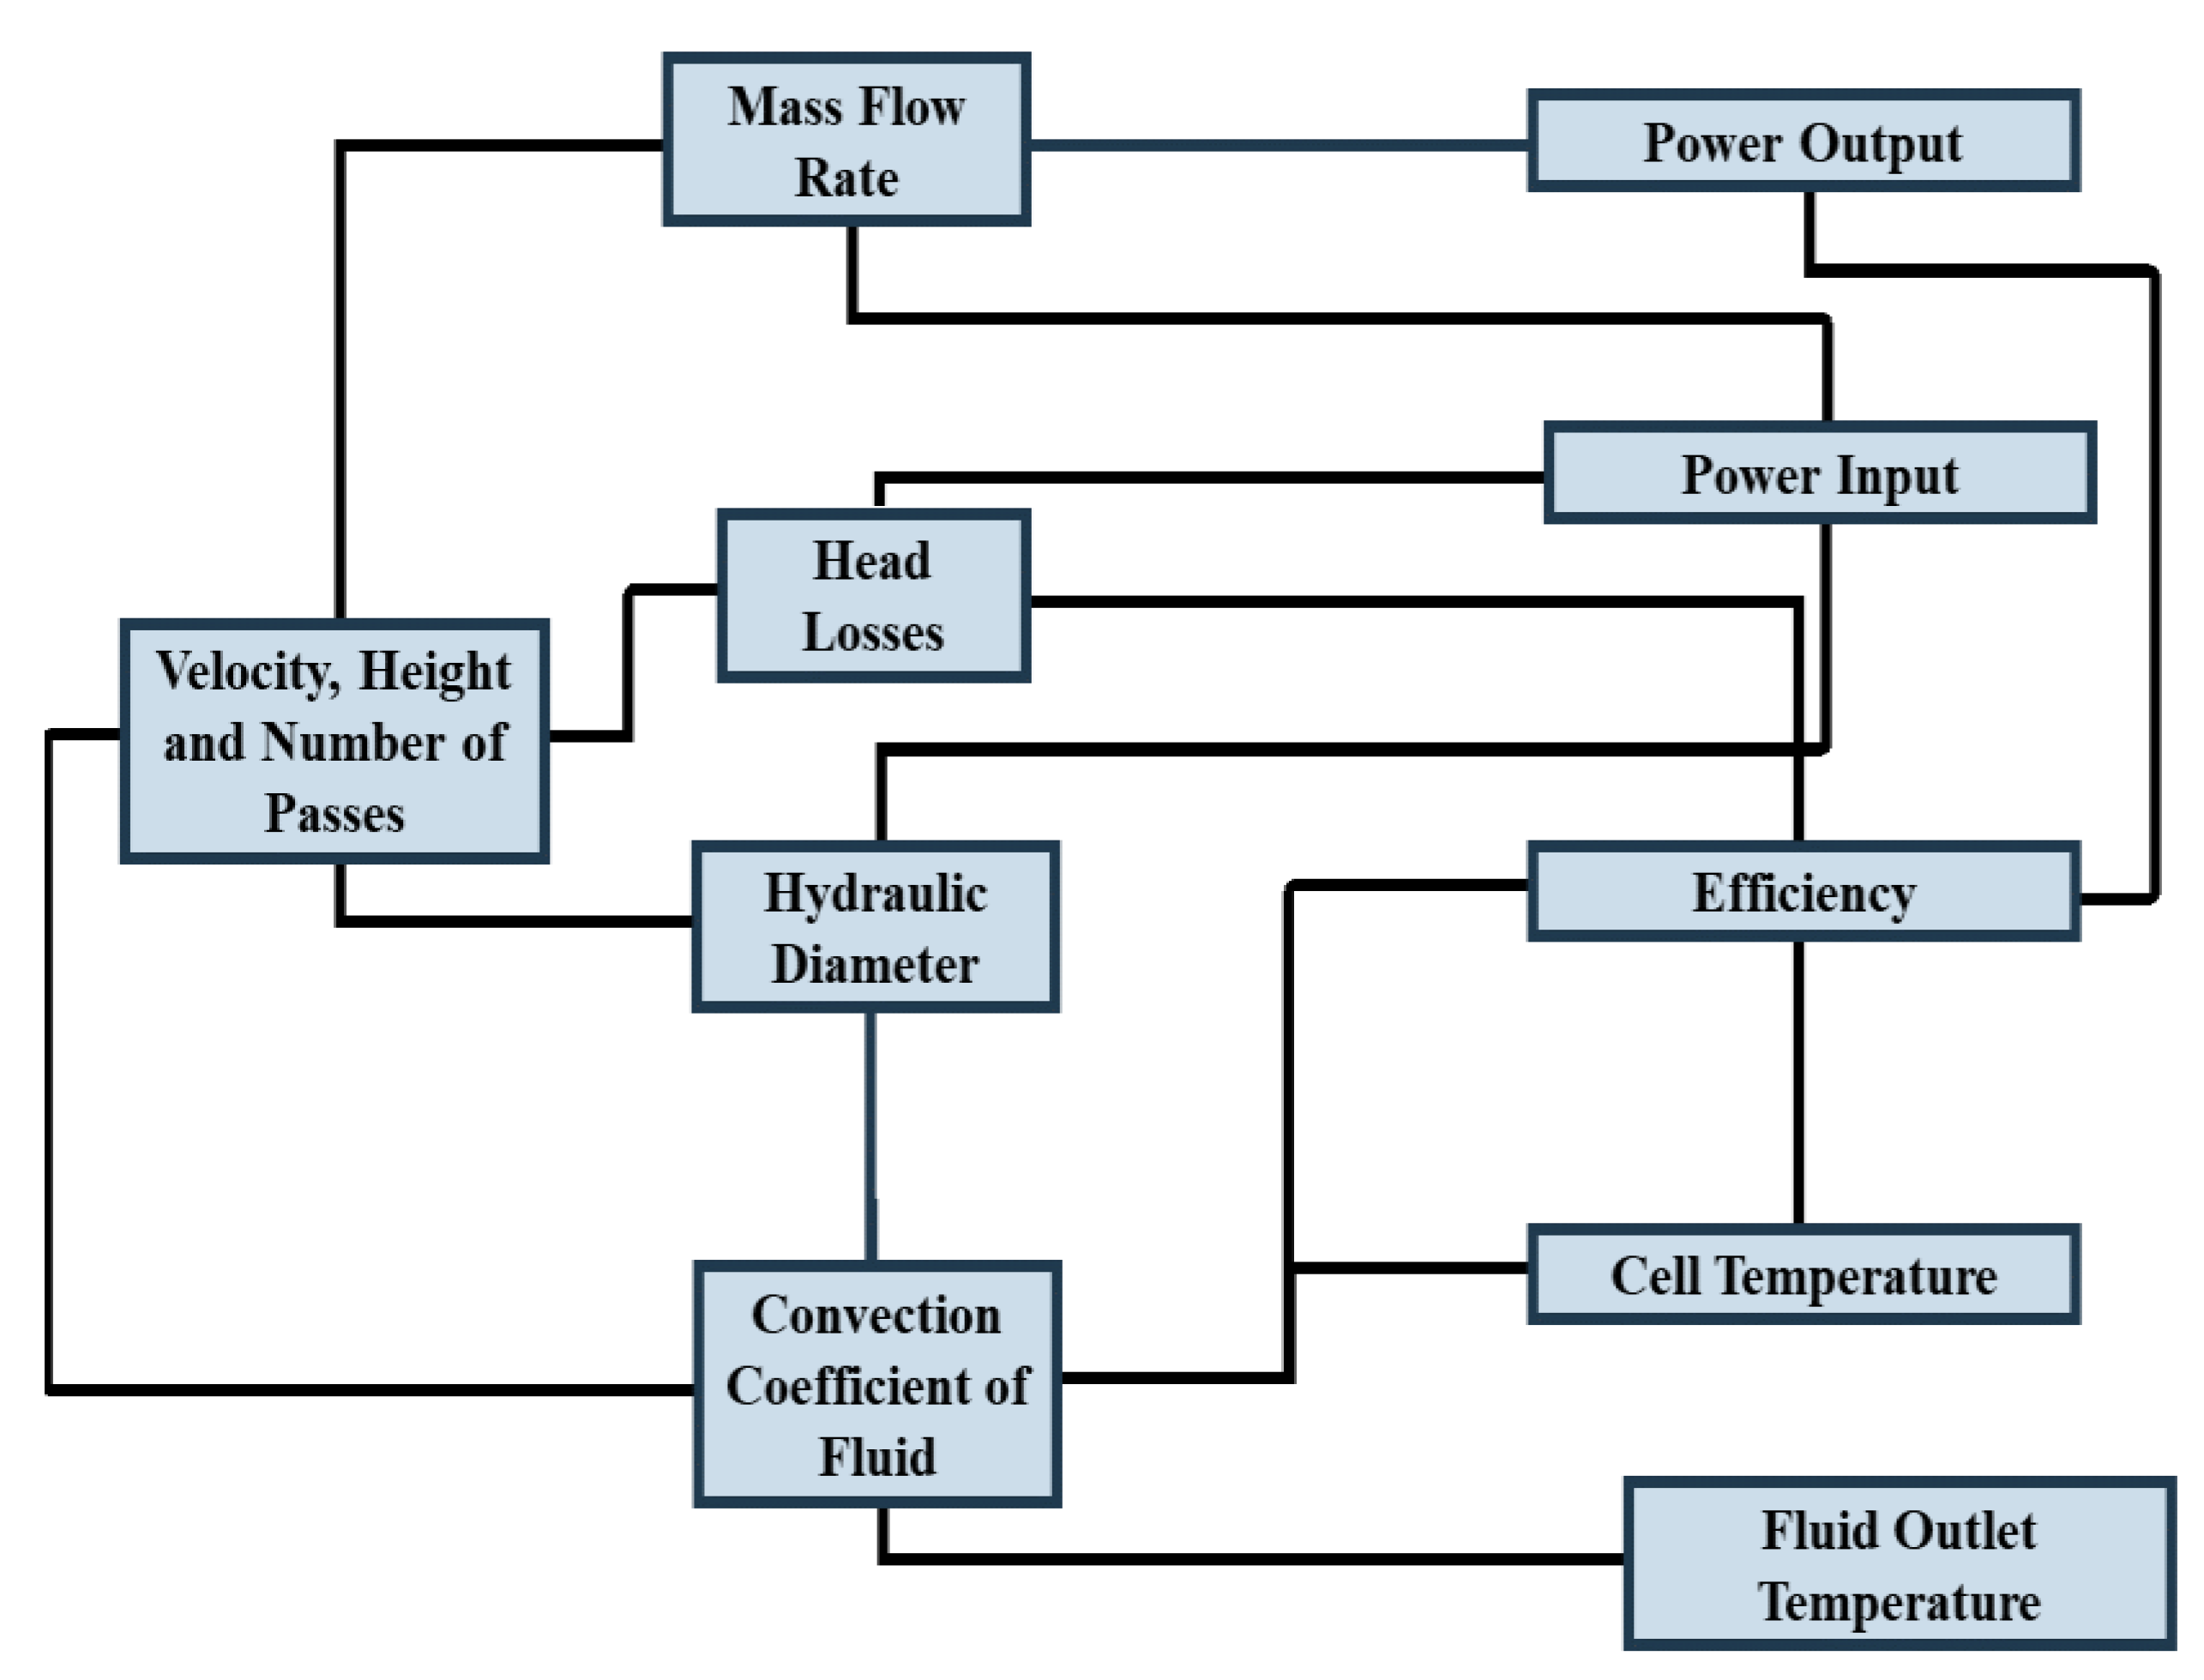
The analytical code was linked with the MATLAB function, and bounds were placed on independent variables. Figure 4 shows the relationship between independent and dependent variables that were controlled by velocity, absorber height, and the number of passes. The analytical relations of Section 3 were used as objective functions for the genetic algorithm. Variation in velocity varied the convection coefficient, mass flow rate, and head losses. The problem was simplified by treating the temperature and net-power output of the PV panel as dependent variables. Moreover, the system efficiency was directly measured from the cell temperature, which reduced the optimization to three independent and two dependent variables. The limits of the independent variables were set to cover both the laminar and the turbulent flow. The design points obtained from the algorithm were dependent on the initial population. The greater the initial population, the greater the chances of obtaining many suitable points. The population was increased until there was a repetition in the points.
The data obtained from the optimization algorithm were rechecked through analytical formulation and further refined using MATLAB code. A population of a few thousand was used to get the results. The best-selected data points from the optimization of heat absorbers are given in Table 3 and Table 4. From the data points, it can be observed that slightly changing each variable generates a unique solution. It can be observed that the mass flow rate, required input power, and maximum power output are different for each design.

4.2. Comparative Analysis for Different Types of Absorbers

Table 3 and Table 4 provide a few best possible designs (marked tick) for each type of absorber. For single-pass and tube-type absorbers, the design which produced the maximum output and lowest PV module temperature was selected. The power output and the cell temperature for each set of design points are very close to those of the multi-pass duct; therefore, the mass flow rate was also considered along with power output and module temperature.
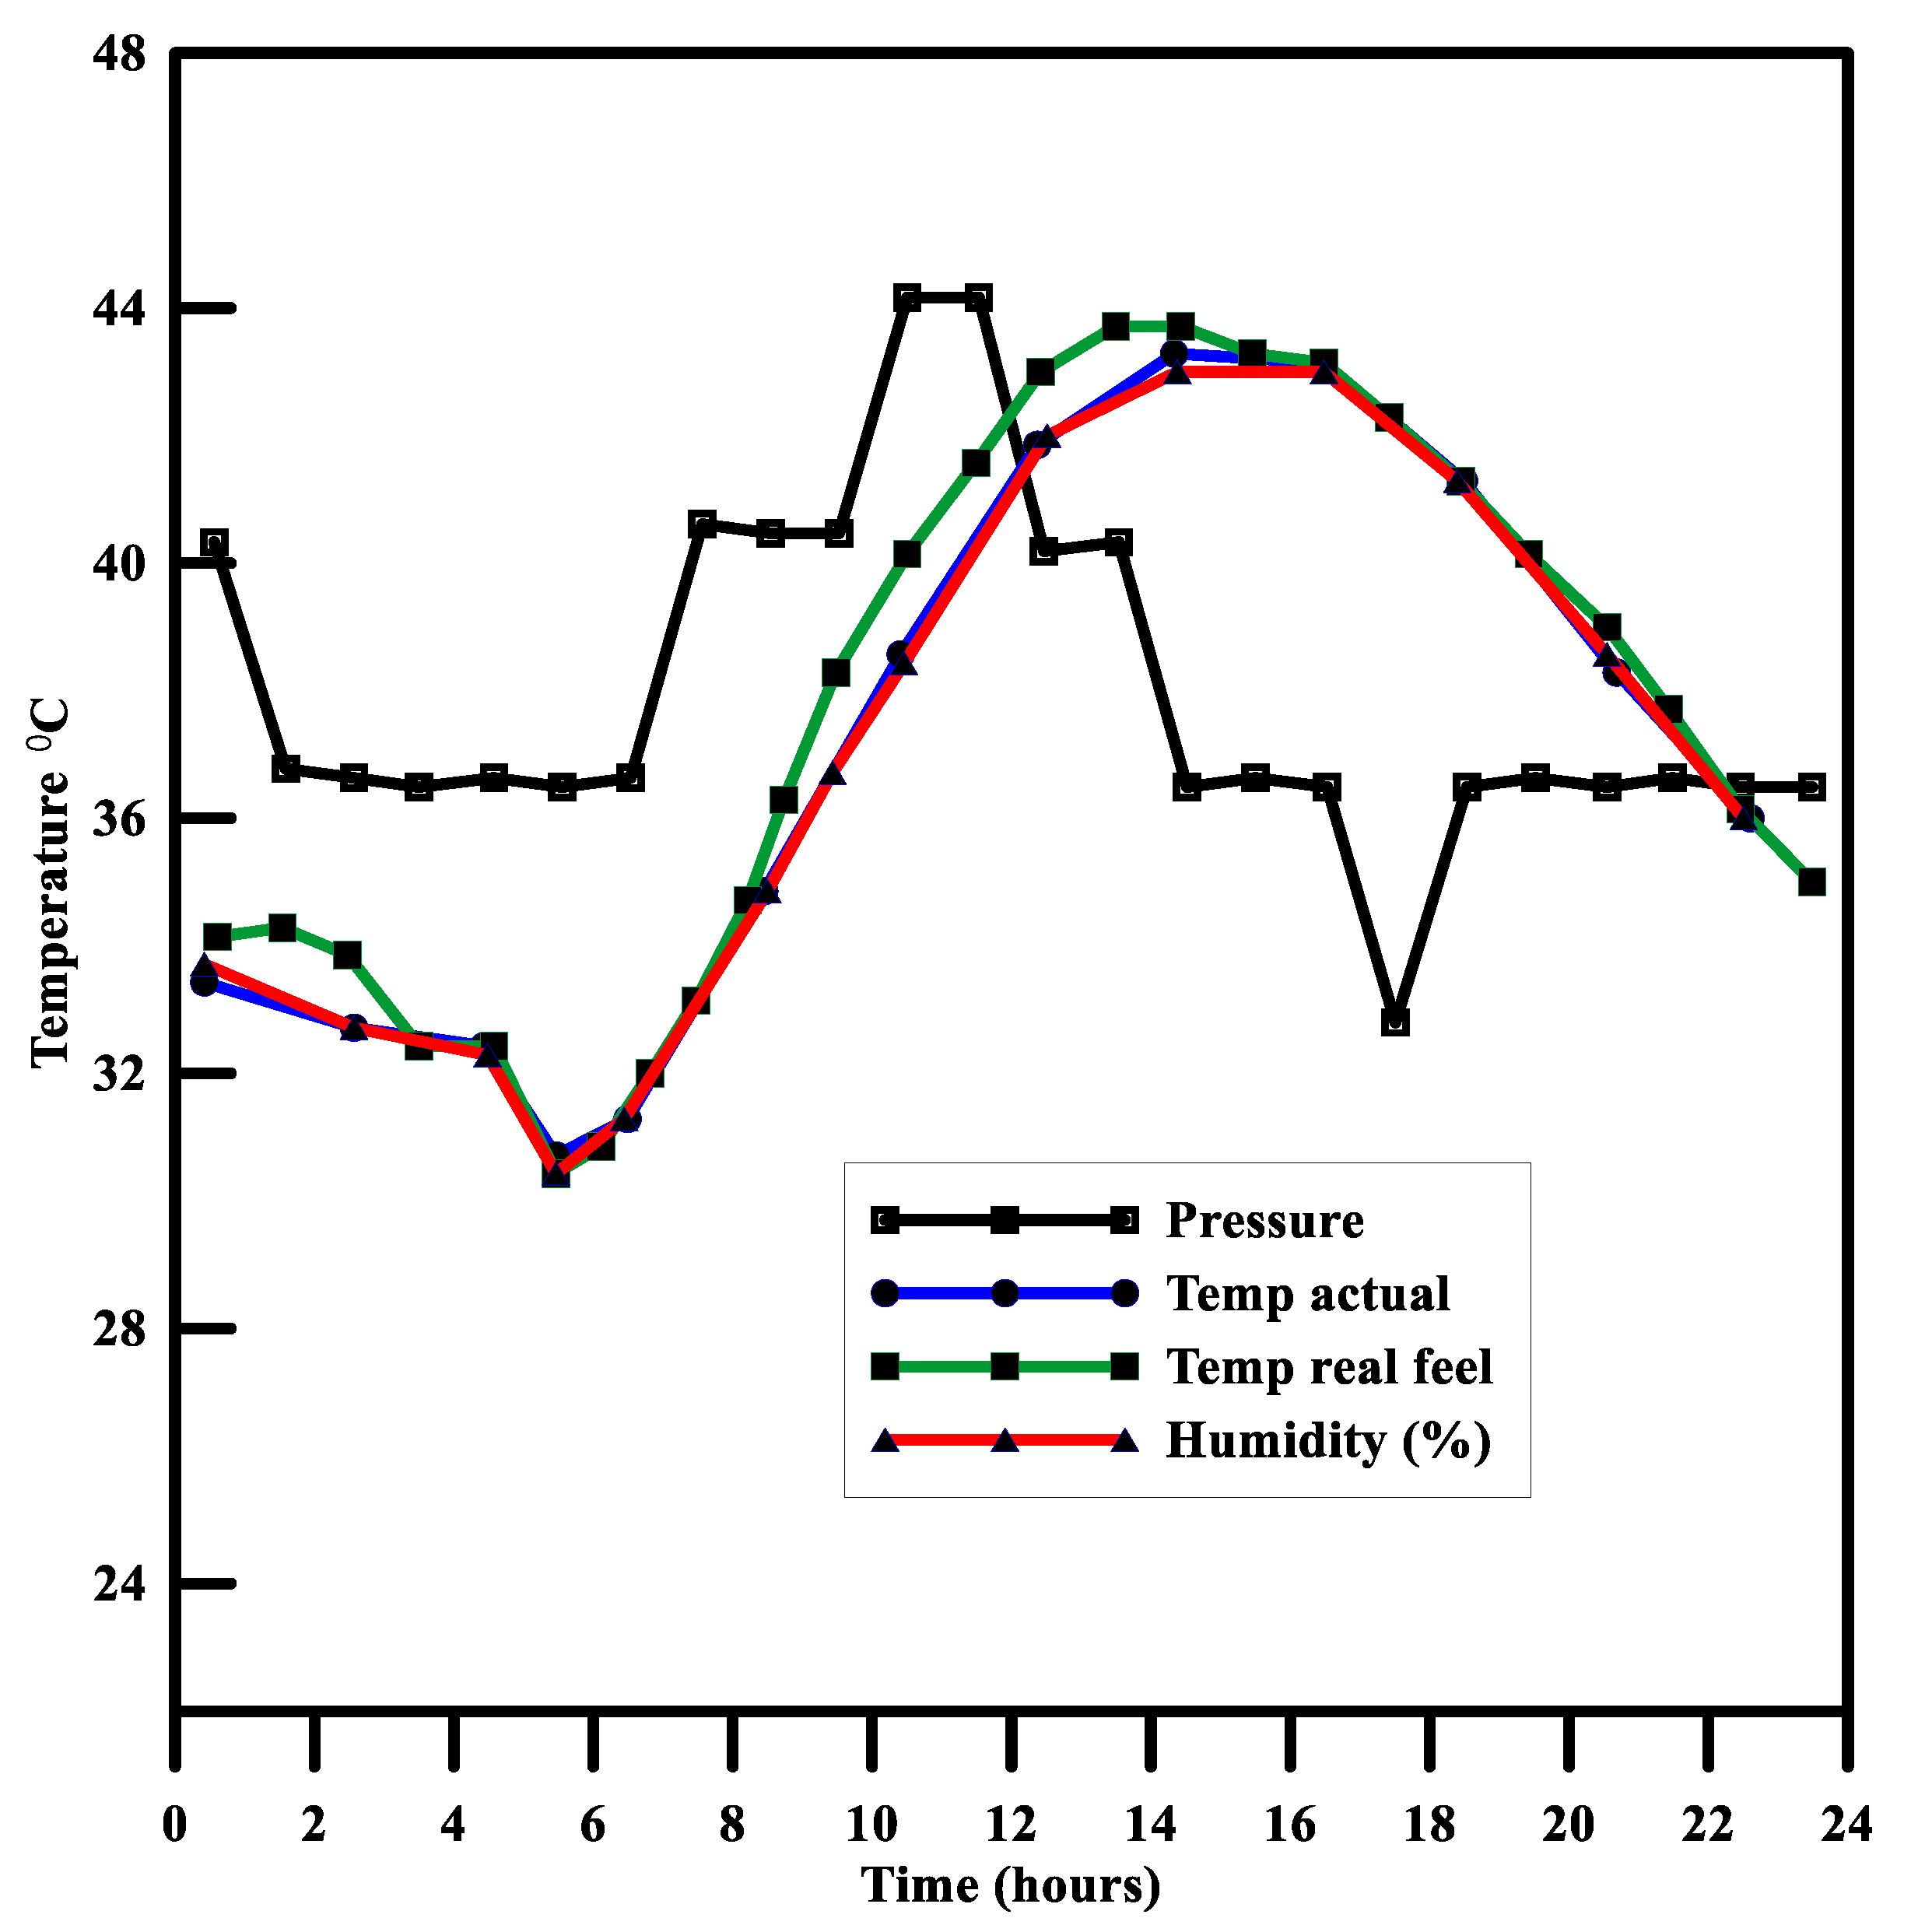
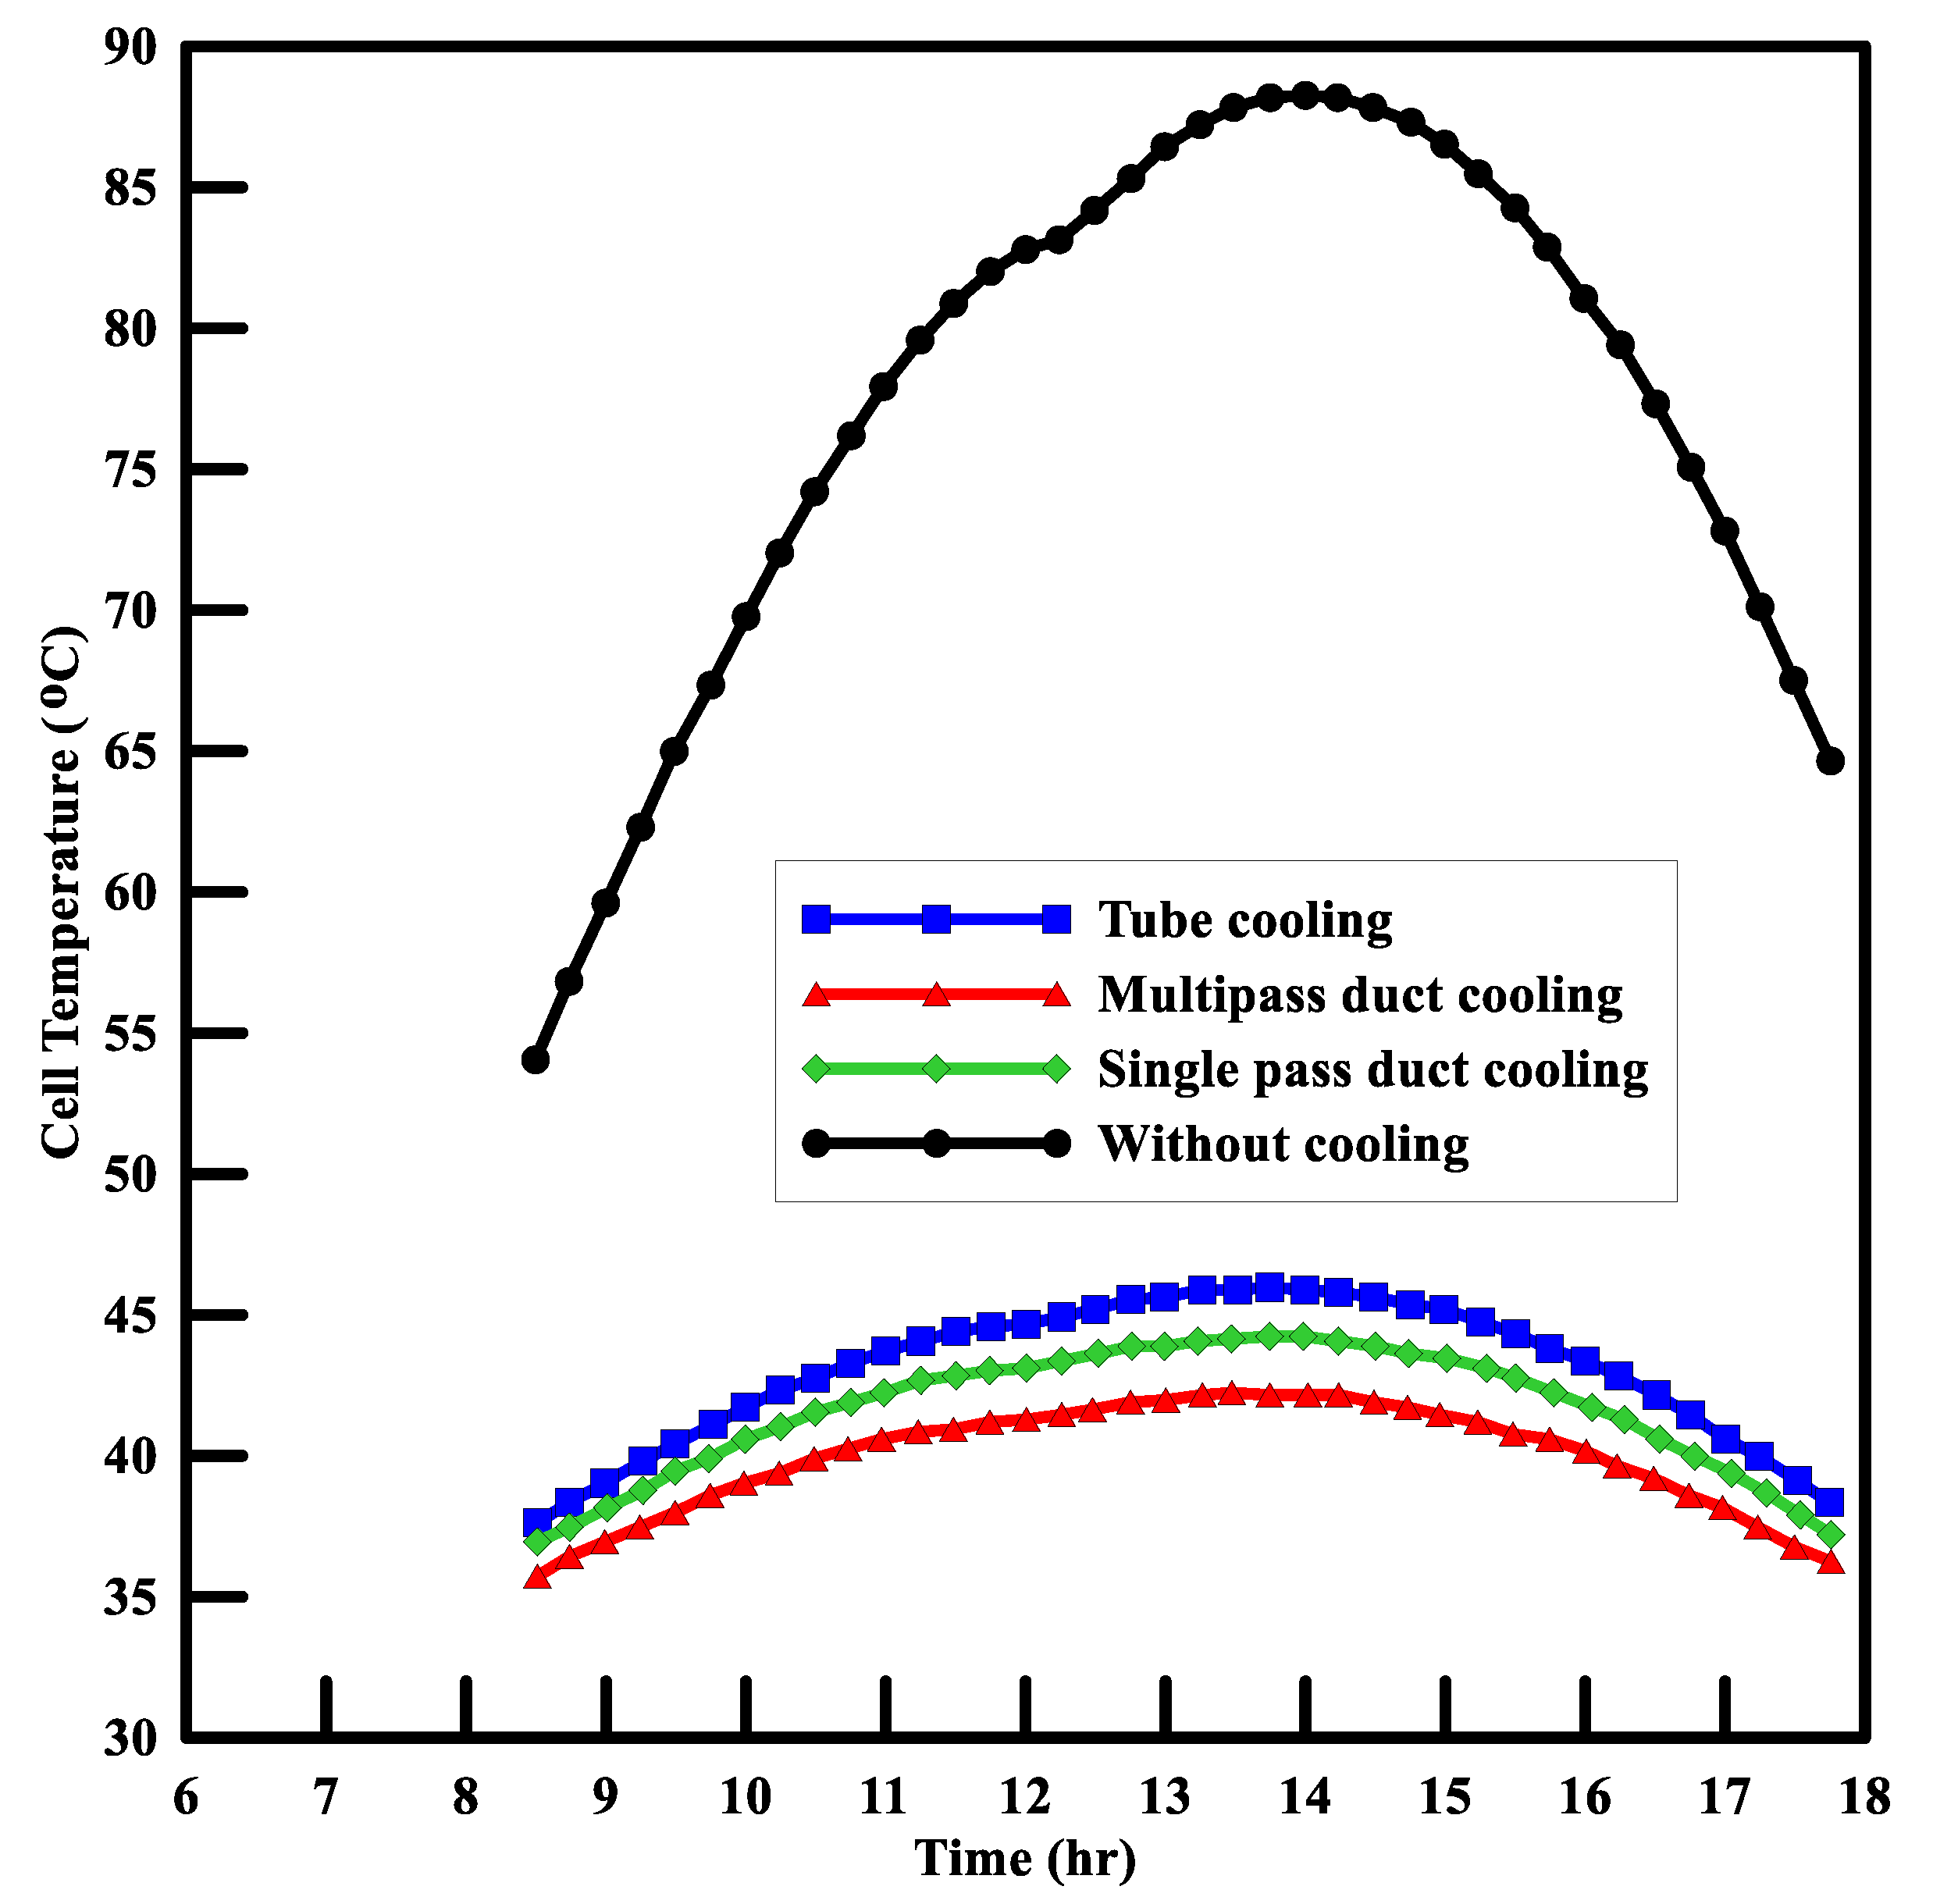
The hourly forecast for real and actual temperature, humidity, and pressure for 9th of June is shown in Figure 5. The plot shows hourly variations in humidity and pressure at different values of temperature. The sun rose at 4:58 am on the mentioned day, but the analysis was conducted from 08:00 AM h to 06:00 PM. The morning temperature was 32 °C and moved to 42 °C (felt like 44 °C) during the peak hours. The average humidity for said duration was 30%. The average atmospheric pressure was calculated to be 707.5 mmHg, and the average wind speed was 3.8 m/s (southerly). Figure 6, Figure 7 and Figure 8 compare the PV module’s temperature, power output, and efficiency for cooled and uncooled systems for the 9th of June.
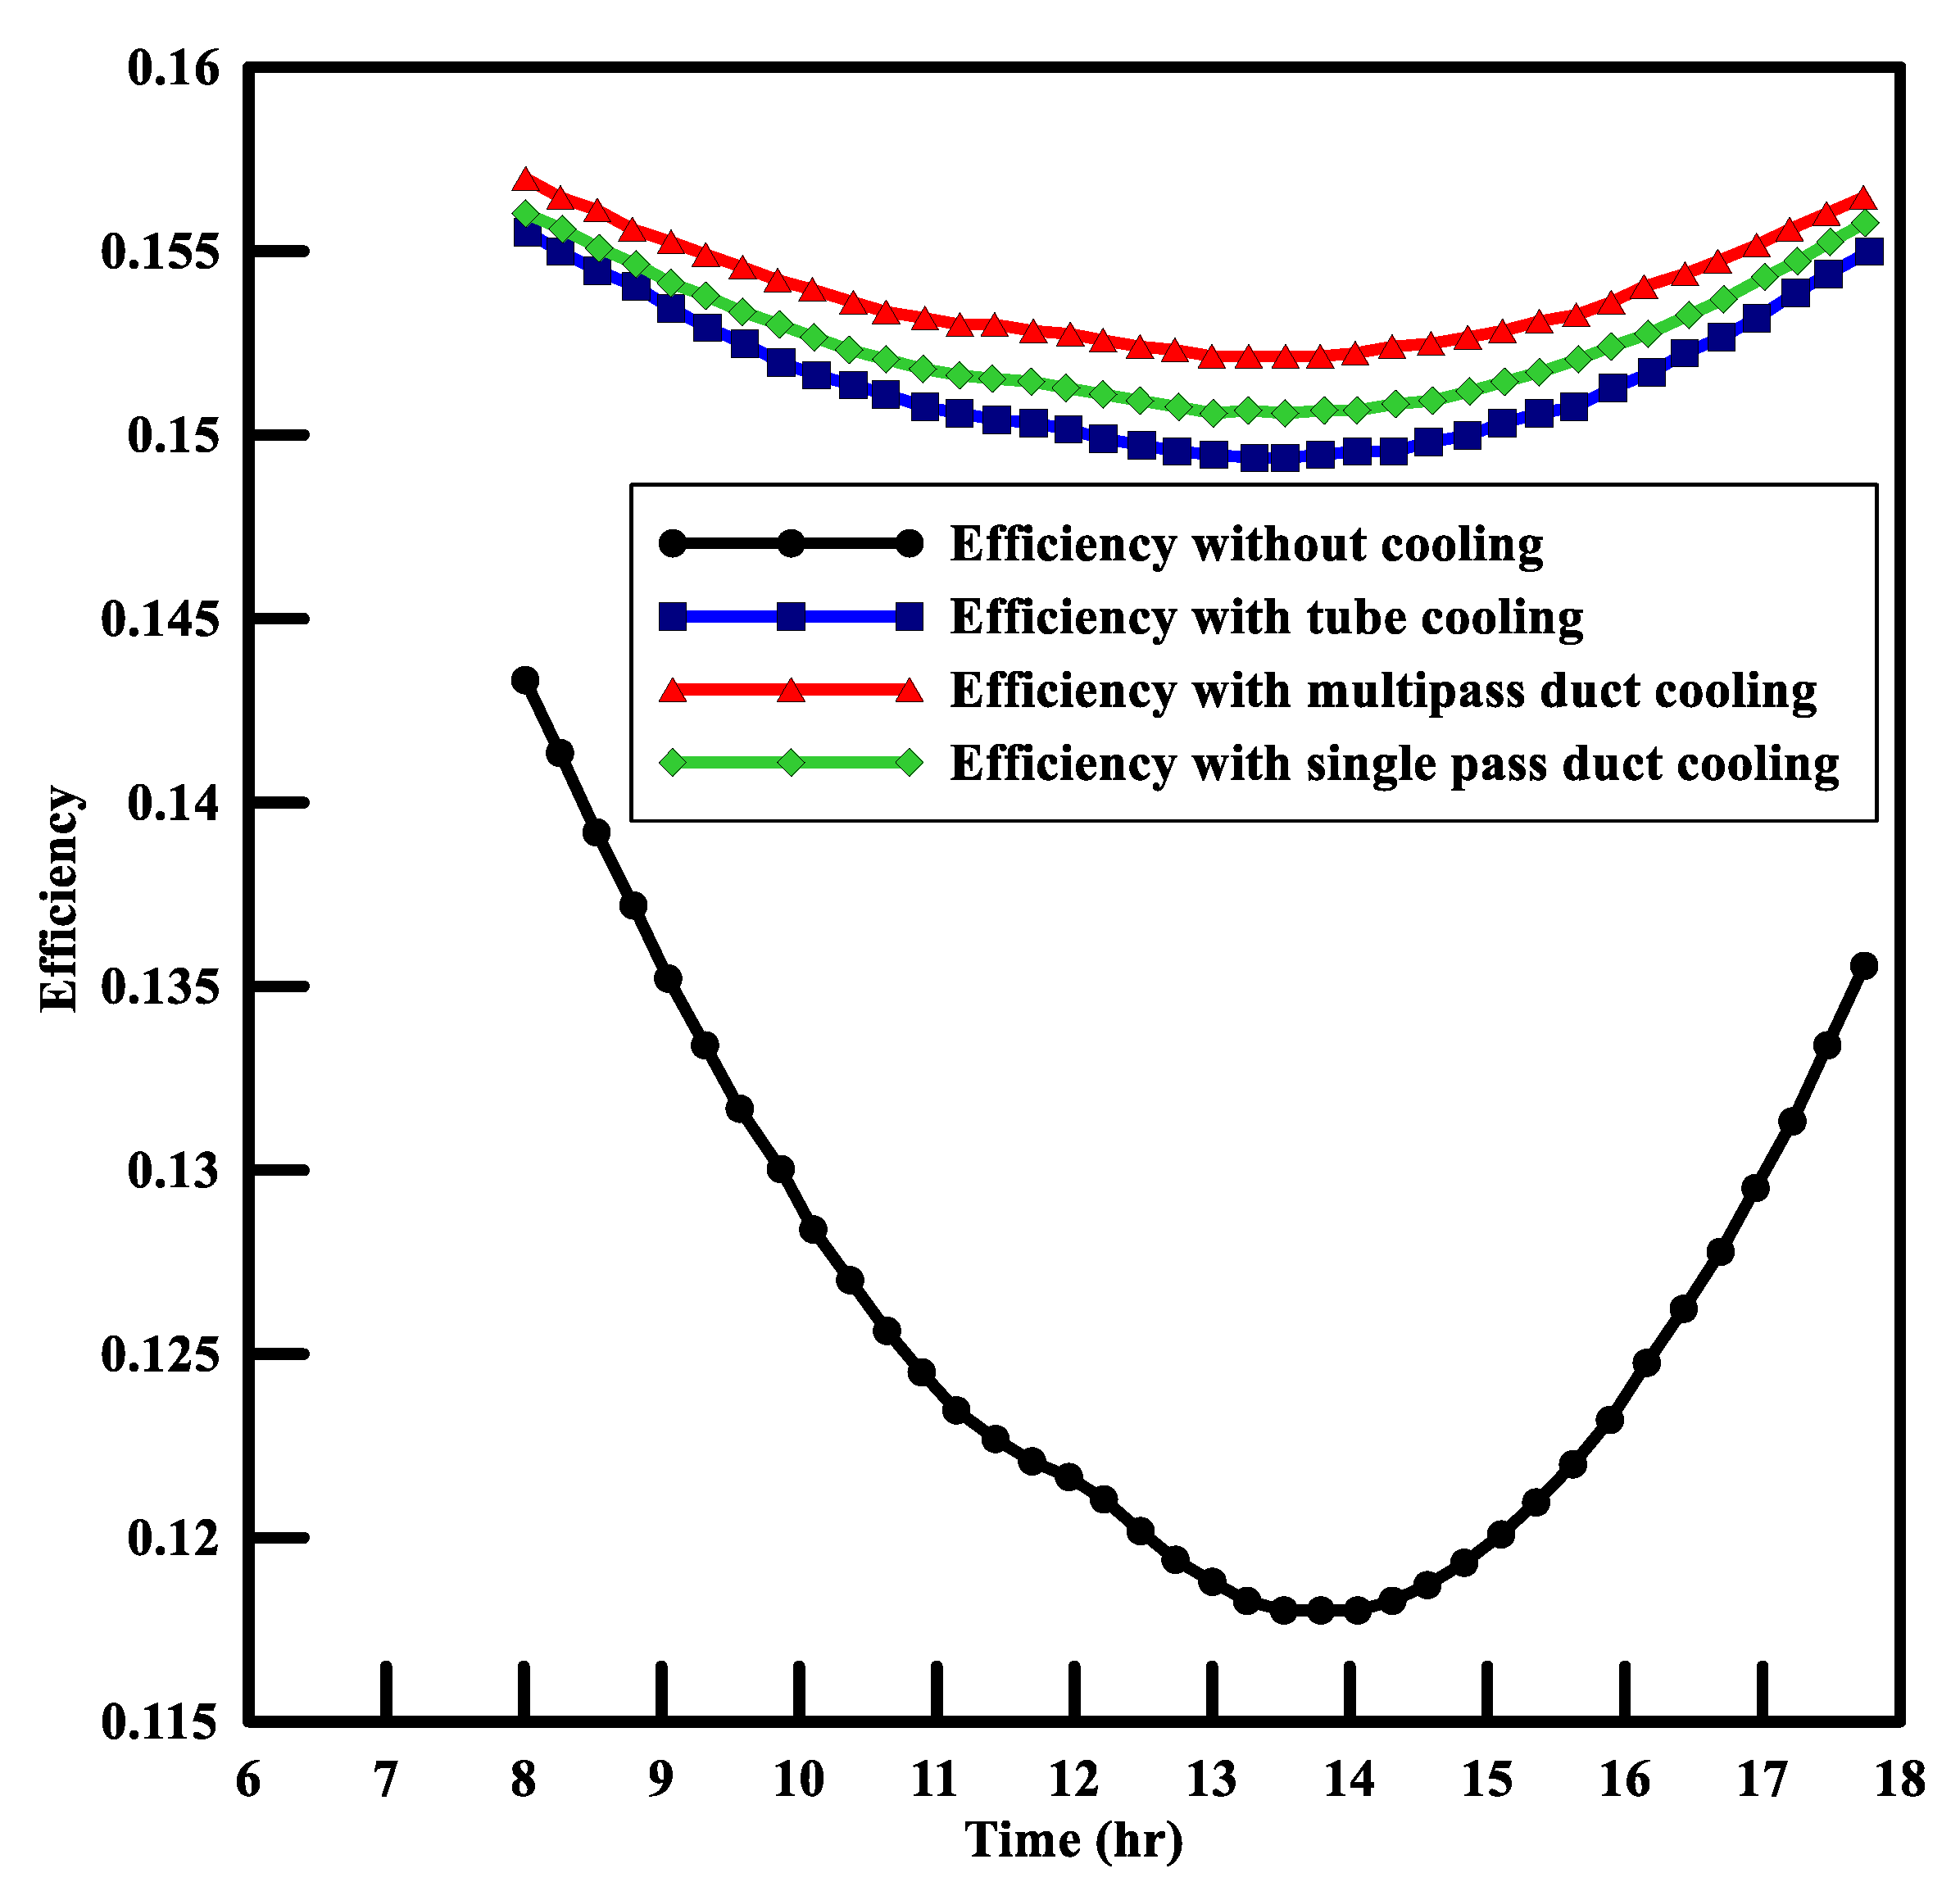
It can be observed in Figure 6, Figure 7 and Figure 8 that the PV module with a multi-pass duct cooling system produced the maximum efficiency via the maximum output and lowest cell temperature over the whole day, followed by the single-pass duct system, tube-type absorber system, and uncooled PV panel. The plots suggest that using a multi-pass duct system is the best option among all other systems. The total head loss of the system is about 2 m, and the flow rate required for the system is about 8.4 LPM, which can be provided by commercially available 10 W pumps with a 10 LPM flow rate.

4.3. Energy Produced by Hybrid Multi-Pass PV and Uncooled PV Module

Table 5 compares the energy production of PV and PV/T multi-pass absorber modules between March and August. All the theoretical results were calculated using values of irradiance and ambient temperature during these days. The empirical formula was used for irradiance and temperature modeling. The flow inside the duct was in a transition region with a mostly turbulent nature and a Reynolds number of 3684.

5. Validation of Analytical Results through Virtual Experiments

To verify the analytical calculations and the theoretical trends, two types of CAE simulations were run on the ANSYS workbench, i.e., temperature behavior of the PV and the hybrid PV panel. The simulations were performed from 8 AM to 6 PM according to ambient and insolation conditions for June in Pakistan. The total time of simulations was 36,000 s.

5.1. Simulation Analysis of the PV Module without Cooling

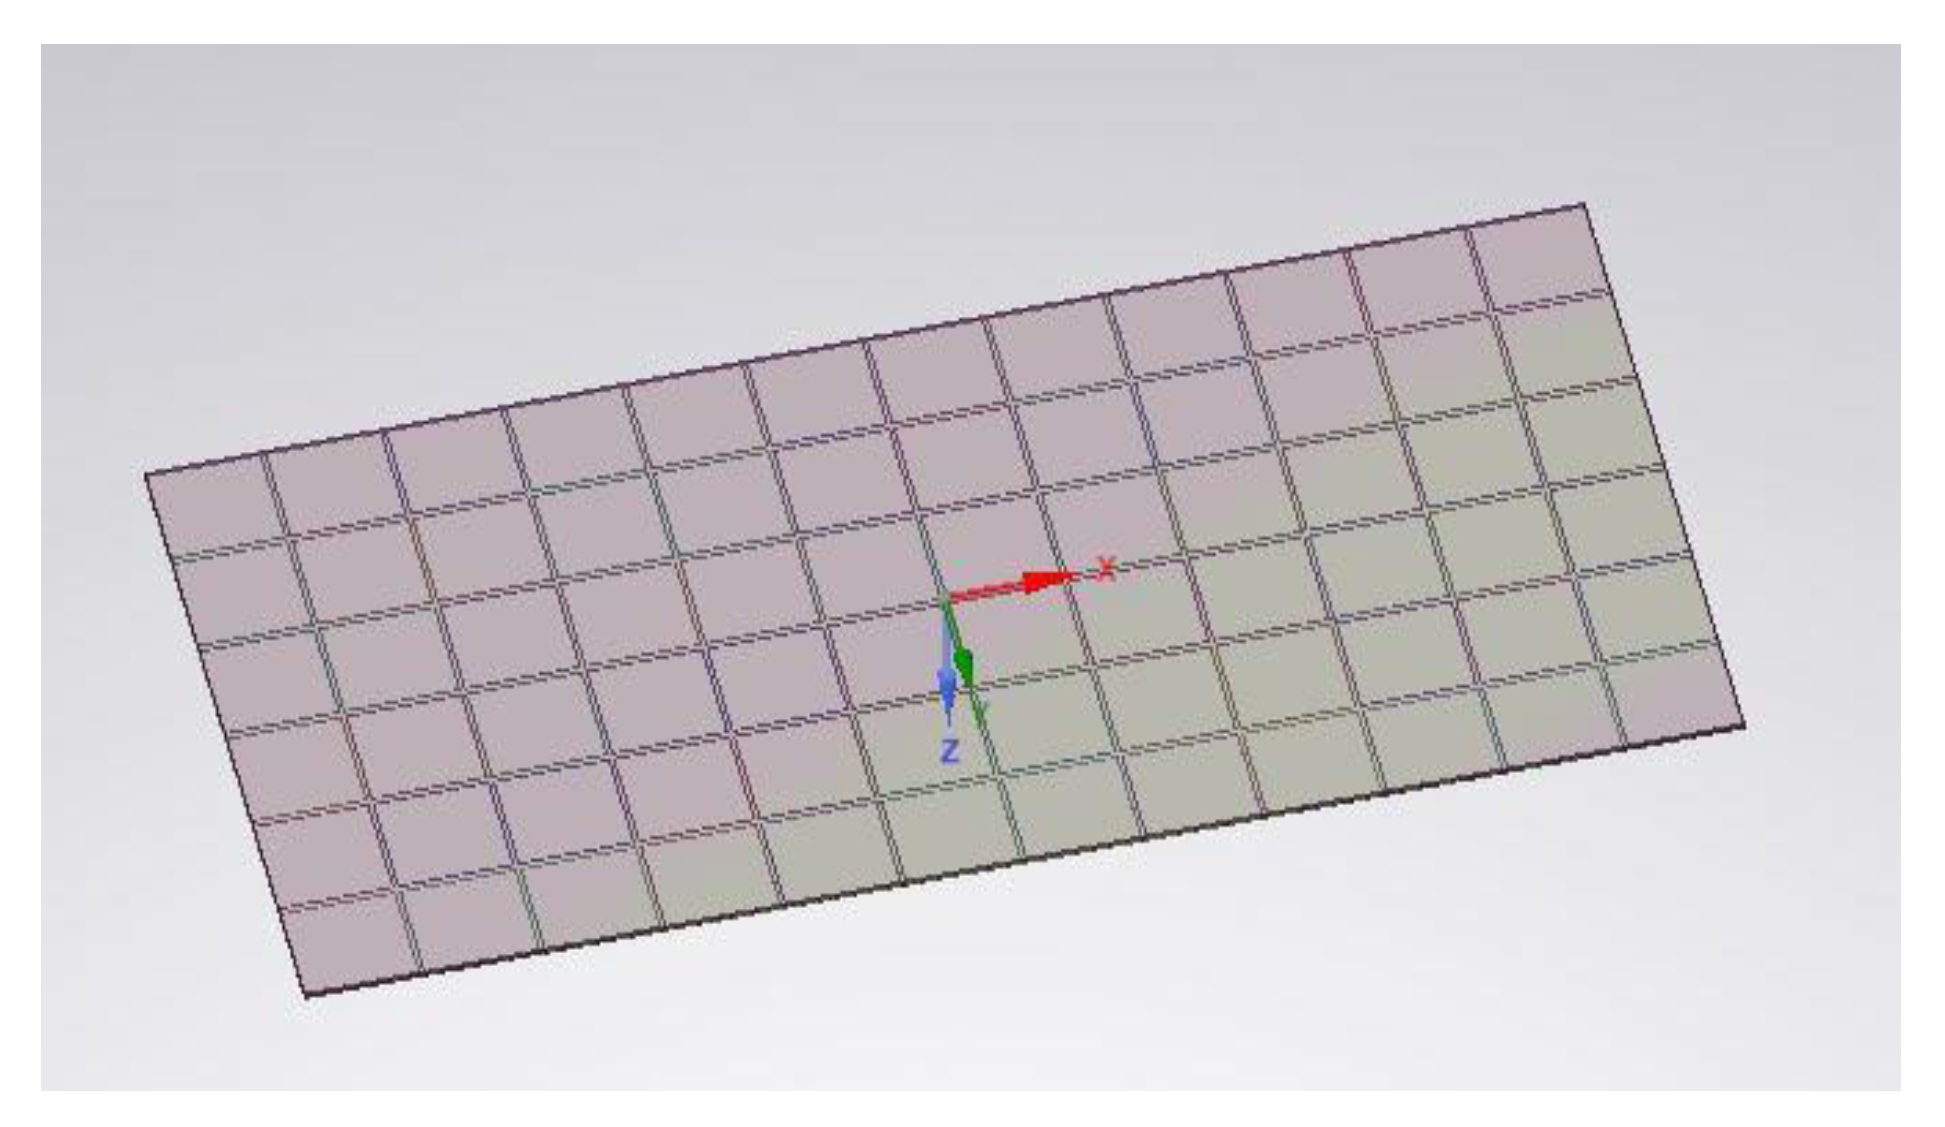
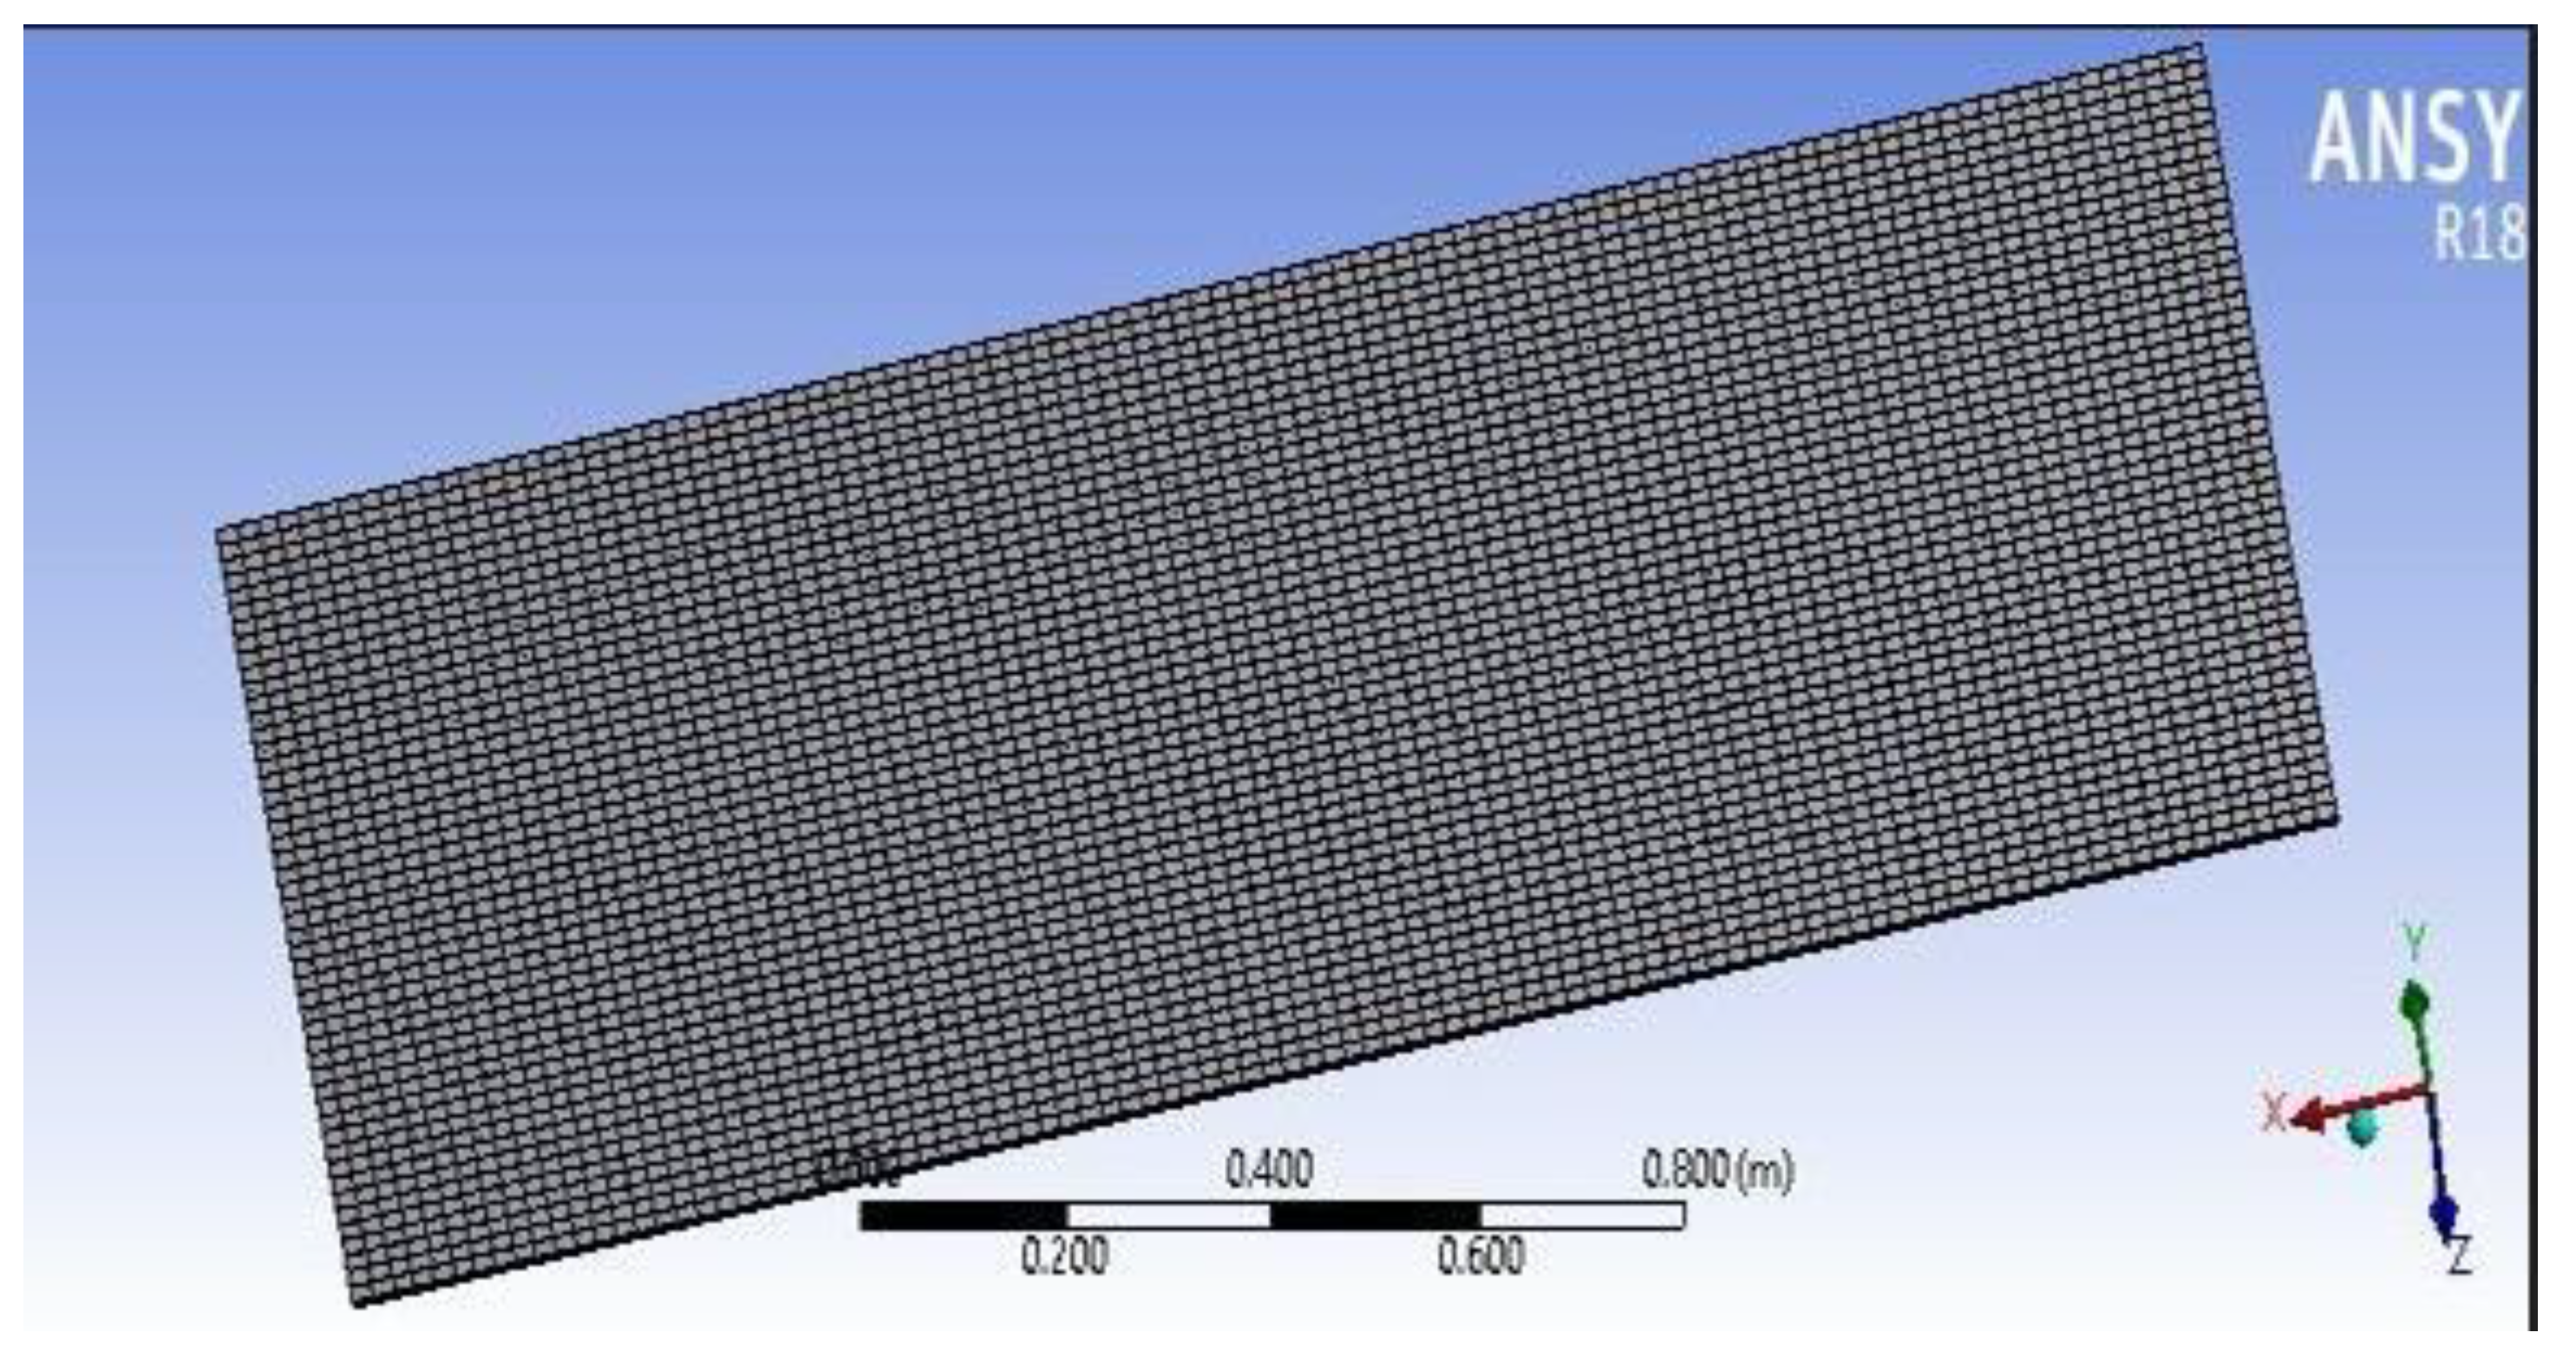
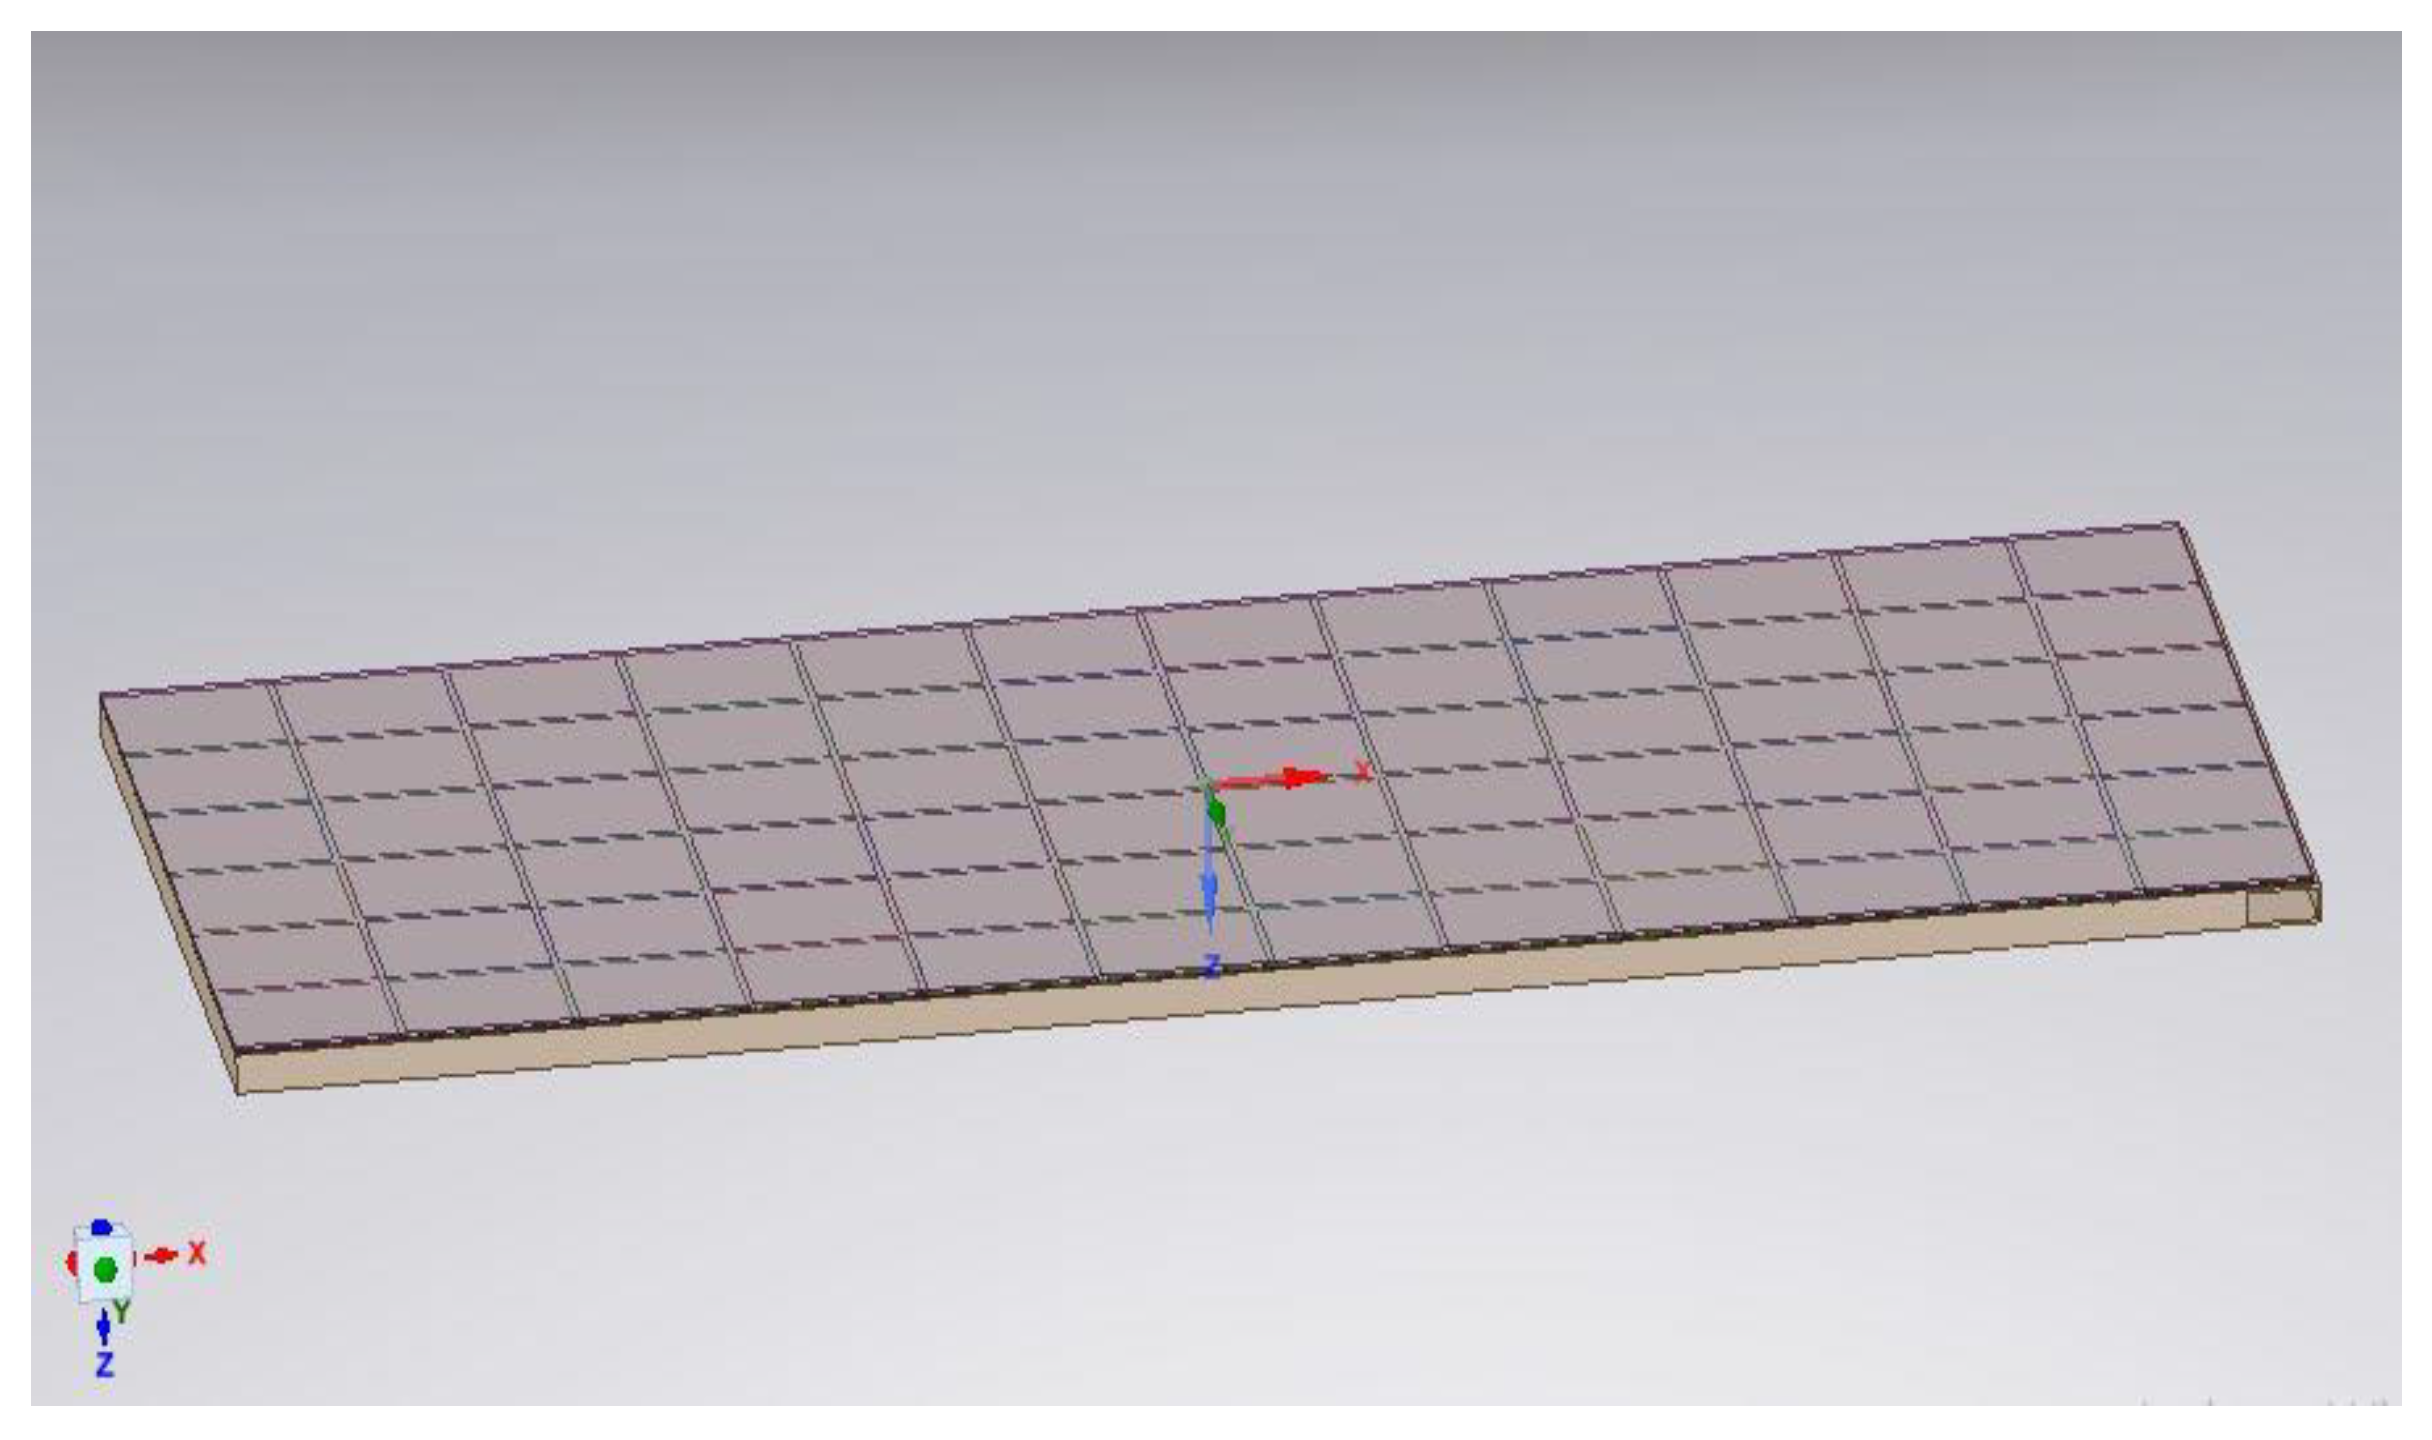
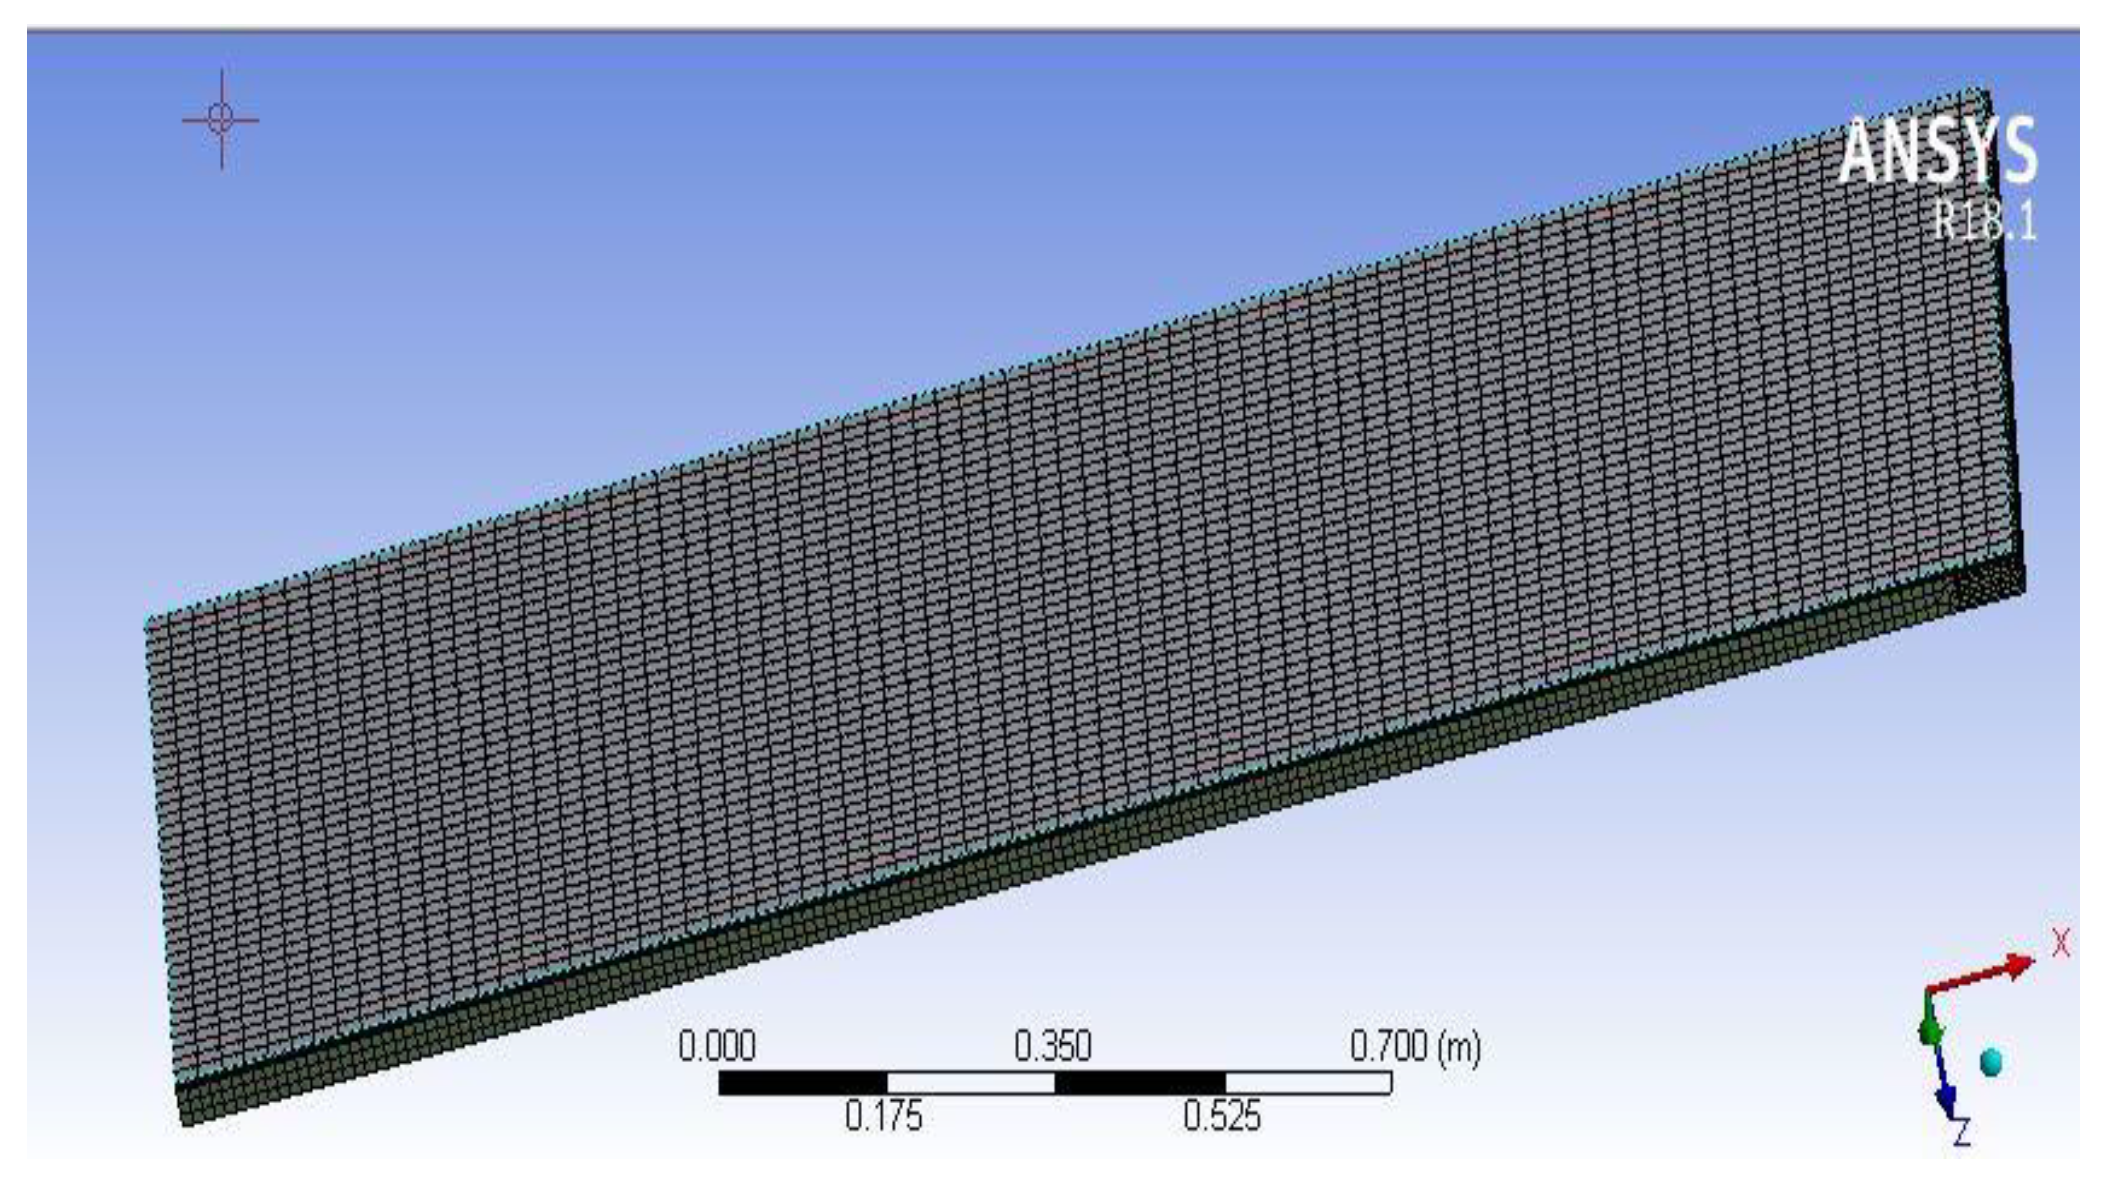
An ANSYS transient module was used to simulate the PV panel without cooling (parameters considered in Table 1 and Table 2). The CAD model and meshed PV module using the Hexahedral elements are shown in Figure 9 and Figure 10, respectively. The total number of mesh elements was 45,205 with 342,579 nodes. The average orthogonal element quality was 0.99. The average skewness was 2.3625 × 10⁻⁴; maximum skewness was 0.74. Manual contacts were defined between different layers. The layer with a lower conduction value was placed on the contact side of the pair, and the layer with higher conduction was on the target side. Convection boundary condition with convection coefficient of 6.5 W/(m.K) was placed on glass and back surface. The ambient temperature was varied according to the analytical calculations. The irradiance calculations and the heat flux boundary condition on both Tedlar and solar cells were applied using Equations (53) and (54). The ambient temperature was calculated using the mathematical function for temperature modeling.
I s o l a r   c e l l = I ( t ) × τ g ( α c β ɳ α c β )
I t e d l a r = I ( t ) × τ g ( α t + α t β )
The simulations show consistent temperature behavior of the PV module without cooling; see Figure 11. The maximum temperature of the solar panel was 83.415 °C.
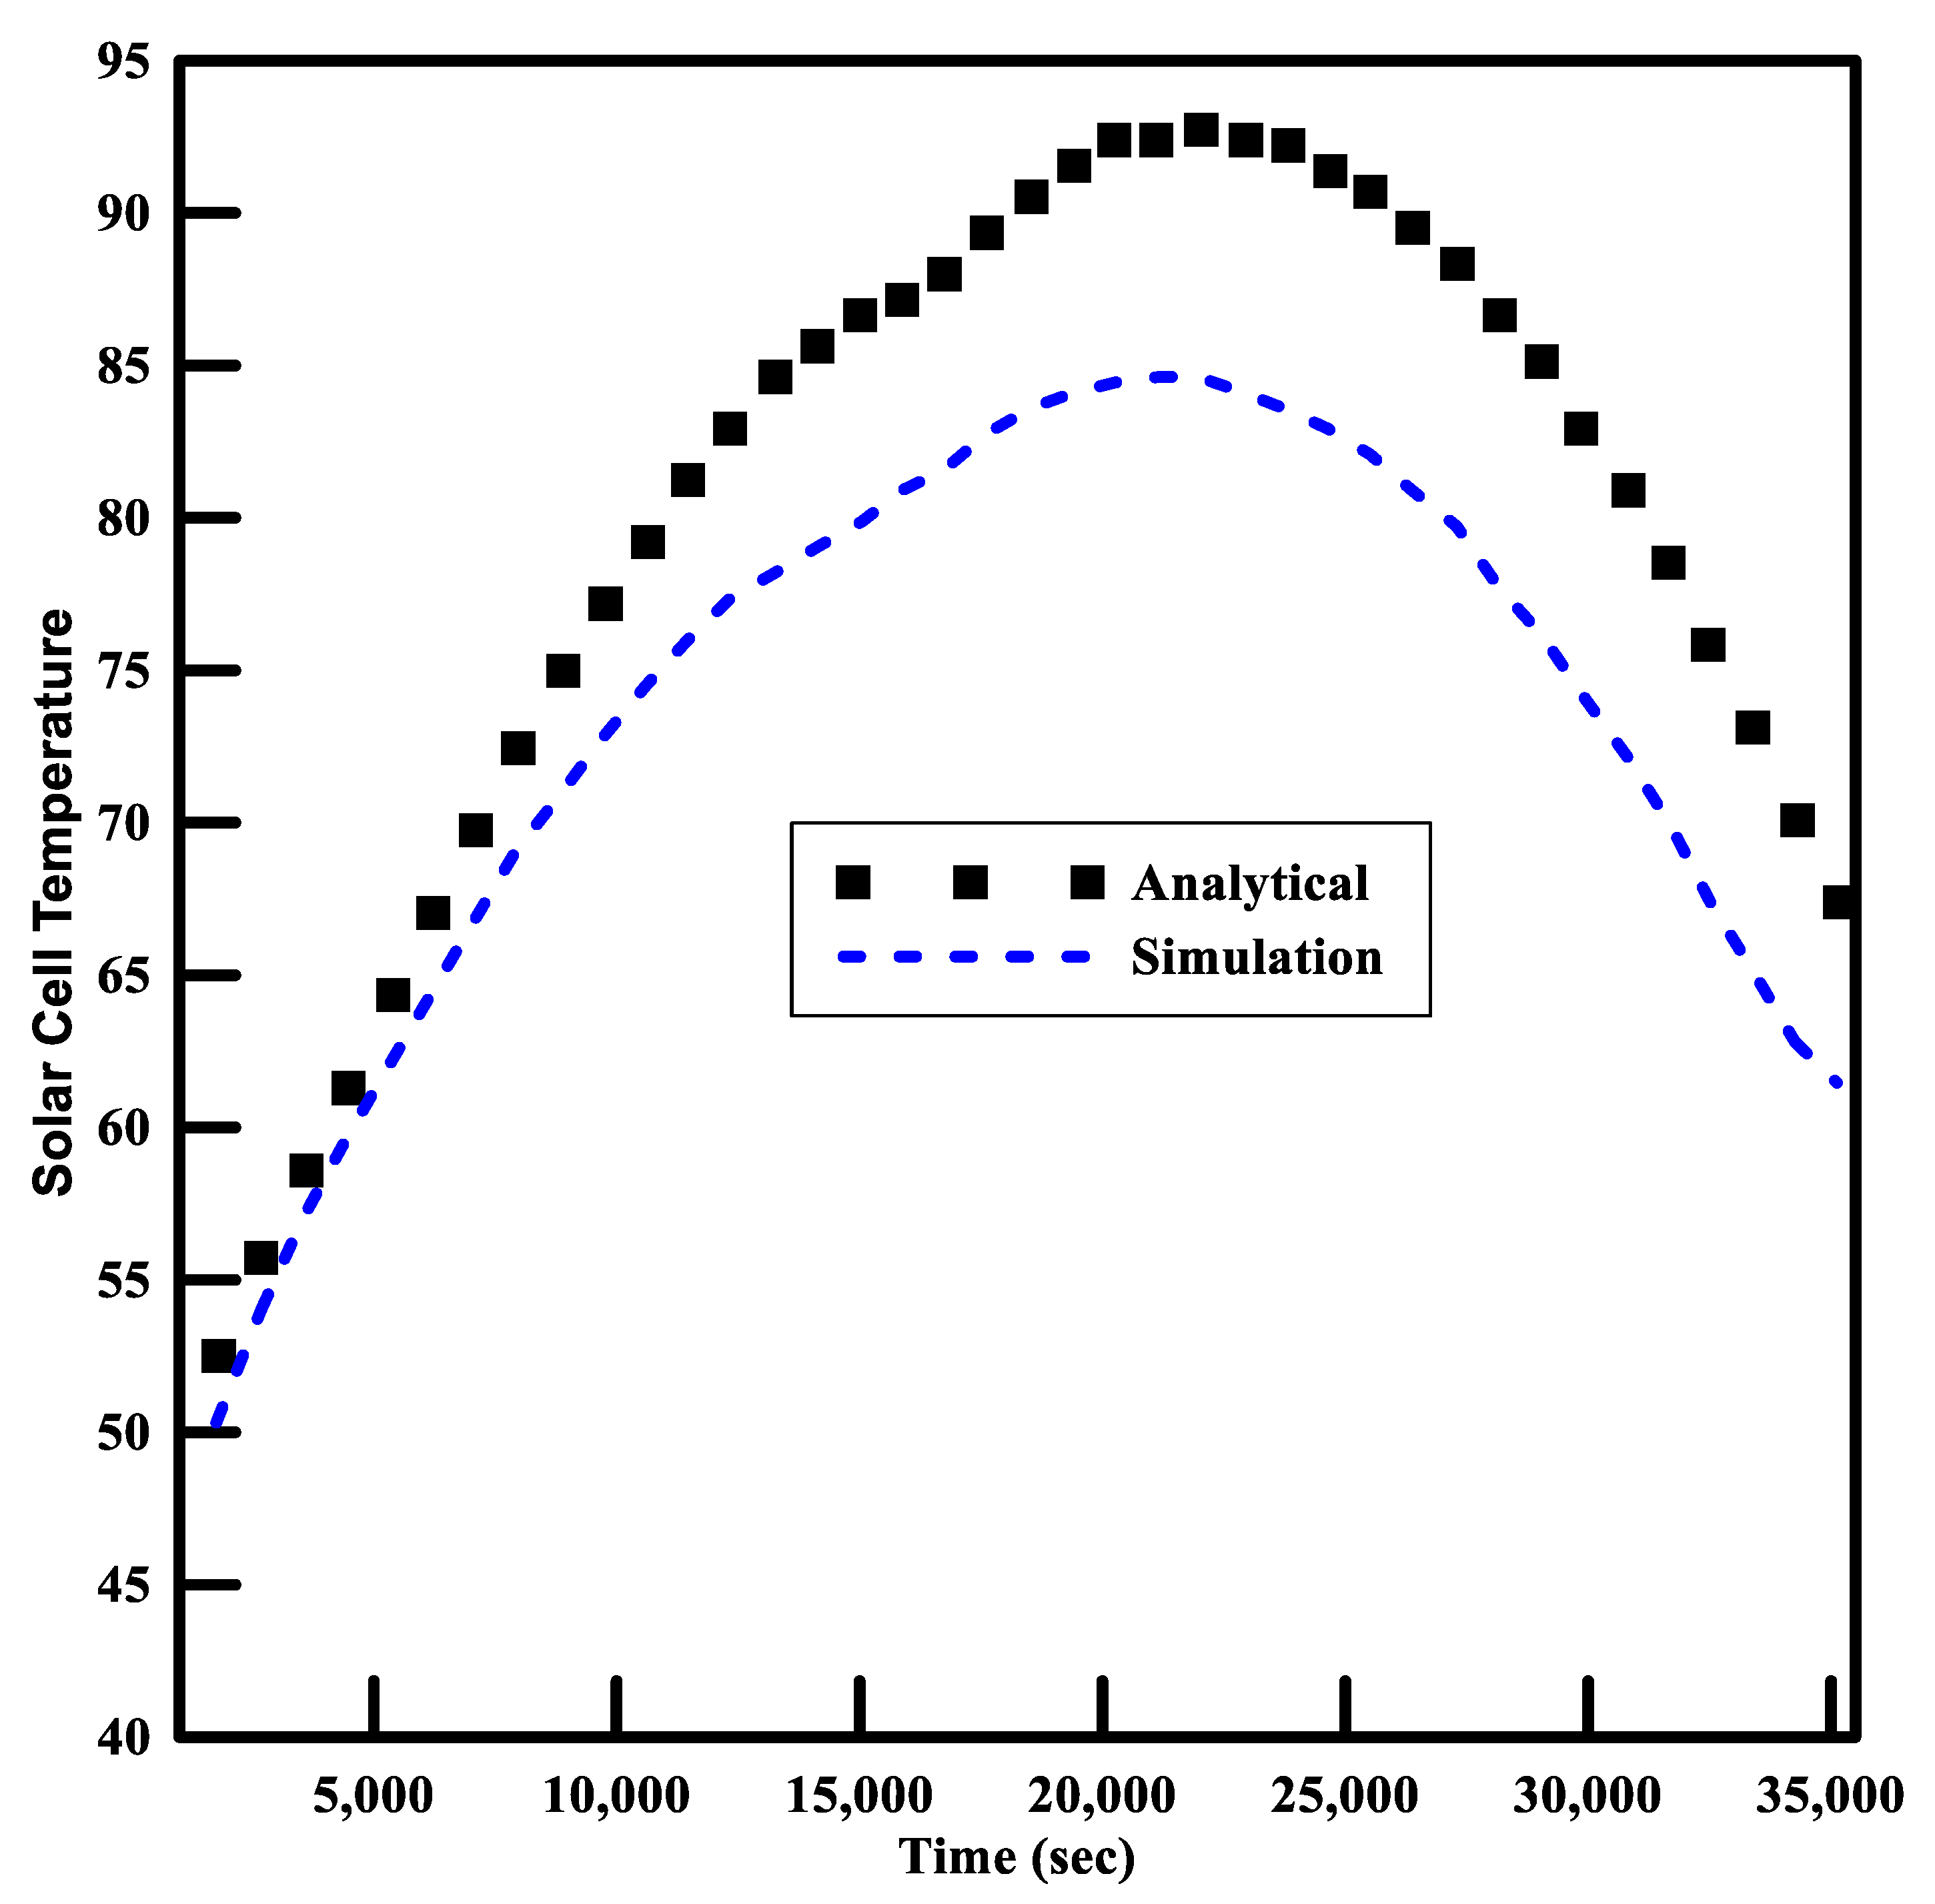
The analytical and simulation-based comparison for uncooled solar cell temperature behavior vs. time is shown in Figure 12. A good deal of conformity can be observed between the two trends. Initially, the solar cell showed a minimum temperature of 50 °C that can be observed to peak at a value of 93 °C at 20,700 s. The final solar cell temperature at t = 35,000 s was 70 °C. These high values of the solar cells were observed because the system was uncooled. The general trends for the analyses are the same; however, a slight difference between the results for maximum cell temperature over a given time can be observed—i.e., the analytical values can be observed above the simulation trend. The difference was due to some parameters and other initial and boundary conditions. Analytical results give a general description of the system for any value of parameters. Although the simulation results are easy to design, repeat, and statistically analyze, they do not provide a representation that is as accurate as analytical models. Moreover, the values of effective parameters were specified in the simulation analysis, and the responses are true just for those values of the parameters, leading to the variations observed in the figure below.

5.2. Simulation Analysis of Hybrid PV Panel with a Multi-Pass Duct

To simulate the multi-pass hybrid solar panel, transient thermal and fluent modules were coupled in ANSYS to produce a two-way FSI simulation. The input isolation and ambient temperature conditions are similar to those in an uncooled PV system. Figure 13 shows the layered structure of a hybrid solar panel with a multi-pass absorber attached to the back surface. The key mesh features of the system (Figure 14) include inflation of thickness 0.0001 m applied on fluid volume. Total elements of the fluid domain were 321,640 and for solid structure, and the elements of the thermal domain numbered 128,538, with element quality of 0.94 and 0.37, respectively. The inlet and outlet boundary conditions in fluent analysis of hybrid PV module were velocity inlet and mass flow rate outlet, according to the design of the absorber. A fluid–solid interface was created in the transient thermal simulation on the inner walls of the absorber. The wall boundary conditions were set to system coupling in the fluent module.
The simulation results show a trend similar to the analytical solution. The maximum cell temperature was 42 °C; for analytical calculations the result was about 40 °C (inlet cooling water temperature was 30 °C). The total head loss in the duct predicted in ANSYS simulations was about 0.053; according to analytical calculations, the total head loss will be 0.0476.
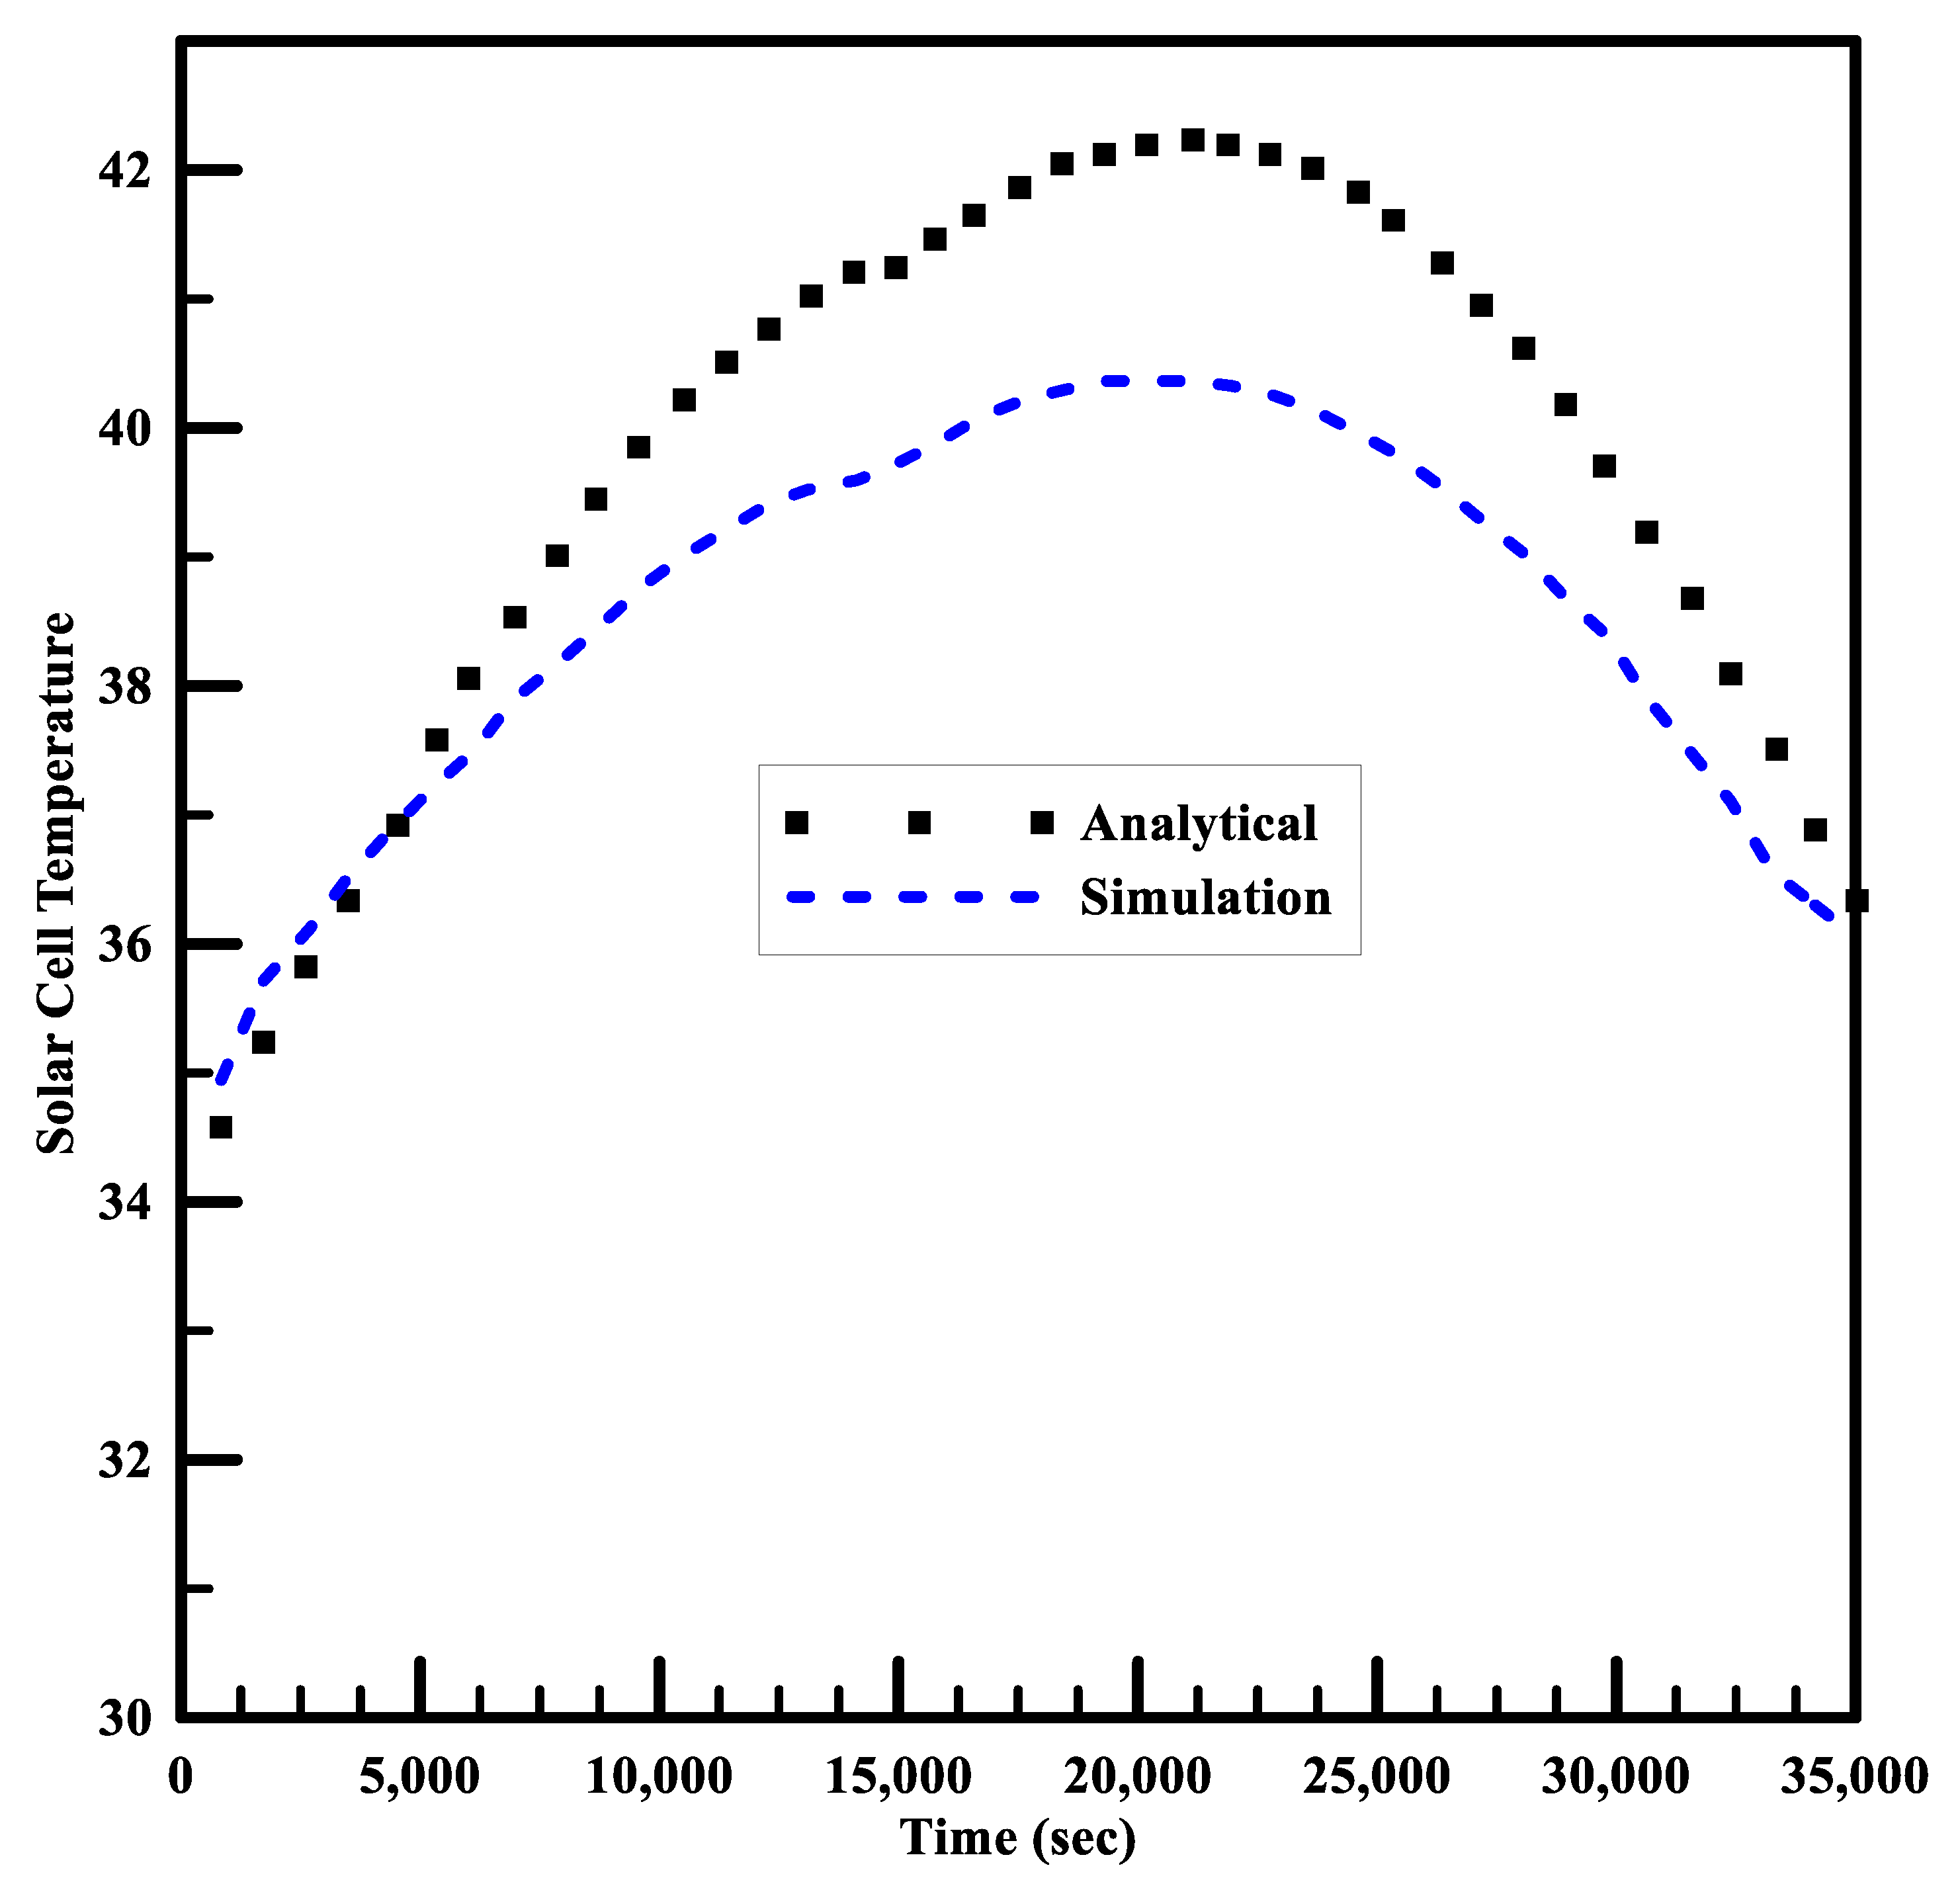
Figure 15 depicts the comparative analysis of solar cell temperature behavior under multi-pass cooling.
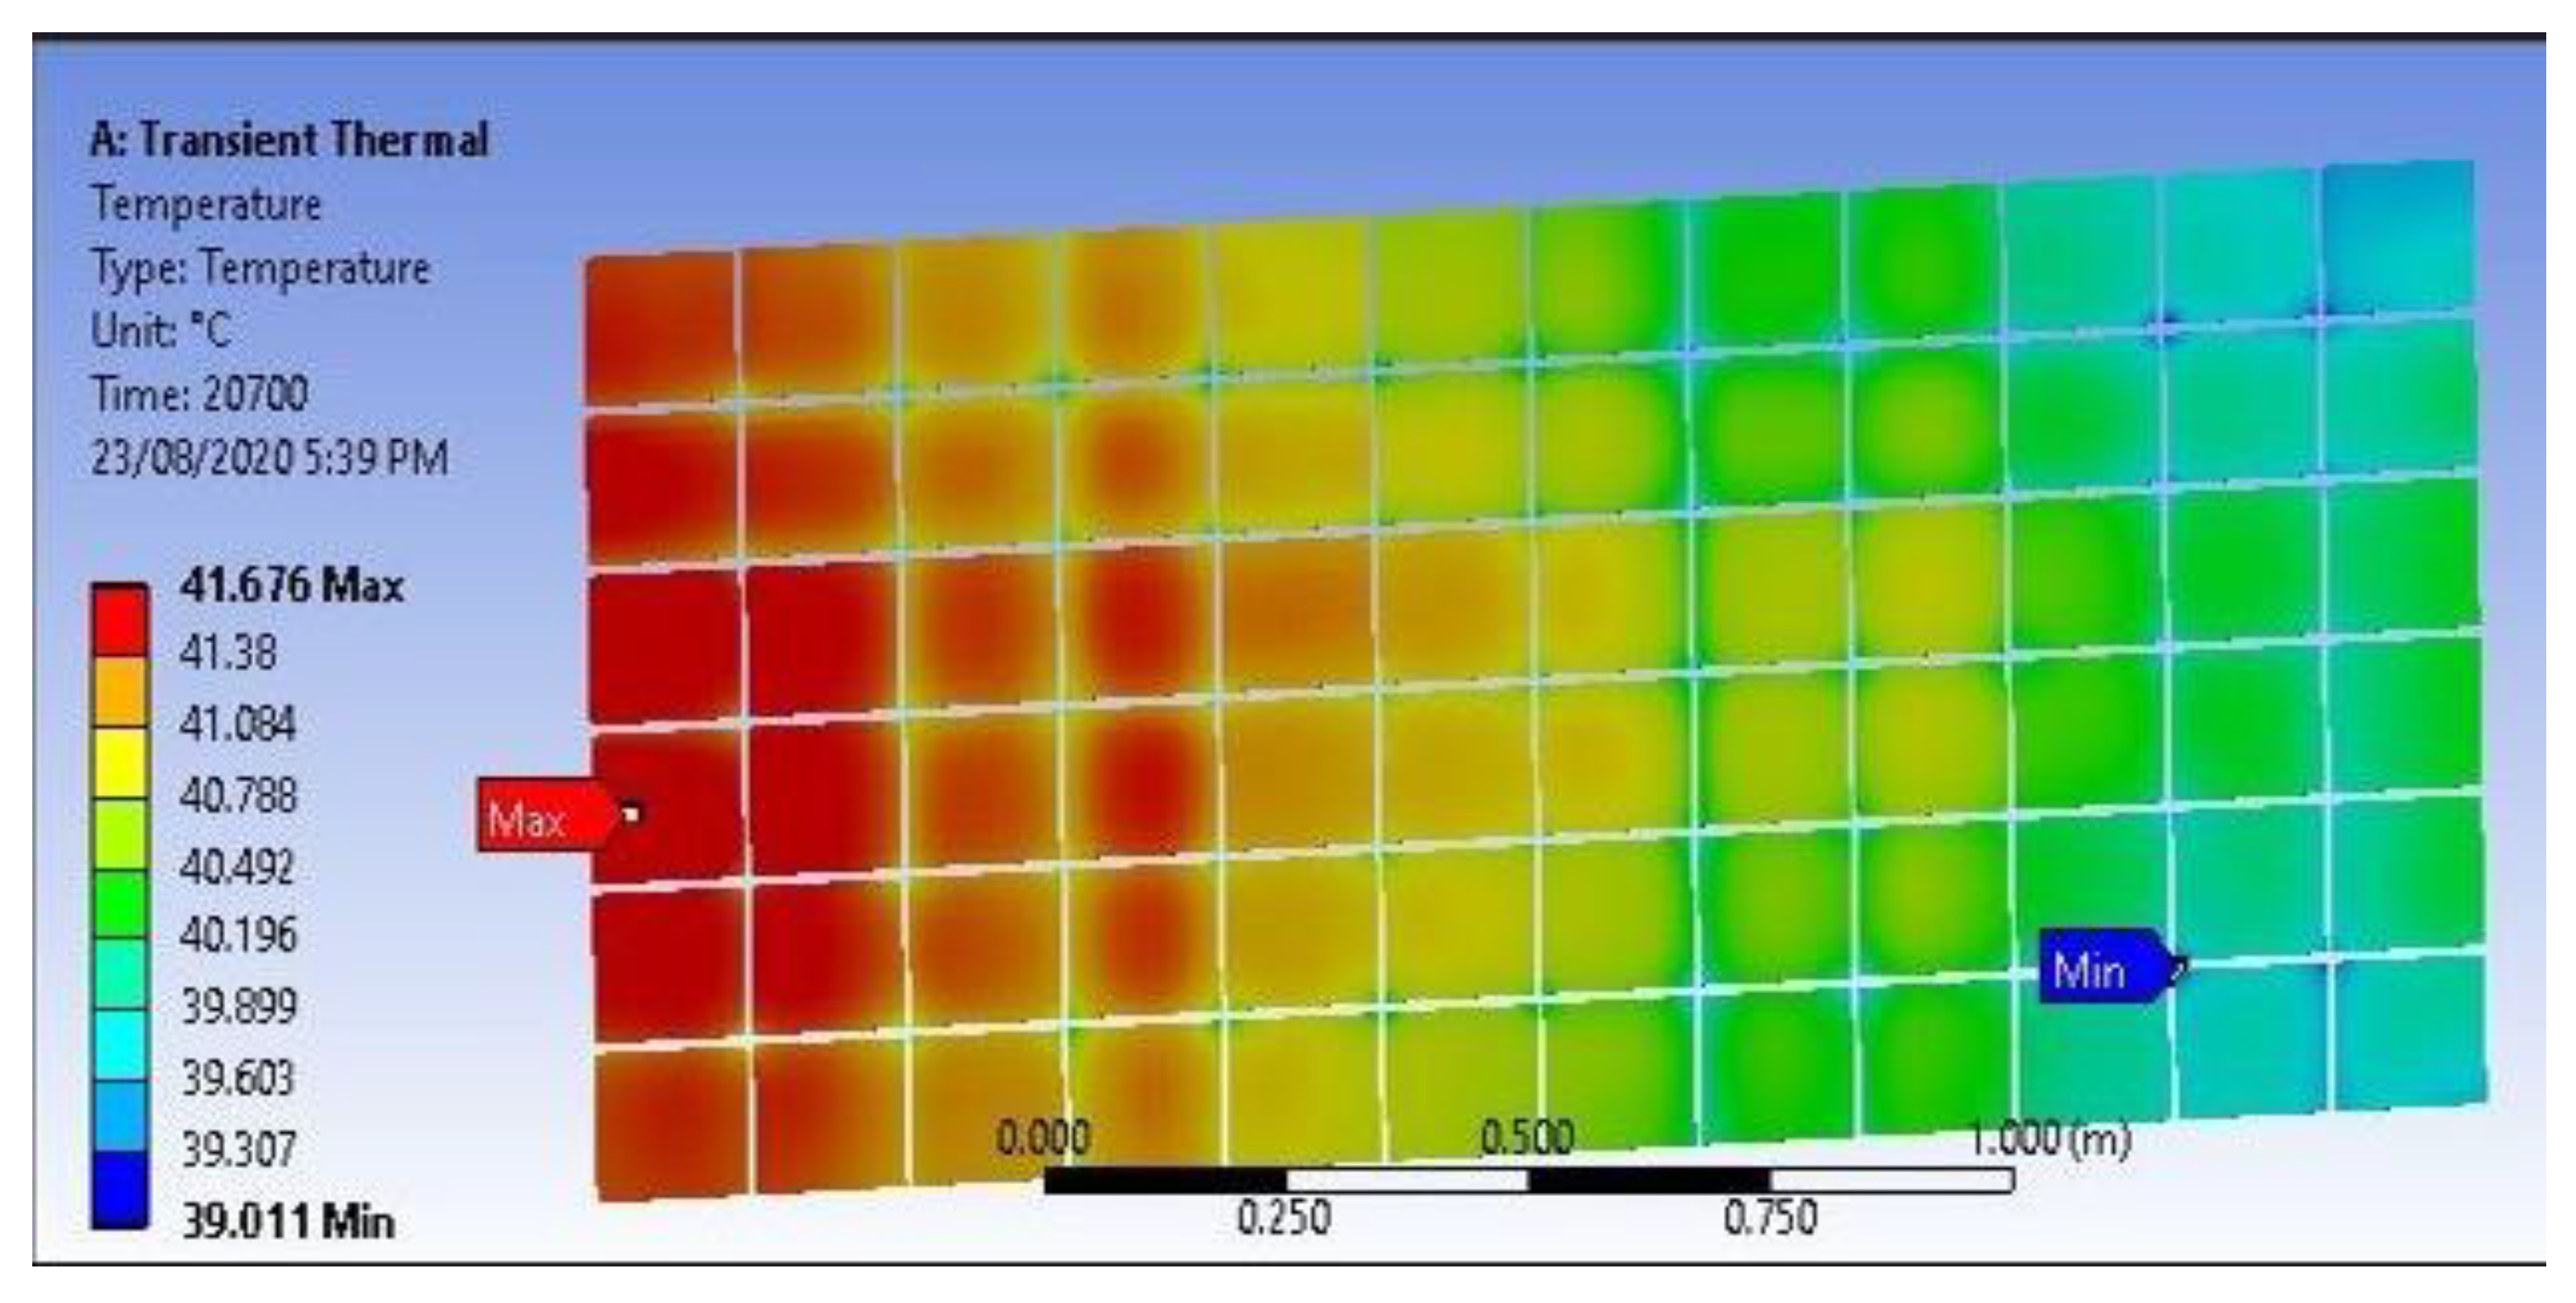
The general analytical and simulation trends are similar to the one observed in Figure 11. However, there is a pronounced difference in the cell temperatures of the cooled and uncooled systems. The system subjected to multi-pass cooling showed a minimum temperature of 35 °C; compare that to 50 °C for the uncooled system at the beginning of analysis. The cooled system showed maximum analytical and simulation-based cell temperatures of 42 and 41 °C respectively at t = 20,700 s. In comparison to the uncooled solar cells, the temperature during the peak hours reduced by more than half for a cooled system—i.e., 93 and 42 °C for uncooled and cooled systems, respectively. Towards the end of the analysis, the cooled solar cell showed a temperature of 36 °C. It is deduced that multi-pass cooling effectively reduces the temperature of solar panels, which in turn improves their performance and efficiency. The analytical and simulated contours at 20,700 s also show similar trends and temperature variation (Figure 16 and Figure 17). At this time point, the cell temperature is maximal.
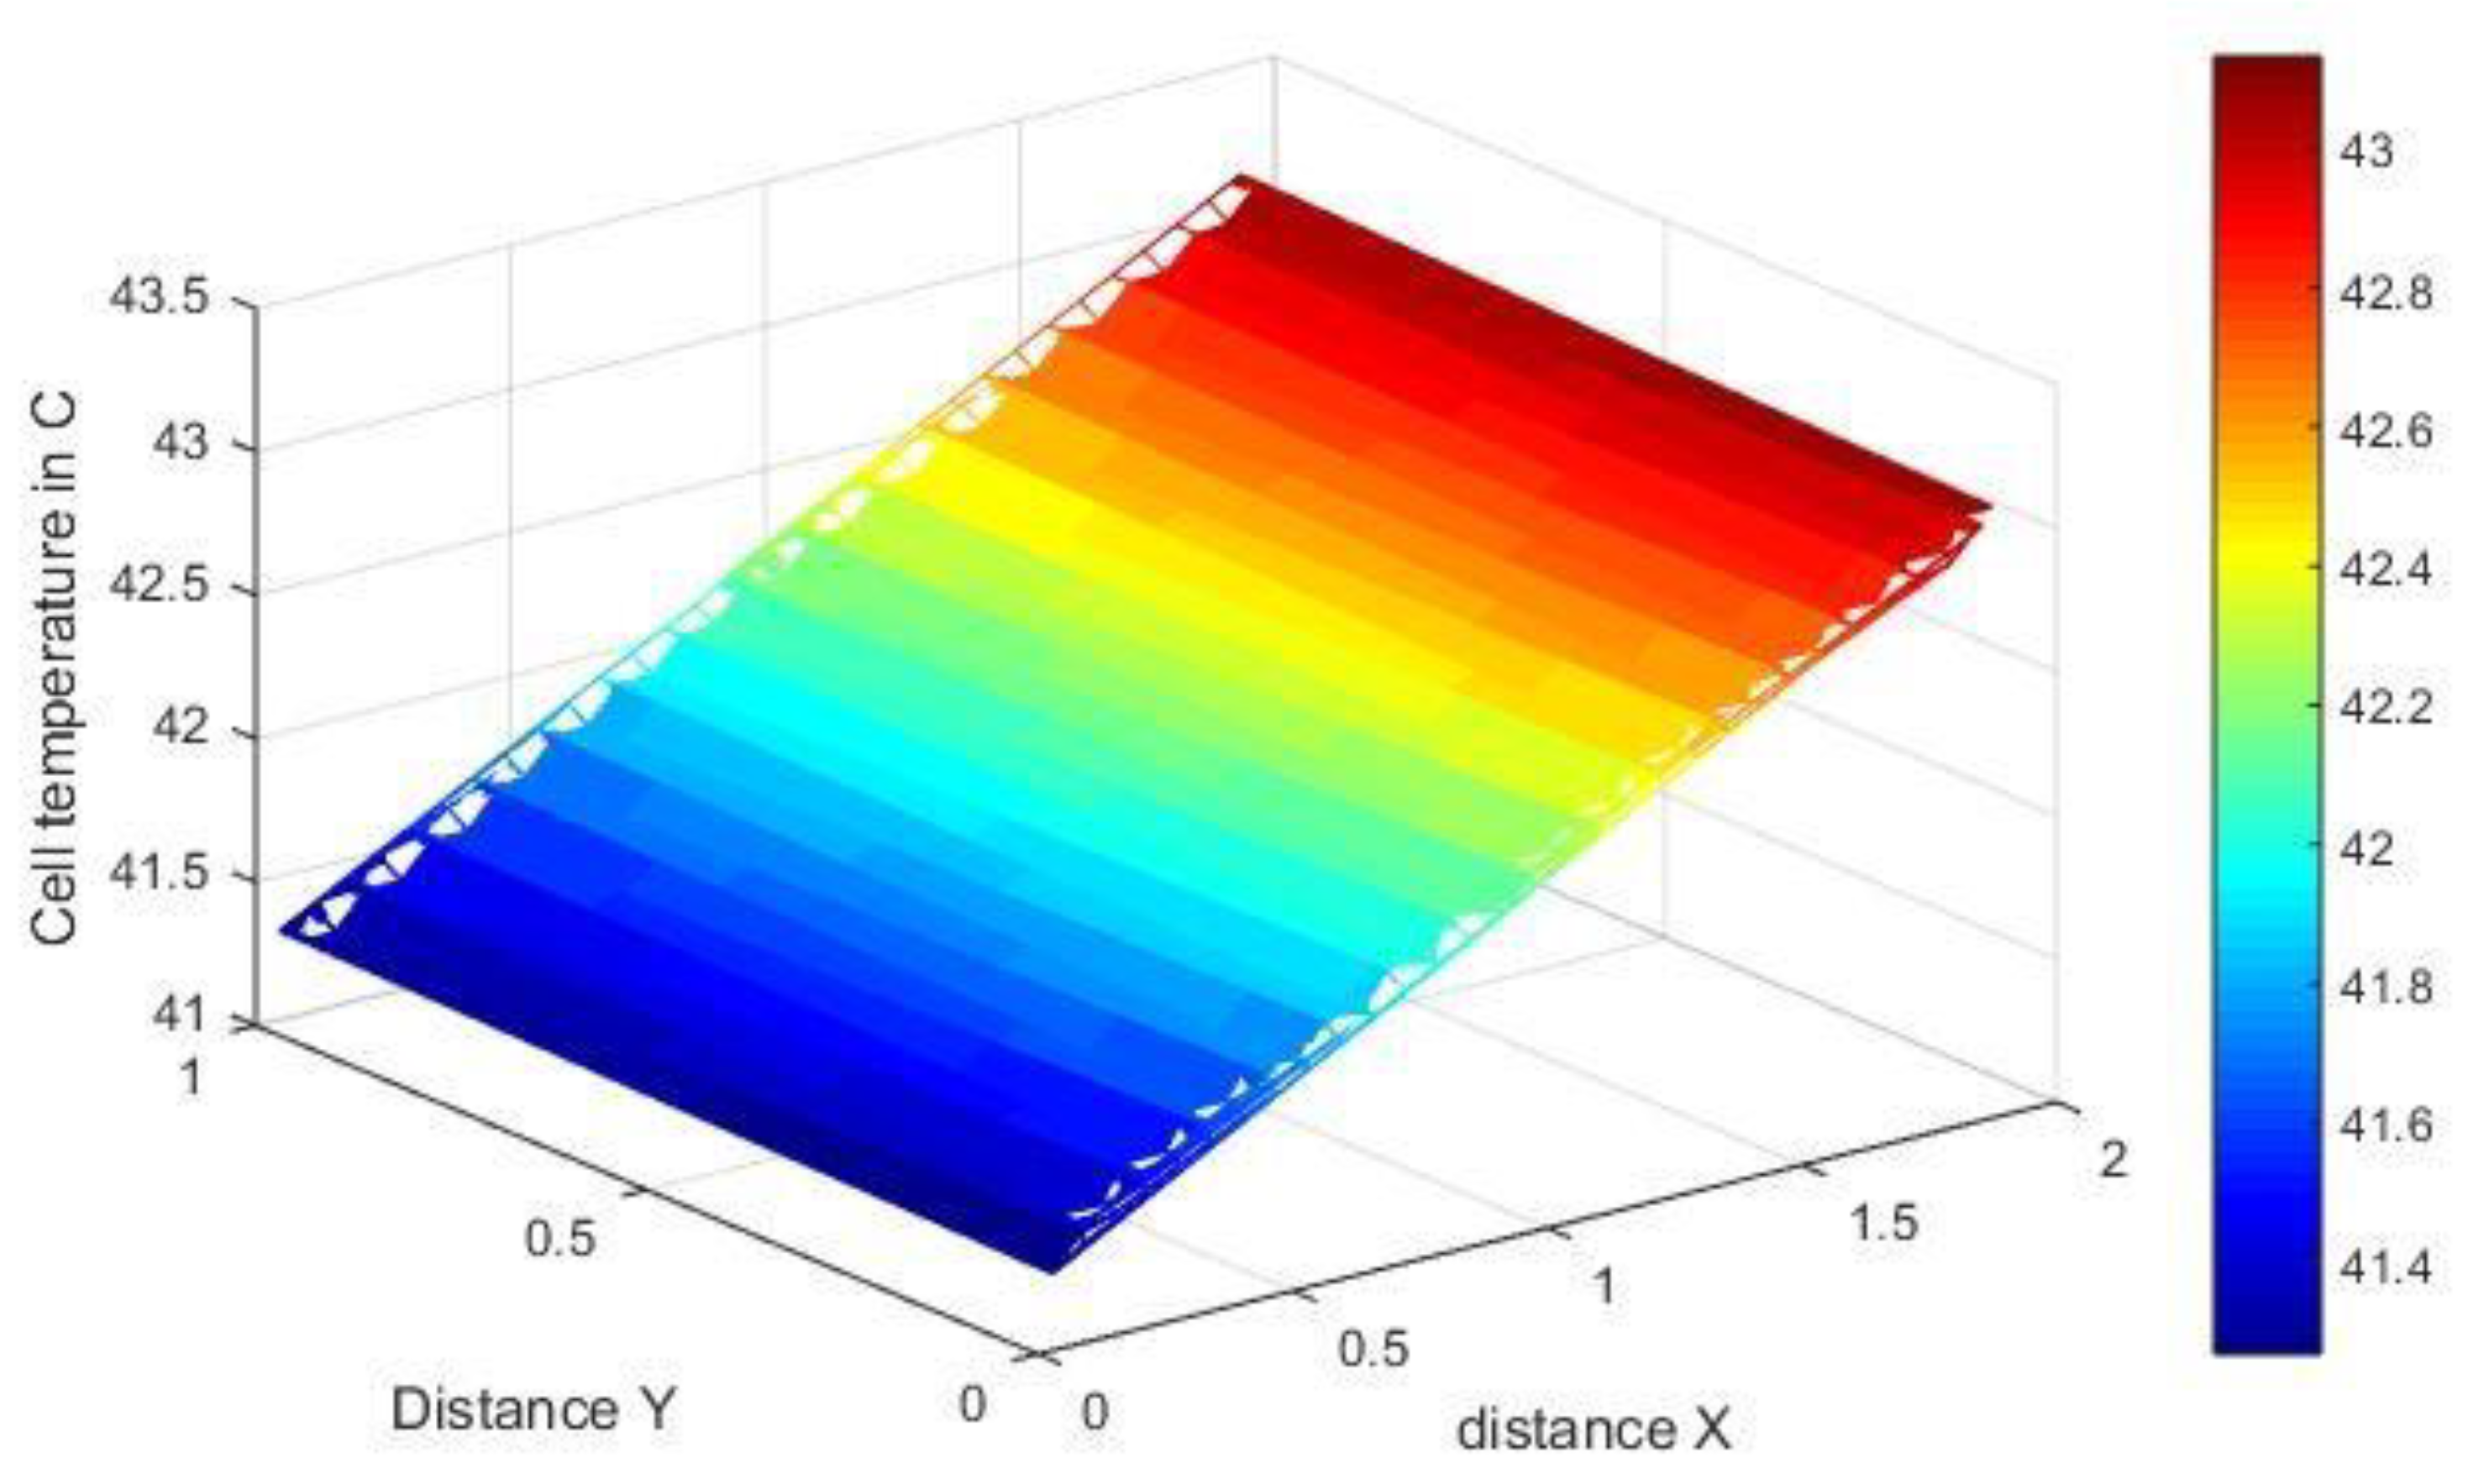
Analytical equations in the differential form were solved in MATLAB to get the variation in temperature with the change in distance along the PV module. MATLAB results for the time step are shown in Figure 17. The analytical temperature contour for the hybrid panel system shows a clear decrease in the temperature of cells at a reduced distance.

6. Conclusions

Numerical and simulation analyses of a hybrid water cooling system were studied under climatic conditions for the month of June in Islamabad, Pakistan, to reduce the solar panel temperature. Based on the results obtained, the following conclusions are drawn:
  • PV and PV/T modules were analytically modeled using irradiance and ambient air conditions of Islamabad in June. For climate modeling, Erbs, Liu, and Jordan’s model and the sin linking day’s model were used. The optimum angle for solar panel tilt is 23°. Boundary conditions obtained by these models were incorporated in the analytical model, which was then linked with the optimization algorithm. According to analytical calculations, the hybrid system can produce about 0.15 kWh more energy than the ordinary system in June. Results clarify that cooling enhances the net output of the panel by reducing the effect of efficiency loss due to temperature.
  • The analytical results were validated using fluent and thermal modules in ANSYS. The fluid flow regime is considered in the transition domain close to turbulent flow. Good agreement between analytical and numerical results for maximum cell temperature of PV panel was observed. The efficiency of the solar panel was directly dependent on the temperature of the cell; thus, the numerical results verified the efficiency of temperature behavior for a multi-pass hybrid solar panel.
  • A comparison of PV and hybrid PV panels was carried out considering the power required by a commercial pump that provides the same head and flow rate of the fluid. In a multi-pass absorber, the inlet width was also varied as the number of passes was changed. Due to these facts, the multi-pass absorber can have relatively higher velocities of fluid at lower head losses. The cell temperature is also reduced as higher velocities increase the heat transfer coefficient.
  • Absorbers of different types were modeled and compared. The hybrid solar panel with a multi-pass duct system was compared with a PV system without cooling. In March, the output of both the systems is almost equal, but the difference in output increases as ambient temperature increases. The trends and temperature behavior of the PV module and designed Hybrid PV module were verified by ANSYS simulations. However, the optimized result was achieved for the multi-pass duct with 31 passes that delivers a maximum power output of 186.713 W at a mass flow rate of 0.14 kg/s. The maximum cell temperature achieved for this configuration was 37.810 °C at a velocity of 0.092 m/s.
The research will enable engineers to design hybrid solar panels for domestic purposes with minimum electrical energy usage that produce net gains in power and efficiency. The different layouts enable the selection of a system according to varying requirements for domestic heating and cooling purposes.

Author Contributions

M.S., conceptualization, formal analysis, investigation, and writing—original draft; A.R., methodology, software, validation, and writing—original draft; N.A., resources, software, formal analysis, validation, and writing—original draft; A.M., methodology, formal analysis, proofreading original draft, and funding acquisition; A.A.A.A., supervision, conceptualization, software validation, and funding acquisition; N.U., conceptualization, formal analysis, project administration/PI, and funding acquisition. All authors have read and agreed to the published version of the manuscript.

Funding

This research is supported by Taif University researchers supporting project number (TURSP-2020/144), Taif University, Taif, Saudi Arabia.

Conflicts of Interest

The authors declare no conflict of interest.

Nomenclature

Iincident radiation
τ g transmissivity of the glass cover
ɳ efficiency
αcabsorptivity of solar panel
βpacking factor
αtabsorptivity of tedlar
STCstandard test Conditions
PVphotovoltaic
Taambient temperature
Tccell temperature
UtOverall heat transfer coefficient from PV to ambient from the top of the panel through glass
UToverall heat transfer coefficient from PV to ambient from the bottom of panel trough tedlar
Iohourly extraterrestrial radiation
Γday angle
ωhour angle
STlocal solar time
LTlocal standard time
Lsstandard meridian
LLlongitude of the location
Mtclearness index
βtilt angle
Iββtotal Irradiance on the tilted surface
Tbstemperature back surface
bbreath
dxelement length
hfheat transfer coefficient of fluid
Tf-avgaverage temperature of fluid
Cpspecific heat
Uban overall heat transfer coefficient from bottom to ambient
hp1penalty factor
hp2penalty factor
UTtOverall Heat transfer Coefficient from Tedlar to Ambient from the top of the panel across glass
Dhhydraulic Diameter
kconduction coefficient
Uboverall heat transfer coefficient to ambient from the back side of absorber
ULan overall heat transfer coefficient from solar cell to ambient through top and back surface of insulation
Llength
mmass
Tf-outfluid outlet temperature
Tf-influid inlet temperature
Ppressure
Utfoverall heat transfer coefficient from fluid to ambient from the top of the panel through glass
Subscripts
AAmbient Air
fFluid
tTedlar
gGlass
bsBack surface
cSolar Cell

References

  1. Awda, L.; Khalaf, Y.; Salih, S. Analysis of temperature effect on a crystalline silicon photovoltaic module performance. Int. J. Eng. 2016, 29, 722–727. [Google Scholar]
  2. Kandeal, A.; Thakur, A.K.; Elkadeem, M.; Elmorshedy, M.F.; Ullah, Z.; Sathyamurthy, R.; Sharshir, S.W. Photovoltaics performance improvement using different cooling methodologies: A state-of-art review. J. Clean. Prod. 2020, 273, 122772. [Google Scholar] [CrossRef]
  3. Osma-Pinto, G.; Ordóñez-Plata, G. Dynamic thermal modelling for the prediction of the operating temperature of a PV panel with an integrated cooling system. Renew. Energy 2020, 152, 1041–1054. [Google Scholar] [CrossRef]
  4. Idoko, L.; Anaya-Lara, O.; McDonald, A. Enhancing PV modules efficiency and power output using multi-concept cooling technique. Energy Rep. 2018, 4, 357–369. [Google Scholar] [CrossRef]
  5. Prudhvi, P.; Sai, P.C. Efficiency improvement of solar PV panels using active cooling. In Proceedings of the 2012 11th International Conference on Environment and Electrical Engineering, Venice, Italy, 18–25 May 2012; pp. 1093–1097. [Google Scholar]
  6. Hasan, M.A.; Sumathy, K. Photovoltaic thermal module concepts and their performance analysis: A review. Renew. Sustain. Energy Rev. 2010, 14, 1845–1859. [Google Scholar] [CrossRef]
  7. Sargunanathan, S.; Elango, A.; Mohideen, S.T. Performance enhancement of solar photovoltaic cells using effective cooling methods: A review. Renew. Sustain. Energy Rev. 2016, 64, 382–393. [Google Scholar] [CrossRef]
  8. Al-Waeli, A.H.; Sopian, K.; Kazem, H.A.; Chaichan, M.T. Photovoltaic/Thermal (PV/T) systems: Status and future prospects. Renew. Sustain. Energy Rev. 2017, 77, 109–130. [Google Scholar] [CrossRef]
  9. García, M.A.; Balenzategui, J. Estimation of photovoltaic module yearly temperature and performance based on nominal operation cell temperature calculations. Renew. Energy 2004, 29, 1997–2010. [Google Scholar] [CrossRef]
  10. Kurnik, J.; Jankovec, M.; Brecl, K.; Topic, M. Outdoor testing of PV module temperature and performance under different mounting and operational conditions. Sol. Energy Mater. Sol. Cells 2011, 95, 373–376. [Google Scholar] [CrossRef]
  11. Cuce, E.; Cuce, P.M.; Karakas, I.H.; Bali, T. An accurate model for photovoltaic (PV) modules to determine electrical characteristics and thermodynamic performance parameters. Energy Convers. Manag. 2017, 146, 205–216. [Google Scholar] [CrossRef]
  12. Bayrak, F.; Oztop, H.F.; Selimefendigil, F. Experimental study for the application of different cooling techniques in photovoltaic (PV) panels. Energy Convers. Manag. 2020, 212, 112789. [Google Scholar] [CrossRef]
  13. Shahsavar, A.; Ameri, M.; Gholampour, M. Energy and exergy analysis of a photovoltaic-thermal collector with natural air flow. J. Sol. Energy Eng. 2012, 134, 011014. [Google Scholar] [CrossRef]
  14. Dwivedi, P.; Sudhakar, K.; Soni, A.; Solomin, E.; Kirpichnikova, I. Advanced cooling techniques of PV modules: A state of art. Case Stud. Therm. Eng. 2020, 21, 100674. [Google Scholar] [CrossRef]
  15. Tonui, J.; Tripanagnostopoulos, Y. Improved PV/T solar collectors with heat extraction by forced or natural air circulation. Renew. Energy 2007, 32, 623–637. [Google Scholar] [CrossRef]
  16. Dubey, S.; Solanki, S.; Tiwari, A. Energy and exergy analysis of PV/T air collectors connected in series. Energy Build. 2009, 41, 863–870. [Google Scholar] [CrossRef]
  17. Joshi, A.; Tiwari, A.; Tiwari, G.; Dincer, I.; Reddy, B. Performance evaluation of a hybrid photovoltaic thermal (PV/T)(glass-to-glass) system. Int. J. Therm. Sci. 2009, 48, 154–164. [Google Scholar] [CrossRef]
  18. Othman, M.Y.; Yatim, B.; Sopian, K.; Bakar, M.N.A. Performance studies on a finned double-pass photovoltaic-thermal (PV/T) solar collector. Desalination 2007, 209, 43–49. [Google Scholar] [CrossRef]
  19. Sarhaddi, F.; Farahat, S.; Ajam, H.; Behzadmehr, A.; Adeli, M.M. An improved thermal and electrical model for a solar photovoltaic thermal (PV/T) air collector. Appl. Energy 2010, 87, 2328–2339. [Google Scholar] [CrossRef]
  20. Saygin, H.; Nowzari, R.; Mirzaei, N.; Aldabbagh, L. Performance evaluation of a modified PV/T solar collector: A case study in design and analysis of experiment. Sol. Energy 2017, 141, 210–221. [Google Scholar] [CrossRef]
  21. Mojumder, J.C.; Chong, W.T.; Ong, H.C.; Leong, K. An experimental investigation on performance analysis of air type photovoltaic thermal collector system integrated with cooling fins design. Energy Build. 2016, 130, 272–285. [Google Scholar] [CrossRef]
  22. Benato, A.; Stoppato, A.; De Vanna, F.; Schiro, F. Spraying Cooling System for PV Modules: Experimental Measurements for Temperature Trends Assessment and System Design Feasibility. Designs 2021, 5, 25. [Google Scholar] [CrossRef]
  23. Sharma, R.; Gupta, A.; Nandan, G.; Dwivedi, G.; Kumar, S. Life span and overall performance enhancement of solar photovoltaic cell using water as coolant: A recent review. Mater. Today Proc. 2018, 5, 18202–18210. [Google Scholar] [CrossRef]
  24. Silva, V.; Martinez, J.; Heideier, R.; Bernal, J.; Gimenes, A.; Udaeta, M.; Saidel, M. A Long-Term Analysis of the Architecture and Operation of Water Film Cooling System for Commercial PV Modules. Energies 2021, 14, 1515. [Google Scholar] [CrossRef]
  25. Bahaidarah, H.; Subhan, A.; Gandhidasan, P.; Rehman, S. Performance evaluation of a PV (photovoltaic) module by back surface water cooling for hot climatic conditions. Energy 2013, 59, 445–453. [Google Scholar] [CrossRef]
  26. Mah, C.-Y.; Lim, B.-H.; Wong, C.-W.; Tan, M.-H.; Chong, K.-K.; Lai, A.-C. Investigating the performance improvement of a photovoltaic system in a tropical climate using water cooling method. Energy Procedia 2019, 159, 78–83. [Google Scholar] [CrossRef]
  27. Nižetić, S.; Čoko, D.; Yadav, A.; Grubišić-Čabo, F. Water spray cooling technique applied on a photovoltaic panel: The performance response. Energy Convers. Manag. 2016, 108, 287–296. [Google Scholar]
  28. Tripanagnostopoulos, Y.; Nousia, T.; Souliotis, M.; Yianoulis, P. Hybrid photovoltaic/thermal solar systems. Sol. Energy 2002, 72, 217–234. [Google Scholar] [CrossRef]
  29. Fudholi, A.; Sopian, K.; Yazdi, M.H.; Ruslan, M.H.; Ibrahim, A.; Kazem, H.A. Performance analysis of photovoltaic thermal (PVT) water collectors. Energy Convers. Manag. 2014, 78, 641–651. [Google Scholar] [CrossRef]
  30. Yazdanifard, F.; Ebrahimnia-Bajestan, E.; Ameri, M. Investigating the performance of a water-based photovoltaic/thermal (PV/T) collector in laminar and turbulent flow regime. Renew. Energy 2016, 99, 295–306. [Google Scholar] [CrossRef]
  31. Al-Amri, F.; Maatallah, T.S.; Al-Amri, O.F.; Ali, S.; Ali, S.; Ateeq, I.S.; Zachariah, R.; Kayed, T.S. Innovative technique for achieving uniform temperatures across solar panels using heat pipes and liquid immersion cooling in the harsh climate in the Kingdom of Saudi Arabia. Alex. Eng. J. 2022, 61, 1413–1424. [Google Scholar] [CrossRef]
  32. Han, X.; Guo, Y.; Wang, Q.; Phelan, P. Optical characterization and durability of immersion cooling liquids for high concentration III-V photovoltaic systems. Sol. Energy Mater. Sol. Cells 2018, 174, 124–131. [Google Scholar] [CrossRef]
  33. Mehrotra, S.; Rawat, P.; Debbarma, M.; Sudhakar, K. Performance of a solar panel with water immersion cooling technique. Int. J. Sci. Environ. Technol. 2014, 3, 1161–1172. [Google Scholar]
  34. Abdolzadeh, M.; Ameri, M. Improving the effectiveness of a photovoltaic water pumping system by spraying water over the front of photovoltaic cells. Renew. Energy 2009, 34, 91–96. [Google Scholar] [CrossRef]
  35. Tabaei, H.; Ameri, M. Improving the effectiveness of a photovoltaic water pumping system by using booster reflector and cooling array surface by a film of water. Iran. J. Sci. Technol. Trans. Mech. Eng. 2015, 39, 51. [Google Scholar]
  36. Odeh, S.; Behnia, M. Improving photovoltaic module efficiency using water cooling. Heat Transf. Eng. 2009, 30, 499–505. [Google Scholar] [CrossRef]
  37. Figaj, R.; Żołądek, M. Operation and Performance Assessment of a Hybrid Solar Heating and Cooling System for Different Configurations and Climatic Conditions. Energies 2021, 14, 1142. [Google Scholar] [CrossRef]
  38. Figaj, R.; Żołądek, M. Experimental and numerical analysis of hybrid solar heating and cooling system for a residential user. Renew. Energy 2021, 172, 955–967. [Google Scholar] [CrossRef]
  39. Gado, M.G.; Megahed, T.F.; Ookawara, S.; Nada, S.; El-Sharkawy, I.I. Performance and economic analysis of solar-powered adsorption-based hybrid cooling systems. Energy Convers. Manag. 2021, 238, 114134. [Google Scholar] [CrossRef]
  40. Ziapour, B.M.; Palideh, V.; Mohammadnia, A. Study of an improved integrated collector-storage solar water heater combined with the photovoltaic cells. Energy Convers. Manag. 2014, 86, 587–594. [Google Scholar] [CrossRef]
  41. Tiwari, A.; Sodha, M.; Chandra, A.; Joshi, J. Performance evaluation of photovoltaic thermal solar air collector for composite climate of India. Sol. Energy Mater. Sol. Cells 2006, 90, 175–189. [Google Scholar] [CrossRef]
  42. Chow, D.; Levermore, G.J. New algorithm for generating hourly temperature values using daily maximum, minimum and average values from climate models. Build. Serv. Eng. Res. Technol. 2007, 28, 237–248. [Google Scholar] [CrossRef]
  43. Kalogirou, S.A. Environmental characteristics. In Solar Energy Engineering; Elsevier: Amsterdam, The Netherlands, 2009; pp. 49–120. [Google Scholar]
  44. Mousavi Maleki, S.A.; Hizam, H.; Gomes, C. Estimation of hourly, daily and monthly global solar radiation on inclined surfaces: Models re-visited. Energies 2017, 10, 134. [Google Scholar] [CrossRef]
  45. Erbs, D.; Klein, S.; Duffie, J. Estimation of the diffuse radiation fraction for hourly, daily and monthly-average global radiation. Sol. Energy 1982, 28, 293–302. [Google Scholar] [CrossRef]
  46. Liu, B.; Jordan, R. Daily insolation on surfaces tilted towards equator. ASHRAE J. 1961, 10, 526–541. [Google Scholar]
  47. Rao, S.S. Engineering Optimization: Theory and Practice; John Wiley & Sons: Hoboken, NJ, USA, 2019. [Google Scholar]
Figure 1. Thermal circuit of a PV panel.
Energies 15 06278 g001
Figure 2. Heat absorber layouts: (a) single-pass duct; (b) multi-pass duct; (c) tube-type absorber.
Energies 15 06278 g002
Figure 3. Thermal circuit of a PV/T panel.
Energies 15 06278 g003
Figure 4. Schematic of multi-objective, multivariable genetic optimization algorithm.
Energies 15 06278 g004
Figure 5. Hourly forecast for real and actual temperature, humidity, and pressure.
Energies 15 06278 g005
Figure 6. Cell temperature over the whole day for 9th of June.
Energies 15 06278 g006
Figure 7. The power output of solar panels over the whole day for 9th of June.
Energies 15 06278 g007
Figure 8. PV efficiency with and without the cooling system for 9th of June.
Energies 15 06278 g008
Figure 9. CAD model of PV panel.
Energies 15 06278 g009
Figure 10. The hexahedral meshing of the PV module.
Energies 15 06278 g010
Figure 11. CAE temperature contour of a solar panel without cooling.
Energies 15 06278 g011
Figure 12. Simulation vs. analytical results for uncooled PV panel.
Energies 15 06278 g012
Figure 13. CAD model of the hybrid solar panel.
Energies 15 06278 g013
Figure 14. Mesh of a solid structure in the transient thermal simulation.
Energies 15 06278 g014
Figure 15. Analytical vs. simulated trends with multi-pass cooling.
Energies 15 06278 g015
Figure 16. Simulated contours of the hybrid solar panel system.
Energies 15 06278 g016
Figure 17. Analytical temperature contour for hybrid solar panel system.
Energies 15 06278 g017
Table 1. Specifications of PV module.
Length (m)Width (m)Efficiency at STCMax Power (W)Temp Coefficient of Pmax
1.9560.99216.53200.45%/°C
Table 2. Predefined variables/parameters for analytical calculations [37].
Variable/ParameterValue
Fill Factor of PV module0.83
Coefficient of Convection of Air (W/m2K)6.5
Thickness of Glass (m)0.0032
Thickness of Tedlar (m)0.0005
Thickness of EVA (m)0.0005
Conductivity of Tedlar (W/(mK))0.033
Conductivity of EVA (W/(mK))0.23
Conductivity of Glass (W/(mK))1
Conductivity of Solar Cell (W/(mK))148
Thickness of Cell (m)0.00035
Duct and tube materialAluminium
Aluminium Thickness for Duct Walls (m)0.003
Aluminium Conductivity (W/(mK))205
Tube Dimensions15 × 25 (sq.mm)
Absorptivity of Ted-lar0.50
Absorptivity of Solar Cell0.90
Transmissibility of Glass0.95
Diameter of External Circuit pipe (mm)0.0142
Fluid Inlet Temperature (°C)0.8 times the maximum Ambient temperature of the Month
Table 3. Designed parameters of tube-type heat absorbers. ✓—specify the optimized absorber parameters for analysis.
Tube TypePassesVelocity (m/s)Tc Max (°C)Mass Flow Rate (kg/s)Power
Input (W)
Max Power Output (W)
✓7.000.2841.940.115.18178.97
8.000.2641.640.105.48178.94
12.000.1841.750.075.50178.82
13.000.1641.910.065.40178.78
Single-pass ductHeight(m)Velocity (m/s)Tc Max (°C)Mass Flow Rate (kg/s)Power
Input (W)
Max Power Output (W)
✓0.0120.00939.9850.1140.878185.027
0.0120.00640.6990.0690.499184.767
0.0160.00740.8350.1100.843184.301
0.0180.00641.3800.1030.776183.879
Table 4. Designed parameters of multi-pass duct type heat absorber. ✓—specify the optimized absorber parameters for analysis.
Multi-Pass DuctHeight (m)Velocity (m/s)PassesTc Max (°C)Mass Flow Rate (kg/s)Power
Input (W)
Max Power Output (W)
0.0160.10032.00038.1690.0950.723186.810
0.0290.10738.00037.6380.1491.241186.768
✓0.0250.09231.00037.8100.1401.141186.713
0.0240.06429.00038.5340.0980.739186.468
Note: The inlet water temperature in the above tables was considered to be 25 °C, and cell temperature was determined accordingly for all the points in Table 3 and Table 4.
Table 5. Comparison of net energy production of PV and PV/T modules with a multi-pass duct system.
MonthMonthly Average Temperate (Hi/Low) (°C)Cooling Water inlet Temperature (°C) Power Input Commercially Available
Pump (W)
Net Energy Produced KWh
PV System without CoolingPV System with Multi-Pass Duct Cooling
March24/1020100.991.01
April30/1525101.1481.23
May35/1928101.2271.35
June38/2430101.23061.38
July34/2428101.2341.369
August33.4/23.528101.1931.30
Publisher’s Note: MDPI stays neutral with regard to jurisdictional claims in published maps and institutional affiliations.