
Tariff Menus to Avoid Rebound Peaks: Results from a Discrete Choice Experiment with Swiss Customers


Abstract
:1. Introduction
1.1. Literature
1.1.1. Price-Based Demand Response
1.1.2. Incentive Based Demand Response
1.2. Research Focus
2. Materials and Methods
2.1. Design of Discrete Choice Experiment
2.2. Evaluation of Discrete Choice Experiment
2.3. Data Collection
3. Results
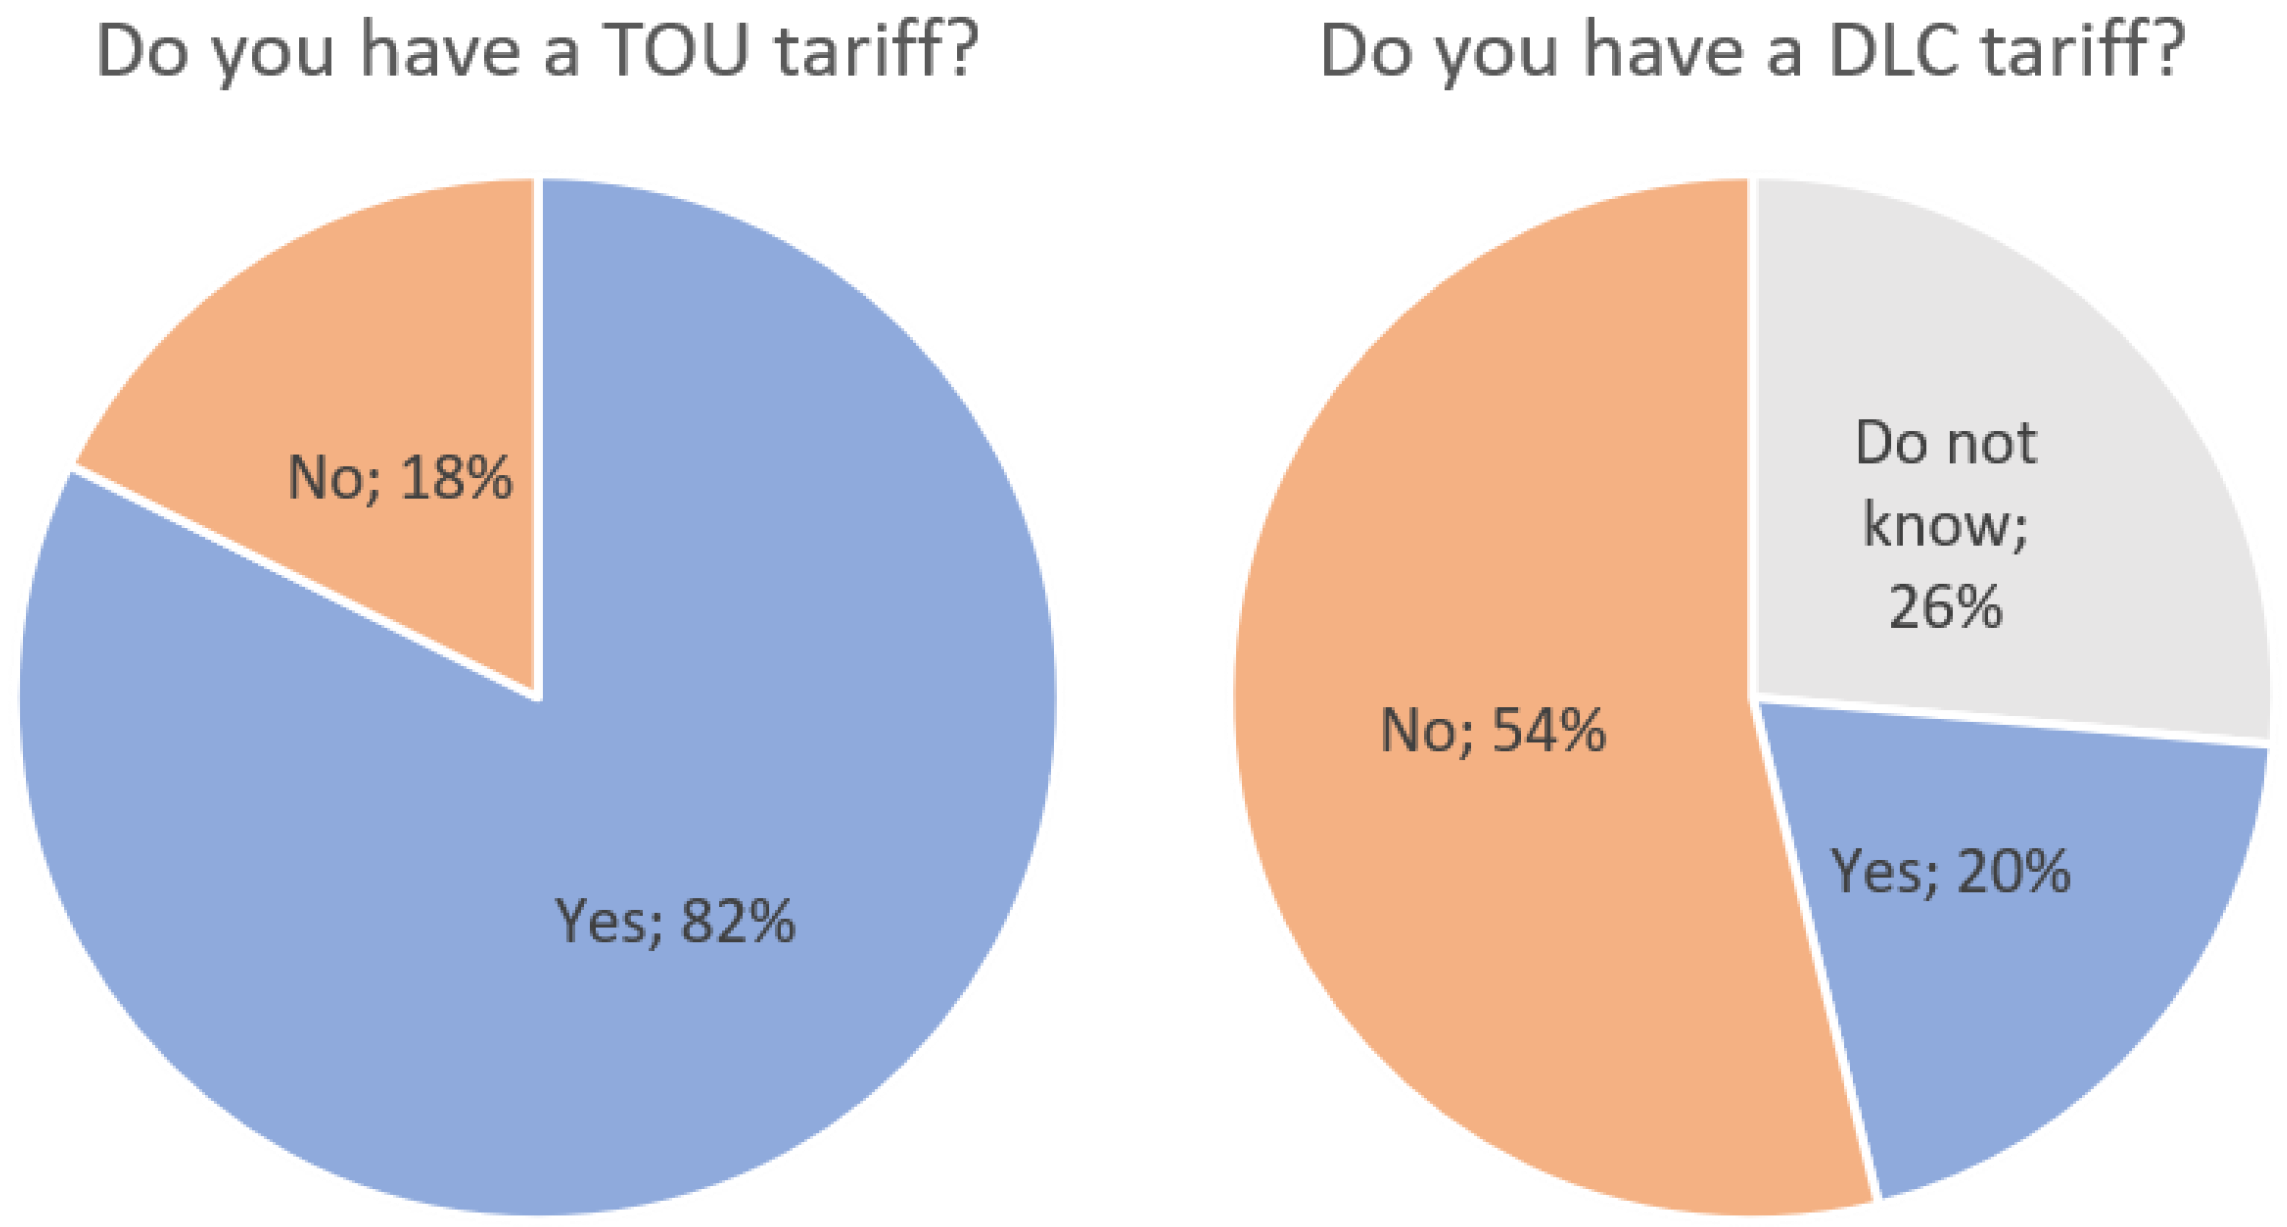
3.1. Attitudes towards Energy Related Topics
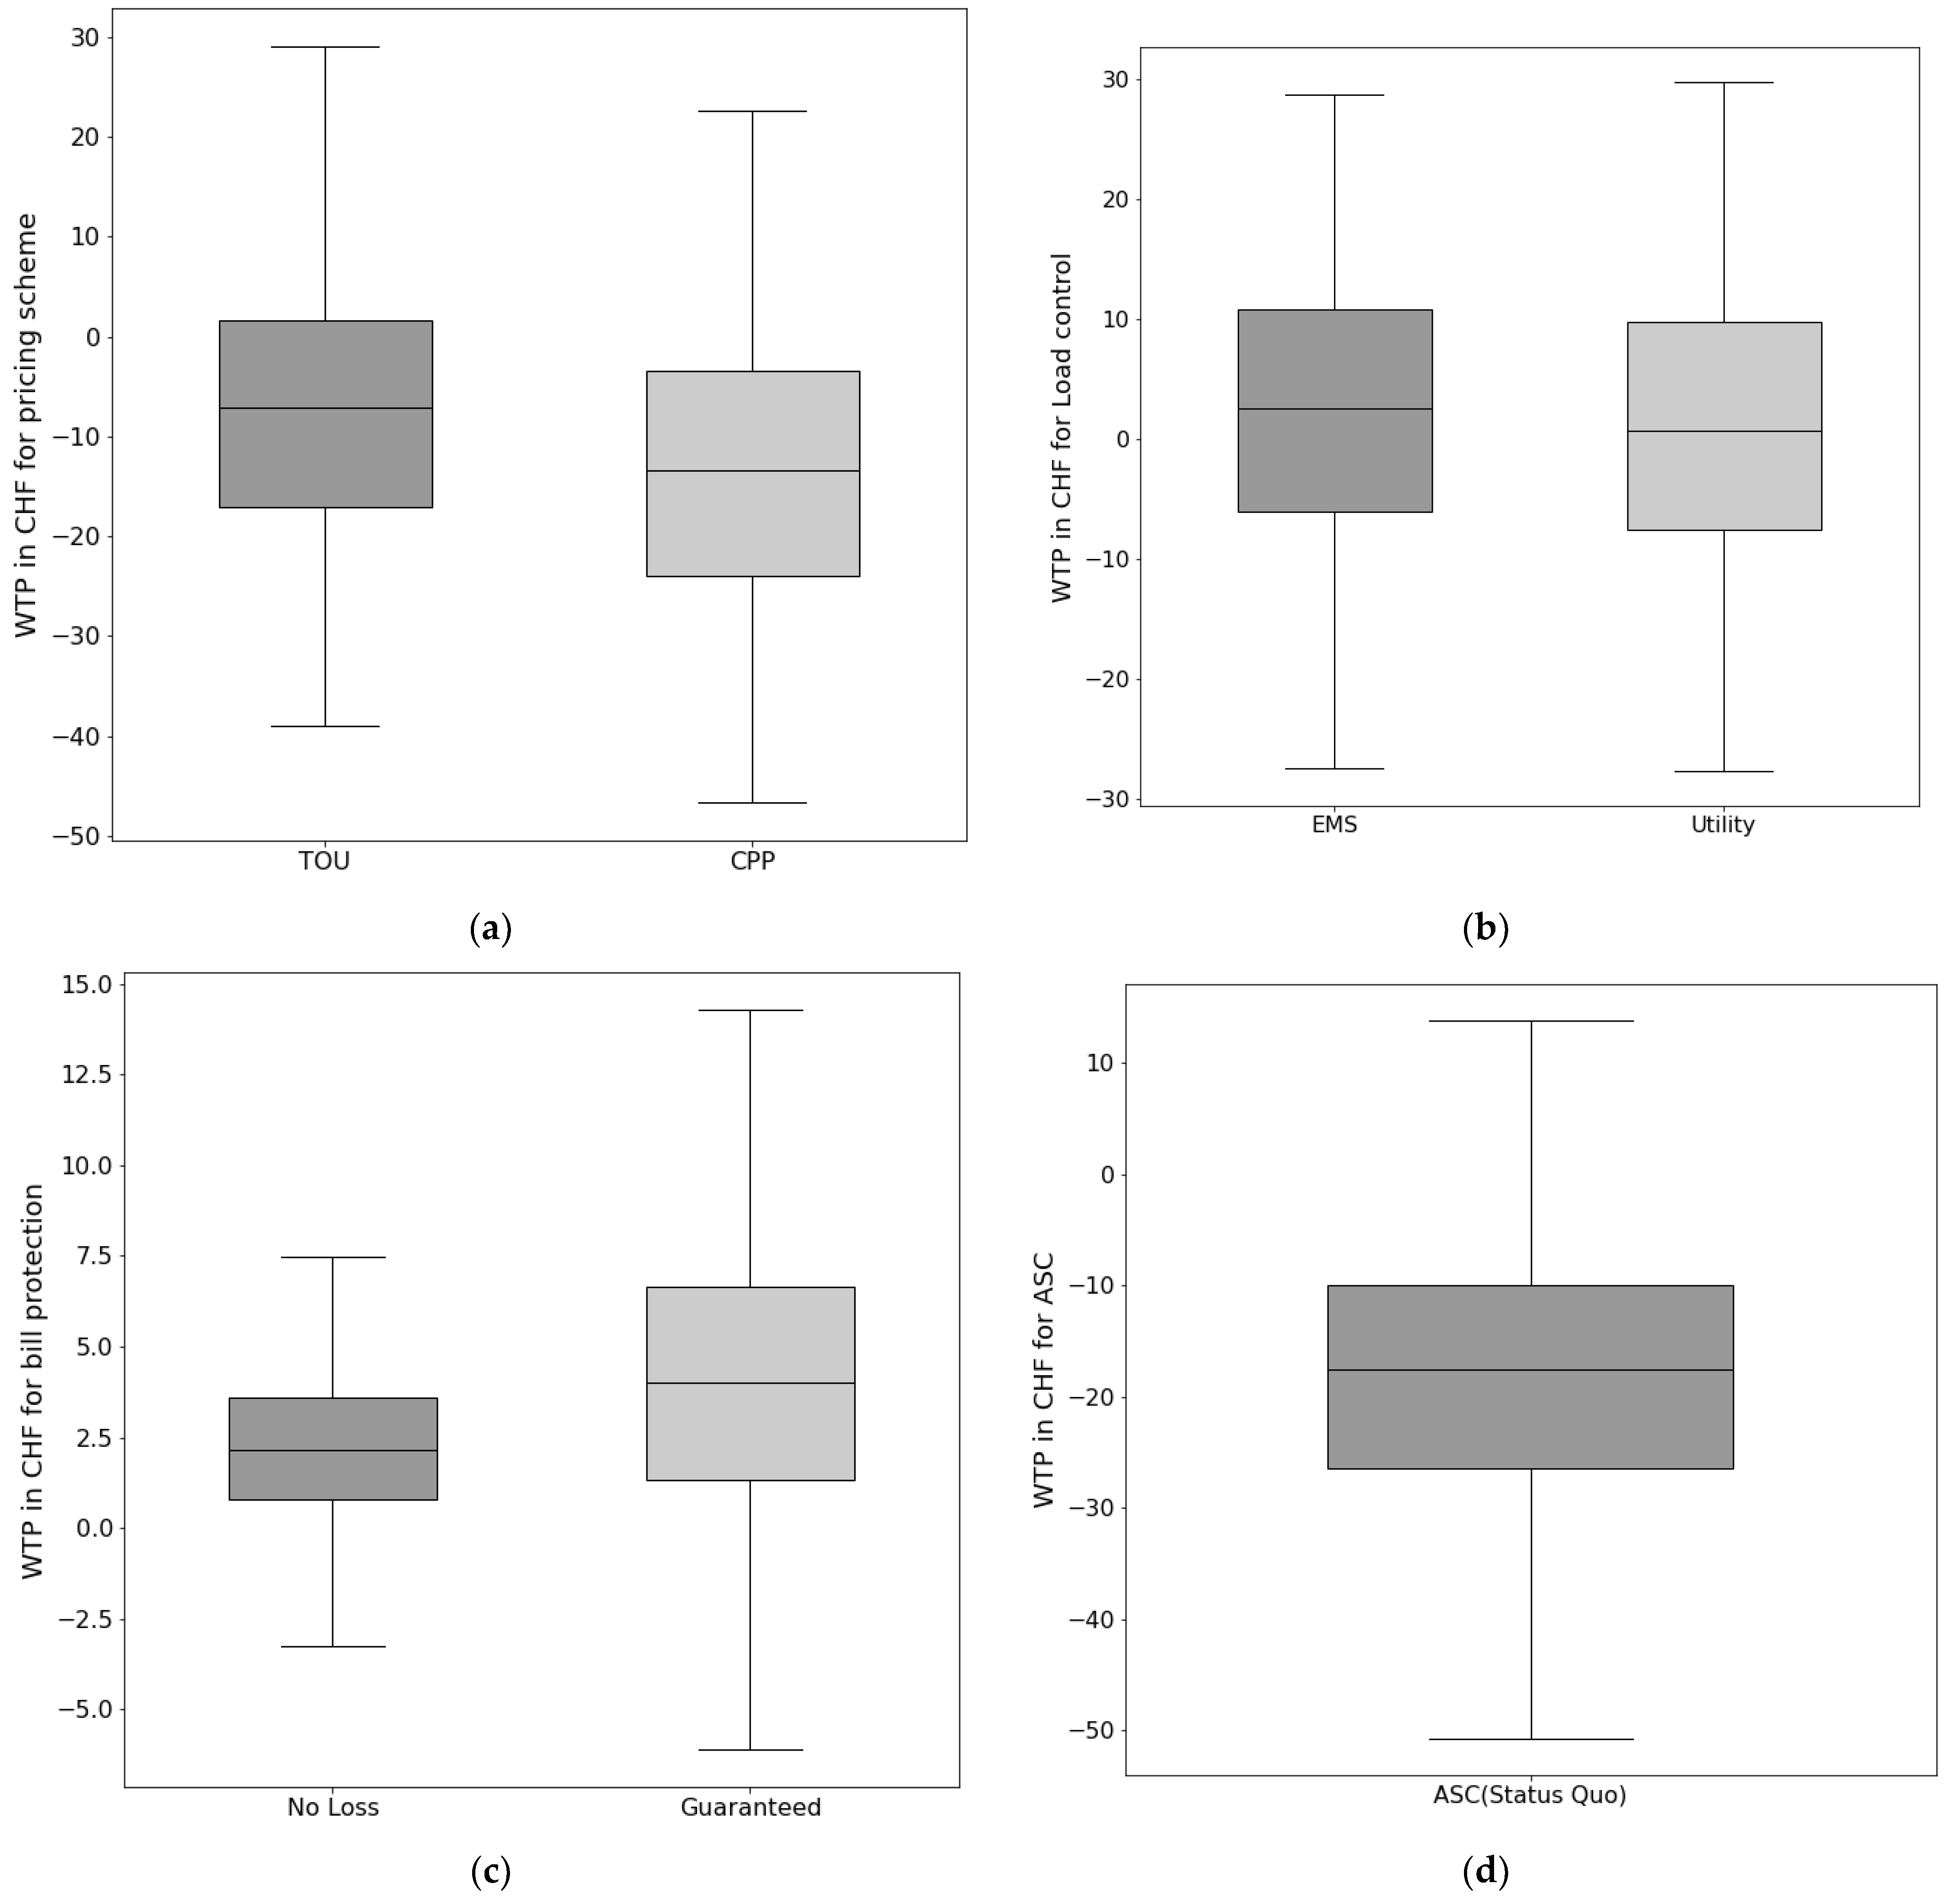
3.2. Preference for DR Tariffs
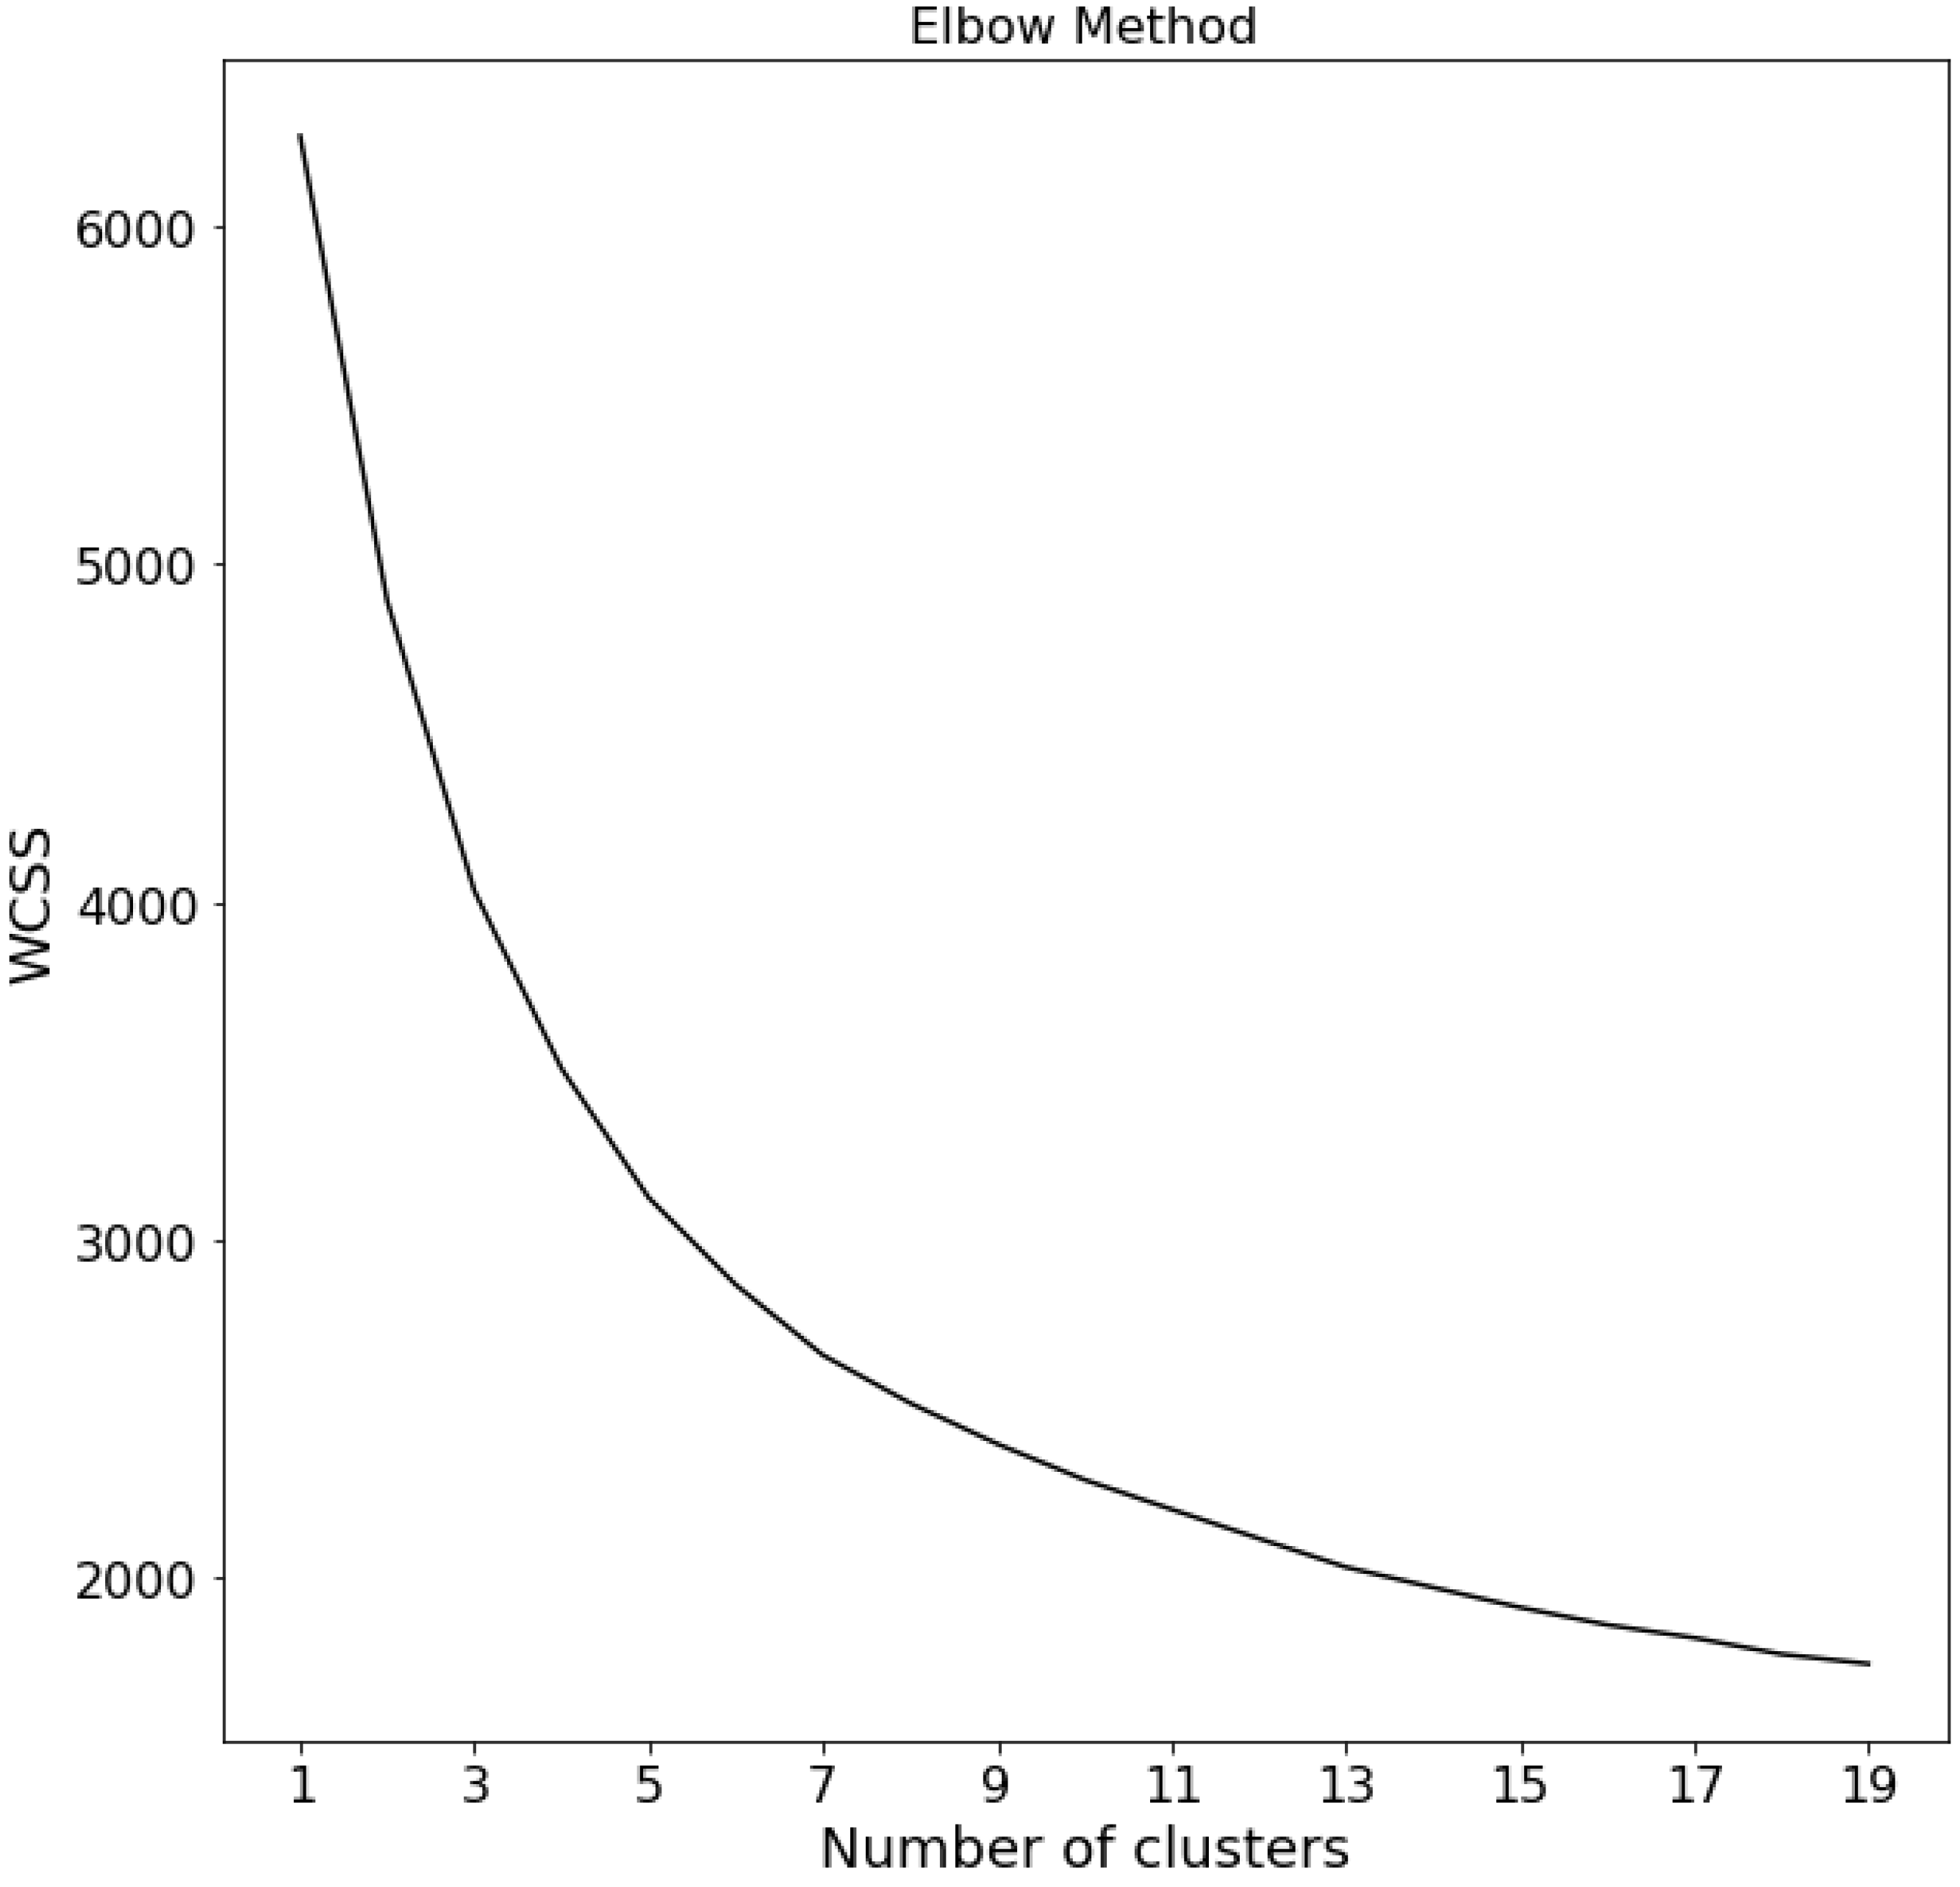
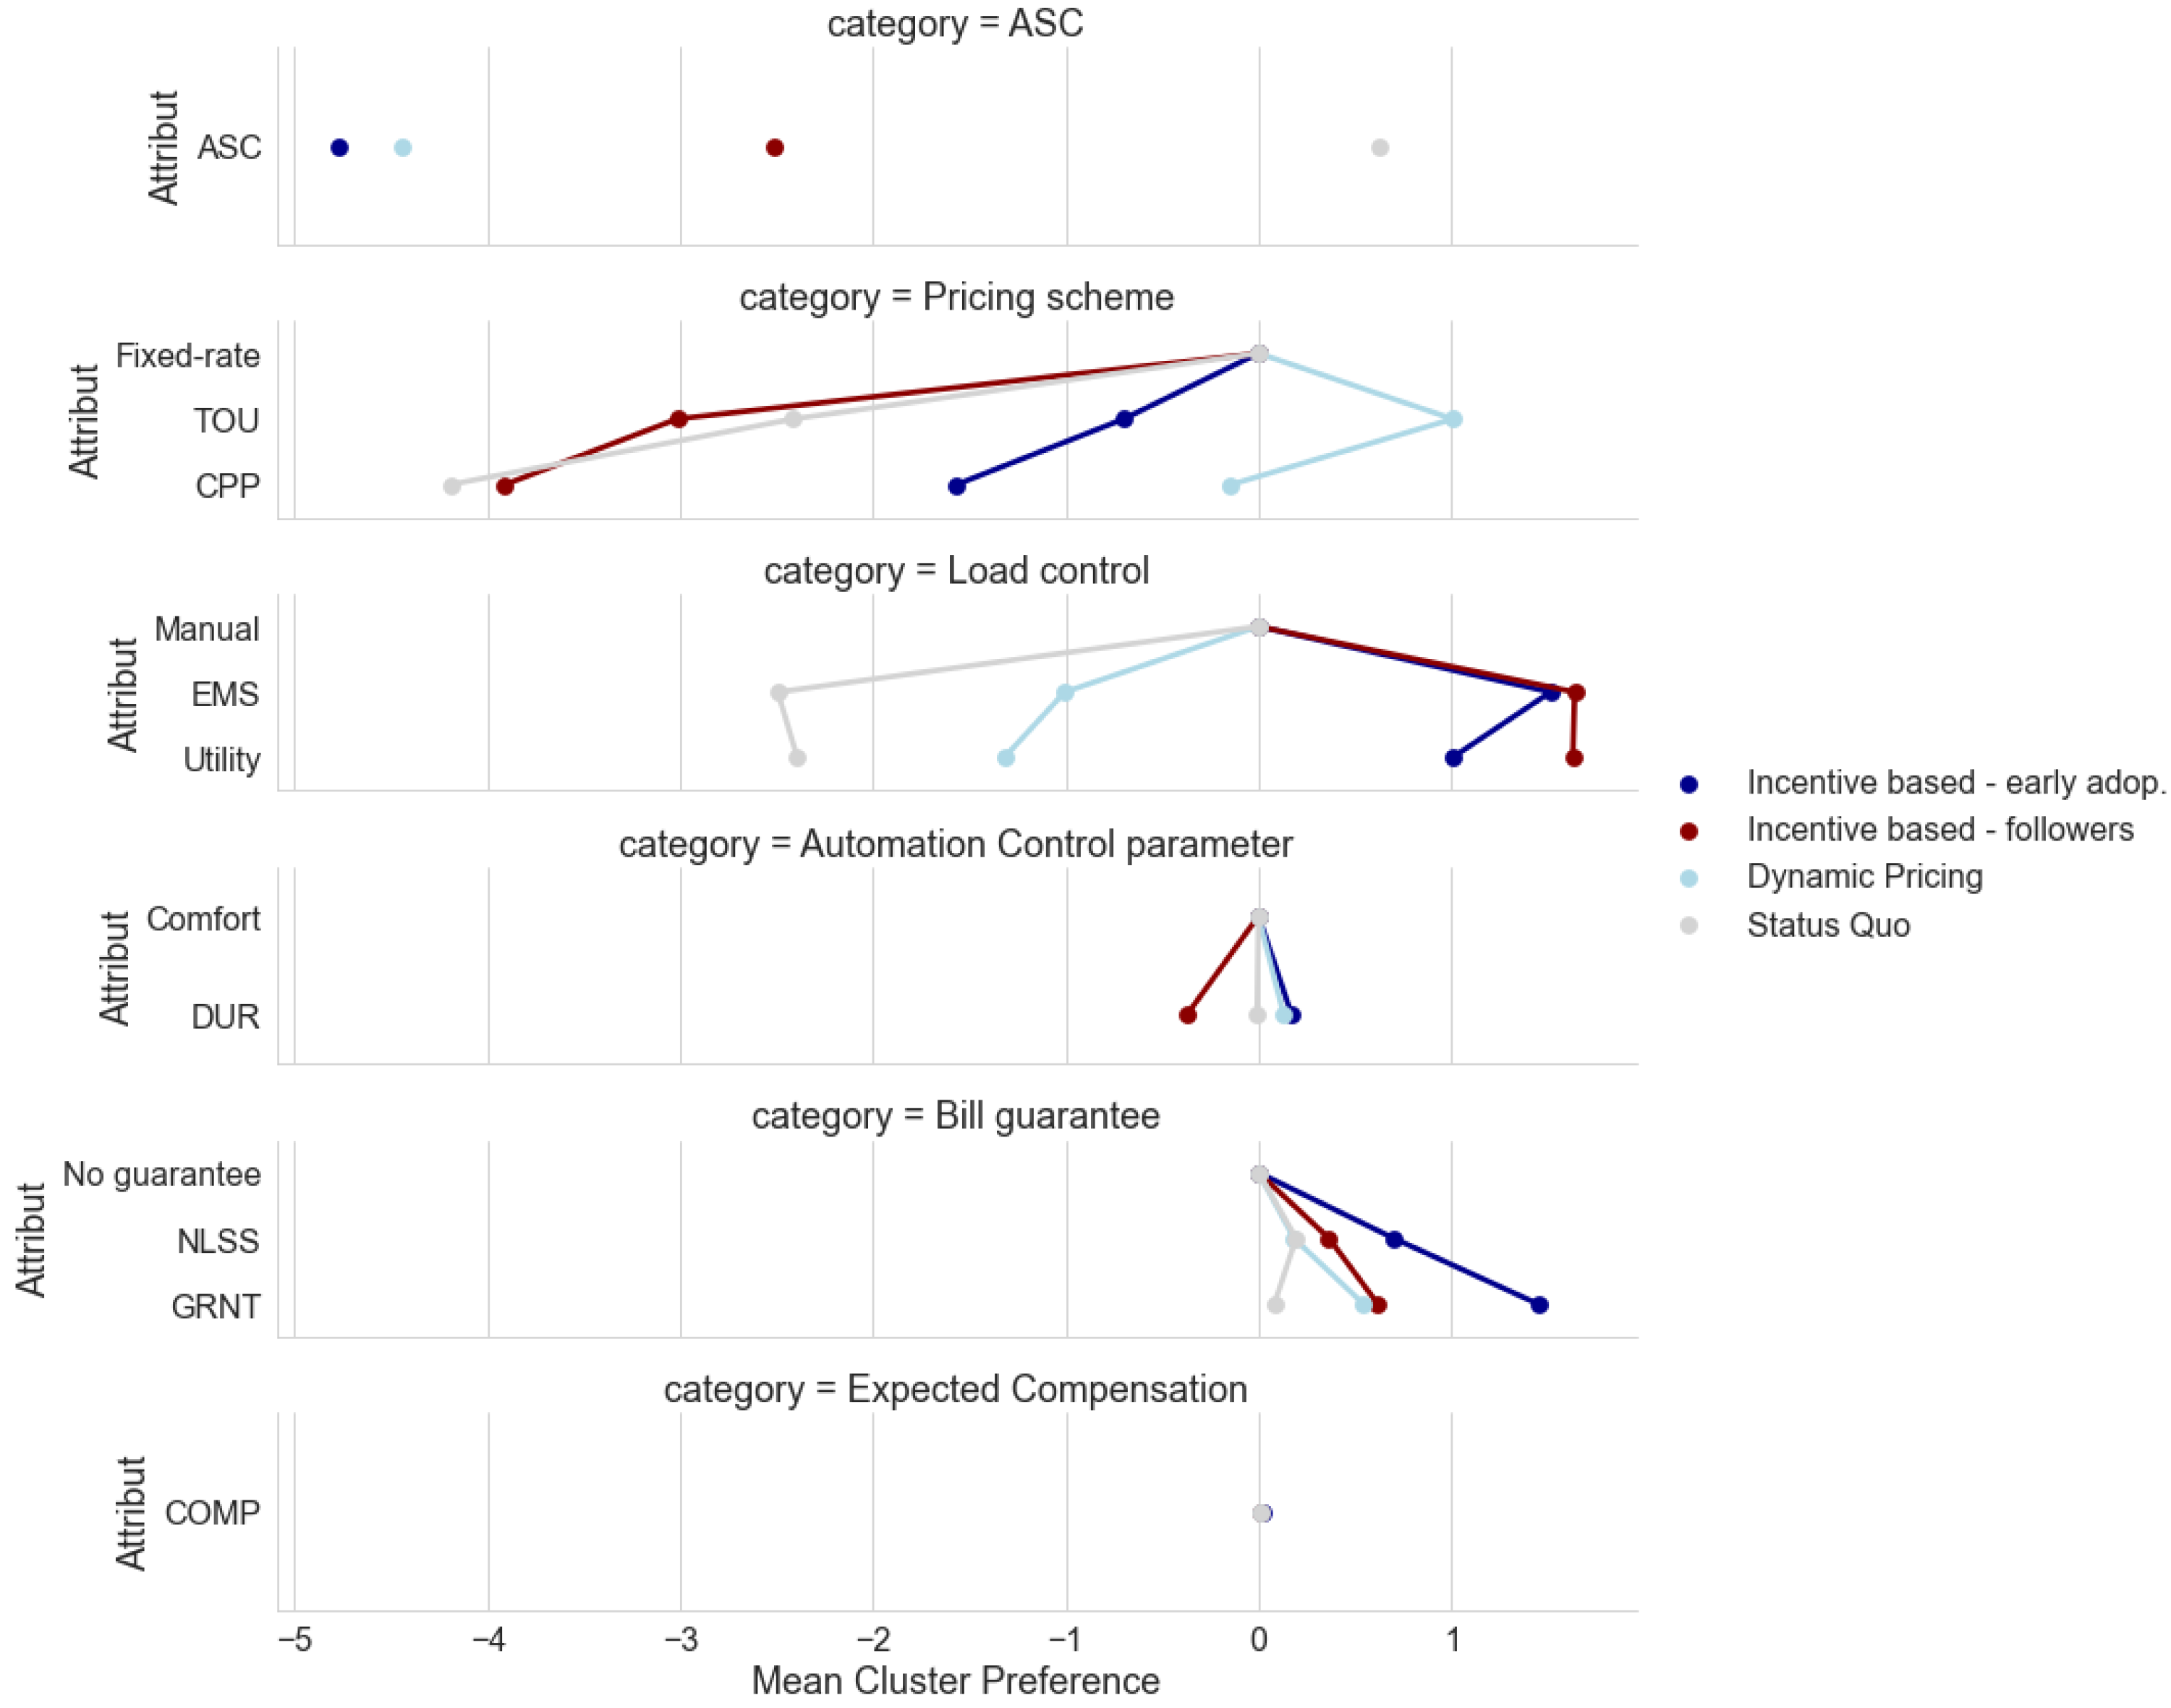
3.3. Heterogeneity of Preferences
3.4. Tariff Adoption
4. Conclusions
Author Contributions
Funding
Institutional Review Board Statement
Conflicts of Interest
Appendix A

| Psychographic Score | Associated Questions (7-Point Likert Scale) | Survey |
|---|---|---|
| Automation seen as concern | The amount of my electricity bill is out of my control. | Current survey |
| Automation seen as concern | I am afraid that automatic control of my household appliances will affect my daily habits and well-being. | Current survey |
| Automation seen as concern | I fear that a malfunction of the automatic control of my household appliances will significantly affect my comfort. | Current survey |
| Automation seen as concern | I fear that automatic control of my appliances will reveal personal information. | Current survey |
| Automation seen as concern | Automatic control of appliances may increase my electricity costs. | Current survey |
| Automation seen as positive | Automatic control of household appliances is helpful in furthering the development of renewable energy. | Current survey |
| Automation seen as positive | It is easy for me to understand new technologies like an energy management system for the automatic control of my household appliances. | Current survey |
| Automation seen as positive | If I allow automatic control of appliances, I will save money because no manual intervention is necessary. | Current survey |
| Automation seen as positive | If I allow automatic control of appliances, I will save money. | Current survey |
| Positive attitude to environment | I feel PROUD when I act in an environmentally friendly manner. | SHEDS |
| Positive attitude to environment | I feel HAPPY when I conserve or avoid wasting natural resources. | SHEDS |
| Positive attitude to environment | I feel GUILTY when I harm the environment. | SHEDS |
| Positive attitude to environment | I feel APPRECIATION towards others when they act in an environmentally friendly manner. | SHEDS |
| Positive attitude to environment | I feel WARM towards others when they conserve or avoid wasting natural resources. | SHEDS |
| Positive attitude to environment | I feel CONTENT when I act in an environmentally friendly manner. | SHEDS |
| Positive attitude to environment | I feel INDIGNANT when others act in an environmentally unfriendly manner. | SHEDS |
| Positive attitude to environment | I feel REGRET when I waste natural resources. | SHEDS |
| Positive attitude to environment | I feel ANGRY when others act in an environmentally unfriendly manner. | SHEDS |
| Positive attitude to environment | I feel ASHAMED when I act in an environmentally unfriendly manner. | SHEDS |
| Positive attitude to environment | I feel DISGUSTED when others waste natural resources. | SHEDS |
| Positive attitude to environment | I feel POSITIVE towards others when they act environmentally friendly. | SHEDS |
| Worried about future of environment | I feel GRATEFUL for our planet and its nature. | SHEDS |
| Worried about future of environment | I feel WORRIED about the future of our nature. | SHEDS |
| Worried about future of environment | I feel AWE for our planet and its nature. | SHEDS |
| Worried about future of environment | I feel ANXIOUS when I think about the future of our planet. | SHEDS |
| Worried about future of environment | I feel SAD about how mankind treats nature. | SHEDS |
| Worried about future of environment | I often feel OVERWHELMED by the beauty of nature. | SHEDS |
| Social expectation to care for environment | I feel morally obliged to support the further development of renewable energies. | Current survey |
| Social expectation to care for environment | My environment expects me to support the further development of renewable energies. | Current survey |
| Social expectation to care for environment | The members in my household expect that I behave in an environmentally friendly manner. | SHEDS |
| Social expectation to care for environment | I believe that most of my acquaintances behave in an environmentally friendly manner whenever it is possible. | SHEDS |
| Social expectation to care for environment | Most of my acquaintances expect that I behave in an environmentally friendly manner. | SHEDS |
| Social expectation to care for environment | I feel personally obliged to behave in an environmentally friendly manner as much as possible. | SHEDS |
| Social expectation to care for environment | In the Swiss society, it is usually expected that one behaves in an environmentally friendly manner. | SHEDS |
| Maximizer vs. Satisficer | No matter how satisfied I am with my work, it is right for me to look for better options. | Current survey |
| Maximizer vs. Satisficer | When I am in the car listening to the radio, I often switch to other stations to check if there is something better on, even if I am relatively happy with what I am listening to. | Current survey |
| Maximizer vs. Satisficer | When I watch TV, I flip through the channels to browse the available options, even while trying to watch a program. | Current survey |
| Maximizer vs. Satisficer | I treat relationships like clothes: I expect to have to try on a lot before I find the perfect fit. | Current survey |
| Maximizer vs. Satisficer | I often find it difficult to buy a gift for a friend. | Current survey |
| 1Maximizer vs. Satisficer | Choosing films is really difficult. I always have trouble choosing the best one. | Current survey |
| Maximizer vs. Satisficer | When shopping, I find it hard to find clothes that I really like. | Current survey |
| Maximizer vs. Satisficer | I am a big fan of lists that try to put things in order (the best films, the best singers, the best sportsmen, the best novels, etc.). | Current survey |
| Maximizer vs. Satisficer | I find that writing is very difficult, even if it is just a letter to a friend, because it is so hard to get things right. I often do several drafts even for simple things. | Current survey |
| Maximizer vs. Satisficer | I never settle for second best. | Current survey |
| Maximizer vs. Satisficer | Whenever I am faced with a choice, I try to imagine what all the other possibilities are, even those that do not exist at the moment. | Current survey |
| Maximizer vs. Satisficer | I often dream of living in a way that is different from my actual life. | Current survey |
| Maximizer vs. Satisficer | No matter what I do, I set the highest standards for myself | Current survey |
| Political orientation | Below you find a scale that goes from left (1) to right (8). When you think about your own political orientation, how would classify yourself on this scale? | SHEDS |
Appendix B
| 1. Flat, Manual | 2. TOU, Manual | 3. TOU, EMS | 4. TOU, DLC | 5. TOU, DLC, Guarantee | 6. Flat, DLC | 7. Flat, DLC, Guarantee | |
|---|---|---|---|---|---|---|---|
| Contract attributes | |||||||
| ASC | 0 | 0 | 0 | 0 | 0 | 0 | 0 |
| TOU | 0 | 1 | 1 | 1 | 1 | 0 | 0 |
| CPP | 0 | 0 | 0 | 0 | 0 | 0 | 0 |
| EMS | 0 | 0 | 1 | 0 | 0 | 0 | 0 |
| Utility | 0 | 0 | 0 | 1 | 1 | 1 | 1 |
| DUR | 0 | 0 | 0 | 0 | 0 | 0 | 0 |
| NLSS | 0 | 0 | 0 | 0 | 0 | 0 | 1 |
| GRNT | 0 | 0 | 0 | 0 | 1 | 0 | 0 |
| COMP | 0 | 0 | 0 | 0 | 0 | 0 | 0 |
| Utility | |||||||
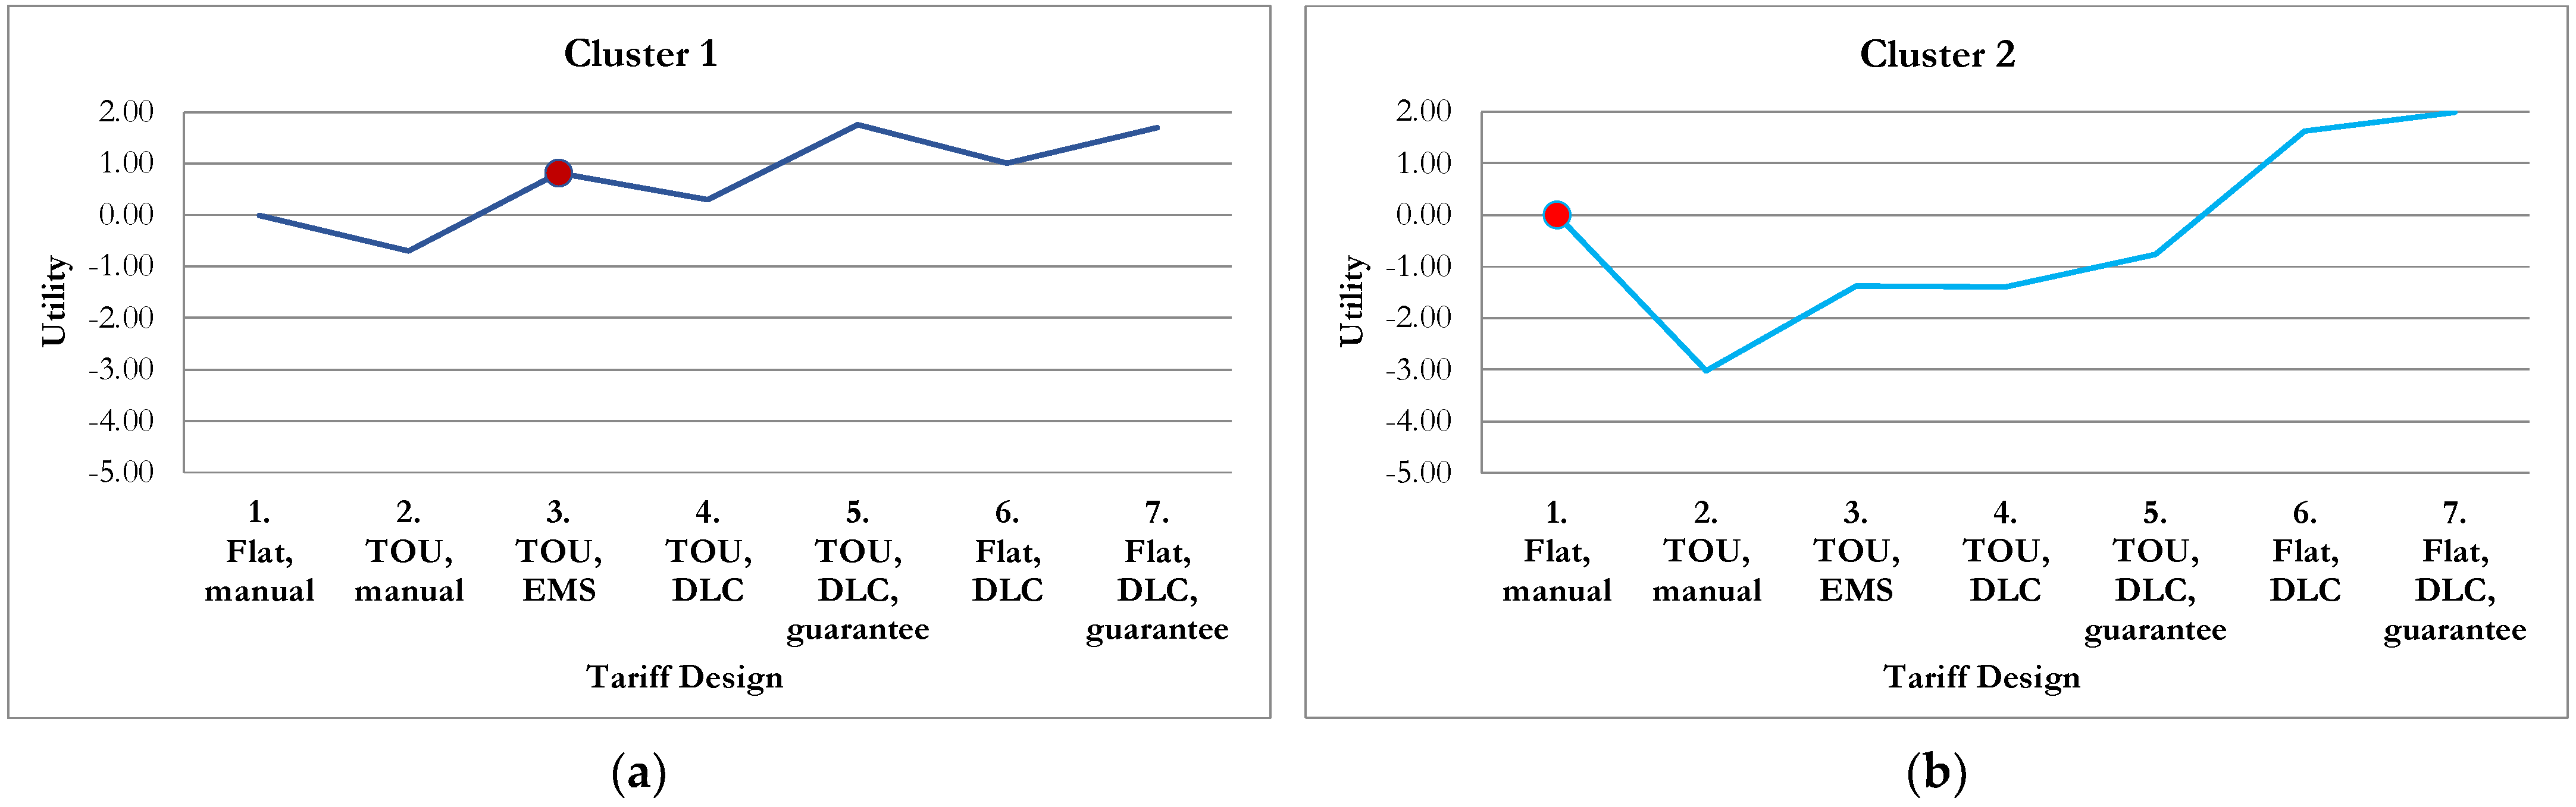
| Cluster 1 | 0.00 | −0.70 | 0.81 | 0.30 | 1.75 | 1.00 | 1.70 |
| Cluster 2 | 0.00 | −3.02 | −1.38 | −1.39 | −0.77 | 1.63 | 2.00 |
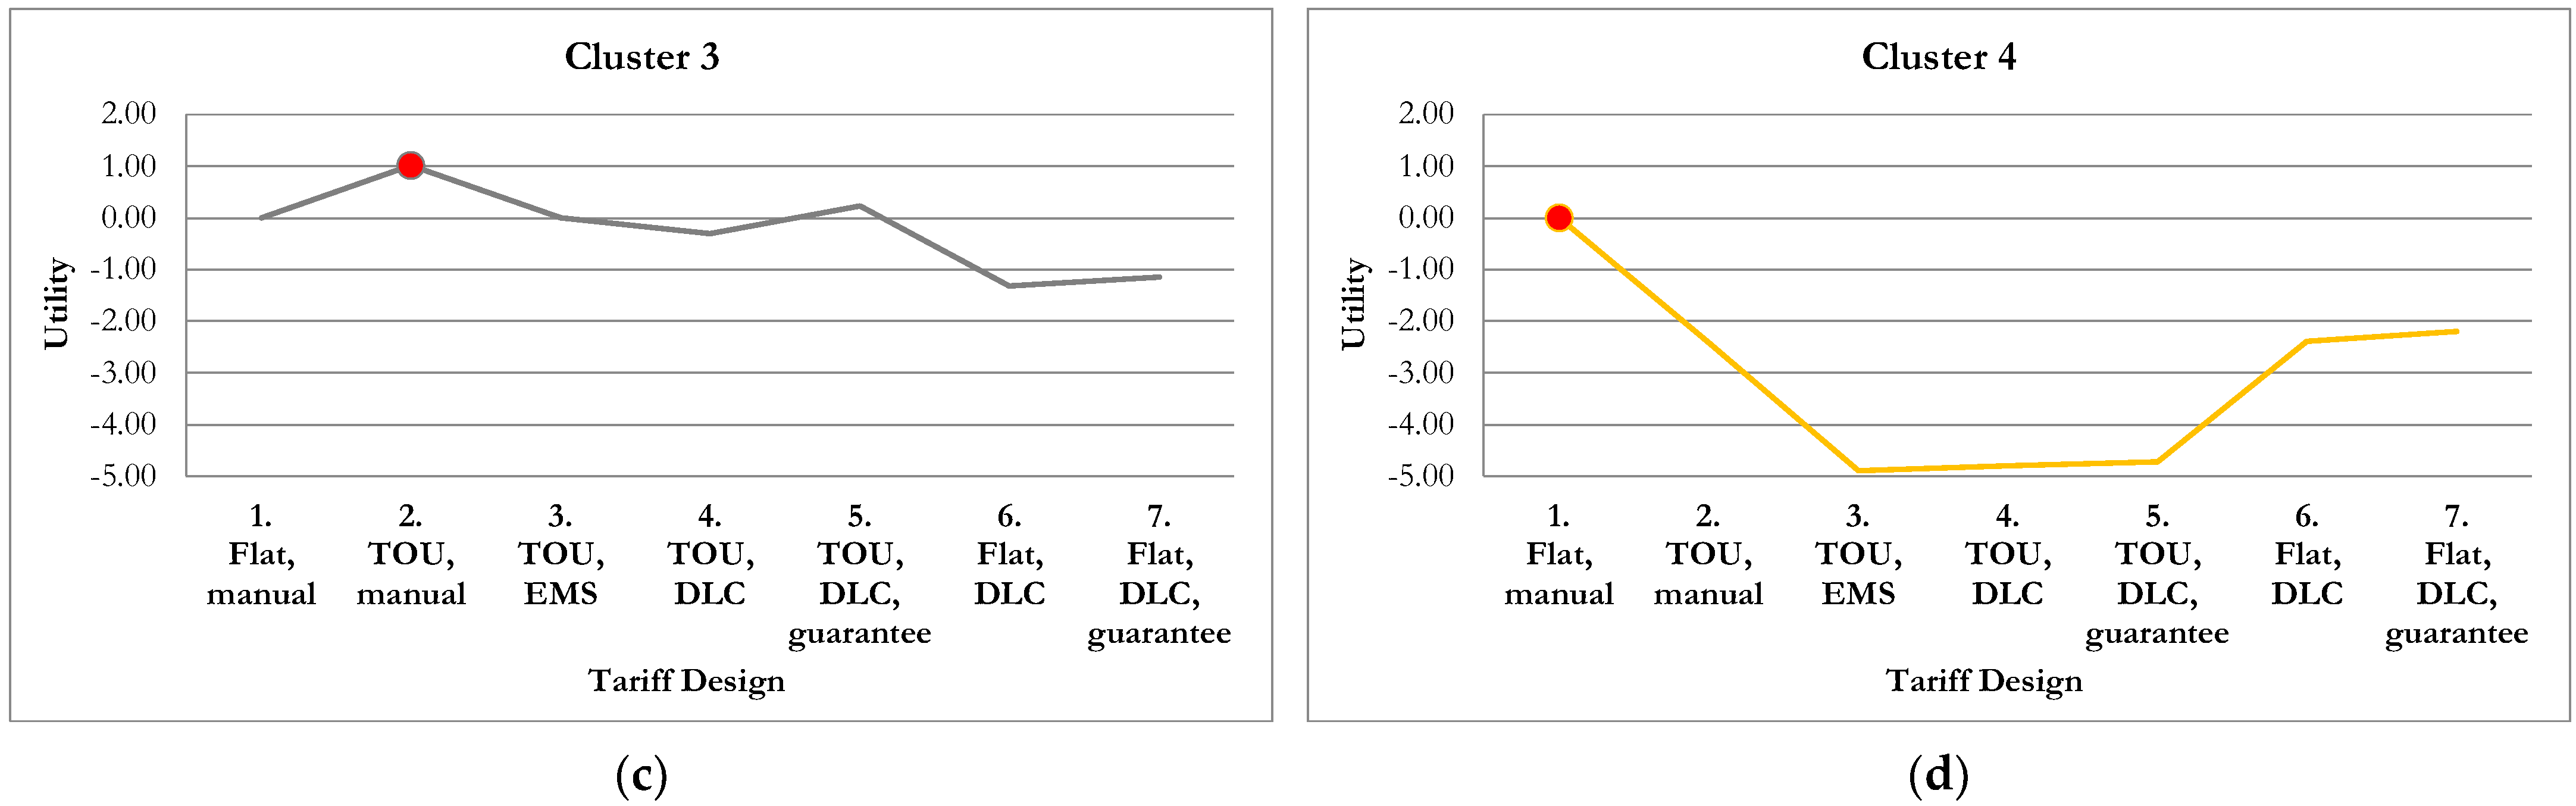
| Cluster 3 | 0.00 | 1.01 | 0.01 | −0.31 | 0.23 | −1.32 | −1.14 |
| Cluster 4 | 0.00 | −2.41 | −4.90 | −4.80 | −4.72 | −2.39 | −2.20 |
References
- Bertoldi, P. Policies for energy conservation and sufficiency: Review of existing policies and recommendations for new and effective policies in OECD countries. Energy Build. 2022, 264, 112075. [Google Scholar] [CrossRef]
- BFE. Studie «Potential Demand Side Management in der Schweiz»; BET: Zofingen, Switzerland, 2019. [Google Scholar]
- Li, P.-H.; Pye, S. Assessing the benefits of demand-side flexibility in residential and transport sectors from an integrated energy systems perspective. Appl. Energy 2018, 228, 965–979. [Google Scholar] [CrossRef]
- Parrish, B.; Gross, R.; Heptonstall, P. On demand: Can demand response live up to expectations in managing electricity systems? Energy Res. Soc. Sci. 2019, 51, 107–118. [Google Scholar] [CrossRef]
- Harold, J.; Bertsch, V.; Fell, H. Consumer Preferences for End-Use Specific Curtailable Electricity Contracts on Household Appliances during Peak Load Hours; ESRI Working Paper No. 632; The Economic and Social Research Institute (ESRI): Dublin, Ireland, 2019. [Google Scholar]
- Matisoff, D.C.; Beppler, R.; Chan, G.; Carley, S. A review of barriers in implementing dynamic electricity pricing to achieve cost-causality. Environ. Res. Lett. 2020, 15, 093006. [Google Scholar] [CrossRef]
- Fell, M.J.; Shipworth, D.; Huebner, G.M.; Elwell, C.A. Public acceptability of domestic demand-side response in Great Britain: The role of automation and direct load control. Energy Res. Soc. Sci. 2015, 9, 72–84. [Google Scholar] [CrossRef]
- Eid, C.; Koliou, E.; Valles, M.; Reneses, J.; Hakvoort, R. Time-based pricing and electricity demand response: Existing barriers and next steps. Util. Policy 2016, 40, 15–25. [Google Scholar] [CrossRef]
- Winzer, C.; Ludwig, P. Optimal Design of Dynamic Grid Tariffs; SSRN Scholarly Paper 4130379; Social Science Research Network: Rochester, NY, USA, 2022; Available online: https://papers.ssrn.com/abstract=4130379 (accessed on 7 June 2022).
- Stenner, K.; Frederiks, E.R.; Hobman, E.V.; Cook, S. Willingness to participate in direct load control: The role of consumer distrust. Appl. Energy 2017, 189, 76–88. [Google Scholar] [CrossRef]
- Johnston, R.J.; Boyle, K.J.; Adamowicz, W.; Bennett, J.; Brouwer, R.; Cameron, T.A.; Hanemann, W.M.; Hanley, N.; Ryan, M.; Scarpa, R.; et al. Contemporary Guidance for Stated Preference Studies. J. Assoc. Environ. Resour. Econ. 2017, 4, 319–405. [Google Scholar] [CrossRef]
- Jordehi, A.R. Optimisation of demand response in electric power systems, a review. Renew. Sustain. Energy Rev. 2019, 103, 308–319. [Google Scholar] [CrossRef]
- Parrish, B.; Heptonstall, P.; Gross, R.; Sovacool, B.K. A systematic review of motivations, enablers and barriers for consumer engagement with residential demand response. Energy Policy 2020, 138, 111221. [Google Scholar] [CrossRef]
- Faruqui, A.; Sergici, S.; Warner, C. Arcturus 2.0: A meta-analysis of time-varying rates for electricity. Electr. J. 2017, 30, 64–72. [Google Scholar] [CrossRef]
- Faruqui, A.; Sergici, S. Household response to dynamic pricing of electricity: A survey of 15 experiments. J. Regul. Econ. 2010, 38, 193–225. [Google Scholar] [CrossRef]
- Dütschke, E.; Paetz, A.-G. Dynamic electricity pricing—Which programs do consumers prefer? Energy Policy 2013, 59, 226–234. [Google Scholar] [CrossRef]
- Dutta, G.; Mitra, K. A literature review on dynamic pricing of electricity. J. Oper. Res. Soc. 2017, 68, 1131–1145. [Google Scholar] [CrossRef]
- Kessels, K.; Kraan, C.; Karg, L.; Maggiore, S.; Valkering, P.; Laes, E. Fostering Residential Demand Response through Dynamic Pricing Schemes: A Behavioural Review of Smart Grid Pilots in Europe. Sustainability 2016, 8, 929. [Google Scholar] [CrossRef]
- Nicolson, M.; Huebner, G.; Shipworth, D. Are consumers willing to switch to smart time of use electricity tariffs? The importance of loss-aversion and electric vehicle ownership. Energy Res. Soc. Sci. 2017, 23, 82–96. [Google Scholar] [CrossRef]
- Nicolson, M.L.; Fell, M.J.; Huebner, G.M. Consumer demand for time of use electricity tariffs: A systematized review of the empirical evidence. Renew. Sustain. Energy Rev. 2018, 97, 276–289. [Google Scholar] [CrossRef]
- Stenner, K.; Frederiks, E.; Hobman, E.V.; Meikle, S. Australian Consumers’ Likely Response to Cost-Reflective Electricity Pricing; CSIRO: Brisbane, Australia, 2015; p. 82. [Google Scholar]
- Stromback, J.; Dromacque, C.; Yassin, M.H.; Global Energy Think Tank; Vaasa, E.T.T. The potential of smart meter enabled programs to increase energy and systems efficiency: A mass pilot comparison Short name: Empower Demand. Vaasa ETT. 2011. Available online: http://esmig.eu/sites/default/files/empower-demand-report.pdf (accessed on 1 June 2022).
- Bushnell, J.; Hobbs, B.F.; Wolak, F.A. When It Comes to Demand Response, Is FERC Its Own Worst Enemy? Electr. J. 2009, 22, 9–18. [Google Scholar] [CrossRef]
- Chao, H. Demand response in wholesale electricity markets: The choice of customer baseline. J. Regul. Econ. 2011, 39, 68–88. [Google Scholar] [CrossRef]
- Yilmaz, S.; Xu, X.; Cabrera, D.; Chanez, C.; Cuony, P.; Patel, M.K. Analysis of demand-side response preferences regarding electricity tariffs and direct load control: Key findings from a Swiss survey. Energy 2020, 212, 118712. [Google Scholar] [CrossRef]
- Yilmaz, S.; Cuony, P.; Chanez, C. Prioritize your heat pump or electric vehicle? Analysing design preferences for Direct Load Control programmes in Swiss households. Energy Res. Soc. Sci. 2021, 82, 102319. [Google Scholar] [CrossRef]
- Yilmaz, S.; Chanez, C.; Cuony, P.; Patel, M.K. Analysing utility-based direct load control programmes for heat pumps and electric vehicles considering customer segmentation. Energy Policy 2022, 164, 112900. [Google Scholar] [CrossRef]
- Curtis, J.; Grilli, G.; Brazil, W.; Harold, J. Why do preferences for electricity services differ? Domestic appliance curtailment contracts in Ireland. Energy Res. Soc. Sci. 2020, 69, 101705. [Google Scholar] [CrossRef]
- Sullivan, M.; Schellenberg, J.; Blundell, M. Updated Value of Service Reliability Estimates for Electric Utility Customers in the United States; Berkeley Lab: Los Angeles, CA, USA, 2015.
- Richter, L.-L.; Pollitt, M.G. Which smart electricity service contracts will consumers accept? The demand for compensation in a platform market. Energy Econ. 2018, 72, 436–450. [Google Scholar] [CrossRef]
- Wiekens, C.; Grootel, M.; Steinmeijer, S. Experiences and Behaviors of End-Users in a Smart Grid: The Influence of Values, Attitudes, Trust, and Several Types of Demand Side Management; Hanzehogeschool Groningen: Groningen, The Netherlands, 2014. [Google Scholar]
- Kubli, M.; Loock, M.; Wüstenhagen, R. The flexible prosumer: Measuring the willingness to co-create distributed flexibility. Energy Policy 2018, 114, 540–548. [Google Scholar] [CrossRef]
- Weber, S.; Burger, P.; Farsi, M.; Martinez-Cruz, A.L.; Puntiroli, M.; Schubert, I.; Volland, B. Swiss Household Energy Demand Survey (SHEDS): Objectives, Design, and Implementation; IRENE Working Paper; University of Neuchâtel, Institute of Economic Research (IRENE): Neuchâtel, Switzerland, 2017. [Google Scholar]
- Hensher, D.A. Hypothetical bias, choice experiments and willingness to pay. Transp. Res. Part B Methodol. 2009, 44, 735–752. [Google Scholar] [CrossRef]
- Morrissey, K.; Plater, A.; Dean, M. The cost of electric power outages in the residential sector: A willingness to pay approach. Appl. Energy 2018, 212, 141–150. [Google Scholar] [CrossRef]
- Sawtooth Software, Inc. The CBC System for Choice-Based Conjoint Analysis; Sawtooth Software, Inc.: Provo, UT, USA, 2017. [Google Scholar]
- Reed Johnson, F.; Lancsar, E.; Marshall, D.; Kilambi, V.; Mühlbacher, A.; Regier, D.A.; Bresnahan, B.W.; Kanninen, B.; Bridges, J.F. Constructing Experimental Designs for Discrete-Choice Experiments: Report of the ISPOR Conjoint Analysis Experimental Design Good Research Practices Task Force. Value Health 2013, 16, 3–13. [Google Scholar] [CrossRef]
- Train, K. Discrete Choice Methods With Simulation; Cambridge University Press: Cambridge, UK, 2009. [Google Scholar] [CrossRef]
- Broberg, T.; Persson, L. Is our everyday comfort for sale? Preferences for demand management on the electricity market. Energy Econ. 2016, 54, 24–32. [Google Scholar] [CrossRef] [Green Version]
- Hole, A.R. Fitting Mixed Logit Models by Using Maximum Simulated Likelihood. Stata J. 2007, 7, 388–401. [Google Scholar] [CrossRef] [Green Version]
- Revelt, D.; Train, K. Customer-Specific Taste Parameters and Mixed Logit: Households’ Choice of Electricity Supplier. Department of Economics, Institute for Business and Economic Research, UC Berkeley, Department of Economics, Working Paper Series, May 2000. Available online: https://econpapers.repec.org/paper/cdleconwp/qt1900p96t.htm (accessed on 21 April 2021).
- Bundesamt Für Statistik Schweiz. Population Statistic 2019. Available online: https://www.bfs.admin.ch/bfs/de/home/statistiken/bevoelkerung/stand-entwicklung/alter-zivilstand-staatsangehoerigkeit.assetdetail.13707177.html (accessed on 20 April 2021).
- Bundesamt Für Statistik Schweiz. Housing Conditions 2019. Available online: https://www.bfs.admin.ch/bfs/en/home/statistics/construction-housing/dwellings/housing-conditions.html (accessed on 20 April 2021).
- Bundesamt Für Statistik Schweiz. Poverty and Living Conditions in 2017. Available online: https://www.bfs.admin.ch/bfs/en/home/statistics/economic-social-situation-population/economic-and-social-situation-of-the-population/inqualities-income-ditribution/income-distribution.assetdetail.8986973.html (accessed on 20 March 2021).
- Bundesamt Für Statistik Schweiz. Highest Completed Level of Education in 2019. Available online: https://www.bfs.admin.ch/bfs/de/home/statistiken/bildung-wissenschaft/bildungsstand.assetdetail.15404053.html (accessed on 20 April 2021).
- Bundesamt Für Statistik Schweiz. Statistics on Energy Agents in Residential Buildings 2017. Available online: https://www.bfs.admin.ch/bfs/en/home/statistics/construction-housing/buildings/energy-field.assetdetail.3982424.html (accessed on 20 April 2021).
- Swiss Household Energy Demand Survey (SHEDS). Available online: https://www.sccer-crest.ch/research/swiss-household-energy-demand-survey-sheds/ (accessed on 20 April 2021).
- Wood, Z. Energy Bills: Why Are so Many Smart Meters in Britain Turning ‘Dumb’? 2022. Available online: https://www.theguardian.com/money/2022/jun/04/why-are-so-many-smart-meters-turning-dumb-great-britain (accessed on 14 July 2022).

| Attributes | Levels | Description |
|---|---|---|
| Pricing scheme | Fixed rate, TOU, CPP | The timing and frequency of peak periods and the electricity price during these occasions. |
| Load control | Manual, Automated by EMS, Remote control by utility | Describes whether the electricity consumption is adjusted manually, automatically by an energy management system (EMS), or remotely by the utility |
| Automation control parameters | Comfort level, frequency and duration | Defines the control specifications according to which the automation/remote control works. |
| Bill guarantee | No guarantee, no loss, guaranteed | Defines whether the reduction in the yearly electricity bill is guaranteed. Without adequately changing electricity consumption to the pricing scheme, an increase in the yearly electricity bill is possible. |
| Expected savings (per year) | 50 CHF, 100 CHF, 150 CHF, 200 CHF | On average, switching to the tariff and adjusting electricity consumption will lead to the following annual savings. |
| Which Tariff Would You Choose? | ||||
|---|---|---|---|---|
| Attribute | Tariff A | Tariff B | Tariff C | Current Contract |
| Electricity price | 19 Rp./kWh | PH: 30 Rp./kWh OPH: 18 Rp. kWh | PH: 60 Rp./kWh OPH: 18 Rp. kWh | |
| Peak hours | Never | Monday-Friday 16:00–20:00 | 50 days a year 16:00–20:00 | |
| Load control | Remote Control by utility | Manual | Automated by EMS | |
| Automation Control parameters | Frequency and Duration | - | Comfort Level | |
| Bill guarantee | Guaranteed | No guarantee | No loss | |
| Expected savings | 100 CHF | 50 CHF | 150 CHF | |
| Variable | Name | Type |
|---|---|---|
| Pricing scheme | ||
| Fixed-rate | Base level | Base level |
| TOU | TOU | Dummy-coded |
| CPP | CPP | Dummy-coded |
| Load control | ||
| Manual | Base-level | Base-level |
| Remote Control by utility | Utility | Dummy-coded |
| Automated by EMS | EMS | Dummy-coded |
| Automation Control parameters | ||
| Comfort level | Base-level | Base-level |
| Frequency and Duration | DUR | Dummy-coded |
| Bill guarantee | ||
| No guarantee | Base-level | Base-level |
| No Loss | NLSS | Dummy-coded |
| Guaranteed | GRNT | Dummy-coded |
| Expected Savings | ||
| Compensation | COMP | Continuous |
| Status quo | ASC | Dummy-coded |
| Survey Respondents | Swiss Population | |
|---|---|---|
| Socio-demographic characteristics | ||
| Age (years) [42] | 49.4 | 49.3 |
| Household size [43] | 2.3 | 2.2 |
| Gender [42] | ||
| Male | 49.3% | 49.6% |
| Female | 50.7% | 50.4% |
| Household income (gross CHF/month) [44] | ||
| <3000 | 5.4% | 7.1% |
| 3000 to 4500 | 9.5% | 10.1% |
| 4501 to 6000 | 19.1% | 12.2% |
| 6001 to 9000 | 27.7% | 25.0% |
| 9001 to 12,000 | 22.1% | 19.9% |
| >12,000 | 16.0% | 22.3% |
| Education [45] | ||
| Tertiary Education | 47.0% | 35.6% |
| Secondary Education | 52.0% | 45.4% |
| Compulsory Education | 1.0% | 19.0% |
| Living Environment [42] | ||
| Urban areas | 49.9% | 63.0% |
| Agglomeration | 28.1% | 21.8% |
| Rural areas | 21.9% | 15.2% |
| Dwelling type | ||
| Apartment building | 57.7% | NA |
| Terraced house | 16.2% | NA |
| detached or semi-detached house | 26.0% | NA |
| Tenure [43] | ||
| Owned | 28.9% | 36.3% |
| Rented | 68.3% | 60.3% |
| Other | 2.8% | 3.3% |
| Device Ownership | ||
| Heat pump [46] | 16.5% | 17.9% |
| Electric vehicle [47] | 5.0% | 0.7% |
| CL | MXL | MXL-C | |||||||
|---|---|---|---|---|---|---|---|---|---|
| Mean | Coeff. | Std.Err. | WTA | Coeff. | Std.Err. | WTA | Coeff. | Std.Err. | WTA |
| ASC | −0.541 *** | −0.12 | −108.20 *** | −3.896 *** | −0.44 | −308.80 | −3.125 *** | −0.36 | −209.73 |
| TOU | −0.540 *** | −0.06 | −108.00 *** | −1.364 *** | −0.14 | −108.09 | −1.199 *** | −0.15 | −80.48 |
| CPP | −1.079 *** | −0.07 | −215.80 *** | −2.566 *** | −0.17 | −203.35 | −2.355 *** | −0.17 | −158.05 |
| EMS | −0.007 | −0.07 | −1.40 | −0.266 * | −0.12 | −21.09 | 0.263 | −0.17 | 17.67 |
| Utility | −0.112 | −0.07 | −22.40 | −0.428 *** | −0.11 | −33.95 | 0.054 | −0.16 | 3.64 |
| DUR | −0.033 | −0.03 | −6.60 | −0.135 | −0.07 | −10.73 | −0.029 | −0.08 | −1.95 |
| NLSS | 0.174 *** | −0.04 | 34.80 *** | 0.258 *** | −0.07 | 20.44 | 0.362 *** | −0.08 | 24.31 |
| GRNT | 0.406 *** | −0.05 | 81.20 *** | 0.665 *** | −0.1 | 52.69 | 0.679 *** | −0.11 | 45.61 |
| COMP | 0.005 *** | 0 | 0.013 *** | 0 | 0.015 *** | 0 | |||
| Std.Dev. | Coeff. | Std.Err. | Coeff. | Std.Err. | |||||
| ASC | 4.857 *** | −0.46 | 2.938 *** | 0.41 | |||||
| TOU | 2.462 *** | −0.14 | 2.707 *** | 0.21 | |||||
| CPP | 2.646 *** | −0.17 | 2.697 *** | 0.19 | |||||
| EMS | 1.340 *** | −0.12 | 2.425 *** | 0.19 | |||||
| Utility | 1.198 *** | −0.11 | 2.44 *** | 0.19 | |||||
| DUR | 0.752 *** | −0.12 | 0.687 *** | 0.15 | |||||
| NLSS | −0.418 ** | −0.14 | 0.642 *** | 0.16 | |||||
| GRNT | 1.427 *** | −0.11 | 1.167 *** | 0.15 | |||||
| COMP | 0.021 *** | 0 | 0.029 *** | 0 | |||||
| Observations | 19,488 | 19,488 | 19,488 | ||||||
| N | 696 | 696 | 696 | ||||||
| ll | −6025.735 | −4590.92 | −4390.71 | ||||||
| aic | 12,069.47 | 9217.839 | 8889.41 | ||||||
| bic | 12,140.368 | 9359.635 | 9314.798 | ||||||
| chi2 | 565.718 | 2869.631 | 3270.061 | ||||||
| Cluster 1 | Cluster 2 | Cluster 3 | Cluster 4 | |
|---|---|---|---|---|
| Cluster Name | Incentive Based—Early Adopters | Incentive Based—Followers | Dynamic Pricing | Status Quo |
| N | 167 | 229 | 194 | 106 |
| ASC | −4.77 | −2.52 | −4.44 | 0.62 |
| TOU | −0.70 | −3.02 | 1.01 | −2.41 |
| CPP | −1.57 | −3.91 | −0.14 | −4.19 |
| EMS | 1.51 | 1.64 | −1.00 | −2.49 |
| Utility | 1.00 | 1.63 | −1.32 | −2.39 |
| DUR | 0.17 | −0.37 | 0.13 | −0.01 |
| NLSS | 0.70 | 0.37 | 0.18 | 0.19 |
| GRNT | 1.45 | 0.62 | 0.54 | 0.08 |
| COMP | 0.03 | 0.01 | 0.01 | 0.01 |
| Socio-demographics | ||||
| Age 20–39 *** | 0.43 | 0.39 | 0.36 | 0.17 |
| Age 40–64 * | 0.41 | 0.41 | 0.38 | 0.57 |
| Age 65–79 * | 0.16 | 0.17 | 0.25 | 0.26 |
| Student/Pupil ** | 0.14 | 0.07 | 0.08 | 0.04 |
| Psychographics | ||||
| Automation seen as concern *** | 3.29 | 3.52 | 3.75 | 4.31 |
| Automation seen as positive *** | 4.98 | 4.73 | 4.41 | 3.89 |
| Positive attitude to environment ** | 5.06 | 4.94 | 5.13 | 4.63 |
| Political Orientation (1 Left; 8 Right) ** | 4.59 | 4.99 | 4.54 | 4.83 |
Publisher’s Note: MDPI stays neutral with regard to jurisdictional claims in published maps and institutional affiliations. |
© 2022 by the authors. Licensee MDPI, Basel, Switzerland. This article is an open access article distributed under the terms and conditions of the Creative Commons Attribution (CC BY) license (https://creativecommons.org/licenses/by/4.0/).
Share and Cite
Ludwig, P.; Winzer, C. Tariff Menus to Avoid Rebound Peaks: Results from a Discrete Choice Experiment with Swiss Customers. Energies 2022, 15, 6354. https://doi.org/10.3390/en15176354
Ludwig P, Winzer C. Tariff Menus to Avoid Rebound Peaks: Results from a Discrete Choice Experiment with Swiss Customers. Energies. 2022; 15(17):6354. https://doi.org/10.3390/en15176354
Chicago/Turabian StyleLudwig, Patrick, and Christian Winzer. 2022. "Tariff Menus to Avoid Rebound Peaks: Results from a Discrete Choice Experiment with Swiss Customers" Energies 15, no. 17: 6354. https://doi.org/10.3390/en15176354
APA StyleLudwig, P., & Winzer, C. (2022). Tariff Menus to Avoid Rebound Peaks: Results from a Discrete Choice Experiment with Swiss Customers. Energies, 15(17), 6354. https://doi.org/10.3390/en15176354