Abstract
As a country with not only significant production potential but also fragmented land ownership, the Kyrgyz Republic struggles with environmental efficiency, which is a strategic element of environmental management in agricultural production. The objective of this study was to assess the environmental efficiency of sheep’s wool when used as a fertilizer in bean production in northern Kyrgyzstan. In this study, the efficiency indicator was taken to be GHG emissions per functional unit of product, using a proprietary methodology for calculating GHG emissions to determine the true value of this material as a source of soil nutrients and organic matter. Two experimental factors were used in the experiment: fertilizer type and fertilizer rate. Fertilization with sheep wool resulted in a 15% higher bean yield compared to when fertilized with mineral fertilizers at a comparable rate, converted to pure nitrogen. By using sheep wool as a source of mineral nutrients for the plants, the carbon footprint was reduced by almost 10% compared to a facility with mineral fertilization. Therefore, the use of sheep wool as a source of plant nutrients is environmentally justified.
1. Introduction
Economic growth and the multidirectional use of nonrenewable energy increase the burden on the environment. In the long term, such a policy requires significant funds for environmental protection [1]. The agricultural and food processing sector is one of the most important energy consumers and a major source of greenhouse gas (GHG) emissions. Therefore, implementing methods that increase the environmental efficiency of agricultural production is a strategic element in the future development of this industry [2,3,4,5].
The efficient use of nonrenewable environmental resources is part of modern quality management systems in primary production, such as GLOBAL GAP (Good Agriculture Practice) or Platform SAI (Sustainable Agriculture Initiative). However, is very difficult to introduce unified methods to rationalize agricultural production [6,7,8] and determine fixed inputs for the production of a functional unit of the product. Plant production involves various types of soil and a changing climate. Many authors report that the most emissive and, thus, carbon footprint-increasing elements of plant production are pesticides, fertilizers, and energy-consuming agricultural treatments, such as tillage and irrigation.
Rationalizing the means of agricultural production in the context of sustainable development is one of the most important elements in the development of modern agriculture. Activities reducing soil degradation and optimizing the use of nutrients are in line with the principles behind the most important quality management systems in primary production [9]. The possibility of using ecological waste materials from other industries is significant in reducing the impact of agriculture on the environment, as organic waste materials contain chemical elements that are also plant nutrients. Sikora et al. [10] and Sikora et al. [7] point to the possibilities of using waste from various production branches to produce energy and fertilizers or soil-enriching agents.
Environmental Potential in Light of Agricultural Production in the Kyrgyz Republic
The Kyrgyz Republic is a country with a large and untapped environmental potential. Agriculture accounts for 18.5% of the country’s GDP, 85% of which comes from small private farms. The country’s climatic and soil conditions favor the production of quality legumes, nuts, fruits, and vegetables (beans, chickpeas, soybean, apricot, grape, mulberry, and other fruits with high sugar content).
Legumes are not traditionally grown in the Kyrgyz Republic. However, beans have been cultivated near the city of Talas since the 1970s, mainly on small family farms with diversified (plant and animal) production, and have become a crop of great economic importance. The annual export of Kyrgyz beans is over 80,000 tons [11], mainly to Turkey, Russia, Macedonia, Bulgaria, and Serbia. Beans represent an important source of protein for the global human population. Their amino acid composition makes them a good substitute for beef, the production of which generates a high level of emissions of greenhouse gases (GHG), as pointed out by Harwatt et al. [11].
On the other hand, sheep farming is also a very important branch of the economy of the Kyrgyz Republic. The country has more than 9 million hectares of meadows and pastures, most of which are not suitable for cattle grazing. Moreover, wool-producing breeds have higher requirements in terms of the quality of fodder, which is also a factor in the collapse of textile wool production in Kyrgyzstan [12]. Thirdly, traditional breeds make better use of natural forage and can better withstand adverse conditions in winter. Therefore, the development of sheep farming in Kyrgyzstan, mainly of meat breeds, is important both environmentally and economically.
Nowadays, the rearing of fine-fiber breeds is of marginal importance, as the global wool market collapsed in the early 1990s. The significant drop in the profitability of wool production, not only in Kyrgyzstan but also in neighboring countries such as Uzbekistan, Tajikistan, and Kazakhstan, has left a large surplus of this raw material in these countries. While sheep meat is sold at local markets, the sheared wool is left in the fields or stored on the farm. One of the most effective methods of using such organic matter, i.e., as a fertilizer or soil conditioner, is not practiced in the research area. Therefore, waste wool is an environmental and aesthetic problem in the region. From an economic point of view, it is important to seek alternative methods of processing and using this product. The sale of this raw material would improve the economic condition of many farms in Central Asia.
Historical, political, and cultural factors have made Kyrgyzstan one of the least-developed countries in Central Asia. The farms are highly fragmented, and the country is underinvested; it is deficient in agricultural and industrial infrastructure and lacks local energy sources. However, the economic development of this country is very important for maintaining democracy in this part of the world and the development of imports from the European Union (EU), mainly of machinery, cars, and car parts, as well as pharmaceutical, chemical, and electrical engineering products. In 2018, the government decided to develop a new industrial development strategy that would generate economic growth while increasing both energy and economic independence from other countries. One of the most important aspects of this strategy is the development of renewable energy sources [8].
One of the most effective methods to limit the use of non-renewable energy sources is the use of waste generated on the farm as a source of energy and a source of nutrients for plants [10]. However, the significantly fragmented agrarian structure of Kyrgyz farms hampers the development of infrastructures such as biogas production plants or the large-scale production of energy crops. Therefore, renewable energy must be produced at the lowest level (on farms). The most effective renewable energy management system is from the diversification of sources and establishing small renewable energy plants. In light of the significant fragmentation of Kyrgyz farms and the large-scale diversification of agricultural production, the most effective method of increasing the use of renewable energy sources could be the use of waste that requires the least amount of processing. The most popular solid fuel or fertilizer is vegetable waste, as animal waste poses the risk of microbial contamination and the drawback of significant odor [9]. On the other hand, animal waste contains significant amounts of carbon and other elements and is also highly energetic [11,12]. Whenever waste such as skin, bones, hooves, blood, or hair is used, it requires thermal processing and is highly demanding in terms of energy consumption. Transporting waste to processing sites and the subsequent distribution of the finished fertilizer often consumes more energy than conventional fertilizing or exceeds the energy output of the resulting product [13]. Therefore, the ideal formula would be to produce renewable energy via closed-loop production technology, i.e., within a farm or group of farms located in the same area [14,15,16].
2. Materials and Methods
The aim of the study was to calculate the carbon footprint for a particular bean, a white kidney bean cultivar, Phaseolus vulgaris L., fertilized with sheep wool produced in northwestern Kyrgyzstan. The efficiency indicator was the level of GHG emissions per functional unit of the product. Two experimental factors were used in the experiment: the type of fertilizer and its dose. The level of fertilization in the research area is generally low and is based mainly on natural fertilizers, the production of which is low, as the animals are kept mostly free-range. Mineral fertilizers are mainly imported; their application significantly increases farming production costs and the impact on the natural environment.
The material used for fertilization was wool, which in the research area is utilized by storing the fleeces in wild dumps, most often located in the mountains. The experiment was carried out on a bean farm in the city of Talas in northwestern Kyrgyzstan, located at 42.518854 N, 72.223393 E. The test plant was a local white kidney bean (Phaseolus vulgaris L.) that is widely grown in the area and is an important export product of Kyrgyzstan [17]. The experiment was started on 15 May 2019, and the beans were harvested on 22 August 2022. The sowing soil had a granulometric composition of sandy clay. The study was conducted in experimental plots of 3 × 4 m. Each study was conducted in 4 replicates. The adopted functional unit was 1 t of product, and the timeframe adopted for the system was 1 year. The greenhouse effect potential was estimated, based on GHG emissions that are converted into their carbon dioxide (CO2) equivalent.
The types of fertilizers and their doses were the experimental factors in the experiment. The field experiment included 3 doses of wool applied at 0.5 Mg, 1 Mg and 2 Mg/ha. For objects with the addition of wool at 1 and 2 t/ha, nitrogen was introduced into the soil, in amounts significantly exceeding the nutritional requirements of the beans. High doses of wool were introduced to determine, under experimental conditions, the effect of excessive doses of this waste on the yield of beans and on GHG emissions. The same level of fertilization was adopted for all objects in the experiment. This corresponded to the nutritional requirements of the plants at the estimated level of the habitat production potential.
The wool was applied to the soil in the autumn of 2018. Before application, the wool was shredded using a 5.4 kW flail shredder, then windrowed for 3 weeks and ’sprinkled with water occasionally. The prepared material was finally plowed in at a depth of 16 cm. Increasing the humidity limited its dusting and improved its mechanical parameters. The reference point was the research object that was fertilized with mineral fertilizers, according to local production practice. The fertilization needs of the tested plant were estimated at: N—50 kg/ha, P2O5—60 kg/ha, K2O—120 kg/ha. Since in the research area fertilization is often not carried out, the second reference point was the research object that was not fertilized. In those research objects where sheep wool fertilizer was used, potassium and phosphorus fertilization were applied, according to the area’s fertilization needs. In research objects fertilized with wool, all fertilizers were applied before sowing, while in the research object fertilized with minerals, the nitrogen dose was divided into two parts. Half of the dose was applied before sowing and half was applied at the beginning of the flowering season. During the growing season, plants were irrigated using surface water, fed by gravity. Water was supplied to the fields via canals from the mountains. The irrigation volume was about 450 mm during the growing season. Four irrigation treatments of 115 mm each were applied.
The bean crop was sown at 0.8 million plants per hectare, at 2.5 cm intervals. The experiment was designed using the randomized block method, in four replications. The experiment scheme is presented in Table 1. Before the experiment, the soil was sampled to determine its basic parameters and estimate the yield potential of the habitat. The soil pH was determined using the potentiometric method, and the content of organic carbon and total nitrogen was determined by elemental analysis using the Vario Max Cube by Elementar. Mineral nitrogen in the soil was determined by a distillation method after prior extraction with 1 Mol∙dm−3 of potassium sulfate in solution. The contents of the available forms of phosphorus and potassium were determined using the Egner–Riehm method, while the contents of available forms of calcium and magnesium were determined using the Schachtschabel method.

Table 1.
Experiment design.
Wool samples were also taken and mineralized using the Anton Paar Multiwave 3000 microwave system. The analytical weight was approx. 0.5 g in dry weight. The material was digested in a 5:1 v/v mixture of HNO3 and H2O2. The concentration of elements in the obtained solutions was determined by an inductively excited plasma atomic emission spectrometry method using the Optima 7600 DV device from Perkin Elmer, Waltham, MA, USA. The properties of the soil are given in Table 2, whereas the contents of the macronutrients in the wool are given in Table 3. The production potential of the habitat was estimated at 3.2 Mg∙ha−1 of seeds.
Table 2.
Properties of the soil on which the experiment was conducted.
Table 3.
Chemical composition of sheep wool.
To determine the environmental impact of the bean production process under various technological conditions, the following standards were used: ISO 14040: “Environmental Management—Life Cycle Assessment—Principles and framework” and ISO 14044: “Environmental Management—Life Cycle Assessment—Requirements”. The analysis was conducted in accordance with the recommendations contained in the document [18]. The research excludes the transport of wool and mineral fertilizers and the packaging, as well as the use of agricultural tools and marketing. The production and transport of seeds were also excluded from the process. Wool and fertilizer transport was excluded from the system boundary due to the difficulty of estimating this parameter in the experiment conducted. Excluding these elements allowed for a more unified approach to assessing the use of wool as fertilizer in the study area.
The input data for calculating the GHG emission value came from three experimental research objects in which sheep wool was used as a fertilization material. One research object was additionally fertilized with 3 types of mineral fertilizers and in one, no fertilization was applied. The control reference objects had no addition of wool.
The GHG emissions of the tested objects were adopted in accordance with the literature data. The GHG emission level for nitrogen production in ammonium nitrate was adopted at 7.99 kg CO2∙kg−1 N, for triple superphosphate it was adopted at 0.36 kg CO2∙kg−1 P2O5, while for potassium chloride, it was at 0.56 kg CO2∙kg−1 K2O [19,20]. The amount of ammonia emitted into the atmosphere was calculated based on the guidelines given in the literature [21,22]. The emission factors for crop residues were calculated based on the amount of by-crop in the bean crop. Based on the experimental results, it was estimated that the ratio of the commercial yield after drying of by-crop and crop residues was 0.72 to 0.85%, depending on the research object. The carbon content in the dry weight of crop residues was adopted according to the analysis. Depending on the research object, it ranged from 46.72 to 53.44%. The nitrogen content in the crop residues ranged from 1.96% to 2.51% of dry weight.
The level of decomposition of crop residues was estimated at 21%, based on the results of an incubation experiment (own data, unpublished). The amounts of carbon dioxide and nitrogen oxide emissions from crop residues were calculated in accordance with the methodology included in the IPCC [23]. The amount of nitrogen emitted in the form of nitrogen oxides was adopted as 1.25% [24,25]. The N-N2O emission value was converted to their CO2 equivalent by multiplying its quantity by the global warming index, which is 292 [26]. The mineralization index of organic matter was adopted at 1.6%.
The values of nitrogen oxide emission from nitrogen transformations in the soil were calculated in accordance with the methodology included in the IPCC method [21]. The life cycle assessment of beans takes into account GHG emissions from the combustion of fossil fuels used for agrotechnical treatments. The fuel consumption for individual agrotechnical treatments and for the preparation of wool is presented in Table 4. Fuel consumption for individual treatments was calculated based on data presented by [27]. Based on the data provided by the EPA [28], the adopted emission of diesel combustion in farm tractors was 3.864 kg of CO2 dm−3 of fuel. Since the amount of nitrogen oxides and methane emitted during diesel combustion in farm tractors is low, this source of GHGs was omitted, according to previous recommendations [27]. GHG emissions related to pesticide use have been estimated at 25.5 kg of CO2 per 1 kg of the active substance of the pesticide, as suggested by Audsley et al. (Table 4) [29]. The energy consumed to dry the bean seeds was calculated based on data drawn from the literature [30]. The moisture level of the bean seeds during harvest was 21.4%.
Table 4.
Energy consumption and GHG emissions related to agrotechnical treatments.
As part of the post-harvest activities, the seeds were dried down to 14% using an electrical dryer, which required an energy expenditure of 0.11 GJ∙Mg−1 of seed mass at the temperature and air humidity of the experimental site. The CO2 emission adopted for the production of 1 KWh of electricity was 0.9245 kg (see Wang et al.) [31]. According to the methodology given by FAO [32], the amount of nitrogen emitted into the atmosphere from mineral fertilization is 1% as a direct emission and 0.27% as dispersed nitrogen. The amount of nitrogen oxides emitted from dispersed nitrogen was estimated to be 0.75% of the total nitrogen not used by plants during the growing season [32]. Surface water was used for irrigation and was supplied gravitationally. Therefore, elements related to the use of water for irrigation were excluded from the system boundary. The water demand was calculated, based on the natural course of weather conditions and the evapotranspiration index (Table 5 and Table 6).
Table 5.
The course of weather conditions in the area of research.
Table 6.
Plant protection products used in the cultivation of beans.
The GHG emissions from the decomposition of sheep wool after introduction into the soil were calculated according to the IPCC manure guidelines [21]. It was assumed that 60% of the carbon contained in wool was emitted in the form of CO2.
In terms of the number of objects, the scope of the research, and geographic location, the experiment was planned based on the adopted qualitative and quantitative goals and technical possibilities [33]. The selection of the test plant cultivar, the individual fertilization variants, the scope of agrotechnical treatments, the level of irrigation, and the time frame of the experiment were based on the risk analysis carried out according to ISO 31000:2018. The defined risk was the influence of certain factors on the yields of plants under specific natural and climatic conditions. The scope of the sources of investigation and the GHG emissions were selected, based on the literature. The experiment was carried out according to the following scheme:
- Defining the strategic goal.
- Selection of experimental factors.
- Selection of the experiment plant (beans are important as a protein source and generate a high level of GHGs).
- Selection of the experiment site (geographical system boundary), i.e., the most important bean-growing region in Central Asia.
- Selection of agrotechnical treatments (based on the technical and infrastructural capabilities of farms located in the area of research).
- Selection of experimental factor levels (wool additives at 0.5, 1, and 2).
- Selection of the system boundary (based on the literature study and risk analysis in the context of the adopted goal, in accordance with ISO 31000: 2018).
The system boundaries included:
- Production of fertilizers used.
- Energy consumption for field-based work on the farm.
- Soil emissions (direct and indirect) from the use of fertilizer and wool.
- Emissions from the management of crop residues and from the mineralization of organic matter in the soil.
- Emissions related to the preparation of wool, its application to the soil, and its decomposition.
- Emissions related to the production of seed material and plant protection products.
3. Results and Discussion
Livestock production is considered an important source of environmental degradation, which is related to water eutrophication, microbial contamination, and GHG emissions. Livestock accounts for 14.5% of the global anthropogenic GHG emissions and produces 44% and 53% of the total CH4 and N2O emissions [34]. Animal production waste is an environmental hazard, due to the high content of nutrients and the low microbiological stability [7]. Wool is a product with a high GHG emission rate. Wiedemann et al. [35] reported the GHG emission value for sheep wool at 21 kg CO2·kg−1 wool. Cottle and Cowie [36] calculated the GHG emissions for wool between 8.5 kg CO2·kg−1 and 20.7 kg CO2·kg−1 wool. On the other hand, for meat, the value ranged from 3.6 to 8.5 kg of CO2·kg−1 of meat.
In the case of ruminant products, the amount of GHG emissions is mainly related to intestinal processing, which is accompanied by the emission of large amounts of methane and carbon dioxide. Since sheep are well-adapted to harsh climatic conditions, they can convert poor-quality feed well and have low water requirements, and they are the main source of animal protein in many areas of the world. In light of climate change and the progressive process of steppe formation and desertification in many areas, a further increase in the number of these animals should be expected. Currently, the world population of small ruminants amounts to over 2 billion units, which is more than half that of all ruminants. Sheep farming is of particular economic importance in developing countries, as it is the main source of livelihood for the inhabitants. In terms of protein supply and many macro- and micronutrients, sheep farming is of critical importance in these regions (Table 7).
Table 7.
CO2 emissions from fertilizers (CO2 equivalent/1 t of dry bean seeds).
As more than half of the total GHG emissions in sheep production are due to digestive processes, there are limited opportunities to optimize lamb production technology to reduce GHG emissions [37]. The only effective course of action to reduce GHG emissions is to optimize production in terms of the rational use of pastures and effective use of production waste. A significant source of GHG emissions related to ruminant production is the excessive exploitation of pastures and the related reduction of carbon binding from the atmosphere and carbon emissions from the soil [38]. Modifications of animal nutrition technology can also reduce the level of GHG emissions; however, this is mainly related to the need to use good-quality feed, i.e., feed characterized by a high digestibility index [37,39,40,41]. In turn, Jeswani et al. [42] emphasized that increasing the environmental efficiency of livestock production in terms of reducing GHGs is possible by increasing the diversity of production on the farm.
The production and environmental conditions prevailing in the countries of Central Asia and other less-favored regions of the world do not allow the production of feed with a high digestibility index and thereby allow for increasing the diversification of production within the farm environment. The worldwide literature lacks results from research on the environmental effects of using animal production by-products as fertilizers on the farm. The use of waste wool is important not only in terms of providing nutrients to plants but also in the context of reducing the emissions related to its decomposition in illegal landfills. Developing a methodology for calculating GHG emissions when wool is used for fertilization purposes will allow researchers to determine the actual value of this material as a source of nutrients and of soil organic matter. The context of GHG emissions is now increasingly important in primary production quality management systems [43,44,45]. Reducing GHG emissions from agricultural production always involves additional costs [46]. Reducing GHG emissions while disposing of waste products is beneficial from the point of view of mitigating the negative impact of agriculture on the environment and building the reputation of agriculture.
In the case of meat-yielding sheep breeds, wool is a waste product, and its mismanagement could pose an environmental hazard. Therefore, an approach to GHG emissions related to wool as a waste product should be slightly different than in the case of its commercial production. Zach et al. [47] calculated that using 1 kg of waste sheep wool as a horticultural substrate reduces GHG emissions by 24 kg of CO2/kg of substrate, compared to mineral wool. This is the average value of the GHG emissions from the production of 1 kg of sheep wool. However, these values apply to the breeds of fibrous wool sheep. Cottle and Cowie [36], Jeswani et al. [42], and Wiedemann et al. [35] reported that in the case of meat-yielding sheep, the value of GHG emissions from wool production could become negative, depending on the approach taken for its disposal.
The results of this research indicate a positive effect of wool as a fertilizer on the yields of plants. Legume plants tolerate nitrogen-deficient positions well, but the phosphorus content is of strategic importance for these plants [48]. The results of the conducted experiments show the great potential of wool as a source of nutrients for plants.
To illustrate the variability of the bean yield results, which depends on the applied fertilizer, a variance was used. This is the basic measure that describes the variability of the results and demonstrates how significant the variations in the results are in a given set of results (a variable). In other words, variance shows whether the results are more concentrated around the mean, i.e., the differences between the mean and the individual scores are significant, or whether the results are highly dispersed, i.e., the difference between the individual scores and the mean is large. The analysis of variance was performed with a single categorical predictor. The Tukey test, which is one of the most frequently used tests for comparing mean pairs, was used to illustrate which bean yield results varied significantly. In Table 8, the letters (a, b, c, and d) represent homogeneous groups of bean yields in terms of size. The Tukey test can be used for different sample sizes. It is based on the studentized range statistics distribution. Tukey’s method is more conservative than Fisher’s least significant difference (LSD) test but is less conservative than the Scheffé test. The experiment error rate for all pairwise comparisons remains the error rate for the set. This means that if a statistical significance level of α = 0.05 is adopted for the ANOVA test, the same level of statistical significance will be used for all pairwise (sample) comparisons. This procedure is used when the assumption of equal variance in the samples is met.
Table 8.
Homogeneous groups for marketable yield, obtained via the Tukey test.
The yield of bean seeds obtained using mineral fertilization that is consistent with plant needs was 2.29 t/ha (Figure 1). The use of sheep wool at 0.5 t/ha, alongside full fertilization with phosphorus and potassium, increased the commercial plant yield of beans by 16%, while the use of 1 ton of wool increased it by 25% compared to the yield when fertilized with minerals.
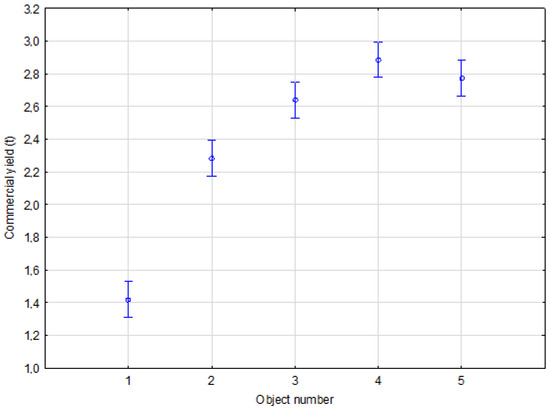
Figure 1.
Average values of the marketable yield of beans for the selected fertilization. Different letters mean statistically significant differences at the significance level p = 0.05.
The yield of plants in the research object without fertilization was 1.42 t/ha. Sheep wool is a valuable material in terms of its nutritional value for plants. Böhme et al. [49] emphasized that under favorable conditions, wool can decompose in the soil within a few weeks. They found similar results in terms of the influence of wool on the plant nutrition rate [50]. The authors found an increase in yield for basil and Swiss chard as a result of the application of sheep wool to the substrate. In addition, they found a significant increase in nitrogen content in the plant biomass. Górecki and Górecki [51] reported that the peat addition of wool to the substrate increased the yield of tomato and sweet pepper by several dozen percent compared to the research objects without the addition of this ingredient. The results of this investigation confirm these data. Other materials could have a lower potential to deliver nutrients to plants. Bhange et al. [52] found that the keratin contained in feathers is a very good source of nitrogen, but the release of these elements from feathers alone is insufficient, and the waste must be biotechnologically treated. The Tukey test for bean production showed that the plots with sheep wool fertilizer formed a homogeneous group, with the highest average yields.
The GHG emissions from the production of bean crops in the individual variants of the experiment ranged from 1176 to 1908 kg of CO2 eq/1 t of dry bean seeds (Figure 2). The level of GHG emissions from the soil in the presented experiments was comparable to the data published by Fernández-Luqueño et al. [53]. The highest value of this parameter was obtained for the research object fertilized with wool at 2 t/ha, while the lowest value was obtained for the research object fertilized with wool at 0.5 t/ha. In the latter research object, approximately 22% of the GHG emissions came from wool decomposed after its introduction into the soil. Assuming that a waste product has been employed for which no alternative use has been developed at the place of its generation, with optimized application technology, this source of GHG emissions could be negligible [54]. Then, the level of GHG emissions in a research object fertilized with wool at 0.5 t/ha would be 968 CO2 eq/t of dry bean seeds.
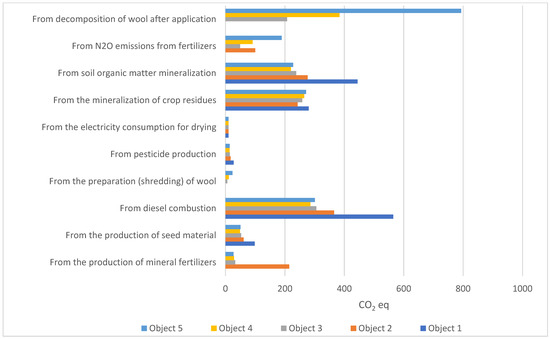
Figure 2.
Value of GHG emissions per ton of product.
The GHG emissions related to the production of bean crops in these experiments were generated primarily by the combustion of fossil fuels. The increased efficiency in the use of energy in plant production is the result of intensified production and increased yield per unit area [3,55]. In the conducted experiments, GHG emissions related to fuel combustion and energy consumed for seed drying ranged from 16.3 to 40.3% per unit of functional product. The volume of CO2-equivalent emissions from the consumption of nonrenewable energy resources ranged from 311.5 to 575.1 kg CO2 eq/1 t of dry seeds (Figure 2). Šarauskis et al. [55] found that in the production of broad beans, the number of emissions from fuel combustion and machinery consumption ranged from 31 to 50% of the total production emissions. Too high a share of fossil fuel consumption in the total GHG emissions in agricultural production demonstrates low cultivation efficiency; however, too low a share may indicate the insufficient use of nitrogen from mineral and organic fertilizers. The share of fossil fuels in total emissions at approximately 30% is considered optimal in conventional treatments [56]. Extensive production methods and the associated reduction in the use of means of production, such as fertilizers or pesticides, result in reduced GHG emissions per unit area.
GHG emission values per functional unit of the product are usually much higher in extensive agriculture systems compared to intensive systems [57]. To obtain optimized environmental effects, it is necessary to determine the production potential of the habitat and, based on the results, to adjust the amounts of applied fertilizers and plant protection products. Obtaining a yield above the habitat’s production potential is usually associated with reduced efficiency in the production means and a significant increase in GHG emissions. In the presented research, the highest yield was obtained in the research object with the highest addition of wool as a fertilizer, but this translated into a significant increase in the level of GHG emissions from the decomposition of wool. The most effective method of reducing GHG emissions is to increase the efficiency of nitrogen use in agroecosystems [58].
The mineralization of soil organic matter is a significant process, the intensity of which is related to the level of intensification of plant production. This process leads to a loss of organic matter in the soil and to the emission of large amounts of GHGs [57,59,60]. Increasing the production efficiency per unit area is one of the methods of reducing the carbon footprint of plant products. An effective method of compensating for this source of GHGs is to implement measures that lead to permanent carbon fixation in soil resources [6,61] The results of the research indicate that the value of GHG emissions from the mineralization of organic matter ranged from 220.1 to 448.8 kg CO2 eq/1 t of the dry weight of seeds (Figure 2). The highest value of this parameter was found in a non-fertilized object and in the one fertilized with mineral fertilizers. Fertilization with wool resulted in a reduction of the GHG emission index related to the mineralization of soil organic matter. The share of this source in the total emissions ranged from 11.93 to 31.18%. GHG emissions that were related to the mineralization of crop residues were similar in terms of individual research objects and resulted from the ratio between the main and secondary crop and the nitrogen content in the by-crop.
The greenhouse effect is generated due to the emission of N2O, CH4, and CO2. The emission of nitrogen in the form of N2O is one of the most important sources of GHG emissions, which depends on the level of fertilization [3,62]. Under the conditions of the experiment, the participation of N2O in the total emission of GHG ranged from 131.2 to 524.9 kg CO2 eq/1 ha, which, in terms of yield, ranged from 49.5 to 189.5 kg CO2 eq/1 t dry seeds (Figure 2). The lowest value of this parameter was found in the research object fertilized with wool at 0.5 t/1 ha. In the case of conventional fertilization with mineral fertilizers, the GHG emission level related to nitrogen dissipation into the atmosphere was 100.2 kg CO2 eq/1 ha. From the point of view of production efficiency, the most effective production variant was from fertilization with wool at 0.5 t/ha. Larger additions of this material resulted in a significant increase in GHG emissions, which was related to the emission of nitrogen oxide. The share of this source in the total emission ranged from 4.2 to 9.9% of the total emission from the production of beans (Figure 2). The use of organic fertilizers is associated with significant emissions of GHGs, which are associated not only with the volatilization of nitrogen compounds but also with carbon dioxide as a result of the decomposition of organic matter [56]. Pilecco et al. [59] found much higher atmospheric emissions of N2O from organic fertilizers than from mineral fertilizers. These authors emphasized, however, that the impact of organic fertilization on the level of GHG emissions should be considered over a longer time perspective and should take into account the carbon contained in organic fertilizers, which is permanently bound into the soil. Shakoor et al. [63] reported that fertilization with manure results in a higher level of GHG emissions compared to mineral fertilization.
Manure or other organic materials used for fertilization can generate up to 80% of total GHG emissions when used as intensive organic fertilization [55]. On the other hand, Hakala et al. [64] found that fertilization with green manure of various types of grasses resulted in lower levels of GHG emissions per unit mass of product compared to intensive mineral fertilization. However, the size of the yield obtained in the objects fertilized with mineral fertilizers was several times higher than with organic fertilizers. The value of GHG emissions from agricultural production should always be considered in light of the yield obtained from the cultivated area. Using organic materials as fertilizers is related to the problem of their subsequent impact on the mineralization of organic compounds in the soil. The correct direction of agricultural production management toward increasing carbon sequestration is toward converting biomass to obtain compounds that mineralize more slowly [56,61]. The results of the conducted research show that the emissions of GHGs from the decomposition of wool after its introduction into the soil ranged from 207.5 to 794.2 kg CO2 eq/1 t of seeds (Figure 2). CO2 emissions from the decomposition of wool in the subsequent experimental objects accounted for 18%, 28%, and 42% of the total amount of GHGs from the production of beans.
In the absence of alternative methods for utilizing waste wool, using it as fertilizer is justified from an environmental point of view, despite its high impact on the generation of the greenhouse effect. Part of the carbon contained in the wool will undergo the humification process, which is very important from the point of view of carbon sequestration in the soil. Furthermore, the use of wool as a fertilizer contributes to the sustainability of agriculture and to increasing the economic efficiency of bean crop production in Kyrgyzstan.
A key issue for the GHG emissions values from bean crop production in each variant of the experiment is to appropriately select the diagnostic features and the method of their aggregation. In works devoted to multi-feature phenomena, the postulate of independence of the variables ultimately used to create a synthetic index is mentioned repeatedly. On the other hand, the rules of statistical reporting provide a limited set of statistical data on the scale of the studied case. Therefore, due to the cost of research, indirect solutions should be sought; that is, a compromise between the substantive and statistical approach should be found. The subject of research itself, i.e., the type of fertilization in the production of beans and its impact on GHG emissions, limits the formal criterion in favor of the substantive approach. From the set of diagnostic variables, such variables were selected that should aim at the minimum (destimulants) in terms of the types of fertilization.
The subject of classification (Ω) is the set of fertilization types (5). The classification space (Φ) is a feature of the studied GHG emission values, depending on the fertilization used in the cultivation of beans. Diagnostic variables were marked (10) and are presented in Table 9. They allow for creating a complete and objective picture of the analyzed objects in the property space (Φ), in which 9 variables were classified as destimulants and 14 were classified as stimulants. The selected diagnostic variables come from two periods.
Table 9.
Diagnostic variables adopted in the research.
Upon analyzing the values in Table 9, it can be concluded that the variable X5 has the greatest impact on GHG emissions in the cultivation of bean crops with the applied fertilizer (CO2eq from pesticide production). This variable influences the model by as much as 27.43%. This proves that in the final conclusions of the impact of fertilization on GHG emissions in the cultivation of beans, this variable will bear as much as 27.43% of the information. With variables that had zero impact on the final model in each fertilization, the level of their value was the same and they are the variables (X2 and X8).
In the geometric interpretation, Ω is the set of vectors in the k-dimensional property space Φ. These points should be divided into a certain predetermined number of groups of homogeneous (similar) objects belonging to other groups. The starting point for determining the potential of GHG emissions, depending on the fertilization applied, is the construction of a multidimensional space, as described by the observation matrix Φ (X) (1). For all test observations, the matrix will have dimensions of 5 × 10 (5 test objects with different fertilization types and 10 tested GHG features):
The coefficient of variation was adopted as a formal criterion for the assessment of the diagnostic features of the features, Vj, calculated according to the Formula (2):
where:
- Vj—coefficient of variation,
- sj—standard deviation of the j-th variable, and
- —mean of the j-th variable.
3.1. Normalization of the Diagnostic Variables
The problem of classification of the effect of fertilization on the emission of GHGs during the cultivation of beans is a typical problem of multidimensional comparative analysis. This is due to the fact that many features and indicators can be used to describe the level of GHG emissions in this context. Please note that a taxonomic structure is a configuration of points in a multidimensional space, which is a set of objects characterized by various features. Determining the similarities between the objects requires first bringing the diagnostic features into comparability. This can be done through the usual variable normalization procedure. Comparative analysis methods require the use of variables expressed in the same measurement units and with similar orders of magnitude [65].
Variables are most often normalized according to the following formula [66]:
where:
- zij—the normalized value of the variable xj for i-th object,
- xij—the output value of the j-th variable,
- n—the number of observations,
- m—the number of variables, and
- A, B, and p—parameters that can have different values, depending on the method of normalization.
The constant, B, acts as a scaling factor in the formula, while the constant A is the reference point by which the values of the features are shifted to the conventional zero. The literature on the subject provides a number of methods for normalization transformations [67,68,69]. The choice of the normalization formula impacts the final results of the analyses.
The purpose of this procedure is to eliminate the original feature titers and to bring the range of variability to a similar size. The next step is to determine the synthetic GHG emission factor for growing beans, depending on the type of fertilization.
In the set of adopted diagnostic variables, the standardization stimulants were classified in accordance with Formula (3), and for the variables classified as destimulants, standardization was performed in accordance with Formula (4) (their higher values allowed us to classify a given object as better, in terms of the analyzed feature).
The standardization of diagnostic features was made by a certain modification of Formula (2), by replacing parameters A and B with the arithmetic mean and standard deviation, respectively (at p = 1):
where:
- i—the object number,
- j—the number of the diagnostic feature,
- Sj—the standard deviation of the feature j,
- xij—realization of the feature j in the object i.
The performed standardization led to the unification of all variables, due to their variability and location. A matrix of normalized input variables xij was obtained, sized at n × m, depending on the size of the set Ω and the size of the space Φ.
A valuable property of the thus-transformed variables comprising matrix Z is the normalization of all its elements in the range −∞ < Zij < +∞ and eliminating the titers of the input variable.
3.2. Synthetic Index as a Criterion of Linear Ordering
The presented form of the synthetic measure is based on the generalized notion of distance, which can be defined as the distance of two points ηl and ηk in m-dimensional space in the established system of positive weighting factors.
It was assumed that the weighting factors were the same for all variables, which gives us the same meaning for each of the synthetic variables. In the research, the form of a synthetic measure was presented as a quadratic function with the general form of:
where:
- di(1) = d(ηi i η(1))—the distance between the disaggregated level of development of the i-th object ηi and the disaggregated pattern of the level of development, η(1),
- d(0),(1) = d(η(0) η(1))—the distance between the disaggregated zero development level η(0) and disaggregated model development level η(1),
- αj—the weighting factor of the feature xj.
The adopted model of the feature synthesis meets the postulates of a standardized measure <0.1> and orders the observations linearly from the smallest to the largest, in terms of the adopted criteria. The value of the metric determines the value of the function di(1), i.e., the distance of the point ηi from the benchmark level of η(1). Increasing this distance causes a decrease in the global evaluation result.
The presented method of searching for a synthetic measure, based on a pattern where each of the variables tends toward unity, allows for an estimation of the taxonomic structure of the set of studied cases as a configuration of objects in the multi-feature space of their properties. Understanding the structure of objects in spatial classification allows us to rank objects that are closer or farther from the adopted pattern.
The measure of development qi designated for each object i creates a vector of aggregates in the form of a single-column matrix:
Vector P [1 × n] is a synthetic measure that allows a single-number classification of a multi-feature phenomenon such as the emission of GHGs, depending on the type of fertilization used in the cultivation of bean crops [7,69,70].
In the conducted research, observations were classified using the range of values of the synthetic measure [71,72,73]. It was assumed that the sets of these areas will be divided into three groups that assemble those observations with similar values to the synthetic measure. The criterion is presented in Table 10.
Table 10.
Characteristics of the classification of observations according to the value of the synthetic measure of GHG emission, depending on the type of fertilization used in the cultivation of beans.
4. Conclusions
The wool used for fertilization was characterized by its nitrogen content. The addition of wool to the soil at the level of 0.5 t/ha increased the yield by 86% compared to the non-fertilized research object and by 15% compared to the research object fertilized with mineral nitrogen. A further increase in the amount of wool added to the substrate did not increase the bean crop yield. The value of GHG emissions from bean cultivation was 1426 kg CO2eq/1 t of seeds in a non-fertilized research object; in a research object with mineral fertilization—1286 kg CO2eq/1 t of seeds, while at 0.5 t/1 ha of wool, the emission level was 1176 kg of CO2eq/1 t of seeds and showed the lowest value of carbon footprint. With the addition of wool at 1 t/ha and 2 Mg/ha, the GHG emissions were, respectively, 1357 and 1910 kg of CO2eq/1 t of seeds. When bean fertilization ceased, the GHG emissions increased. From an environmental point of view, the best technological solution is sheep wool fertilization at 0.5 t/1 ha. In this variant of the experiment, the level of GHG emissions from the decomposition of wool was 23% of the total GHG emissions. Assuming that wool is a waste product with similar emissions in landfills, this source cannot be included in the calculation of the GHG emissions from the production of beans. The fertilization potential of 1 kg of wool was comparable to approximately 0.35 kg of ammonium nitrate. The use of waste wool as a fertilizer reduces the consumption of nonrenewable energy sources.
Author Contributions
Conceptualization, M.N., M.K., J.S. (Jakub Sikora) and M.C.; methodology, M.K., M.N., J.S. (Jakub Sikora), P.F., M.C. and H.G.; software, J.S. (Jakub Sikora), Z.G.-S., A.S.-S. and J.S. (Joanna Stuglik); validation M.K., J.S. (Jakub Sikora), P.F. and H.G.; formal analysis, Z.G.-S., A.S.-S., J.S. (Joanna Stuglik) and H.G.; investigation, M.K., M.N., J.S. (Jakub Sikora), P.F. and H.G.; resources, Z.G.-S., A.S.-S., J.S. (Joanna Stuglik) and A.A.; data curation, M.K., M.N., J.S. (Jakub Sikora), P.F. and H.G.; writing—original draft preparation, M.N., M.K., J.S. (Jakub Sikora), Z.G.-S. and A.S.-S.; writing—review and editing, P.F., H.G. and J.S. (Joanna Stuglik); visualization, M.K., M.N. and J.S. (Jakub Sikora); supervision, A.S.-S., P.F., Z.G.-S. and A.A.; project administration, Z.G.-S. and A.S.-S.; funding acquisition, M.N. and M.K. All authors have read and agreed to the published version of the manuscript.
Funding
This publication was financed by a subsidy granted to the Cracow University of Economics (057/ZZE/2022/POT), and the University of Agriculture in Krakow.
Institutional Review Board Statement
Not applicable.
Informed Consent Statement
Not applicable.
Data Availability Statement
Not applicable.
Conflicts of Interest
The authors declare no conflict of interest.
References
- Gródek-Szostak, Z.; Suder, M.; Kusa, R.; Szeląg-Sikora, A.; Duda, J.; Niemiec, M. Renewable Energy Promotion Instruments Used by Innovation Brokers in a Technology Transfer Network. Case Study of the Enterprise Europe Network. Energies 2020, 13, 5752. [Google Scholar] [CrossRef]
- Gródek-Szostak, Z.; Luc, M.; Szeląg-Sikora, A.; Sikora, J.; Niemiec, M.; Ochoa Siguencia, L.; Velinov, E. Promotion of RES in a Technology Transfer Network. Case Study of the Enterprise Europe Network. Energies 2020, 13, 3445. [Google Scholar] [CrossRef]
- Sikora, J.; Niemiec, M.; Szeląg-Sikora, A.; Gródek-Szostak, Z.; Kuboń, M.; Komorowska, M. The Impact of a Controlled-Release Fertilizer on Greenhouse Gas Emissions and the Efficiency of the Production of Chinese Cabbage. Energies 2020, 13, 2063. [Google Scholar] [CrossRef]
- Aguilera, E.; Reyes-Palomo, C.; Díaz-Gaona, C.; Sanz-Cobena, A.; Smith, P.; García-Laureano, R.; Rodríguez-Estévez, V. Greenhouse gas emissions from Mediterranean agriculture: Evidence of unbalanced research efforts and knowledge gaps. Glob. Environ. Chang. 2021, 69, 102319. [Google Scholar] [CrossRef]
- Musafiri, C.M.; Macharia, J.M.; Ng’etich, O.K.; Kiboi, M.N.; Okeyo, J.; Shisanya, C.A.; Okwuosa, E.A.; Mugendi, D.N.; Felix, K.; Ngetich, F.K. Farming systems’ typologies analysis to inform agricultural greenhouse gas emissions potential from smallholderrain-fed farms in Kenya. Sci. Afr. 2020, 8, e00458. [Google Scholar]
- Yang, X.; Meng, J.; Lan, Y.; Chen, W.; Yang, T.; Yuan, J.; Liu, S.; Han, J. Effects of maize stover and its biochar on soil CO2 emissions and labile organic carbon fractions in Northeast China. Agric. Ecosyst. Environ. 2017, 240, 24–31. [Google Scholar] [CrossRef]
- Sikora, J.; Niemiec, M.; Szeląg-Sikora, A.; Gródek-Szostak, Z.; Kuboń, M.; Komorowska, M. The Effect of the Addition of a Fat Emulsifier on the Amount and Quality of the Obtained Biogas. Energies 2020, 13, 1825. [Google Scholar] [CrossRef]
- Strelkovskii, N.; Komendantova, N.; Sizov, S.; Rovenskaya, E. Building plausible futures: Scenario-based strategic planning of industrial development of Kyrgyzstan. Futures 2020, 124, 102646. [Google Scholar] [CrossRef]
- Szeląg-Sikora, A.; Sikora, J.; Niemiec, M.; Gródek-Szostak, Z.; Kapusta-Duch, J.; Kuboń, M.; Komorowska, M.; Karcz, J. Impact of Integrated and Conventional Plant Production on Selected Soil Parameters in Carrot Production. Sustainability 2019, 11, 5612. [Google Scholar] [CrossRef]
- Sikora, J.; Niemiec, M.; Szeląg-Sikora, A. Evaluation of the chemical composition of raw common duckweed (Lemna minor L.) and pulp after methane fermentation. J. Elem. 2018, 23, 685–695. [Google Scholar] [CrossRef]
- Harwatt, H.; Sabaté, J.; Eshel, G.; Soret, S.; Ripple, W. Substituting beans for beef as a contribution toward US climate change targets. Clim. Chang. 2017, 143, 261–270. [Google Scholar] [CrossRef]
- Schillhorn van Veen, T.W. The Kyrgyz Sheep Herders at a Crossroads; Pastoral Development Network Series Paper 38d; Overseas Development Institute: London, UK, 1995; Available online: http://www.odi.org.uk/pdn/papers/index1.htm (accessed on 17 May 2022).
- Sharrock, P.; Fiallo, M.; Nzihou, A.; Chkir, M. Hazardous animal waste carcasses transformation into slow release fertilizers. J. Hazard. Mater. 2009, 167, 119–123. [Google Scholar] [CrossRef] [PubMed]
- Sagastume Gutiérrez, A.; Cabello Eras, J.J.; Hens, L.; Vandecasteele, C. The energy potential of agriculture, agroindustrial, livestock, and slaughterhouse biomass wastes through direct combustion and anaerobic digestion. Case Colomb. J. Clean. Prod. 2020, 269, 122317. [Google Scholar] [CrossRef]
- Islam, K.N.; Sarker, T.; Taghizadeh-Hesary, F.; Atri, A.C.; Alam, M.S. Renewable energy generation from livestock waste for a sustainable circular economy in Bangladesh. Renew. Sustain. Energy Rev. 2021, 139, 110695. [Google Scholar] [CrossRef]
- Alhazmi, H.; Minh Loy, A.C. Bioresource Technology Reports A review on environmental assessment of conversion of agriculture waste to bio-energy via different thermochemical routes: Current and future trends. Bioresour. Technol. Rep. 2021, 14, 100682. [Google Scholar] [CrossRef]
- Szeląg-Sikora, A.; Sikora, J.; Niemiec, M.; Gródek-Szostak, Z.; Suder, M.; Kuboń, M.; Borkowski, T.; Malik, G. Solar Power: Stellar Profit or Astronomic Cost? A Case Study of Photovoltaic Installations under Poland’s National Prosumer Policy in 2016–2020. Energies 2021, 14, 4233. [Google Scholar] [CrossRef]
- Karatayev, M.; Lisiakiewicz, R.; Gródek-Szostak, Z.; Kotulewicz-Wisińska, K.; Marhaba, N. The promotion of renewable energy technologies in the former Soviet bloc: Why, how, and with what prospects? Energy Rep. 2021, 7, 6983–6994. [Google Scholar] [CrossRef]
- Tilekeyev, K.; Mogilevskii, R.; Abdrazakova, N.; Shoola Dzhumaeva, S. Production and Exports of Kidney Beans in the Kyrgyz Republic: Value Chain Analysis; University of Central Asia–Institute of Public Policy and Administration (IPPA) Working Paper No. 43; Elsevier: Amsterdam, The Netherlands, 2018. [Google Scholar]
- International Reference Life Cycle Data System (ILCD). Handbook—General guide for Life CycleAssessment—Provisions and Action Steps; EUR 24378 EN; Publications Office of the European Union: Luxembourg, 2010; JRC58190.
- Kool, A.; Marinussen, M.; Blonk, H. LCI Data for the Calculation Tool Feed Print for Greenhouse Gas Emissions of Feed Production and Utilization: GHG Emissions of N, P, and K Fertilizer Production. Research Station ART. 2012. Available online: https://blonksustainability.nl/ (accessed on 10 May 2022).
- Nemecek, I.; Schnetzer, J. Methods of Assessment of Direct Field Emissions for LCIs of Agricultural Production Systems Data v3.0 (2012) Research Station ART; Agroscope Reckenholz-Tänikon: Zurich, Switzerland, 2012. [Google Scholar]
- IPCC. IPCC Guidelines for National Greenhouse Gas Inventories; Volume 4: Agriculture, Forestry and Other Land Use. Intergovernmental Panel on Climate Change; IPCC: Geneva, Switzerland, 2006. [Google Scholar]
- Novoa, R.S.A.; Tejeda, H.R. Evaluation of the N2O emissions from N in plant residues as affected by environmental and management factors. Nutr. Cycl. Agroecosyst. 2006, 75, 29–46. [Google Scholar]
- Lisowska, A.; Filipek-Mazur, B.; Komorowska, M.; Niemiec, M.; Bar-Michalczyk, D.; Kuboń, M.; Tabor, S.; Gródek-Szostak, Z.; Szeląg-Sikora, A.; Sikora, J.; et al. Environmental and Production Aspects of Using Fertilizers Based on Waste Elemental Sulfur and Organic Materials. Materials 2022, 15, 3387. [Google Scholar] [CrossRef]
- Forster, P. Changes in Atmospheric Constituents and Radiative Forcing; UN, IPCC Fourth Assessment, Report 2007; IPCC: Geneva, Switzerland, 2007. [Google Scholar]
- Wójcicki, Z. Methodology of examining energy consumption of agricultural production. Probl. Inżynierii Rol. 2015, 23, 17–29. [Google Scholar]
- EPA United States Environmental Protection Agency. Greenhouse Gas Inventory Guidance Direct Emissions from Mobile Combustion Sources; EPA United States Environmental Protection Agency: Washington, DC, USA, 2016; p. 27.
- Audsley, E.; Stacey, K.; Parsons, D.J.; Williams, A.G. Estimation of the Greenhousegas Emissions from Agricultural Pesticide Manufacture and Use; Cranfield University: Cranfield, UK, 2009. [Google Scholar]
- Torrez Irigoyen, R.M.; Giner, S.A. Drying–toasting of presoaked soybean in fluidised bed. Modeling, validation and simulation of operational variants for reducing energy consumption. J. Food Eng. 2016, 171, 78–86. [Google Scholar] [CrossRef]
- Wang, X.J.; Yang, G.H.; Feng, Y.Z.; Ren, G.X. Potential for biogas production from anaerobic co-digestion of dairy and chicken manure with corn stalks. Adv. Mat. Res. 2012, 347, 2484–2492. [Google Scholar] [CrossRef]
- FAO. Global Database of GHG Emissions Related to Feed Crops: Methodology; Version 1. Livestock Environmental Assessment and Performance Partnership; FAO: Rome, Italy, 2017. [Google Scholar]
- Montgomery, D.C. Design and Analysis of Experiments, 3rd ed.; John Wiley & Sons, Inc.: New York, NY, USA, 1991. [Google Scholar]
- Caro, D.; LoPresti, A.; Davis, S.J.; Bastianoni, S.; Caldeira, K. CH4 and N2O emissions embodied in international trade of meat. Environ. Res. Lett. 2014, 9, 114005. Available online: https://iopscience.iop.org/article/10.1088/1748-9326/9/11/114005 (accessed on 17 May 2022). [CrossRef]
- Wiedemann, S.G.; Yan, M.J.; Henry, B.K.; Murphy, C.M. Resource use and greenhouse gas emissions from three wool production regions in Australia. J. Clean. Prod. 2016, 122, 121–132. [Google Scholar] [CrossRef]
- Cottle, D.J.; Cowie, A.L. Allocation of greenhouse gas production between wool and meat in the life cycle assessment of Australian sheep production. Int. J. Life Cycle Assess. 2016, 21, 820–830. [Google Scholar] [CrossRef]
- Bhatt, A.; Abbassi, B. Review of environmental performance of sheep farming using life cycle assessment. J. Clean. Prod. 2021, 293, 126192. [Google Scholar] [CrossRef]
- Huang, W.; Bruemmer, B.; Huntsinger, L. Incorporating measures of grassland productivity into efficiency estimates for livestock grazing on the Qinghai-Tibetan Plateau in China. Ecol. Econ. 2016, 122, 1–11. [Google Scholar] [CrossRef]
- Alcock, D.J.; Harrison, M.T.; Rawnsley, R.P.; Eckard, R.J. Can animal genetics and flock management be used to reduce greenhouse gas emissions but also maintain productivity of wool-producing enterprises? Agric. Syst. 2015, 132, 25–34. [Google Scholar] [CrossRef]
- Sabia, E.; Gauly, M.; Napolitano, F.; Serrapica, F.; Cifuni, G.F.; Claps, S. Dairy sheep carbon footprint and ReCiPe end-point study. Small Rumin. Res. 2020, 185, 106085. [Google Scholar] [CrossRef]
- Bai, Y.; Guo, C.; Li, S.; Degen, A.A.; Ahmad, A.A.; Wang, W.; Zhang, T.; Huang, M.; Shang, Z. Instability of decoupling livestock greenhouse gas emissions from economic growth in livestock products in the Tibetan highland. J. Environ. Manag. 2021, 287, 112334. [Google Scholar] [CrossRef]
- Jeswani, H.K.; Espinoza-Orias, N.; Croker, T.; Azapagic, A. Life cycle greenhouse gas emissions from integrated organic farming: A systems approach considering rotation cycle. Sustain. Prod. Consum. 2018, 13, 60–79. [Google Scholar] [CrossRef]
- Sikora, J.; Niemiec, M.; Tabak, M.; Gródek-Szostak, Z.; Szeląg-Sikora, A.; Kuboń, M.; Komorowska, M. Assessment of the efficiency of nitrogen slow-release fertilizers in integrated production of carrot depending on fertilization strategy. Sustainability 2020, 12, 1982. [Google Scholar] [CrossRef]
- Lazcano, C.; Gonzalez-Maldonado, N.; Yao, E.H.; Wong, C.T.F.; Merrilees, J.J.; Falcone, M.; Peterson, J.D.; Casassa, F.; Decock, C. Sheep grazing as a strategy to manage cover crops in Mediterranean vineyards: Short-term effects on soil C, N and greenhouse gas (N2O, CH4, CO2) emissions. Agric. Ecosyst. Environ. 2021, 327, 107825. [Google Scholar] [CrossRef]
- Rashidov, N.; Chowaniak, M.; Niemiec, M.; Mamurovich, G.S.; Gufronovich, M.J.; Gródek-Szostak, Z.; Szeląg-Sikora, A.; Sikora, J.; Kuboń, M.; Komorowska, M. Assessment of the Multiannual Impact of the Grape Training System on GHG Emissions in North Tajikistan. Energies 2021, 14, 6160. [Google Scholar] [CrossRef]
- MacLeod, M.; Moran, D.; Eory, V.; Rees, R.M.; Barnes, A.; Topp, C.F.E.; Ball, B.; Hoad, S.; Wall, E.; McVittie, A.; et al. Developing greenhouse gas marginal abatement cost curves for agricultural emissions from crops and soils in the UK. Agric. Syst. 2010, 103, 198–209. [Google Scholar] [CrossRef]
- Zach, J.; Korjeni, A.; Petránek, V.; Hroudová, J.; Bednar, T. Performance evaluation and research of alternative thermal insulations based on sheep wool. Energy Build. 2012, 49, 246–253. [Google Scholar] [CrossRef]
- Szeląg-Sikora, A.; Niemiec, M.; Sikora, J.; Chowaniak, M. Possibilities of Designating Swards of Grasses and Small-Seed Legumes from Selected Organic Farms in Poland for Feed. In Farm Machinery and Processes Management in Sustainable Agriculture; IX International Scientific Symposium; Springer: Lublin, Poland, 2017; pp. 365–370. [Google Scholar]
- Böhme, M.H.; Pinker, I.; Grueneberg, H.; Grueneberg, S.; Herfort, S. Sheep wool as fertiliser for vegetables and flowers in organic farming. Acta Hortic. 2012, 933, 195–202. [Google Scholar] [CrossRef]
- Zheljazkov, V.D.; Stratton, G.W.; Pincock, J.; Butler, S.; Jeliazkova, E.A.; Nedkov, N.K.; Gerard, P.D. Wool-waste as organic nutrient source for container-grown plants. Waste Manag. 2009, 29, 2160–2164. [Google Scholar] [CrossRef]
- Górecki, R.S.; Górecki, M.T. Utilization of Waste Wool as Substrate Amendment in Pot Cultivation of Tomato, Sweet Pepper, and Eggplant. Pol. J. Environ. Stud. 2010, 19, 1083–1087. [Google Scholar]
- Bhange, K.; Chaturvedi, V.; Bhatt, R. Ameliorating effects of chicken feathers in plant growth promotion activity by a keratinolytic strain of Bacillus subtilis PF1. Bioresour. Bioprocess. 2016, 3, 13. [Google Scholar] [CrossRef]
- Fernández-Luqueño, F.; Reyes-Varela, V.; Martínez-Suárez, C.; Reynoso-Keller, R.E.; Méndez-Bautista, J.; Ruiz-Romero, E.; López-Valdez, F.; Luna-Guido, M.L.; Dendooven, L. Emission of CO2 and N2O from soil cultivated with common bean (Phaseolus vulgaris L.) fertilized with different N sources. Sci. Total Environ. 2009, 407, 4289–4296. [Google Scholar] [CrossRef]
- Lindberg, L.; Ermolaev, E.; Vinnerås, B.; Lalander, C. Process efficiency and greenhouse gas emissions in black soldier fly larvae composting of fruit and vegetable waste with and without pre-treatment. J. Clean. Prod. 2022, 338, 130552. [Google Scholar] [CrossRef]
- Šarauskis, E.; Romaneckas, K.; Jasinskas, A.; Kimbirauskienė, R.; Naujokienė, V. Improving energy efficiency and environmental mitigation through tillage management in faba bean production. Energy 2020, 209, 118453. [Google Scholar] [CrossRef]
- Kuboń, M.; Niemiec, M.; Klimek-Kopyra, A.; Gliniak, M.; Sikora, J.; Sadowska, U.; Latawiec, A.E.; Kobyłecki, R.; Zarzycki, R.; Kacprzak, A.; et al. Assessment of Greenhouse Gas Emissions in Soybean Cultivation Fertilized with Biochar from Various Utility Plants. Agronomy 2021, 11, 2224. [Google Scholar] [CrossRef]
- Kontopoulou, C.-K.; Bilalis, D.; Pappa, V.A.; Rees, R.M.; Savvas, D. Effects of organic farming practices and salinity on yield and greenhouse gas emissions from a common bean crop. Sci. Hortic. 2015, 183, 48–57. [Google Scholar] [CrossRef]
- Xia, L.; Xia, Y.; Li, B.; Wang, J.; Wang, S.; Zhou, W.; Yan, X. Integrating agronomic practices to reduce greenhouse gas emissions while increasing the economic return in a rice-based cropping system. Agric. Ecosyst. Environ. 2016, 231, 24–33. [Google Scholar] [CrossRef]
- Pilecco, G.E.; Chantigny, M.H.; Weiler, D.A.; Aita, C.; Thivierge, M.-N.; Schmatz, R.; Chaves, B.; Giacomini, S.J. Greenhouse gas emissions and global warming potential from biofuel cropping systems fertilized with mineral and organic nitrogen sources. Sci. Total Environ. 2020, 729, 138767. [Google Scholar] [CrossRef]
- Zhang, Z.; Yu, Z.; Zhang, Y.; Shi, Y. Finding the fertilization optimization to balance grain yield and soil greenhouse gas emissions under water-saving irrigation. Soil Tillage Res. 2021, 214, 105167. [Google Scholar] [CrossRef]
- Mona, S.; Malyan, S.K.; Saini, N.; Deepak, B.; Pugazhendhi, A.; Kumar, S.S. Towards sustainable agriculture with carbon sequestration, and greenhouse gas mitigation using algal biochar. Chemosphere 2021, 275, 129856. [Google Scholar] [CrossRef]
- Lam, W.Y.; Sim, S.; Kulak, M.; van Zelm, R.; Schipper, R.A.; Huijbregts, M.A.J. Drivers of variability in greenhouse gas footprints of crop production. J. Clean. Prod. 2021, 315, 128121. [Google Scholar] [CrossRef]
- Shakoor, A.; Shakoor, S.; Rehman, A.; Ashraf, F.; Abdullah, M.; Shahzad, S.M.; Farooqg, T.H.; Ashraf, M.; Manzoor, M.A.; Altaf, M.M.; et al. Effect of animal manure, crop type, climate zone, and soil attributes on greenhouse gas emissions from agricultural soils—A global meta-analysis. J. Clean. Prod. 2021, 278, 124019. [Google Scholar] [CrossRef]
- Hakala, K.; Nikunen, H.-M.; Sinkko, T.; Niemeläinen, O. Yields and greenhouse gas emissions of cultivation of red clover-grass leys as assessed by LCA when fertilised with organic or mineral fertilisers. Biomass Bioenergy 2012, 46, 111–124. [Google Scholar] [CrossRef]
- Kukuła, K. Metoda Unitaryzacji Zerowanej; Wydawnictwo Naukowe PWN: Warszawa, Poland, 2000. [Google Scholar]
- Niemiec, M.; Chowaniak, M.; Sikora, J.; Szeląg-Sikora, A.; Gródek-Szostak, Z.; Komorowska, M. Selected Properties of Soils for Long-Term Use in Organic Farming. Sustainability 2020, 12, 2509. [Google Scholar] [CrossRef]
- Strahl, D.; Walesiak, M. Normalizacja zmiennych w skali przedziałowej i ilorazowej w referencyjnym systemie granicznym. Przegląd Stat. 1997, 44, 69–77. [Google Scholar]
- Zeliaś, A. Some Notes on the Selection of Normalisation of Diagnostic Variables. Stat. Transit. 2002, 5, 787–802. [Google Scholar]
- Duda, J.; Kusa, R.; Pietruszko, S.; Smol, M.; Suder, M.; Teneta, J.; Wójtowicz, T.; Żdanowicz, T. Development of Roadmap for Photovoltaic Solar Technologies and Market in Poland. Energies 2022, 15, 174. [Google Scholar] [CrossRef]
- Velinov, E.; Petrenko, Y.; Vechkinzova, E.; Denisov, I.; Ochoa Siguencia, L.; Gródek-Szostak, Z. “Leaky Bucket” of Kazakhstan’s Power Grid: Losses and Inefficient Distribution of Electric Power. Energies 2020, 13, 2947. [Google Scholar] [CrossRef]
- Niemiec, M.; Szeląg-Sikora, A.; Cupiał, M. Evaluation of the Efficiency of Celeriac Fertilization with the Use of Slow-acting Fertilizers. Agric. Agric. Sci. Procedia 2015, 7, 177–183. [Google Scholar] [CrossRef]
- Szeląg-Sikora, A.; Niemiec, M.; Sikora, J. Assessment of the content of magnesium, potassium, phosphorus and calcium in water and algae from the black sea in selected bays near Sevastopol. J. Elem. 2016, 21, 915–926. [Google Scholar] [CrossRef]
- Gondek, K.; Mierzwa-Herszt, M.; Kopeć, M.; Sikora, J.; Głąb, T.; Szczurowska, K. Influence of Biochar Application on Reduced Acidification of Sandy Soil, Increased Cation Exchange Capacity, and the Content of Available Forms of K, Mg, and P. Pol. J. Environ. Stud. 2019, 28, 103–111. [Google Scholar] [CrossRef]

Publisher’s Note: MDPI stays neutral with regard to jurisdictional claims in published maps and institutional affiliations. |
© 2022 by the authors. Licensee MDPI, Basel, Switzerland. This article is an open access article distributed under the terms and conditions of the Creative Commons Attribution (CC BY) license (https://creativecommons.org/licenses/by/4.0/).