Article

Uniformity of Supply Air in the Plenum for Under-Floor Air Distribution Ventilation in a Circular Conference Room: A CFD Study

1
Thermal Engineering Department, Shandong Jianzhu University, Jinan 250101, China
2
Department of Architecture, Materials, and Structures, SINTEF Community, NO-7465 Trondheim, Norway
3
Shandong Provincial Architecture Design & Research Institute Co., Ltd., Jinan 250014, China
*
Authors to whom correspondence should be addressed.
Energies 2022, 15(17), 6370; https://doi.org/10.3390/en15176370
Submission received: 26 July 2022 / Revised: 23 August 2022 / Accepted: 26 August 2022 / Published: 31 August 2022
(This article belongs to the Special Issue Low Carbon Energy Technology for Heating and Cooling of Buildings)

Abstract

:
Underfloor air distribution (UFAD) systems are increasingly used for their advantages in improving energy savings, indoor air quality, and thermal comfort. In UFAD systems, an underfloor plenum delivers conditioned air to the air supply diffusers. The distribution of internal air velocity and static pressure in plenums determines the uniformity of the airflow to the occupied zones. As a result, the plenum has a detrimental effect on the characteristics of the supply air and, thus, the resulting indoor air quality and thermal comfort. Nevertheless, most existing studies on underfloor plenums focused on small-scale plenums with a single internal air duct. Large plenums and multiple air ducts in UFAD equipped in large premises are underexplored. In this study, a circular underfloor plenum with a large scale (radius of 15 m, height difference of 0.9−2.9 m) and 503 under-seat diffusers in a conference room was studied using computational fluid dynamics (CFD) simulation (ANSYS Fluent (16.0)). The distributions of airflow velocity and static pressure inside the plenum were analyzed and compared to one concentrated air supply mode and three uniform air supply modes. Based on the air velocity at the center of under-seat diffusers, the outgoing airflow uniformity from the diffusers under four cases was evaluated by the index of air velocity uniformity. The results showed that the multiple supply ducts with bottom air outlets yielded the best uniformity of supply air. The findings of this paper are expected to provide a technical basis for realizing the optimal design of the UFAD system in terms of uniformity of supply air.

1. Introduction

As the population grows and living standards improve, energy consumption increases significantly, and climate change becomes a significant concern. The building stock accounts for approximately 40% of the global energy use and about one-third of the total greenhouse gas emissions [1]. Hence, considerable efforts should be devoted to reducing energy use and improving building performance.
Underfloor air distribution (UFAD) is one mechanical air distribution system that delivers conditioned air through diffusers mounted on the plenum [2]. Air is directly supplied to the occupants’ area due to the thermal stratifications caused by occupants’ heat load and is usually exhausted from the ceiling [3]. UFAD systems can provide good indoor air quality and establish desirable thermal comfort conditions for occupied spaces using reduced energy compared to conventional mixing ventilation [4]. Compared with the displacement ventilation (DV) system, the UFAD system delivers the air at higher velocities, typically in a range of 0.5 m/s to 2 m/s, while DV is typically lower than 0.5 m/s. The higher air velocity in UFAD results in higher turbulence and better mixing. More importantly, spaces ventilated with UFAD systems have lower vertical temperature gradients than the DV [5]. UFAD becomes more efficient in high premises, such as theatres, hotel lobbies, showrooms, conference rooms, and worship buildings, as it only conditions the occupied zones rather than the whole space compared to mixing ventilation. [3,4,6].
Plenums are static pressure layers in the lower space of raised floors that stabilize the airflow by converting dynamic pressure to static pressure. The pressure distribution and flow field in the plenum space directly affect the air supply uniformity, and thus the indoor temperature uniformity and thermal environment. Therefore, to obtain air evenly from the plenum, it is necessary to study the uniformity of air velocity and static pressure distribution inside the plenum and at the under-seat diffusers.
The influencing factors of plenum air supply uniformity, such as plenum height, internal structure, and valve resistance, have been studied. Kaish et al. [7] examined the flow field and the pressure distribution in the underfloor plenum of a raised-floor data center using an idealized one-dimensional analytical model. This work developed two dimensionless parameters influencing plenum flow: the pressure variation parameter and the frictional resistance parameter. Results are presented over a range of values of these two parameters in terms of distributions of pressure in the plenum and flow rates through the perforated tiles. Zhang et al. [8] investigated the effects of six raised floor heights (0.2 m, 0.4 m, 0.6 m, 0.8 m, 1 m, and 1.2 m) on three types of under-floor air distributions using CFD. The results showed that increasing the floor height can improve the cooling effect and airflow distribution uniformity. Chen et al. [9] established the CFD model of the under-floor plenum and introduced the imbalance rate as an index to evaluate the influence of the plenum height and the density of the air supply outlet on the airflow uniformity of the plenum. Their results showed that the air supplied from the plenum got more uniform when the plenum height increased and the air supply outlet density decreased. The uniformity of the plenum is improved by having a large distance between the inlet and outlet at the same plenum height.
In addition to the height of the plenum, the internal structure of the plenum, such as the shape and position of its internal air duct and its air outlets, also contribute to airflow and pressure distribution inside the plenum. Wang [2] simulated the underfloor plenum of a theatre using CFD. Numerous vortices were observed at the site of structural mutations, and the supply air velocity of the diffusers beneath the seat differed significantly with evident non-uniformity. Plenum airflow uniformity could be enhanced by improving the position of air ducts and the velocity of air entering the plenum. Kong et al. [10] simulated the underfloor plenum with a height of 170 mm using CFD. The influence of air outlet position and air velocity on the air supply uniformity was studied. The results showed that the supply positions of inlet airflow in the plenum significantly influence the air velocity and air volume outgoing from the ventilation terminal diffusers. Tradat et al. [11] simulated the underfloor plenum of a data center using the CFD method. Their results showed that the partitions eliminated the presence of vortices in the underfloor plenum and thus enabled a more uniform pressure distribution and tile airflow delivery. Lu et al. [12] reviewed the effects of underfloor plenum geometries on the airflow distribution in data centers considering different configurations such as cold and hot aisle containment and vertical exhausted duct systems.
Additionally, the density of the distribution of underfloor diffusers and their resistance coefficient also affect the uniformity of the supply air. Jiang et al. [13] studied part of a plenum in a theatre using CFD. The air volume balance of the system was realized by adjusting the resistance coefficient of the diffuser, and the tuning work was accelerated through CFD simulation. Wang et al. [14] developed a numerical simulation model to simulate airflow distribution in an underfloor plenum of a theatre. The uniformity of air supplied was optimized by adjusting the resistance coefficient of the diffuser. An underfloor plenum model has been developed by Huang et al. [15] to analyze the effects of action radius and diffuser density on the uniformity of supply air in the plenum. As the diffuser density was kept constant, the plenum’s supply air uniformity worsened with increasing action radius. In large plenums, the more diffusers, the more uniform the supply of air.
Over the past few decades, the role of CFD simulation has been quickly evolving with the rapidly growing computational power. With CFD simulations, engineers can design high-quality ventilation systems in less time and with fewer costs since the need for hardware iterations is reduced. CFD has been proven capable of performing complex simulations of turbulent flows with high quality, such as thermal distribution, air velocity, diffusion of contaminants, convection around buildings, and the behavior of smoke in large spaces [16,17]. CFD simulations are extensively utilized to simulate the airflows in buildings and ventilation systems. Hayashi et al. [18] examined the characteristics of contaminated indoor air ventilation in a simplified two-dimensional room model using CFD. Kim et al. [16] carried out a study on the effectiveness of UFAD systems with different inlet air velocities and diffuser locations in a large, high space. CFD software was used to simulate the thermal environment, along with the control variables for a large theater space equipped with a UFAD system. Yang et al. [19] adopted experiment and CFD methods to study the heat transfer upward and downward across the stratified surface in a large space building with a floor-level side wall air-supply system. The results showed that the numerical simulation results could reflect the indoor thermal environment of the scaled model well. Kong et al. [20] used CFD to investigate air temperature stratification in a room with a UFAD system. The CFD predictions were validated against experimental data using a full-size UFAD system. The different supply air conditions and heat loads were discussed. The results showed that the effect of three parameters, heat load, supply volume flux, and supply air velocity, on room air temperature would be expressed by the length scale of the floor supply jet. Kobayashi et al. [21] simulated a floor-supply displacement ventilation system using CFD. The system’s performance with different air change rates, diffuser numbers, furniture arrangement, and cooling loads was further evaluated. Cheong et al. [22] evaluated the thermal comfort conditions of an air-conditioned lecture theater in a tertiary institution using experimental measurement, CFD modeling, and subjective assessment. A CFD tool was used to simulate the indoor comfort parameters, such as temperature, airflow rate, and relative humidity. Corroboration between results from the field measurements and predicted values was conducted. The results showed good distributions of airflow characteristics and temperature gradients, which agreed with empirical measurements. To test the effect of the garage on air quality in the attached house, depending on its air tightness. Nina et al. [23] simulated a garage using CFD. The results of the study showed that the best air quality was when the air freely flowed through the garage door and no gasket was used. To improve ventilation systems and, in consequence, the air quality, Nina et al. [24] also focused on studying the impact of an air terminal device (ATD) with a dynamically changing geometry on the effectiveness of a variable air volume (VAV) ventilation system using CFD. The results of the simulations and the PIV measurements showed that the changes in the geometry of the air terminal device improve the ventilation effectiveness of a VAV system, allowing the system to maintain a constant air throw despite the changing airflow magnitude through the system.
For the use of UFAD systems, a challenging task for designers is to achieve uniform pressures and airflows in underfloor plenums, especially those with large spaces and complex structures. Several studies have focused on the uniform air supply of the plenum using CFD. However, most previously published studies assumed the plenum’s small scale and simple structure. There is a lack of clear understanding concerning the airflow and pressure distributions inside the plenum with large-scale and complex structures, which are often used practically. Moreover, plenum structures are system-dependent and have complexity and particularity for different cases. Providing more examples allows similar projects to be compared more easily. In this paper, a large-scale plenum with a volume of 1343.1 m3 was studied using CFD simulation. Various air duct arrangements and air outlet locations were compared to study their impacts on the pressure distribution and velocity distribution inside the large-scale underfloor plenum.

2. CFD Simulation

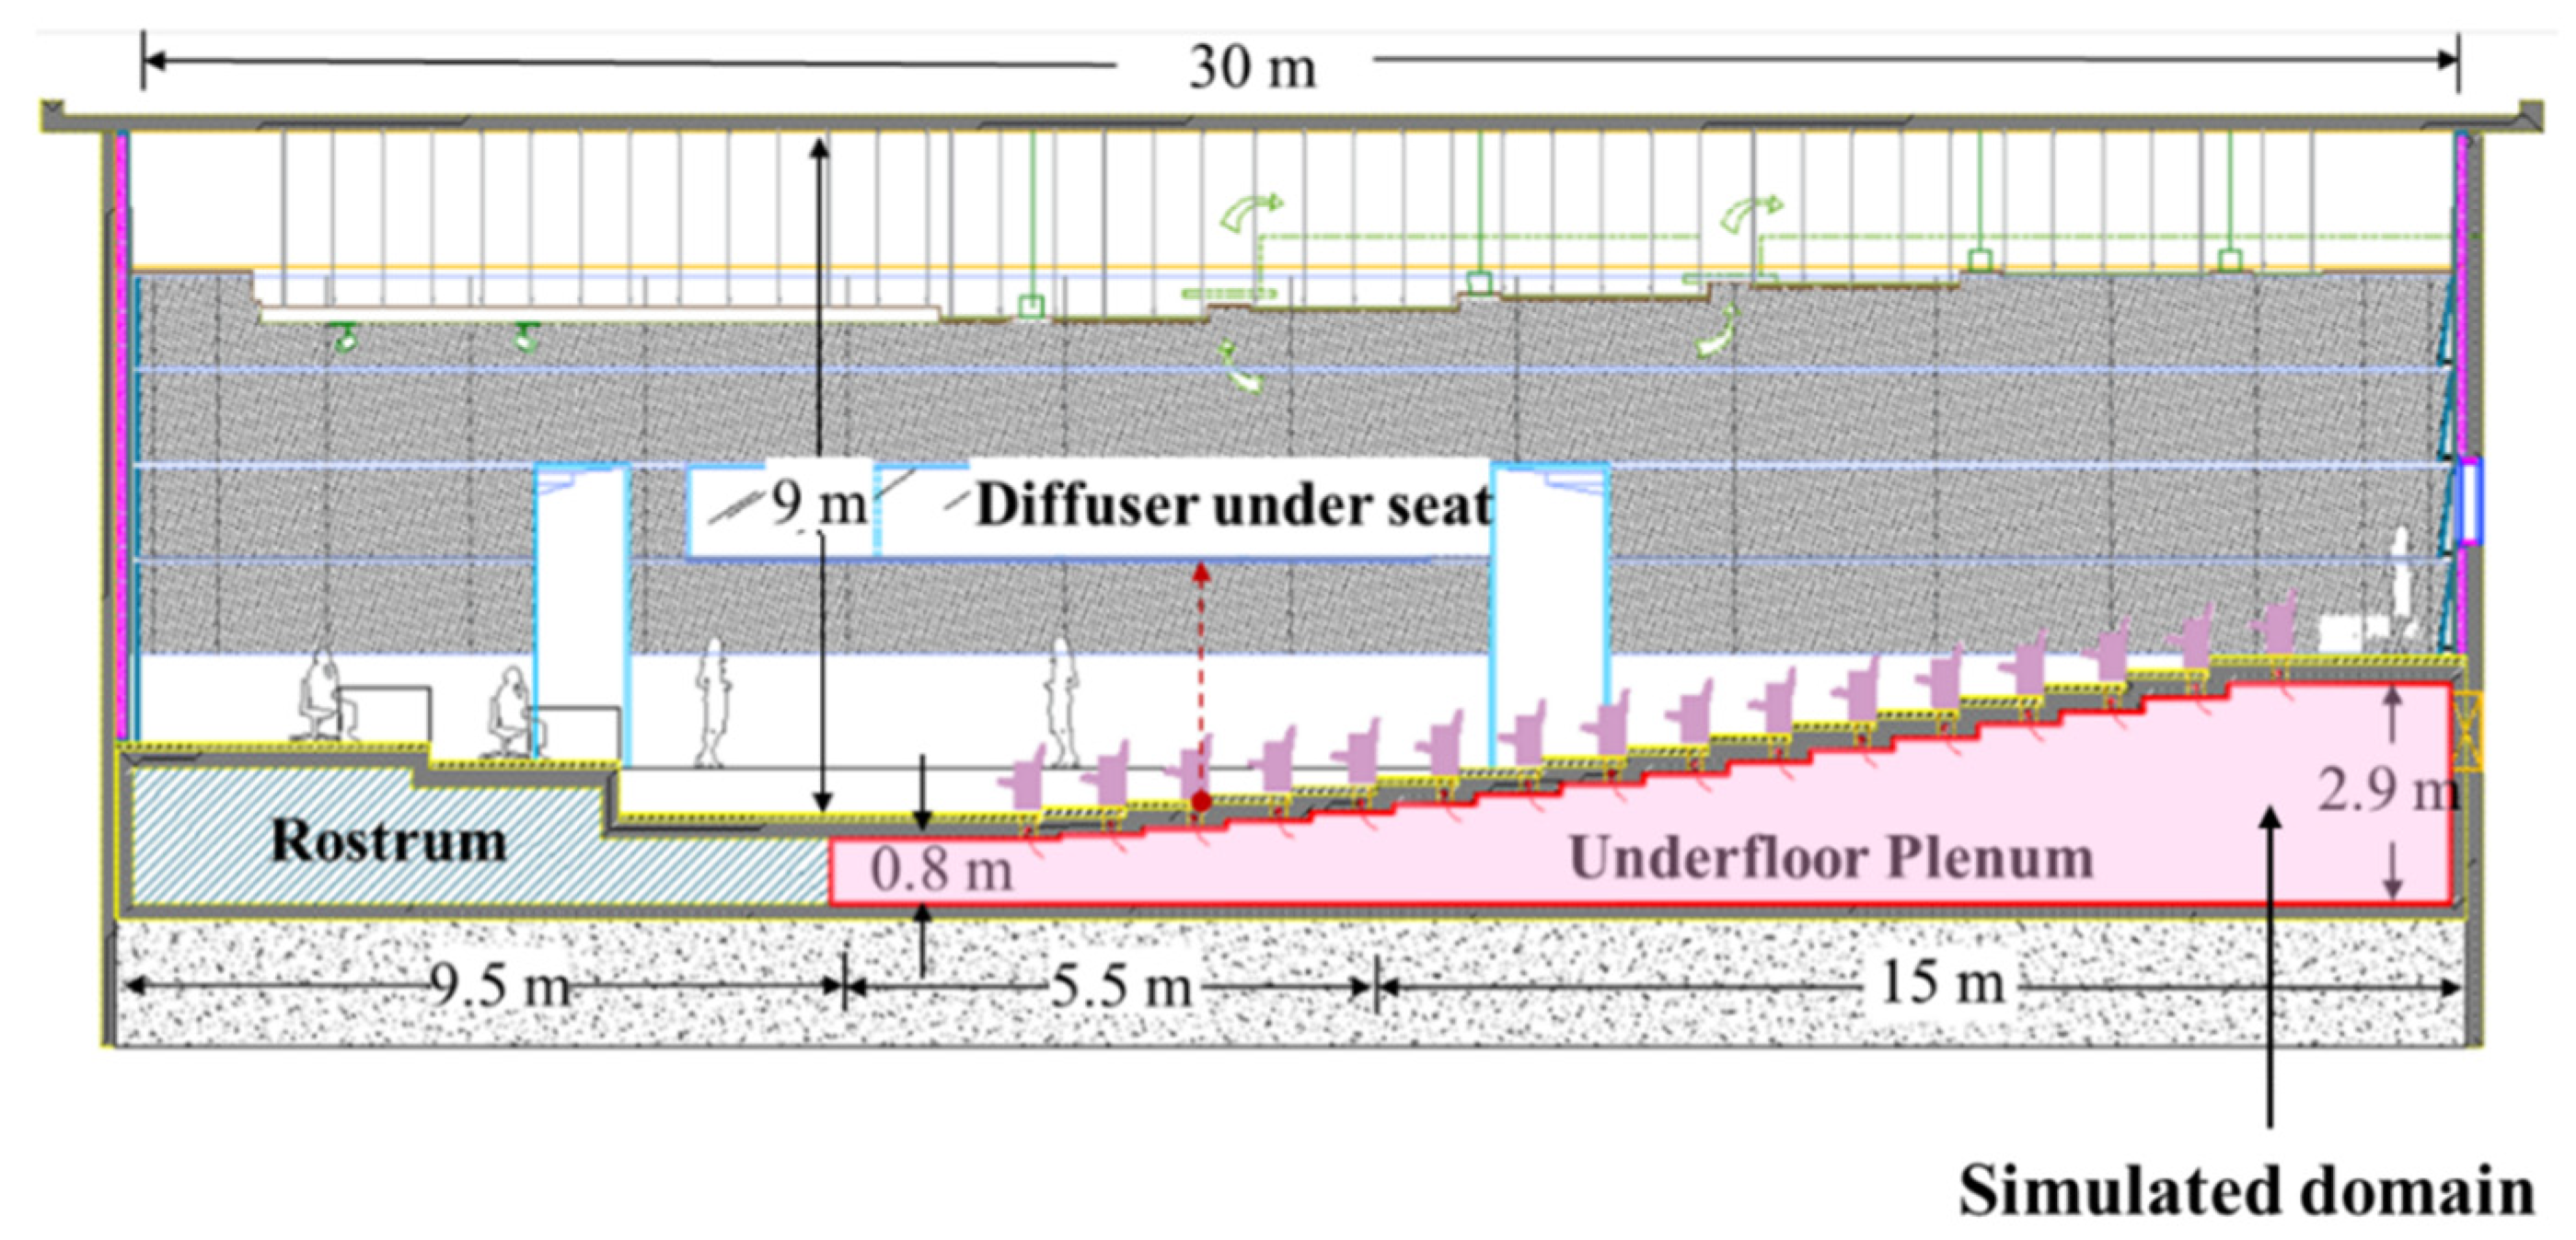
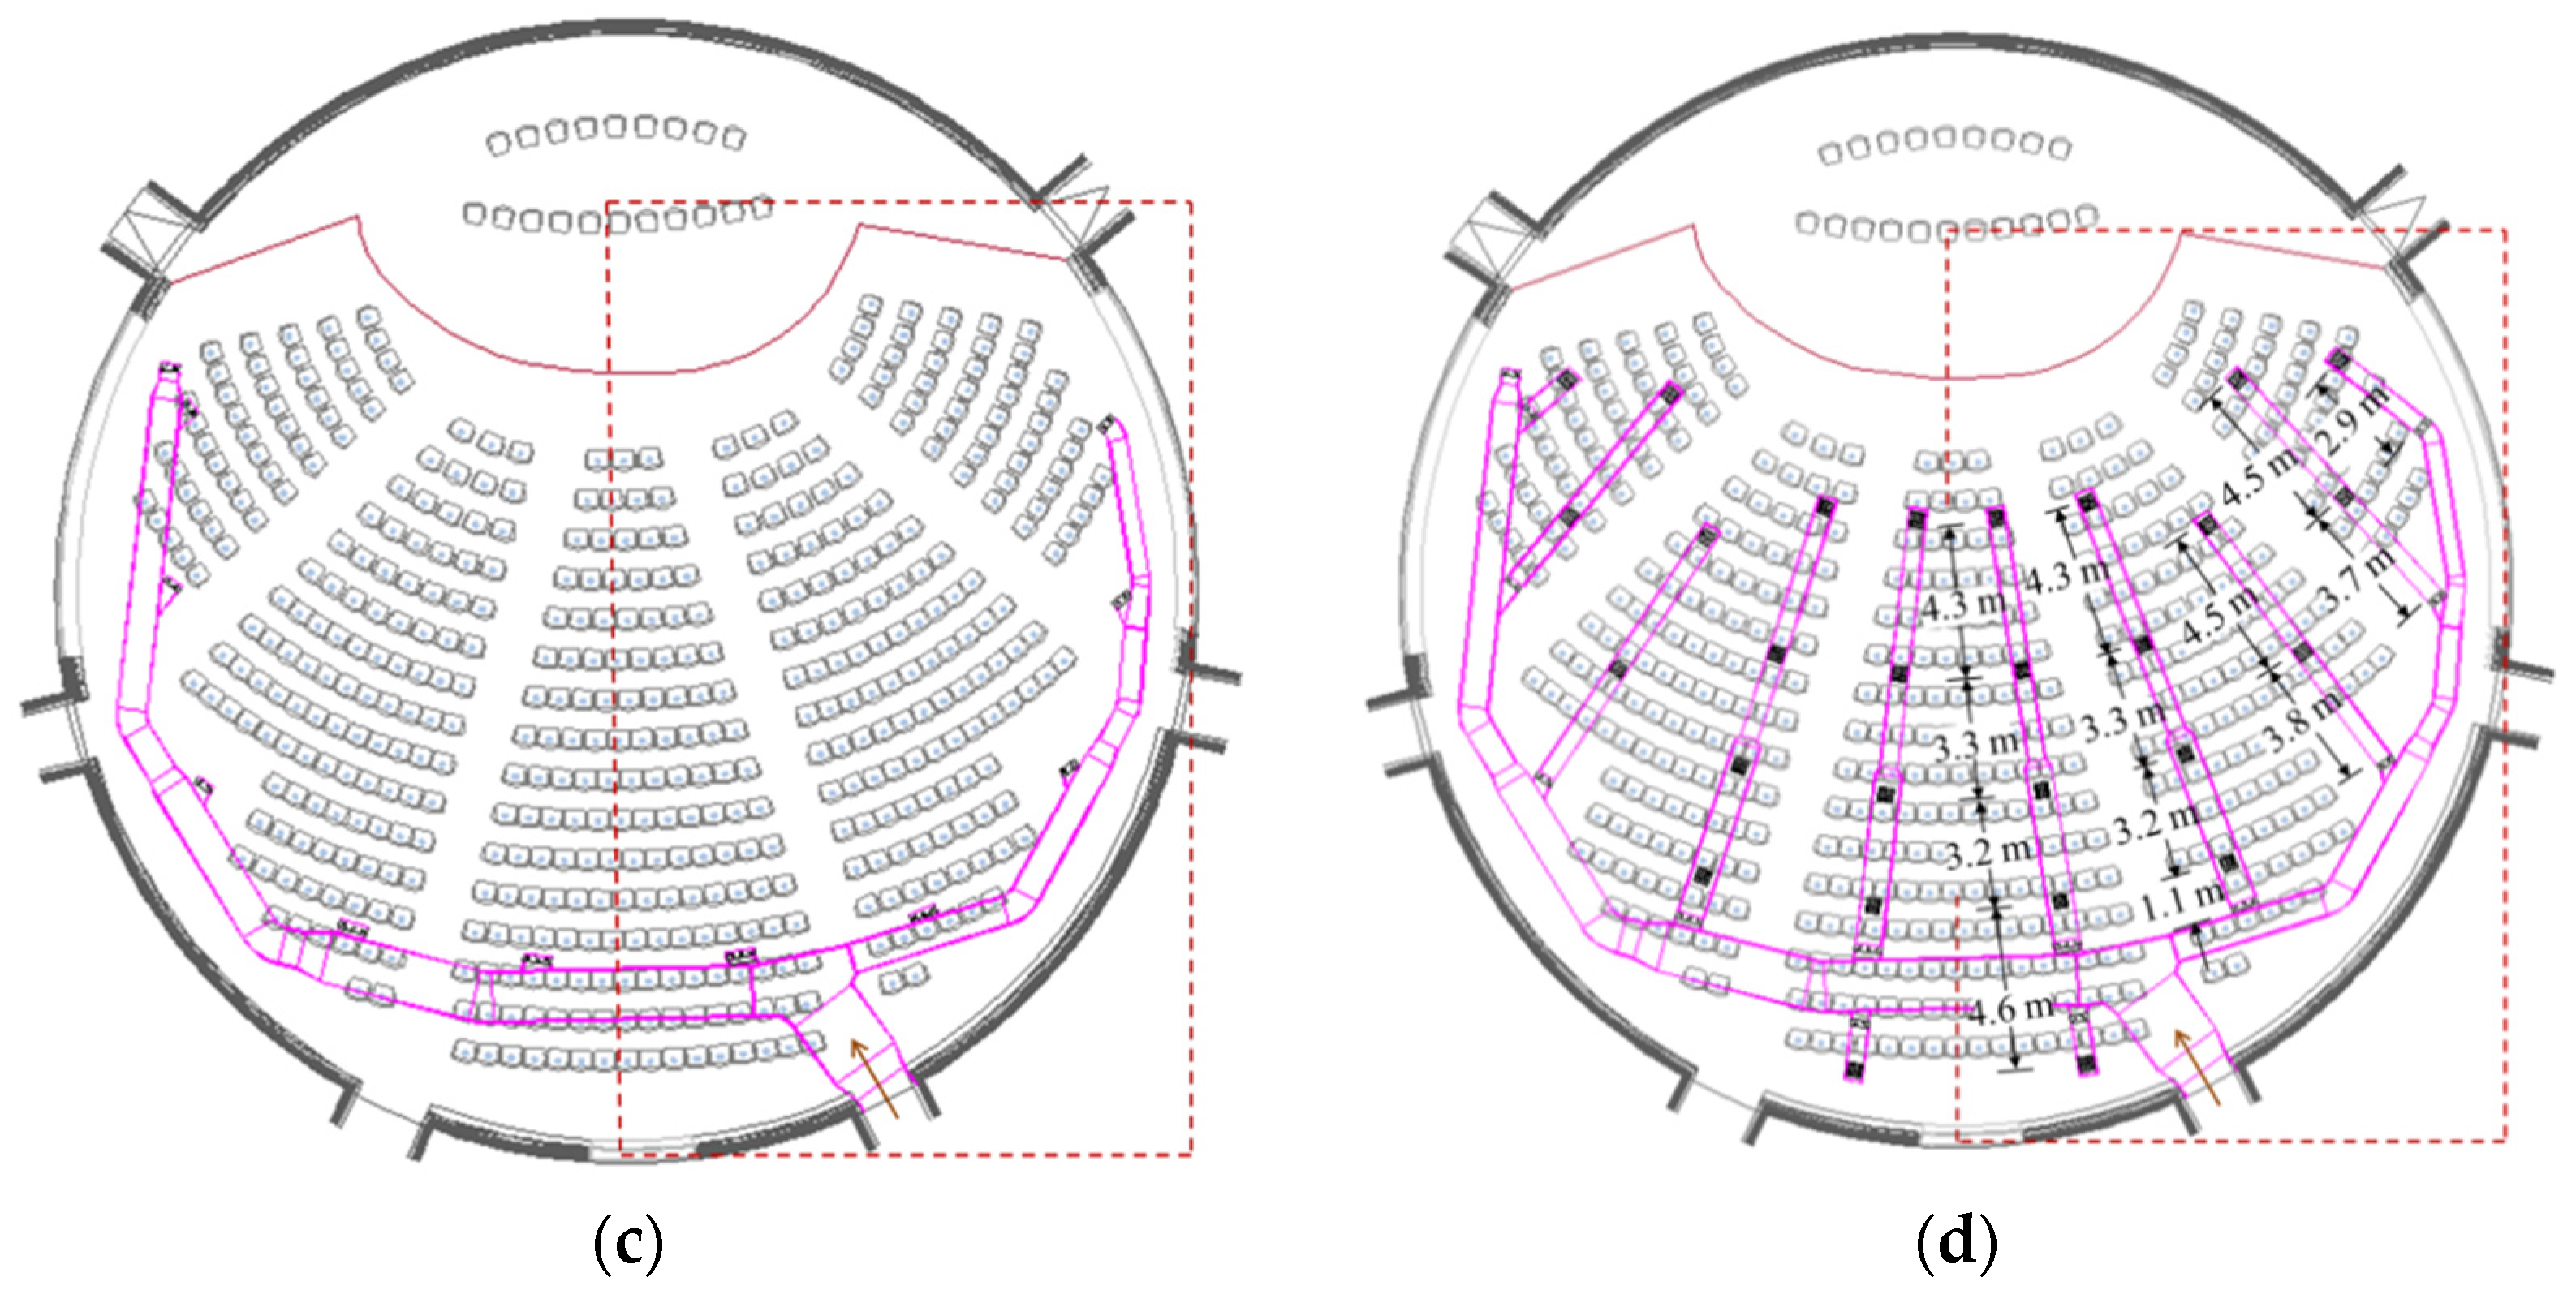
2.1. Three-Dimensional Geometric Model

The target object is a circular conference room located in the UN office building of Dakar (14.7° N, 17.4° W), the capital of Senegal, West Africa. The circular conference room with 503 seats can be seen in Figure 1. It has a height of 9.0 m and a radius of 30.0 m. It consists of a rostrum area and an auditorium area. The rostrum portion is cooled by the up-supply air conditioner, while the auditorium is cooled by UFAD and up-return. The stepped cavity under the audience seating serves as the underfloor plenum, with a radius of 15 m, an area of 707 m2, and a volume of 1343 m3. As the ladder was raised, the plenum’s height gradually increased from 0.8 m to 2.9 m.
The UFAD in the conference room was originally designed as a centralized air supply mode with the main duct located along the inner wall of the plenum, as shown in Figure 2a,c. With a long span, large volume, simple structure, and fewer supply air diffusers, this plenum may require a better air supply scheme to ensure a uniform supply. In this work, air distribution with more uniformity was proposed. Figure 2b,d show that multiple branch ducts connected to the main air duct deliver air from different directions to the interior of the plenum.
To shorten the calculation time and reduce the calculation cost, the right half part of the plenum was selected for modeling, considering the symmetry of the plenum, and the steps on the upper part of the plenum were simplified as an inclined plane. The simplified geometry of the plenum is shown in Figure 3. A total of 238 seat diffusers were included. The diameter of the underfloor diffuser was 150 mm, the left-right spacing of the diffusers was 0.7 m, and the front-right spacing was about 1.1 m.

2.2. Mathematical Model

2.2.1. Governing Equations

According to the characteristics of airflow inside the plenum, the following assumptions were made to simplify the model [2,25]:
(1)
The air inside the plenum is an incompressible Newtonian fluid.
(2)
The fluid in the plenum is a steady flow system whose density and velocity do not change with time. Moreover, the fluid is viscous, and the dissipative heat caused by viscous force is negligible.
(3)
The inner wall of the plenum and the air supply ductwork are well insulated and sealed, so the heat loss and air leakage in the plenum can be neglected.
The governing equations are described in Equations (1) and (2).
Mass equation:
ρ t + ( ρ u i ) x i = 0  
Momentum equation:
    ( ρ u i ) t + ( ρ u i u j ) x i = p x i + x j   ( μ   ρ u i x j ρ u i   u j )  
where ρ is the air density, kg/m3; p is the pressure, Pa; μ is dynamic viscosity, m2/s; ui and uj are average velocity, m/s; ui and uj are fluctuating velocity, m/s; for steady flow system, ρ t = 0 ; ( ρ u i ) t = 0.

2.2.2. Turbulence Model

According to the number of introduced equations, the turbulence models can be divided into a zero-equation model, a one-equation model, and a two-equation model [26]. Both zero-equation and one-equation models are only applicable to quasi-parallel flow, which is difficult to apply in practice [27]. The k-ε two-equation model, including the Standard k-ε model, Realizable k-ε model, and RNG k-ε model, is usually adopted to simulate the airflow distribution [14]. The RNG model is more accurate and reliable than the standard k-ε model for a wider range of flow categories [20]. However, due to extra terms and functions and greater nonlinearity in the control equations, the time cost calculated by the RNG k-ε model is often 10–15% more than that of the standard k-ε model [28]. To summarize, it has been found that the standard k-ε model can be used to simulate the air characteristics in the plenum in ventilation systems due to its sufficient accuracy and acceptable computation cost, such as in references [10,14,15,29,30]. In this study, the standard k-ε model is employed to study the air velocity uniformity in the plenum for the UFAD. In the Standard k- ε model, the fluctuation of air velocity is small, and the velocity remains stable, so it is used to solve the internal airflow field of the plenum. The governing equations for turbulent kinetic energy k and dissipation rate ε are given in Equations (3) and (4) [31,32,33]:
( ρ k ) t + ( ρ ku i ) x i = x j [ ( μ + μ t σ k ) k x j ] + G k + G b ρ ε Y M + S k
( ρ ε ) t + ( k ε u i ) x i = x j [ ( μ + μ t σ ε ) ε x j ] + C 1 ε ( G k + C 3 ε G b ) ρ C 2 ε ε 2 k + S ε  
where μt is turbulent viscosity, μ t = ρ C μ k 2 ε , m2/s; Cμ, C, C are adjustable constants with values of 0.09, 1.44, and 1.92, respectively; μ is dynamic viscosity, m2/s; σk is the Prandtl number of turbulent kinetic energy and is valued as 1; σε is the Prandtl number of turbulent kinetic energy dissipation rate and is valued as 1.3; Gk is turbulent kinetic energy produced by average velocity gradient; Gb is turbulent kinetic energy produced by buoyancy; YM is the fluctuation dilation in compressible turbulence; Sk and Sε are source terms; k is turbulent kinetic energy, m2/s2; ε is the turbulent kinetic energy dissipation rate.

2.3. Boundary Conditions

The inlet boundary of the plenum is the outlet of the air supply ducts. They are set as velocity inlets, and the velocities are calculated by the air volume and outlet area. The air supply temperature at all inlets is 293.15 K.
The outlet boundary of the plenum is the underfloor diffuser near the seat. They are set as the pressure outlet, and the pressure value is set as 10 Pa [12,13]. The influence of the air volume control valve at the diffuser was ignored.

2.4. Grid Generation

Given the complex air ducts inside the plenum, the unstructured grid was used for meshing the model geometry. The background mesh was encrypted near critical locations, such as airflow duct inlets and outlets, as well as underfloor diffusers. To improve the calculation accuracy of the near-wall surface, an inflation grid was adopted for the surface of the air duct inside the plenum.
Four different grid schemes were selected for simulation, corresponding to 1.0 × 10⁷, 1.3 × 10⁷, 1.8 × 10⁷, and 2.0 × 10⁷ grid cells, respectively. To investigate grid independence, monitoring points were placed at the center of the underfloor diffusers. The corresponding air velocities of the selected monitoring point were shown in Figure 4, corresponding to 1.8 × 10⁷ and 2.0 × 10⁷ grid cells were 2.225 m/s and 2.248 m/s. The error between these two simulated grid schemes was small, and the air velocity of the monitoring point tended to be stable. The deviation between the air velocity at the monitoring points with 1.8 × 10⁷ grid cells and 2.0 × 10⁷ grid cells is within 5%. Therefore, the grid division scheme with 1.8 × 10⁷ grid cells was selected in this study. In the whole computational domain, most of the y+ values from the wall surfaces are between 30 and 300, which satisfy the standard wall function requirements [34,35]. The grid layout of the plenum is shown in Figure 5.
The quality of the mesh is detected by the mesh inspection tool of ANSYS 16.0 software and shown in Table 1.

2.5. Solver Algorithm

ANSYS Fluent (16.0, ANSYS Inc., Pittsburgh, PA, USA) [36] software was used to simulate the airflow inside the plenum. To ensure the accuracy and reliability of the simulation, the SIMPLE (Semi-Implicit Method for Pressure-Linked Equation) algorithm was employed to solve the pressure-velocity coupling. The pressure field was iteratively corrected [10]. The convection term in the control equation was discretized by the second-order upwind scheme, and the diffusion term was discretized by the central difference scheme. The variation in the residuals was checked, and the under-relaxation factor was determined if the residual was less than 10−5 and the velocity of the monitored point reached a steady state with the increasing calculation steps.

3. Simulation Setting and Evaluation Indicator

3.1. Studied Cases

Four cases, including different air supply duct layouts and different air outlet positions, as shown in Figure 6, were studied to compare their air supply uniformity.
The centralized air supply mode, shown in Figure 6a, delivers air to the plenum through five outlets on the side wall and enters the room through under-seat diffusers. The velocities of five air outlets are shown in Table 2.
As shown in Figure 6b–d in uniform air supply mode, the rectangular air supply branches extend to the far end of the plenum. There are 14 air outlets on the branches, each with a size of 400 × 400 mm and an air velocity of 2.33 m/s. These branches were balanced by adjusting the openings of the dampers. The position of the air outlets is shown in Figure 2d. Air outlets are located on the upper surface of the air supply duct in case B, on the side surface in case C, and on the bottom surface in case D.

3.2. Evaluating Indicators

(1)
Non-uniformity coefficient
The non-uniformity coefficient was used to evaluate the uniformity of airflow velocity inside the plenum and air velocity at the under-seat diffusers. The smaller the non-uniformity coefficient, the more uniform the airflow distribution. To obtain the non-uniformity coefficient, n monitoring points in the working area were selected, and the arithmetic average of their velocity u ¯ was calculated as given by Equation (5):
u ¯   = u i n  
The root mean square deviation w u is calculated by Equation (6):
w u = ( u i u ¯ ) 2 n
The non-uniformity coefficient is defined in Equation (7):
k u = w u u ¯
where u is air velocity, m/s; n is the number of monitoring points; ku is the non-uniformity coefficient.
To select measuring points to get the non-uniformity coefficient, cross-sections were made at y1 = 0.009 m, y2 = 0.709 m, and y3 = 1.409 m in the plenum, and measuring points were selected along the X axis and Z axis with a 2 m interval. Air velocities of the monitoring points were derived from the CFD calculation results, and the non-uniformity coefficients of monitoring points at y1, y2, and y3 sections under four cases were calculated. This way, the uniformity of airflow velocity distribution at different sections under different cases was characterized.
Moreover, based on the CFD simulation results, the air velocities at the centers of 238 underfloor diffusers were calculated, along with their non-uniformity coefficients.
(2)
Velocity limit at diffuser outlet
To reduce the draft issue to the occupants caused by the high air velocities and ensure the thermal comfort environment of the occupied zone, air supply velocity at under-seat diffusers should be limited to no more than 2 m/s for UFAD [37].

4. Results and Discussion

4.1. Velocity and Static Pressure Field of Plenum Chamber

For different cases, the airflow velocity vector diagram at a cross-section of y = 0.71 m, as well as velocity contours and static pressure contours at a vertical section of x = 7.62 m, were discussed.

4.1.1. Centralized Air Supply Mode

For case A, airflow velocity vectors at the section of y = 0.71 m are shown in Figure 7. The dashed box in Figure 7 represents the local vortex region, whose contours of velocity and pressure distribution are illustrated in Figure 8. In Figure 9, velocity contours and pressure distribution are shown at section x = 7.62 m.
As can be seen in Figure 7, the air supply duct outlets are numbered 1–5 from left to right. Outlet 1 has enough space to develop, so its outflow is close to the free jet. Affected by the direction of the air supply duct, the airflow from outlet 2 and outlet 3 interfere with each other and overlap at the end, which increases the air velocity after confluence. Depending on the momentum component of the inclined jet in the horizontal direction, the transverse entrainment energy of the airflow is enhanced, resulting in a recirculation zone. Airflow from outlet 4 is involved and disturbed. In addition, due to the low height and limited space at the end of the plenum, the vortex is formed at outlet 5.
As shown in Figure 8, the generation of vortexes intensified airflow disturbance inside the plenum, resulting in the extremely non-uniformity of airflow velocity and static pressure distribution. The maximum velocity at the recirculation zone of outlet 2 and outlet 3 is about 1.03 m/s, while the velocity in the vortex center is as low as 0.07 m/s. The outflow velocities of outlet 5 are between 0.11 m/s and 1.08 m/s. The maximum static pressure difference of 2.29 Pa occurs at outlet 4, with a maximum pressure of 12.76 Pa and a minimum of 10.47 Pa.
Figure 9a illustrates the velocity distribution of the plenum at the vertical- section of x = 7.62 m under case A. Combined with Figure 8, it can be seen that the generation of local vortices also strengthens the airflow disturbance at the upper and bottom surfaces of the plenum, resulting in non-uniform airflow distribution.
As represented in Figure 9b, in the narrow space at the end part of the plenum, air velocity increases, and a strong compression effect is generated, resulting in a high static pressure value of 12.27 Pa. On the contrary, at the front part of the plenum, with the increase of the plenum height and the weakening of the airflow compression effect, the static pressure gradually decreases to about 11.10 Pa.

4.1.2. Uniform Air Supply Mode

Compared with the centralized air supply mode, the uniform air supply system has the same air volume and 9 more air outlets. That is, the air volume of each outlet is smaller, and the air supply velocity is lower. For cases B, C, and D, velocity vector distributions at y = 0.71 m are illustrated in Figure 10. The pressure and velocity contours are illustrated in Figure 11 and Figure 12, respectively.
Compared with Figure 7, the airflow exhibited in Figure 10 is more uniform, and airflow tracks from 14 outlets are parallel to each other with less interference. The local airflow disturbance is effectively avoided.
As shown in Figure 10a,c, if the outlets are located on the top or bottom of the duct, the outlet flow will first reach the plenum walls and then be blocked, forming a dense but low-velocity vortex with little disturbance to the surrounding flow. If the air outlet is set on one side of the duct, as shown in Figure 10b, the airflow with high velocity will directly reach the wall of the adjacent duct and then be reflected back. Accordingly, high-velocity vortexes form in the square area surrounded by the wall of the air supply duct and the outflow air, which enhances the disturbance to the surrounding airflow.
The static pressure distribution is directly related to the uniformity of airflow [14]. The more uniform the static pressure distribution, the more even the airflow velocity distribution. By comparing Figure 11 with Figure 9b, it can be seen that the three cases under uniform air supply mode have a more uniform pressure field and smaller pressure difference than in centralized air supply mode. Among them, case B has the most uniform pressure field, and most of the static pressure ranges from 11.64 Pa to 11.70 Pa, except for 13.50 Pa near the air outlets.
As exhibited in Figure 12a, most air blown out by top outlets reaches the occupied zone after being sent directly to the upper wall of the plenum, while a small portion diffuses into the plenum. In the case of bottom outlets, the blown air enters the lower wall of the plenum and is then returned to the underfloor diffuser after slowing down, as shown in Figure 12c. In case C, outlets are placed on the right side of the duct, and local vortexes between the air outlets and ducts cause the velocity non-uniformity in the plenum, as shown in Figure 12b.

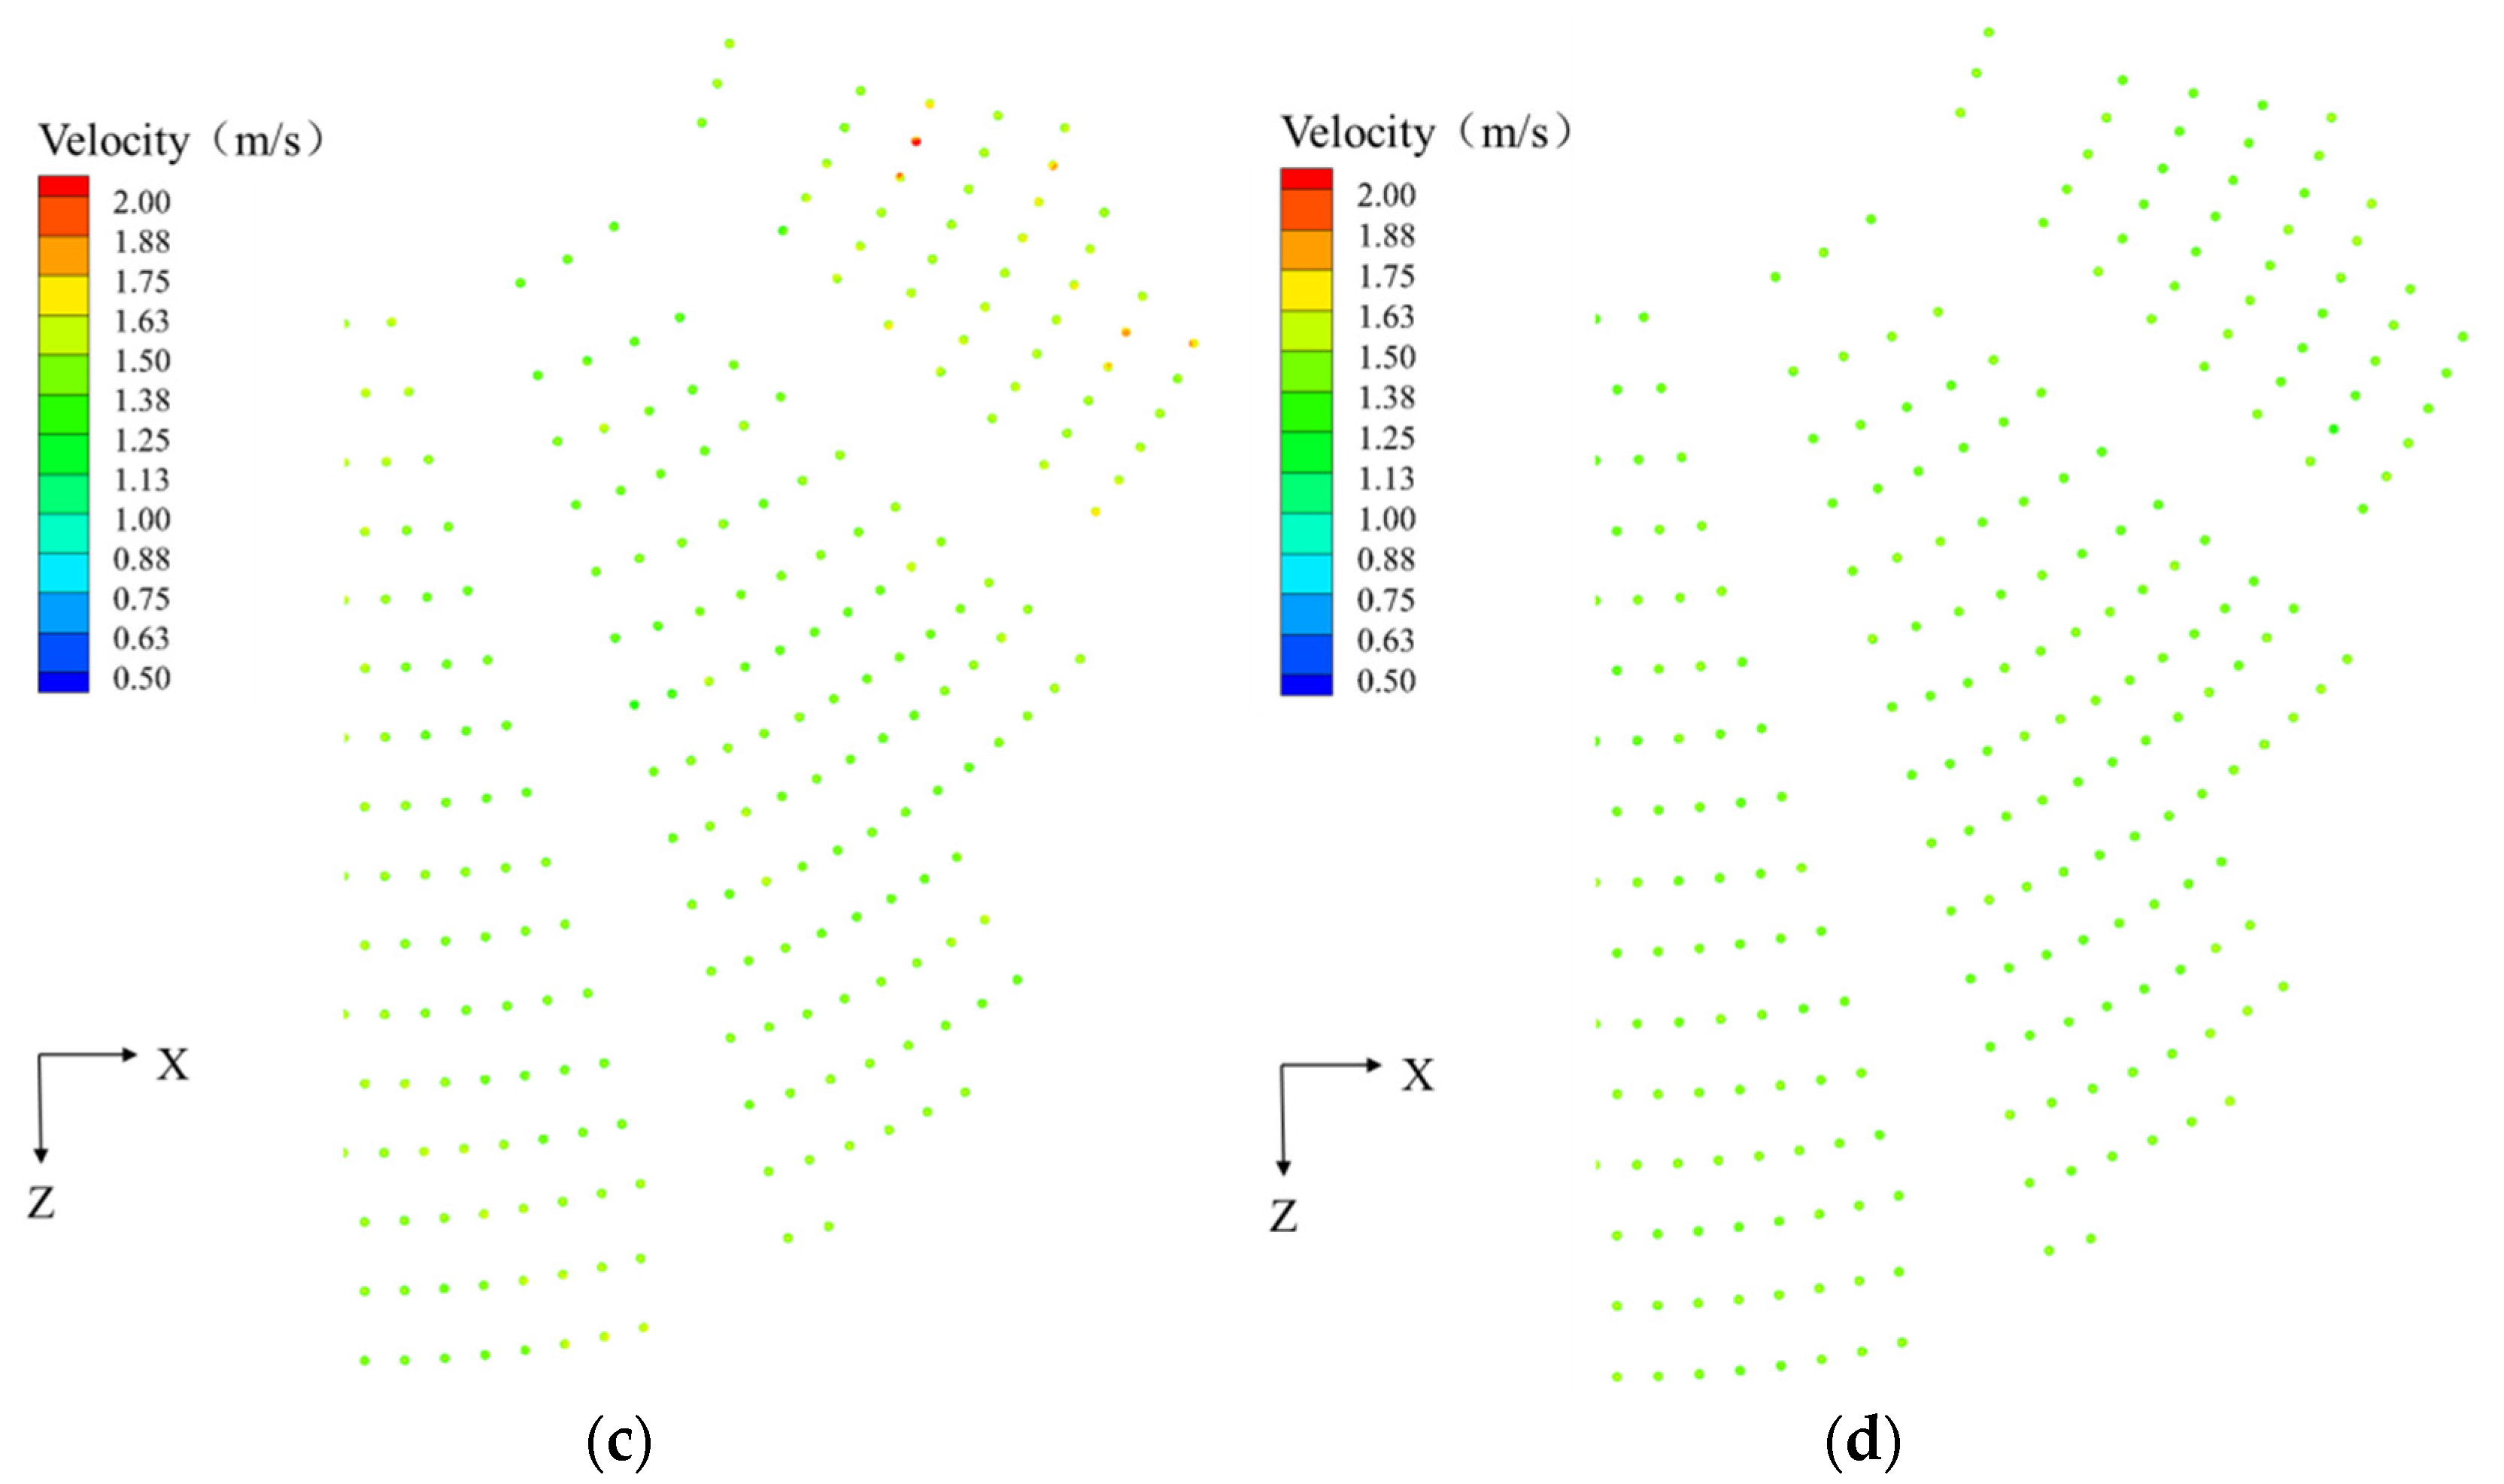
4.2. Velocity of the Seat Air Outlet

In the circular conference room, UFAD sends conditioned air up through an under-seat diffuser to create the “Personal Air Conditioner”. As previously stated, the uniformity of the air supply velocity at the diffusers significantly affects the indoor airflow uniformity and thermal comfort environment of the conference room. Therefore, it is necessary to examine the airflow velocity uniformity of the diffuser outlets. The contours of the velocity distribution of the diffusers in four cases are illustrated in Figure 13.
It can be seen from Figure 13 that the velocity distribution of diffusers in case D is the most uniform, with no noticeable velocity difference across all seating areas. The velocity distribution in case B is the most non-uniform, followed by case A.
In case B, the airflow from the upper outlets can directly reach the under-seat diffusers, so the diffuser outlet velocities are high, with a maximum velocity of 3.51 m/s. For case A, the air supply velocities of diffusers in the middle and rear of the seating area vary greatly, and the velocity in the front area is uniform but relatively high. For Case A and B, excessive air velocity may lead to draft issues and, thus, local thermal discomfort. For case C, all diffusers are reasonably uniform in speed except the five in the right area.
Figure 14 shows the air velocity distribution at the center of each seat diffuser. It can be seen that the air velocity of diffusers in case D is the most uniform, with a velocity between 1.48–1.52 m/s. There are also large variations in velocity in case A and case B. Approximately 1.6% of the diffusers in case A exceed 2 m/s, whereas in case B, the number of diffusers exceeding 2 m/s is 40, corresponding to 17%.
In summary, in case D, uniform air supply mode with bottom air outlets, the air velocity distribution is the most uniform.

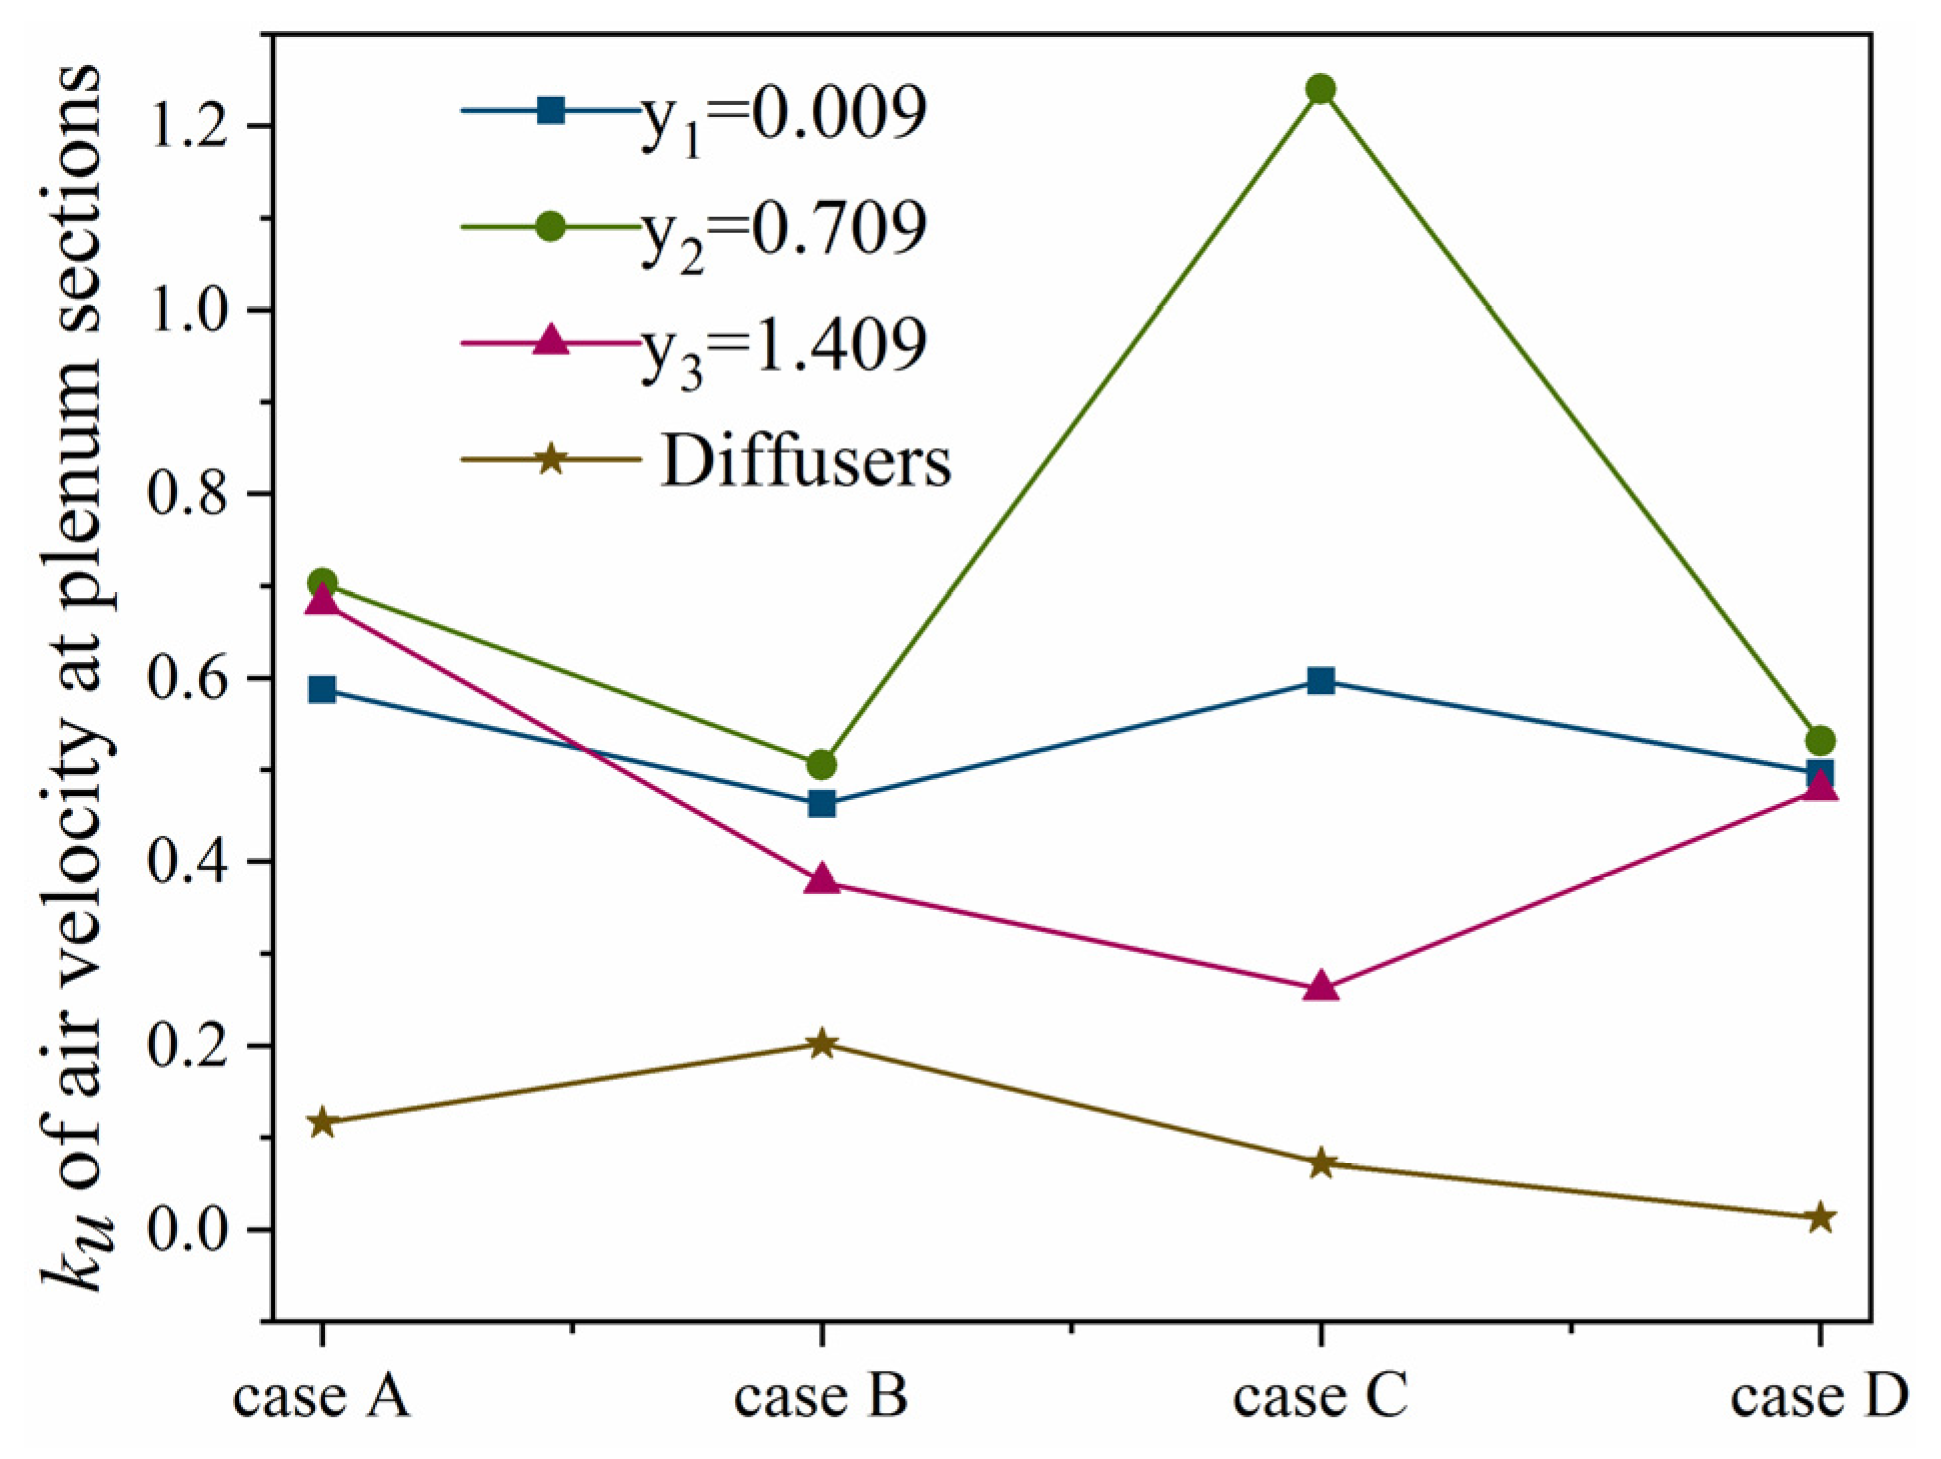
4.3. Air Velocity Non-Uniformity Coefficient

In different cases, the non-uniformity coefficients of air velocity at three cross-sections of the plenum and under-seat diffusers are shown in Figure 15.
As illustrated in Figure 15, the non-uniformity coefficients of air velocity at the plenum sections in case B and case D are relatively low, which indicates that the placement of air outlets on the upper surface and bottom surface in the ducts can significantly improve the uniformity of airflow distribution inside the plenum. Furthermore, the non-uniform coefficient of airflow velocity at diffusers in case D is 0.013, less than 0.202 in case B. Considering uniformity of airflow both in the plenum and underfloor diffusers, case D is the most optimal scheme.

5. Discussion

The plenum in a UFAD system, equipped in a circular conference room in the UN office building in West Africa, was selected as the study case. As initially designed, the UFAD system supplied air from the floor through a centralized system. To improve the current design, the UFAD with a more uniform distribution was proposed and studied using CFD. It should be noted that the simulation results were not verified against any field measurement due to the uncompleted construction of this studied conference room. The conclusion that a plenum with more outlets and outlets at the bottom of the duct can provide a more uniform air supply is consistent with the results in reference [38]. The verification is expected to be performed in the future.
To reduce the complexity of 3D modeling, the physical model of the plenum was simplified by treating the top steps of the plenum as an inclined plane and neglecting the existence of the internal structural beam in the plenum. However, the stairs and internal structural beams inevitably cause disturbance to the flow velocity and static pressure distribution in the plenum to some degree. For more accurate simulation results, the above two factors should be considered.
For four cases, non-uniformity coefficients of airflow velocity at cross-sections of the plenum and diffuser center were evaluated. Since there are some limitations in the selection of limited measuring points, the non-uniformity coefficient cannot be used as the sole indicator of airflow velocity distribution in the plenum. In light of this, this work considered both the non-uniformity coefficient and the distribution of velocity and pressure. Additionally, plenum height and regulating valves influence airflow and pressure distribution. However, these factors have been discussed in other studies and are not covered in this research.
At the time of reporting this work, it was impossible to conduct the measurements as the studied conference room was under construction. Efforts have been made to search for relevant measurements or validated simulations. To our knowledge, the measurements or validated simulations, which can be comparable to this study, are scarce. Among other conditions, the specifications of the studied plenums, boundary conditions, and scale of the UFAD systems are quite case-dependent. As a result, the results or conclusions may not be directly generalized to compare with other studies. Field measurements are planned to be performed to validate the current CFD simulations in the future.

6. Conclusions

This study investigates the uniformity of the air velocity with different ductwork arrangements and outlet positions in the plenum for the UFAD in a large circular conference room. The findings can be used as a theoretical basis to optimize the plenum design in UFAD to obtain better air velocity uniformity and improve indoor thermal comfort. In comparison with previous studies, the current research sheds new light on the improved air supply design in the plenum, considering both air velocity contours and non-uniformity coefficient. For the first time, the plenum in UFAD for such a large system is simulated with CFD. The findings reported in this study should contribute to a better understanding of the airflow characteristics in the plenum of UFAD and facilitate the use of UFAD for large rooms.
The simulated plenum in this paper has a circular structure, large-scale (radius of 15 m), big height difference (height of 0.9~2.9 m), and numerous underfloor diffusers (up to 503). This type of air supply uniformity in a plenum has rarely been studied using the CFD method. The results in this paper can be used as a basis for suggesting the UFAD system design, especially for UFAD with larger scale and complex structured plenums.
The main conclusions are as follows:
In a centralized air supply layout, airflow from the outlet interferes with each other, resulting in local vortexes and a highly non-uniform airfield inside the plenum. As a result of adding branches extending into the plenum, i.e., uniform air supply mode, outflows become parallel to one another with less interference. Thus, multiple branches can reduce local disturbance and improve air velocity and pressure distribution uniformity in the plenum.
A bottom surface outlet (case D) will cause the air outflow to be blocked and slowed down before reaching the diffuser, resulting in dense yet low-velocity vortices. Compared with case B (top outlets) and case C (side outlets), case D maintains good uniformity in the plenum and increases uniformity at the diffusers by reducing the influence of air flow pressure.
The air velocity distribution at different cross-sections in the plenum and diffuser centers was further quantified by the air velocity non-uniformity coefficients. The results show that case D has the lowest velocity non-uniformity coefficient and low non-uniformity coefficient at three horizontal sections of the plenum. A uniform air supply with bottom outlets (case D) is the best scheme based on airflow distribution and non-uniformity coefficients.

Author Contributions

Conceptualization, T.Y. and X.L.; methodology, T.Y., P.L. and X.L.; software, T.Y. and X.F.; validation, T.Y. and X.F.; formal analysis, T.Y. and X.F.; investigation, X.F. and T.Y.; data curation, T.Y. and X.F.; visualization, X.F.; supervision, T.Y. and P.L.; project administration, T.Y. and P.L.; funding acquisition, T.Y. All authors have read and agreed to the published version of the manuscript.

Funding

This research and the APC were funded by the Natural Science Foundation of Shandong Province (ZR2019MEE083) and Shandong Province Science and Technology SMEs Innovation Enhancement Project (2022TSGC1096).

Institutional Review Board Statement

Not applicable.

Informed Consent Statement

Not applicable.

Conflicts of Interest

The authors declare no conflict of interest.

Nomenclature

u ¯ arithmetic average velocity of measuring points (m/s)
Cμ, C, Cadjustable constants
Gbturbulent kinetic energy produced by buoyancy
Gkturbulent kinetic energy produced by average velocity gradient
kunon-uniformity coefficient
wuroot mean square deviation (m/s)
nnumber of monitoring points
ppressure (Pa)
Ssource term
uair velocity (m/s)
uiaverage velocity (m/s)
uifluctuating velocity (m/s)
YMfluctuation dilation in compressible turbulence
μtturbulent viscosity (m2/s)
σPrandtl number
Abbreviation
CFDcomputational fluid dynamics
UFADunderfloor air distribution
Greek symbols
μdynamic viscosity (m2/s)
ρdensity (kg/m3)
kturbulent kinetic energy
εturbulent kinetic energy dissipation rate

References

  1. Ruparathna, R.; Hewage, K.; Sadiq, R. Improving the energy efficiency of the existing building stock: A critical review of commercial and institutional buildings. Renew. Sustain. Energy Rev. 2016, 53, 1032–1045. [Google Scholar] [CrossRef]
  2. Wang, Y.M. Simulation and Optimization of Underfloor Air Distribution in Theatre. Master’s Thesis, Central South University, Changsha, China, May 2011. [Google Scholar]
  3. Nada, S.A.; El-Batsh, H.M.; Elattar, H.F.; Ali, N.M. CFD investigation of airflow pattern, temperature distribution and thermal comfort of UFAD system for theater buildings applications. J. Build. Eng. 2016, 6, 2–52. [Google Scholar] [CrossRef]
  4. Shokrollahi, S.; Hadavi, M.; Heidarinejad, G.; Pasdarshahri, H. Multi-objective optimization of underfloor air distribution (UFAD) systems performance in a densely occupied environment: A combination of numerical simulation and Taguchi algorithm. J. Build. Eng. 2020, 32, 101495. [Google Scholar] [CrossRef]
  5. Lee, K.; Zhang, T.F.; Jiang, Z.; Chen, Q.Y. Comparison of Airflow and Contaminant Distributions in Rooms with Traditional Displacement Ventilation and Under-Floor Air Distribution Systems. ASHRAE Trans. 2009, 115, 306–321. [Google Scholar]
  6. Alajmia, A.; El-Amer, W. Saving energy by using underfloor-air-distribution (UFAD) system in commercial buildings. Energy Convers. Manag. 2010, 51, 1637–1642. [Google Scholar] [CrossRef]
  7. Karki, K.C.; Patankar, S.V. Airflow distribution through perforated tiles in raised-floor data centers. Build. Environ. 2006, 41, 734–744. [Google Scholar] [CrossRef]
  8. Zhang, M.; Zhang, Z.B.; Hu, Y.; Geng, Y.; Huang, H.; Huang, Y. Effect of raised floor height on different arrangement of under-floor air distribution performance in data center. Procedia Eng. 2017, 205, 556–564. [Google Scholar] [CrossRef]
  9. Chen, Y.; Zhao, S.X.; Fan, B.; Wu, S.; Huang, L. Simulation on uniformity of supplied air from plenum chamber of underfloor air distribution systems. Heat. Vent. Air Cond. 2015, 3, 110–112. [Google Scholar]
  10. Kong, Q.X.; Yu, B.F.; Pan, Z. Numerical simulation on airflow in plenum of underfloor air supply and experiment on characteristics of plenum’s outlets. J. Xi’an Jiaotong Univ. 2005, 39, 531–535. [Google Scholar]
  11. Tradat, M.I.; Manaserh, Y.M.A.; Sammakia, B.G.; Hoang, C.H.; Alissa, H.A. An experimental and numerical investigation of novel solution for energy management enhancement in data centers using underfloor plenum porous obstructions. Appl. Energy 2021, 289, 116663. [Google Scholar] [CrossRef]
  12. Lu, H.; Zhang, Z.; Yang, L. A review on airflow distribution and management in data center. Energy Build. 2018, 179, 264–277. [Google Scholar] [CrossRef]
  13. Jiang, Y.H.; Sun, H.S.; Zhong, J.X. Study and Design of air balance of large-scale static pressure box air conditioner in theaters. J. Qingdao Univ. Technol. 2013, 34, 113–117, 121. [Google Scholar]
  14. Wang, X.X. The Study of Theatre Large Size Static Pressure Box Internal Air Distribution. Master’s Thesis, Qingdao Technological University, Qingdao, China, December 2012. [Google Scholar]
  15. Huang, L.; Zhao, S.X.; Wu, S.; Fan, B.; An, Z.H.; Zang, X.G. Affection of action radius of static pressure box and air supply outlet density on uniformity of supply air. Refrig. Air-Cond. 2013, 13, 21–23. [Google Scholar]
  16. Kim, G.; Schaefer, L.; Lim, T.S.; Kim, J.T. Thermal comfort prediction of an underfloor air distribution system in a large indoor environment. Energy Build. 2013, 64, 323–331. [Google Scholar] [CrossRef]
  17. Murakami, S.; Kato, S.; Kim, T. Indoor climate design based on CFD coupled simulation of convection, radiation, and HVAC control for attaining a given PMV value. Build. Environ. 2001, 36, 701–709. [Google Scholar] [CrossRef]
  18. Hayashi, T.; Ishizu, Y.; Kato, S.; Murakami, S. CFD analysis on characteristics of contaminated indoor air ventilation and its application in the evaluation of the effects of contaminant inhalation by a human occupant. Build. Environ. 2002, 37, 219–230. [Google Scholar] [CrossRef]
  19. Yang, X.Q.; Wang, H.D.; Su, C.X.; Wang, X.; Wang, Y. Heat transfer between occupied and unoccupied zone in large space building with floor-level side wall air-supply system. Build. Simulat. 2020, 13, 1221–1233. [Google Scholar] [CrossRef]
  20. Kong, Q.X.; Yu, B.F. Numerical study on temperature stratification in a room with underfloor air distribution systems. Energy Build. 2008, 40, 495–502. [Google Scholar] [CrossRef]
  21. Kobayashi, N.; Chen, Q.Y. Floor-supply displacement ventilation in a small office. Indoor Built Environ. 2003, 12, 281–291. [Google Scholar] [CrossRef]
  22. Cheong, K.W.D.; Djunaedy, E.; Chua, Y.L.; Tham, K.W.; Sekhar, S.C.; Wong, N.H.; Ullah, M.B. Thermal comfort study of an air-conditioned lecture theatre in the tropics. Build. Environ. 2003, 38, 63–73. [Google Scholar] [CrossRef]
  23. Nina, S.S.; Łukasz, S. Air leakage modelling and its influence on the air quality inside a garage. E3S Web Conf. 2018, 44, 172. [Google Scholar]
  24. Nina, S.S.; Antonowicz, A.; Scislo, L. PIV measurement and CFD simulations of an air terminal device with a dynamically adapting geometry. SN Appl. Sci. 2019, 1, 370. [Google Scholar]
  25. Zhang, M.Y. Higher Engineering Fluid Dynamics; Xi’an Jiaotong University Press: Xi’an, China, 2008. [Google Scholar]
  26. Tao, W.Q. Numerical Heat Transfer, 2nd ed.; Xi’an Jiaotong University Press: Xi’an, China, 2008. [Google Scholar]
  27. Zhang, X.H. Simulation of Air Distribution in Plenum Chamber of Under Floor Air Supply in Grand Theatre. Master’s Thesis, Central South University, Changsha, China, 2009. [Google Scholar]
  28. Abanto, J.; Barrero, D.; Reggio, M.; Ozell, B.t. Airflow modelling in a computer room. Build. Environ. 2004, 39, 1393–1402. [Google Scholar] [CrossRef]
  29. Zhang, Y.; Zhang, K.; Liu, J.; Kosonen, R.; Yuan, X. Airflow uniformity optimization for modular data center based on the constructal T-shaped underfloor air ducts. Appl. Therm. Eng. 2019, 155, 489–500. [Google Scholar] [CrossRef]
  30. El-degwy, A.; Mohammed, S.; Khalil, E.E. CFD Application to Improve Infection Control in Office Rooms. ASHRAE Trans. 2020, 126, 220–228. [Google Scholar]
  31. Lee, J.H.; Moshfeghi, M.; Choi, Y.; Hur, N. A numerical simulation on recirculation phenomena of the plume generated by obstacles around a row of cooling towers. Appl. Therm. Eng. 2014, 72, 10–19. [Google Scholar] [CrossRef]
  32. Huang, M.H.; Chen, L.; Lei, L.; He, P.; Cao, J.J.; He, Y.L.; Feng, Z.P.; Tao, W.Q. Experimental and numerical studies for applying hybrid solar chimney and photovoltaic system to the solar- assisted air cleaning system. Appl. Energy 2020, 269, 115150. [Google Scholar] [CrossRef]
  33. Calautit, J.K.; Hughes, B.R.; Nasir, D.S.; Nasir, D.S.N.M. Climatic analysis of a passive cooling technology for the built environment in hot countries. Appl. Energy 2017, 186, 321–335. [Google Scholar] [CrossRef]
  34. Song, P.; Zhang, Z.B.; Zhu, Y. Numerical and experimental investigation of thermal performance in data center with different deflectors for cold aisle containment. Build. Environ. 2021, 200, 107961. [Google Scholar] [CrossRef]
  35. Hu, K. ANSYS CFD Start Guide—Fundamentals and Applications of Computational Fluid Dynamics; China Machine Press: Beijing, China, 2018. [Google Scholar]
  36. ANSYS Inc. ANSYS Fluent Theory Guide 16.0; ANSYS Inc.: Canonsburg, PA, USA, 2015. [Google Scholar]
  37. Department of Construction Engineering Quality & Safety Supervision; Ministry of Housing and Urban-Rural Development of the P.R. China. National Technical Measures for Design of Civil Construction Heating, Ventilation and Air Conditioning, Beijing; China Planning Publishing House: Beijing, China, 2009; pp. 85–86.
  38. Liu, G.D.; Wang, X.X.; Wang, X.; Qi, F.; Wang, G.; Hu, S.T. Large Size Static Pressure Box Airflow Distribution. In Proceedings of the 2nd International Conference on Computer and Information Applications (ICCIA), Taiyuan, China, 8–9 December 2012. [Google Scholar]
Figure 1. Vertical section of the circular conference room and simulated domain in this study.
Energies 15 06370 g001
Figure 2. Schematic diagram of the UFAD system. (a) vertical section of plenum under centralized air supply, (b) vertical section of plenum under uniform air supply, (c) layout of centralized air supply, and (d) layout of uniform air supply (dashed box represents the simulated zone).
Energies 15 06370 g002aEnergies 15 06370 g002b
Figure 3. Physical model of the plenum and diffusers.
Energies 15 06370 g003
Figure 4. Grid independence analysis assessment.
Energies 15 06370 g004
Figure 5. Schematic diagram of meshing. (a) Overall grid layout and (b) Local grid of air supply outlet under the seats.
Energies 15 06370 g005
Figure 6. Different air supply models. (a) case A, (b) case B, (c) case C, (d) case D.
Energies 15 06370 g006
Figure 7. Velocity vector diagram at the section of y = 0.71 m under case A (dashed box represents the vortex area to be zoomed in Figure 8).
Energies 15 06370 g007
Figure 8. Velocity and pressure contours of the vortex area at y = 0.71 m under case A. (a) velocity contours and (b) pressure contours.
Energies 15 06370 g008
Figure 9. Velocity and pressure contours of plenum at x = 7.62 m under case A. (a) velocity contours, (b) static pressure contours.
Energies 15 06370 g009
Figure 10. Velocity vector diagram of plenum at y = 0.71 m. (a) case B, (b) case C, (c) case D.
Energies 15 06370 g010
Figure 11. Pressure contours of plenum at section x = 7.62 m. (a) case B, (b) case C, (c) case D.
Energies 15 06370 g011
Figure 12. Velocity contours of plenum at section x = 7.62 m. (a) case B, (b) case C, (c) case D.
Energies 15 06370 g012
Figure 13. Outflow velocity contours of swirl diffusers. (a) case A, (b) case B, (c) case C, (d) case D.
Energies 15 06370 g013aEnergies 15 06370 g013b
Figure 14. Scatter plot of air velocity at the diffuser centre. (a) case A, (b) case B, (c) case C, (d) case D.
Energies 15 06370 g014aEnergies 15 06370 g014b
Figure 15. Air velocity non-uniformity coefficient inside plenum and at diffusers.
Energies 15 06370 g015
Table 1. Parameters of the mesh quality.
ParametersSkewnessOrthogonality QualityAspect RatioElement Quality
Average value0.220.861.840.86
Table 2. The outlet air velocity of the centralized mode.
Outlet Number12345
Velocity (m/s)3.973.971.982.102.98
Publisher’s Note: MDPI stays neutral with regard to jurisdictional claims in published maps and institutional affiliations.

