Article

Prioritization of Passive Parameters from Modified Averaging Approach-Based Computation (MAAC) Methodology for Ascertaining Formation of Single and Multi-Location Unintentional Islands

by
Nitin Kumar Kulkarni
1,*,
Mohan Khedkar
1,
Chandrashekhar Narayan Bhende
2 and
Sunil Kumar Singh
3,*
1
Electrical Engineering Department, Visvesvaraya National Institute of Technology, Nagpur 440010, India
2
Indian Institute of Technology, School of Electrical Sciences, Bhubaneswar 752050, India
3
School of Electrical Engineering, Shri Ramswaroop Memorial University, Barabanki 225003, India
*
Authors to whom correspondence should be addressed.
Energies 2022, 15(17), 6441; https://doi.org/10.3390/en15176441
Submission received: 11 August 2022 / Revised: 25 August 2022 / Accepted: 30 August 2022 / Published: 3 September 2022
(This article belongs to the Section F1: Electrical Power System)

Abstract

:
In the present scenario, the integration of distributed generation (DG) sources into the grid is inevitably required for meeting demand and ameliorating the power quality. High integration levels can form unintentional islands which need to be recognized to provide safety. In this context, 64 passive parameters have been tested in the MATLAB/SIMULINK environment for extensive islanding and non-islanding switching events on standard IEEE 13, 34, and 37 bus distribution test feeders (DTFs) integrated with photovoltaic (PV) inverter-based and rotating-based (induction generator) DG sources at multiple locations. In order to obtain effective passive parameters, a modified averaging approach-based computation (MAAC) methodology has been proposed. The proposed methodology computes the averaged islanding and non-islanding values of all ‘64’ parameters and prioritizes them accordingly by threshold value comparison. Additionally, it lessens the computational burden. The parameter threshold setting is simplified by obtaining threshold values directly from IEEE 1547-2018, UL1741, and IEEE 929-2000 grid interconnection standards, and the threshold values obtained are the same for the three DTFs. As a result, a generalized solution has been provided. The simulation results confer a set of the overall most effective passive parameters for ascertaining islanding, especially for a complex scenario of multi-DG multi-location island formations.

1. Introduction

The integration of distributed generation (DG) sources into power system networks is to minimize line losses and improve power reliability. However, high DG grid integration has a few challenges to be addressed [1,2,3]. One of the most significant protection challenges is the unintentional formation of islands. This unintentional/unplanned/uncontrolled/accidental island formation occurs owing to the load-generation balance [4] at the instant when there is a loss of grid supply. High DG integration facilitates a load-generation balance because the DG power output increases as the level of integration increases [1]. An unintentional island occurs when there is a loss of mains (i.e., loss of grid supply) and the DG source(s) are feeding the loads connected at the point of common coupling (PCC). This situation must be detected, and the DG source(s) within the island area must be shut down within 2 s [5] to avoid damage to equipment(s) at the PCC and to provide personnel safety. Considering the low/high voltage and low/high frequency ride-through (LVRT/HVRT/LFRT/HFRT) requirements, the islanding detection time is increased to 5 s [6].
These unintentional islands are detected in multiple ways [4,7]. Of all the different types of detection methods, passive approach-based methods are the simplest to implement and most cost-effective [4] because they detect islands simply by monitoring the parameters at the PCC point and there is no power quality degradation [4], unlike active methods, not costly [4], unlike remote methods, and does not require high computational burden and complex algorithms [8,9,10,11,12,13,14], unlike signal processing and classifier-based methods. Articles [15,16,17,18,19,20,21,22,23,24,25,26,27,28,29,30,31] have proposed different passive approach-based islanding detection techniques for island formation at a single location (i.e., at a single PCC point). However, for a more realistic scenario such as multi-location multi-PV inverter-rotating DG island formation, an effective passive parameter(s) is required to provide reliable anti-islanding protection. Therefore, it is essential to obtain the most effective passive parameters that can accurately classify islanding (disturbance due to grid loss) and non-islanding (disturbance but not due to grid loss) switching events. In addition, one of the major drawbacks of passive approach-based detection methods is the difficulty in setting the threshold values for the passive parameters [4]. Therefore, this issue must be addressed.
As per the literature [32,33,34], ‘16’ passive parameters were prioritized for their performance during islanding and non-islanding events for a power distribution system integrated with PV inverter-based and rotating-based DGs. Here, island formation due to multiple DGs was considered only at a single location (at a single PCC point) but multi-location (at multiple PCC points) multi-DG island formations were not considered. In [35,36,37,38], multi-DG island formation at multiple locations for a given network is considered one of the most real-time islanding detection challenges and thus requires attention. In [39,40], ‘36’ and ‘40’ passive parameters, respectively, were prioritized by employing the ranking technique proposed in [32]. This ranking technique was slightly modified in [41] by proposing an averaging approach-based technique for obtaining the threshold values for ‘46’ passive parameters and provided a set of best parameters for single PV inverter and multi-PV inverter islands at single and multiple locations. The technique proposed in [41] considered a passive parameter’s islanding event value as a threshold value [32] and an averaging approach-based scheme computed the parameter’s averaged islanding value from instantaneous islanding event values, which reduced multiple threshold (islanding) values to a single threshold (islanding) value. Therefore, this scheme solves the complexity of many threshold values for a given parameter. The scheme proposed in [41] has three major limitations/research gaps which are listed below.
(i)
As the power distribution network size increases (for higher bus networks) and DG penetration increases, the number of islanding and non-islanding cases also increases, which requires a large number of comparisons for determining the parameter’s performance evaluation, thus demanding more computation.
(ii)
The threshold values (i.e., averaged islanding values [41]) for the passive parameters change from one network to the other, i.e., they are dependent on the size of the network (number of buses) and the DG penetration level.
(iii)
A set of best parameters [41] is obtained only for the low power mismatch range, but this scheme has not provided the overall best parameters by using the repetition approach for all low, medium, and high power mismatch ranges as a complete solution.
The aforementioned limitations/research gaps have been addressed in this paper. So, the major contributions/innovations of this paper are discussed below.
(i)
A modified averaging approach-based computation (MAAC) scheme is proposed which computes the average of the parameter’s instantaneous islanding and non-islanding values and thus reduces a large number of instantaneous islanding and non-islanding values to a single value. Hence, only the single averaged islanding and single averaged non-islanding values of a parameter are sufficient for comparison with the corresponding parameter’s threshold value. Thus, the number of comparisons (for the parameter’s performance value evaluation) decreases, thereby reducing the computational burden.
(ii)
For all the ‘64’ parameters, threshold values are derived directly from voltage and frequency limits as per IEEE 1547-2018 [6] (i.e., the revised version of IEEE 1547-2003 std. [5]), UL1741, and IEEE 929-2000 grid interconnection standards [7,10]. Three different power distribution networks, i.e., std. IEEE 13, 34, and 37 bus systems with different DG penetration levels, were considered for analysis. The threshold values obtained are the same (for the same DG source specifications) for these three distribution networks. These values are independent of the size (i.e., no. of buses), network topology, grid source voltage, and the DG penetration levels, respectively, thus providing a generalized threshold setting for passive parameters.
(iii)
Generalized expressions are proposed for the repetition factor (unlike in [41]) which determines the most effective passive parameters for the three distribution test feeders (DTFs), i.e., IEEE 13, 34, and 37 bus networks, from a large set of effective parameters for different ranges of power mismatch between a load at the PCC and DG power generation.
(iv)
Effective passive parameter(s), especially for complex real-time situations [35,36,37,38], that is, for the detection of unplanned island formations at multiple locations due to both PV inverter and rotating type DGs, respectively, are obtained by performance testing of various parameters for a large number of switching events.
The entire analysis is carried out on three DTFs integrated with PV inverter-based DG sources which represent a grid-tied photovoltaic (PV) system and rotating-based (squirrel cage induction generator) DG sources which are generally employed in mini-hydro (MH), wind turbine systems, in the MATLAB/SIMULINK environment.
The generalized circuit model for anti-islanding protection studies shown in Figure 1, as per the IEEE 1547.1-2005 standard [42], is comprised of the switch ‘SW’ which represents circuit breaker/re-closure/sectionalizer/fuse, etc., a grid source, DG source(s), local load(s), and power system network. Here, for performance analysis of passive parameters, apart from worst-case parallel resonant RLC load [4,42] and its different combinations [41], another potential local load that can also cause difficulty in islanding detection, i.e., induction motor load [4] is considered. The performance testing of all parameters is carried out as per the test conditions of IEEE 1547.1-2005 std. [42], i.e., testing is done for different active and reactive power mismatch ranges between load and generation.
The remainder of this paper is systematically organized into several sections. Section 2 provides a detailed list of ‘64’ passive parameters. Section 3 describes the standard three distribution test feeders, types of distributed generation sources, and computations of different levels of DG grid integration. Section 4 discusses several islanding and non-islanding switching test cases. Section 5 and Section 6, respectively, explain in detail the MAAC-based prioritization methodology. Section 7 discusses data extraction by performance testing of various parameters and simulation results and provides effective parameters (in a tabular form) for the three DTFs for different power mismatch ranges. Section 8 proposes a repetition factor and provides computational burden analysis for the proposed MAAC methodology and compares it with previous schemes from the perspective of data size. The outcomes are discussed in Section 9, followed by the conclusion in Section 10.

2. Passive Parameters and Types of Distributed Generation Sources

In passive approach-based islanding detection schemes, a passive parameter(s) is employed to detect the formation of unintentional islands. In this context, to obtain the most effective passive parameter(s) which can accurately classify an islanding event from some other disturbance, i.e., a non-islanding event, ‘64’ passive parameters are tested for a large number of switching events and their performance is measured for a duration of two cycles, i.e., from 0.3 s (normal state) to 0.34 s (disturbed/changed state). Each parameter was observed for its disturbance/change in magnitude over this duration and then prioritized by comparing it with the corresponding parameter’s threshold value. All 64 parameters are listed in Table 1 under different categories.

3. Distribution Test Feeders

Standard IEEE 13, 34, and 37 bus distribution test feeders (DTFs) [43], shown in Figure 2, Figure 3 and Figure 4, respectively, were modeled in the SIMULINK environment. These represent the European style of radial distribution power systems. They were employed for testing ‘64 passive parameters (listed in Table 1) for their disturbance (i.e., referring to the parameter’s magnitude change) during islanding and non-islanding switching events. These events are disturbances created at a given instant of time either due to loss of the grid or due to the switching of some component(s) in the distribution network. A detailed description [43] of these three DTFs is provided in Table 2.

3.1. Distributed Generation Grid Integration Levels

Two types of distributed generated sources were integrated into all three DTFs. These are PV inverter-based (type-1) and rotating-based (squirrel-cage induction generator, i.e., type-2) DG sources. The aim of integrating these two different types of DG sources is to test the performance of all ‘64’ parameters for single and multiple island formations at single and multiple locations. The DG sources for both type-1 and type-2 grid-integration levels (GIL) shown in Table 2 were computed for DTF-1, 2, and 3 by employing the generalized expression [36] given below in (1).
D G G I L = D G p o w e r o u t p u t n 100 S g r i d
where ‘DGGIL’ is the DG grid integration level in percentage, ‘DGpoweroutput’ is the power output (in kW) of the DG source, ‘n’ is the number of DG sources integrated into the grid, and ‘Sgrid’ is the grid supply power output (in KVA), respectively. The ‘DGGIL’ computations of IEEE 13 bus (DTF-1), 34 bus (DTF-2), and 37 bus (DTF-3) for PV inverter-based and rotating-based DGs, respectively, are given in (2)–(7) below.
D G G I L _ D T F - 1 = ( 80 2 100 ) 5000 = 3.2 %
D G G I L _ D T F - 1 = ( 125 2 100 ) 5000 = 5 %
D G G I L _ D T F - 2 = ( 80 4 100 ) 2500 = 12.8 %
D G G I L _ D T F - 2 = ( 125 3 100 ) 2500 = 15 %
D G G I L _ D T F - 3 = ( 80 6 100 ) 2500 = 19.2 %
D G G I L _ D T F - 3 = ( 125 4 100 ) 2500 = 20 %

3.2. Significance of Three Distribution Test Feeders

Three radial distribution test feeders (DTFs), i.e., std. IEEE 13 bus, 34 bus, and 37 bus [43] systems, represent real-time power distribution networks. All three DTFs are the main test models to study the performance of ‘64’ passive parameters under different islanding and non-islanding test conditions.
Islanding test conditions are considered as per the std. IEEE 1547.1-2005 [42], i.e., for different active and reactive power mismatches between the DG power generation and local load (connected at different PCC points in Figure 2, Figure 3 and Figure 4) power consumption. The std. test conditions [42] are considered for analysis, i.e., the worst-case parallel RLC resonant and induction motor loads. Other loads are also considered.

4. Islanding and Non-Islanding Switching Events

All ‘64’ passive parameters are tested for their performance during different switching events. These events are islanding, i.e., a switching event that isolates the DG source(s) at the PCC(s) from the grid, and non-islanding, that is, other disturbances that do not cause a loss of mains. A large number of islanding and non-islanding simulations (shown in Table 3 and Table 4, respectively) were carried out for the prioritization of passive parameters. These events occur at 0.3 s by the switching action taking place at different PCC points (for islanding events) and at different locations (for non-islanding events) on the three DTFs shown in Figure 2, Figure 3 and Figure 4. The disturbance/change in a passive parameter’s magnitude for all these events is monitored/observed for a duration of two cycles, i.e., from t = 0.3 s to t = 0.34 s.

4.1. Islanding Switching Events

As mentioned earlier, an islanding switching event (occurring at 0.3 s) is a situation where a DG source(s) at the PCC point(s) is disconnected from the grid supply by the opening of switches (SWs) in Figure 2, Figure 3 and Figure 4. Passive parameters are monitored for their disturbance in magnitude for a large number of islanding cases involving ‘8’ different local loads that are the potential island local loads (PILs) shown in Figure 2, Figure 3 and Figure 4. These loads are the conventional parallel resonant RLC (resonant frequency is 50 Hz [4,9]) and other loads [29], such as parallel RL, parallel RC, series resonant RLC (resonant frequency is 50 Hz), series RL, series RC, purely R, and 75 kW 3-phase induction motor (75 kW). As per the report [4], the induction motor load (apart from the parallel resonant RLC) is also one of the worst-case loads for the detection of unplanned islands. All islanding cases listed in Table 3 were simulated for these ‘8’ loads for ‘21’ active and reactive power mismatches (i.e., active and reactive power local loading values). Power mismatch refers to the load-generation balance [4] that is, the difference between the power generated by the DG source(s) and the power consumed by the local load(s) during island formation. Power mismatch is an important factor for parameter performance evaluation, especially for zero or low power mismatch ranges [4]. These ‘21’ active and reactive power mismatches are obtained by varying active and reactive power loading values of the potential island local loads (i.e., at PCC points). Active and reactive power mismatches are categorized into low power mismatch (LPM), medium power mismatch (MPM), and high power mismatch (HPM) ranges, respectively, for analysis [44,45,46]. The ranges (in accordance with IEEE 1547.1-2005 std. [42] test conditions) are described below.
(i)
Active and reactive LPM ranges were obtained by varying the local loading values at PCC points from 80 kW to 140 kW for inverter DGs, 75 kW to 135 kW for rotating DGs, and100 kVAr to 160 kVAr for both inverter and rotating DGs in steps of 10 kW and 10 kVAr, respectively.
(ii)
Active and reactive MPM ranges are obtained by varying local loading values at PCC points from 150 kW to 210 kW for inverter DGs, 145 kW to 205 kW for rotating DGs, and 170 kVAr to 230 kVAr for both inverter and rotating DGs in steps of 10 kW and 10 kVAr, respectively.
(iii)
Active and reactive HPM ranges are obtained by varying local loading values at PCC points from 220 kW to 280 kW for inverter DGs, 215 kW to 275 kW for rotating D, Gs, and 240 kVAr to 300 kVAr for both inverter and rotating DGs in steps of 10 kW and 10 kVAr, respectively.
Table 3 provides only a few islanding event cases. All such cases have been simulated for performance testing of 64 parameters.

4.2. Non-Islanding Switching Events

The non-islanding event as mentioned earlier is a switching event taking place at 0.3 s at different PCC points and other locations (buses) on all the three DTFs. DGs must not trip/shut down during these events [4,9]. These events also change the magnitude of a given passive parameter but there is no grid loss. Non-islanding events are required to determine the effectiveness of the parameter in distinguishing islanding events, i.e., to prevent nuisance/false DG trips. Table 4 gives the details about these events (i.e., switching passive loads, DG source, and non-linear load [47]) and the total number of simulations carried out for each DTF.

5. Modified Averaging Approach-Based Computation (MAAC) Methodology

5.1. Conceptualization

The modified averaging approach-based (MAAC) methodology is an improvised version of the averaging approach-based scheme proposed in [41]. The MAAC methodology overcame the limitations of the schemes proposed in [32,41], respectively. This approach computes the average instantaneous (observed) islanding and non-islanding values for all 64 parameters for the three DTFs. Unlike scheme [41], the threshold value of each parameter is obtained from the DG interconnection standards [5,7] which ease the task of threshold setting because these threshold values are independent of the type of feeder, i.e., each of the 64 parameters has a single threshold value for DTFs-1, 2, and 3.
The proposed MAAC methodology theoretically computes the averaged islanding values and averaged non-islanding values from their corresponding instantaneous values observed at two time instants, i.e., at 0.3 s and 0.34 s, respectively. A large number of instantaneous values for both islanding and non-islanding switching events for a parameter are reduced to ‘one’ value (lessening the computational burden) each by averaging. Each parameter’s averaged islanding and non-islanding values are compared (magnitude-wise) with their corresponding threshold values (derived from DG grid-interconnection stds., i.e., IEEE 1547-2018 [6], UL1741, and IEEE929-2000 [7,10]) to determine the parameter’s performance value. A detailed step-wise explanation of the MAAC methodology is given below.

5.2. Step-by-Step Procedure of Computation of Averaged Islanding and Non-Islanding Values

The MAAC methodology computes the passive parameter’s averaged islanding and non-islanding values from their corresponding instantaneous values using suitable programming in MATLAB. The procedure for this computation is explained in detail below.
Step-1: Passive parameter’s instantaneous normal condition (i.e., DG connected to the grid) value is observed at 0.3 s and the instantaneous islanding and non-islanding values (for events listed in Table 3 and Table 4) are observed at 0.34 s. Each parameter is monitored for a duration of two cycles. For example, consider a parameter ‘ΔV/Δf’, its averaged islanding/non-islanding value is computed by taking the ratio of change in computed averaged voltage, i.e., ‘ΔV’ to that of change in computed averaged frequency, i.e., ‘Δf’. Here, ‘ΔV’ and ‘Δf’ values are obtained by computing the change/difference in averaged ‘V’ and ‘f’ values at two different time instants, i.e., at 0.3 s and 0.34 s, respectively.
Step-2: The Average of instantaneous normal (at 0.3 s) and islanding values (at 0.34 s) for either LPM/MPM/HPM ranges at a PCC point for three DTFs (Figure 2, Figure 3 and Figure 4) is obtained by the Equations (8)–(22) given below.
(i) Expressions for DTF-1 for passive parameter ‘P’ at PCC-1 (in Figure 2 at PCC-1 PV inverter DG1 is integrated):
P A V _ I S W 1 , x = j = 1 1 i = 1 7 P a i , j 7
P A V _ I S W 2 , x = j = 1 1 i = 1 7 P b i , j 7
P A V _ I S W 3 , x = j = 1 3 i = 1 7 P c i , j 7
P A V _ P C C 1 , x = P A V _ I S W 1 , x + P A V _ I S W 2 , x + P A V _ I S W 3 , x 3
P I A V _ P C C 1 _ D T F - 1 = x = 1 8 P A V _ P C C 1 , x 8
(ii) Expressions for DTF-2 for passive parameter ‘P’ at PCC-1 (in Figure 3 at PCC-1 PV inverter DG1 is integrated):
P A V _ I S W 1 , y = n = 1 1 m = 1 7 P a m , n 7
P A V _ I S W 2 , y = n = 1 7 m = 1 7 P b m , n 7
P A V _ I S W 3 , y = n = 1 28 m = 1 7 P c m , n 7
P A V _ P C C 1 , y = P A V _ I S W 1 , y + P A V _ I S W 2 , y + P A V _ I S W 3 , y 3
P I A V _ P C C 1 _ D T F - 2 = y = 1 8 P A V _ P C C 1 , y 8
(iii) Expressions for DTF-3 for passive parameter ‘P’ at PCC-1 (in Figure 4 at PCC-1 PV inverter DG1 is integrated):
P A V _ I S W 1 , z = s = 1 1 r = 1 7 P a r , s 7
P A V _ I S W 2 , z = s = 1 23 r = 1 7 P b r , s 7
P A V _ I S W 3 , z = s = 1 69 r = 1 7 P c r , s 7
P A V _ P C C 1 , z = P A V _ I S W 1 , z + P A V _ I S W 2 , z + P A V _ I S W 3 , z 3
P I A V _ P C C 1 _ D T F - 3 = z = 1 8 P A V _ P C C 1 , z 8
Equations (8)–(22) are the generalized expressions for computing averaged islanding values of ‘64’ passive parameters at all PCC points for the LPM, MPM, and HPM active and reactive power mismatch ranges, respectively, for DTFs-1, 2, and 3. However, the limits of the summation will be different for inverter DGs and rotating DGs because they are non-uniformly penetrated in DTFs 2 and 3. Therefore, the number of islanding cases listed in Table 3 is not the same for type-1 and type-2 DGs at a given PCC point. In expressions (8)–(22), the computation is carried out by categorizing the islanding events into three types as per Table 3, i.e., ‘ISW1′ (Islanding Switching Event1) is a single DG (type-1, type-2)-single location, ‘ISW2′ is a multi-DG (type-1, type-2)-multi-location, and ‘ISW3′ is a multi-DG (both type-1 and type-2)-multi-location. The nomenclature/symbols used in (8)–(22) are described in Table 5.
Step-3: The averaging of instantaneous normal and non-islanding values (listed in Table 4) at a PCC point for three DTFs is obtained by Equations (23)–(25) given below.
(i) Expression of DTF-1 for passive parameter ‘P’ at PCC-1:
P N I A V _ P C C 1 _ D T F - 1 = a = 1 6 i = 1 120 P a , i 120 + b = 1 5 j = 1 2 P b , j 10 + c = 1 5 k = 1 1 P c , k 5 8
(ii) Expression of DTF-2 for passive parameter ‘P’ at PCC-1:
P N I A V _ P C C 1 _ D T F - 2 = a = 1 6 m = 1 140 P a , m 140 + b = 1 6 n = 1 2 P b , n 12 + c = 1 6 o = 1 1 P c , o 6 8
(iii) Expression of DTF-3 for passive parameter ‘P’ at PCC-1:
P N I A V _ P C C 1 _ D T F - 3 = a = 1 6 x = 1 140 P a , x 140 + b = 1 6 y = 1 2 P b , y 12 + c = 1 6 z = 1 1 P c , z 6 8
Equations (23)–(25) are generalized expressions for computing averaged non-islanding values of ‘64’ parameters at different PCC points on three DTFs. The nomenclature/symbols used in (23)–(25) are described in Table 6.
In Equations (8)–(25), passive parameter ‘P’ represents the fundamental type and fundamental harmonic-based parameters (it refers to parameters ‘1’ to ‘6’ and ‘43’ to ‘46’, respectively, as per Table 1). The averaging computation is first done for these parameters for normal, islanding, and non-islanding conditions using the generalized expressions (8)–(25) for all PCC points for three DTFs, and from their averaged values the corresponding averaged islanding and non-islanding values of other parameters obtained, i.e., as per Table 1, ‘7’ to ‘42’ computed from ‘1’ to ‘6’ and ‘47’ to ‘64’ computed from ‘43’ to ‘46’.

6. Threshold Setting and Prioritization Scheme for Passive Parameters

In total, ‘64’ passive parameters are prioritized by a scheme that compares a parameter’s averaged islanding and non-islanding values with its respective threshold value. The comparison is based on the operating principle of passive islanding detection schemes [4], i.e., an effective passive parameter is one whose magnitude change for an islanding event exceeds the threshold value [32], and for a non-islanding event, does not exceed the threshold value [32]. The parameter threshold setting and prioritization scheme are discussed in this section.

6.1. Threshold Setting for All Passive Parameters

In [32,39,40,41], threshold values of the passive parameters are considered as their islanding values themselves. The limitation of this approach is that as the number of islanding events increases, the number of threshold values for a given parameter also increases, which increases the computational burden because obtaining a single threshold value for a parameter requires further averaging. Another major limitation is that for different feeders, the parameter’s threshold value is also different.
To address these limitations, the threshold setting (threshold value) was obtained from DG grid-interconnection standards, i.e., IEEE 1547-2018 [6], UL1741, and IEEE 929-2000 [7,10]. In all these three standards, the voltage (trip) limits for DG interconnection are common, i.e., 88% to 110%. Voltage allowable trip limits, i.e., 0.88 pu to 1.1 pu, are mentioned in IEEE 1547-2018 std. [4] under the category of power systems with high DG penetration. Since the analysis here is carried out for power systems integrated with high DG penetration levels, these limits can be utilized. Similarly, as per the aforementioned standards, the frequency limits are taken as 48.5 Hz to 51.2 Hz. Therefore, the threshold values of all parameters obtained are generalized since multiple interconnection standards are considered.
These threshold values reduce the computational burden because they are directly obtained from the standards without the interference of islanding switching events as in [32] and [41]. In addition, they are the same for all DTFs, provided that the DG source voltage, frequency ratings, and potential island local load variations are the same. Here, two sets of threshold values are obtained for the inverter-based DGs (each 80 KW power output) and the other for the rotating-based DGs (each 75 kW power output). The generalized expressions for obtaining the threshold values for fundamental type and fundamental harmonic-based passive parameters are given in (26)–(38) below.
The limits of PCC voltage and frequency parameters are denoted by ‘Vmin’, ‘Vmax’, and ‘fmin’, ‘fmax’, respectively, and are considered as per the standards IEEE 1547-2018 [4], UL1741, and IEEE 929-2000 [5,8]. The expressions to obtain PCC voltage and frequency threshold values (‘Vth’ and ‘fth’) are given in (26) and (27). The nominal values for PCC voltage (‘Vnom’) and frequency are taken as 400 V and 50 Hz, respectively.
V min = 0.88 V n o m , V max = 1.1 V n o m , f min = 48.5   Hz , f max = 51.2   Hz
V t h = V min + V max 2 , f t h = f min + f max 2
The limits of active and reactive power parameters (from Table 1) are taken as their minimum loading values (‘Pmin’ is 80 kW for PV inverter DGs, 75 kW for rotating DGs, and ‘Qmin’ is 100 kVAr for PV inverter and rotating DGs) and maximum loading values (‘Pmax’ is 280 kW for PV inverter DGs, 275 kW for rotating DGs, and ‘Qmax’ is 300 kVAr for PV inverter and rotating DGs). The active and reactive power parameter threshold settings (‘Pth’ and ‘Qth’) for both type-1 and type-2 DGs are given in (28) and (29).
P t h = P min + P max 2
Q t h = Q min + Q max 2
The limits of phase angle (‘Ɵmin’ and ‘Ɵmax’) and current at PCC (‘Imin’ and ‘Imax’), respectively, from Table 1 are obtained using expressions given in (30)–(35).
θ min = a tan ( Q min P max )
θ max = a tan ( Q max P min )
I min 1 = P min 3 V max cos ( θ min )
I max 1 = P max 3 V min cos ( θ max )
I min 2 = Q min 3 V max sin ( θ max )
I max 2 = Q max 3 V min sin ( θ min )
As shown in (32)–(35) there are two minimum (Imin1, Imin2) and maximum (Imax1, Imax2) limits for the PCC current; thus, its threshold value is obtained by defining a condition. This condition is based on the fact that limits should be selected in such a manner that they allow the DG source(s) to trip easily during an islanding event(s); for easy DG trip/shutdown, the minimum limit must be high and the maximum limit must be low because it provides a narrow range for the DG to easily trip during an islanding condition. The expressions for this condition, threshold setting for PCC current ‘Ith’, and phase angle ‘Ɵth’ parameters are given in (36)–(38).
i f , { I min 1 > I min 2 } , I min = I min 1 i f , { I min 1 < I min 2 } , I min = I min 2 i f , { I max 1 < I max 2 } , I max = I max 1 i f , { I max 1 > I max 2 } , I max = I max 2
I t h = I min + I max 2
θ t h = θ min + θ max 2
The threshold values of fundamental harmonic-based parameters, i.e., (‘THDVth’, ‘THDIth’, ‘HF5Vth’, and ‘HF5Ith’) are taken as 5% since, for DG grid interconnection, the allowable limit of harmonic injection is 5% [5,7]. As per Table 1, the threshold values of parameters ‘7′ to ‘42′ and ‘47′ to ‘64′ are obtained from threshold values ‘Vth’, ‘Ith’, ‘fth’, ‘Ɵth’, ‘Pth’, ‘Qth’, and fundamental harmonic-based parameters, respectively. The threshold values of all ‘64′ parameters were the same for DTF-1, DTF-2, and DTF-3, i.e., these values were independent of the topology/type of the distribution network.

6.2. Prioritization of Passive Parameters

Parameters are prioritized by comparing their threshold values with the corresponding computed averaged islanding and non-islanding values (i.e., obtained from MAAC methodology). If a parameter’s averaged islanding value exceeds its threshold value, the parameter successfully identifies that there is a loss of grid (island formation) and further signals DG(s) to trip. In this case, the parameter’s performance value is assigned ‘1’ otherwise ‘0’, and if a parameter’s averaged non-islanding value exceeds its threshold value, it means the parameter can signal DG(s) to false trip so, in this case, the parameter’s performance value is assigned ‘0’ otherwise ‘1’. This scheme is depicted in the flowchart in Figure 5.

7. Data Extracted, Simulation Results, and Effective Passive Parameters

The data extraction (in table form) of all 64 passive parameters at different PCC points for three DTFs, the corresponding simulation results, and the effective passive parameters obtained, respectively, are discussed here.

7.1. Data Extracted for Obtaining Effective Passive Parameters

The data are extracted by using the proposed MAAC-based prioritization methodology shown in Figure 5, i.e., after testing for each passive parameter’s performance for different islanding and non-islanding switching events. This data gives the final performance values of all parameters in 0 s and 1 s for DTFs-1, 2, and 3 at different PCC points.
An effective passive parameter accurately distinguishes islanding from non-islanding switching events. As per the prioritization procedure shown in Figure 5, if a parameter’s final performance value is ‘1’ (i.e., averaged islanding value exceeds a threshold value) for islanding event(s) and ‘0’ (i.e., averaged non-islanding value is less than the threshold value) for the non-islanding event(s) then that parameter is said to be an effective parameter for detecting the occurrence of an unintentional island(s).

7.2. Simulation Results

Figure 6, Figure 7 and Figure 8 show the simulation results (from MATLAB/SIMULINK) for the LPM range for three DTFs at different PCC points. Because the LPM range is the most difficult case for islanding detection [2,7], it is shown below. Similarly, the results for the MPM and HPM ranges were obtained. Table 7 provides effective passive parameters for one PCC point for each DTF for LPM, MPM, and HPM ranges. Here, the final performance value as ‘1’ is the effective (which has successfully distinguished islanding and non-islanding events) and the performance value as ‘0’ is the non-effective (which has ‘not’ distinguished islanding and non-islanding events) passive parameter.
The bar charts shown below in Figure 6, Figure 7 and Figure 8, respectively, represent the ranking of parameters, i.e., it gives the final prioritization of all parameters. This prioritization is obtained from the proposed methodology (shown in Figure 5). The parameters which are more reliable for islanding detection at each PCC point for each DTF are the ones where the bars touch unity (in Figure 6, Figure 7 and Figure 8); furthermore, the bars which are at zero are not suitable for classifying islanding and non-islanding events.

8. Repetition Factor, Non-Detection Zone of Effective Parameters, and Computational Burden of the Proposed MAAC-Based Prioritization Methodology

The ‘most effective’ and ‘overall most effective’ passive parameters, respectively, from the large number of parameters given in Table 7 are obtained by proposing a repetition factor. In addition, the computational burden of the proposed methodology is discussed and comparisons with other relevant schemes [32,41] are provided. In addition, a brief comparison of MAAC methodology is provided with the computational methods proposed in [48,49,50].

8.1. Repetition Factor

Effective passive parameters for the LPM, MPM, and HPM ranges shown in Table 7 for the three DTFs can be reduced to a small set by using the proposed repetition factor. In [41], a set of parameters was provided only for the LPM range (without considering the MPM and HPM ranges) for all PCC points. Unlike the repetition process in [41], this process counts the number of times a parameter has repeated itself in three stages. These three stages are given below.
Stage-1: Considers the repetition of parameters among the LPM, MPM, and HPM ranges for a PCC point for a DTF. In this manner, a reduced set of parameters is obtained for the three DTFs at different PCC points. It is denoted by ‘RF1’ (repetition factor 1).
Stage-2: Considers the repetition of parameters among various PCC points for DTF and yields a set of ‘most effective passive parameters’. It is denoted by ‘RF2’ (repetition factor 2). ‘RF2’ is obtained from ‘RF1’.
Stage-3: Considers the repetition of parameters among DTF-1, DTF-2, and DTF-3 gives a final set of the ‘overall most effective passive parameter’. It is denoted by ‘RF3’ (repetition factor 3). ‘RF3’ is obtained from ‘RF2’.
The expressions for the repetition factors (RF1, RF2, and RF3) are given in Equations (39)–(41). These expressions were based on the three stages of the aforementioned repetition process.
R F 1 = { r e d u c e d _ e f f e c t i v e _ p a s s i v e p a r   a m e t e r s }
In (39), ‘RF1’ gives a reduced set of effective passive parameters from a large number of parameters shown in Table 8. These parameters are those that have repeated themselves for ‘3’ times, which means they have appeared as an effective parameter in the LPM, MPM, and HPM ranges for each PCC point for each DTF. In (40), ‘RF2’ provides the set of the most effective parameters. These parameters repeated themselves the highest number of times as compared to other parameters in the RF1 set. The parameters shown in the RF2 set given in (40), have repeated themselves for ‘3’ times, ‘7’ times, and ‘6’ times among different PCC points for three DTFs.
R F 2 = { Δ Q / Δ T D T F - 1 , H F 5 V D T F - 1 , H F 5 I D T F - 1 , H F 5 V H F 5 I D T F - 1 , T H D V H F 5 I D T F - 2 , T H D I H F 5 V D T F - 2 , f D T F - 3 , Δ I / Δ Q D T F - 3 , T H D I H F 5 V D T F - 3 , T H D I H F 5 I D T F - 3 , H F 5 I / H F 5 V D T F - 3 }
R F 3 = { T H D I H F 5 V }
RF3’ gives the overall most effective passive parameter as ‘THDI*HF5V’ since it repeats itself for ‘2’ times, i.e., it appears for DTF-2 and DTF-3 in (40) but other parameters appear only once for each DTF. Equations (39)–(41) are generalized because they can be utilized to reduce any given set of large effective parameters.

8.2. Data Size, Computational Burden of Proposed MAAC Methodology, and Comparison with Other Performance Ranking Schemes

Table 3 and Table 4 list a large number of islanding and non-islanding cases. Instantaneous values of each parameter were observed for these cases. As per the techniques proposed in [32,33,34,39,40,41], these large cases provide a large amount of data to be processed and the computation required for the comparisons of islanding and non-islanding values with threshold values for all parameters is large.
The proposed MAAC methodology reduces the data size for islanding and non-islanding values by averaging, and also reduces the number of comparisons required to obtain a parameter’s performance value (by following the procedure as per the flowchart given in Figure 5). Table 8 presents a comparison between the performance of the proposed MAAC scheme and other computation schemes for a given passive parameter from the islanding, non-islanding, threshold data sizes, and a number of comparisons (i.e., computational burden) perspectives.
From Table 8 shown below, it can be concluded that the MAAC-based prioritization methodology is the ‘most effective scheme’ (as compared to previous schemes [32,33,34,39,40,41]) since the data size of islanding, non-islanding, and threshold values reduce considerably. Furthermore, the computation required for the number of comparisons (i.e., comparison of parameter’s islanding and non-islanding values with threshold values) reduces to ‘1’ as compared to earlier schemes.

8.3. Comparison of MAAC Methodology with Other Computational Methods

As mentioned earlier, the MAAC methodology computes the average of all instantaneous values for different switching events and compares averaged values with threshold values to test the performance of a parameter. This method does not involve any DG control schemes. Additionally, the proposed methodology, unlike [48,49,50], prioritizes all the parameters without considering the controller part of PV inverter-based and rotating-based DG sources. Thus, the MAAC methodology reduces the complexity (i.e., is simple in implementation) and the data size.

9. Discussion on Outcomes

The analysis was performed on IEEE 13 bus, 34 bus, and 37 bus distribution test feeders with high DG integration levels (8.2%, 27.8%, and 39.2%) of PV inverter-based and rotating-based DG sources, respectively. The parameters were tested for normal cases, i.e., island formations due to only PV inverter-based DGs at single and multiple PCC points, due to only rotating-based DGs at single and multiple PCC points, and for the most peculiar case, i.e., island formations due to both PV inverter-based and rotating-based DGs at multiple PCC points. The performance evaluation of ‘64’ parameters was carried out for a large number of islanding cases involving different local loads apart from conventional parallel resonant RLC loads such as parallel RL, parallel RC, series resonant RLC, series RL, series RC, purely R, and induction motor (worst-case) loads.
The major outcomes that can be drawn from the performance testing and prioritization of the ‘64’ passive parameters are discussed below.
(i)
The proposed MAAC methodology reduces the data size of the islanding, non-islanding, and threshold values by 99.95%, 99.91%, and 99.95%, respectively, for DTF-1, 99.99%, 99.94%, and 99.99%, respectively, for DTF-2, and 99.99%, 99.95%, and 99.99%, respectively, for DTF-3. This methodology reduces the computational burden, i.e., the number of comparisons to ‘1′ each for the large number of islanding and non-islanding cases.
(ii)
The threshold values of all parameters are obtained from DG grid-interconnection standards, i.e., IEEE1547-2018, UL1741, and IEEE 929-2000 (from these standards voltage and frequency limits are considered to obtain threshold values of all 64 parameters), thus completely solving the most important limitation of passive approach-based islanding detection methods that is, threshold setting. The advantage is that the threshold values obtained are the same for the three DTFs and, hence, independent of the type of distribution network.
(iii)
Since a large number of effective passive parameters were obtained through the proposed prioritization methodology, a repetition factor was introduced to provide a small set of parameters. Therefore, repetition factors ‘RF2’ and ‘RF3’ provide a reduced set of these effective parameters referred to as the ‘most’ and ‘overall most’ effective parameters, respectively. The best obtained among all ‘64’ parameters is ‘THDI*HF5V’.

10. Conclusions

Std. IEEE 13 bus, 34 bus, and 37 bus radial power distribution systems integrated at different penetration levels with PV inverter-based (type-1) DGs and rotating-based (type-2) DGs are considered for analyzing the performance of ‘64’ passive parameters. Parameters are observed for their change in magnitude for a large number of islanding and non-islanding switching events for the duration of two cycles. The MAAC-based prioritization methodology is proposed here to obtain effective passive parameters. This prioritization methodology compares islanding and non-islanding event values with the corresponding threshold values (obtained from DG grid interconnection standards) and, thus, gives a large number of effective parameters. By proposing a repetition factor, the most effective parameter ‘THDI*HF5V’ is obtained from this large set of parameters.

Author Contributions

Conceptualization, N.K.K.; Investigation, N.K.K., C.N.B. and S.K.S.; Methodology, N.K.K.; Supervision, M.K.; Writing of the original draft, N.K.K.; Writing, review, and editing, N.K.K., M.K., C.N.B. and S.K.S. All authors have read and agreed to the published version of the manuscript.

Funding

This research received no external funding.

Conflicts of Interest

The authors declare no conflict of interest.

Nomenclature

PCCPoint of common coupling
DGDistributed generation
MAACModified Averaging Approach-based Computation
DTFDistribution test feeder
VPCC voltage
ICurrent at PCC
fFrequency at PCC
θPhase angle between V and I
PActive power at PCC
QReactive power at PCC
THDTotal harmonic distortion
THDVTHD of PCC voltage
THDITHD of PCC current
HF55th harmonic factor
HF5VHF5 of PCC voltage
HF5IHF5 of PCC current
ISWIslanding switching event
GILGrid integration level
VminPCC voltage minimum limit as per DG grid interconnection standards
VmaxPCC voltage maximum limit as per DG grid interconnection standards
fminPCC frequency minimum limit as per DG grid interconnection standards
fmaxPCC frequency maximum limit as per DG grid interconnection standards
VthThreshold setting derived for PCC voltage
IthThreshold setting derived for PCC current
fthThreshold setting derived for PCC frequency
θthThreshold setting derived for phase angle
PthThreshold setting derived for active power at PCC
QthThreshold setting derived for reactive power at PCC
THDVthThreshold setting of THDV as per DG grid interconnection standards
THDIthThreshold setting of THDI as per DG grid interconnection standards
HF5VthThreshold setting of HF5V as per DG grid interconnection standards
HF5IthThreshold setting of HF5I as per DG grid interconnection standards

References

  1. Karimi, M.; Mokhlis, H.; Naidu, K.; Uddin, S.; Bakar, A.H.A. Photovoltaic penetration issues and impacts in distribution network—A review. Renew. Sustain. Energy Rev. 2016, 53, 594–605. [Google Scholar] [CrossRef]
  2. Venkatramanan, D.; Singh, M.K.; Ajala, O.; Domimguez-Garcia, A.; Dhople, S. Integrated system models for networks with generators and inverters. In Proceedings of the 11th Bulk Power Systems Dynamics and Control Symposium (IREP 2022), Banff, AB, Canada, 25–30 July 2022. [Google Scholar] [CrossRef]
  3. Venkatramanan, D.; John, V. Integrated high order pulse width modulation filter-transformer structure for single phase static compensator. IET Power Electron. 2013, 6, 67–77. [Google Scholar] [CrossRef]
  4. Bower, W.; Ropp, M. Evaluation of Islanding Detection Methods for Photovoltaic Utility-Interactive Systems; Report IEA PVPS Task V., DOE Contract Number: AC04-94AL85000; Sandia National Lab.: Albuquerque, NM, USA, 2002. [CrossRef]
  5. IEEE Std 1547-2003; IEEE Standard for Interconnecting Distributed Resources with Electric Power Systems. IEEE: Piscataway, NJ, USA, 2003; pp. 1–28. [CrossRef]
  6. IEEE Std 1547-2018 (Revision of IEEE Std 1547-2003); IEEE Standard for Interconnection and Interoperability of Distributed Energy Resources with Associated Electric Power Systems Interfaces. IEEE: Piscataway, NJ, USA, 2018; pp. 1–138. [CrossRef]
  7. Teodorescu, R.; Liserre, M.; Rodriguez, P. Grid Converters for Photovoltaic and Wind Power Systems, 1st ed.; John Wiley & Sons: Hoboken, NJ, USA, 2010. [Google Scholar] [CrossRef]
  8. Kim, M.; Haider, R.; Cho, G.; Kim, C.; Won, C.; Chai, J. Comprehensive review of islanding detection methods for distributed generation systems. Energies 2019, 12, 1–21. [Google Scholar] [CrossRef]
  9. Kulkarni, N.K.; Khedkar, M.K. Methods to Detect the Occurrence of an Unintentional Island with Passive Approach: A Review. J. Inst. Eng. India Ser. B 2021, 102, 1091–1111. [Google Scholar] [CrossRef]
  10. Dutta, S.; Sadhu, P.K.; Reddy, M.J.; Mohanta, D.K. Shifting of research trends in islanding detection method-a comprehensive survey. J. Prot. Control Mod. Power Syst. 2018, 3, 1–20. [Google Scholar] [CrossRef]
  11. Chaitanya, B.K.; Yadav, A.; Pazoki, M.; Abdelaziz, A.Y. A comprehensive review of islanding detection methods. Uncertain. Mod. Power Syst. 2021, 211–256. [Google Scholar] [CrossRef]
  12. Gupta, N.; Dogra, R.; Garg, R.; Kumar, P. Review of islanding detection schemes for utility interactive solar photovoltaic systems. Int. J. Green Energy 2021, 19, 242–253. [Google Scholar] [CrossRef]
  13. Panigrahi, B.K.; Bhuyan, A.; Shukla, J.; Ray, P.K.; Pati, S. A comprehensive review on intelligent islanding detection techniques for renewable energy integrated power system. Int. J. Energy Res. 2021, 45, 14085–14116. [Google Scholar] [CrossRef]
  14. Raza, S.; Mokhlis, H.; Arof, H.; Laghari, J.A.; Wang, L. Application of signal processing techniques for islanding detection of distributed generation in distribution network: A Review. Energy Convers. Manag. 2015, 96, 613–624. [Google Scholar] [CrossRef]
  15. Sawas, A.M.; Woon, W.L.; Pandi, V.R.; Shaaban, M.F.; Zeineldin, H.H. A Multistage Passive Islanding Detection Method for Synchronous-Based Distributed Generation. IEEE Trans. Ind. Inform. 2022, 18, 2078–2088. [Google Scholar] [CrossRef]
  16. Bansal, Y.; Sodhi, R. A Statistical Features Based Generic Passive Islanding Detection Scheme for IIDGs system. IEEE Trans. Power Deliv. 2021, 37, 3176–3188. [Google Scholar] [CrossRef]
  17. Rabuzin, T.; Hohn, F.; Nordstrom, L. Computation of sensitivity-based islanding detection parameters for synchronous generators. Electr. Power Syst. Res. 2021, 190, 1–6. [Google Scholar] [CrossRef]
  18. Khosravi, H.; Samet, H.; Tajdinian, M. Robust Islanding Detection in Micro grids Employing Rate of Change of Kinetic Energy Over Reactive Power. IEEE Trans. Smart Grid 2022, 13, 505–515. [Google Scholar] [CrossRef]
  19. Ramachandradurai, S.; Krishnan, N.; Prabaharan, N. Unintentional passive islanding detection and prevention method with reduced non-detection zones. Energies 2022, 15, 3038. [Google Scholar] [CrossRef]
  20. Swarnkar, N.K.; Mahela, O.P.; Khan, B.; Lalwani, M. Identification of Islanding Events in Utility Grid with Renewable Energy Penetration Using Current Based Passive Method. IEEE Access 2021, 9, 93781–93794. [Google Scholar] [CrossRef]
  21. Zamani, R.; Moghaddam, M.P.; Panahi, H.; Sanaye-Pasand, M. Fast Islanding Detection of Nested Grids Including Multiple Resources Based on Phase Criteria. IEEE Trans. Smart Grid 2021, 12, 4962–4970. [Google Scholar] [CrossRef]
  22. Ropp, M.E.; Begovic, M.; Rohatgi, A. Prevention of Islanding in Grid-connected Photovoltaic Systems. Prog. Photovolt. Res. Appl. 1999, 7, 39–59. [Google Scholar] [CrossRef]
  23. Makwana, Y.M.; Bhalja, B.R. Experimental Performance of an Islanding Detection Scheme Based on Modal Components. IEEE Trans. Smart Grid 2019, 10, 1025–1035. [Google Scholar] [CrossRef]
  24. Jang, S.I.; Kim, K.H. An islanding detection method for distributed generations using voltage unbalance and total harmonic distortion of current. IEEE Trans. Power Deliv. 2004, 19, 745–752. [Google Scholar] [CrossRef]
  25. Ropp, M.E.; Begovic, M.; Rohatgi, A.; Kern, G.A.; Bonn, R.H.; Gonzalez, S. Determining the relative effectiveness of islanding detection methods using phase criteria and non-detection zones. IEEE Trans. Energy Convers. 2000, 15, 290–296. [Google Scholar] [CrossRef]
  26. Ye, Z.; Kolwalkar, A.; Zhang, Y.; Du, P.; Walling, R. Evaluation of anti-islanding schemes based on non-detection zone concept. IEEE Trans. Power Electron. 2004, 19, 1171–1176. [Google Scholar] [CrossRef]
  27. Reigosa, D.; Briz, F.; Charro, C.B.; Gurrero, J.M. Passive islanding detection using inverter non-linear effects. IEEE Trans. Power Electron. 2017, 32, 9434–9445. [Google Scholar] [CrossRef]
  28. Kim, I.-S. Islanding Detection Technique using Grid-Harmonic Parameters in the Photovoltaic System. Energy Procedia 2012, 14, 137–141. [Google Scholar] [CrossRef]
  29. Venkatramanan, D.; John, V. Modeling and analysis of passive networks using dynamic phasors for study of islanded inverters. In Proceedings of the 2017 IEEE Transportation Electrification Conference (ITEC-India), Pune, India, 13–15 December 2017; pp. 1–6. [Google Scholar] [CrossRef]
  30. Venkatramanan, D.; John, V. Dynamic Phasor Modeling and Stability Analysis of SRF-PLL-Based Grid-Tie Inverter Under Islanded Conditions. IEEE Trans. Ind. Appl. 2019, 56, 1953–1965. [Google Scholar] [CrossRef]
  31. Samui, A.; Samantaray, S.R. Assessment of ROCPAD Relay for Islanding Detection in Distributed Generation. IEEE Trans. Smart Grid 2011, 2, 391–398. [Google Scholar] [CrossRef]
  32. Raza, S.; Mokhlis, H.; Arof, H.; Mohammad, H.; Laghari, J.A. Prioritization of different passive parameters for islanding detection on the basis of response analysis. In Proceedings of the IEEE International Conference on Power and Energy (PEcon), Melaka, Malaysia, 28–29 November, 2016; pp. 615–619. [Google Scholar] [CrossRef]
  33. Raza, S.; Mokhlis, H.; Arof, H.; Laghari, J.A.; Mohamad, H. A Sensitivity Analysis of Different Power System Parameters on Islanding Detection. IEEE Trans. Sustain. Energy 2016, 7, 461–470. [Google Scholar] [CrossRef]
  34. Raza, S.; Arof, H.; Mokhlis, H.; Mohamad, H.; Illias, H.A. Passive islanding detection technique for synchronous generators based on performance ranking of different passive parameters. IET Gener. Transm. Distrib. 2017, 11, 4175–4183. [Google Scholar] [CrossRef]
  35. Hoke, A.; SolarCity, S.M.; Nelson, A.; Miller, B.; Chakraborty, S.; Bell, F.; McCarty, M. Experimental Evaluation of PV Inverter Anti-Islanding with Grid Support Functions in Multi-Inverter Island Scenarios. NREL/TP-5D00-66732. 2016. Available online: https://www.osti.gov/biblio/1265055/ (accessed on 24 August 2022).
  36. Hoke, A.F.; Nelson, A.; Chakraborty, S.; Bell, F.; Mccarty, M. An Islanding Detection Test Platform for Multi-Inverter Islands Using Power HIL. IEEE Trans. Ind. Electron. 2018, 65, 7944–7953. [Google Scholar] [CrossRef]
  37. Al Hosani, M.; Qu, Z.; Zeineldin, H.H. A Transient Stiffness Measure for Islanding Detection of Multi-DG Systems. IEEE Trans. Power Deliv. 2015, 30, 986–995. [Google Scholar] [CrossRef]
  38. Singh, A.; Bhatia, S.R.; Chanana, S. An anti-islanding technique for grid-connected DG and multi-DG system. In Proceedings of the 2018 International Conference on Emerging Trends and Innovations in Engineering and Technological Research (ICETIETR), Ernakulam, India, 11–13 July 2018. [Google Scholar] [CrossRef]
  39. Kulkarni, N.K.; Khedkar, M. Performance Ranking of 36 Passive Parameters for Islanding Detection under Single and Multiple PCCs, Single and Multiple Inverter-Interfaced Distributed Generation Sources. In Proceedings of the 2020 IEEE International Conference on Power Electronics, Smart Grid and Renewable Energy (PESGRE2), Cochin, India, 2–4 January 2020; pp. 1–6. [Google Scholar] [CrossRef]
  40. Kulkarni, N.K.; Khedkar, M. Promising Passive Candidates for detecting Single Inverter and Multi-inverter Unintentional island Formation at Different Locations in a Power Distribution Network. In Proceedings of the 2021 6th International Conference for Convergence in Technology (I2CT), Maharashtra, India, 2–4 January 2021; pp. 1–8. [Google Scholar] [CrossRef]
  41. Kulkarni, N.K.; Khedkar, M. Determining potential passive islanding detection indicators for single-point single inverter, single-point multi-inverter and multi-point multi-inverter scenarios. CSEE J. Power Energy Syst. 2022, 8, 696–709. [Google Scholar] [CrossRef]
  42. IEEE Std 1547.1-2005; IEEE Standard Conformance Test Procedures for Equipment Interconnecting Distributed Resources with Electric Power Systems. IEEE: Piscataway, NJ, USA, 2005; pp. 1–62. [CrossRef]
  43. Kersting, W.H. Radial distribution test feeders. In Proceedings of the IEEE Power Engineering Society Winter Meeting Conference Proceedings, Columbus, OH, USA, 28 January–1 February 2001; pp. 908–912. [Google Scholar] [CrossRef]
  44. Mishra, P.P.; Bhende, C.N. Islanding detection using sparse S-transform in distributed generation systems. Electr. Eng. 2018, 100, 2397–2406. [Google Scholar] [CrossRef]
  45. Mishra, P.P.; Bhende, C.N. Islanding detection scheme for distributed generation systems using modified reactive power control strategy. IET Gener. Transm. Distrib. 2018, 13, 814–820. [Google Scholar] [CrossRef]
  46. Mishra, P.P.; Bhende, C.N.; Manikandan, M.S. Islanding detection using total variation-based signal decomposition technique. IET Energy Syst. Integr. 2019, 2, 22–31. [Google Scholar] [CrossRef]
  47. Mishra, P.P.; Bhende, C.N. Islanding Detection based on Variational Mode Decomposition for Inverter based Distributed Generation Systems. IFAC Papers OnLine 2019, 52, 306–311. [Google Scholar] [CrossRef]
  48. Zhang, N.; Sun, Q.; Yang, L.; Li, Y. Event-Triggered Distributed Hybrid Control Scheme for the Integrated Energy System. IEEE Trans. Ind. Inform. 2021, 18, 835–846. [Google Scholar] [CrossRef]
  49. Li, Y.; Gao, W.; Yan, W.; Huang, S.; Wang, R.; Gevorgian, V.; Gao, D. Data-driven Optimal Control Strategy for Virtual Synchronous Generator via Deep Reinforcement Learning Approach. J. Mod. Power Syst. Clean Energy 2021, 9, 919–929. [Google Scholar] [CrossRef]
  50. Mishra, A.; Jena, P. A Scheduled Intentional Islanding Method Based on Ranking of Possible Islanding Zone. IEEE Trans. Smart Grid 2021, 12, 1853–1866. [Google Scholar] [CrossRef]
Figure 1. Unintentional island detection test circuit model as per IEEE 1547.1-2005 standard.
Energies 15 06441 g001
Figure 2. IEEE 13 bus distribution test feeder integrated with PV inverter and rotating DG sources.
Energies 15 06441 g002
Figure 3. IEEE 34 bus distribution test feeder integrated with PV inverter and rotating DG sources.
Energies 15 06441 g003
Figure 4. IEEE 37 bus distribution test feeder integrated with PV inverter and rotating DG sources.
Energies 15 06441 g004
Figure 5. Flowchart for the prioritization of passive parameters through the proposed MAAC methodology.
Energies 15 06441 g005
Figure 6. Effective passive parameters for DTF-1 (IEEE 13 bus system) for the LPM range of PCCs 1 to 4.
Energies 15 06441 g006
Figure 7. Effective passive parameters for DTF-2 (IEEE 34 bus system) for the LPM range of PCCs 1 to 7.
Energies 15 06441 g007
Figure 8. Effective passive parameters for DTF-3 (IEEE 37 bus system) for the LPM range of PCCs 1 to 10.
Energies 15 06441 g008
Table 1. Passive parameters list.
S.no.SymbolParameter Description
Fundamental type
1–6V, I, f, θ, P, and QPCC voltage, current, frequency, phase angle between voltage and current, active power, and reactive power, respectively.
PCC voltage (V)-based combinations
7–12ΔV/ΔT, ΔV/ΔI, ΔV/Δf, ΔV/Δθ, ΔV/ΔP, and ΔV/ΔQDisturbance in voltage for a change in time, current, frequency, phase angle, active power, and reactive power, respectively.
Current at PCC (I)-based combinations
13–18ΔI/ΔT, ΔI/ΔV, ΔI/Δf, ΔI/Δθ, ΔI/ΔP, and ΔI/ΔQDisturbance in current for change in time, voltage, frequency, phase angle, active power, and reactive power, respectively.
Frequency at PCC (f)-based combinations
19–24Δf/ΔT, Δf/ΔV, Δf/ΔI, Δf/Δθ, Δf/ΔP, and Δf/ΔQDisturbance in frequency for change in time, voltage, current, phase angle, active power, and reactive power, respectively.
Phase angle between PCC voltage and current (θ)-based combinations
25–30Δθ/ΔT, Δθ/ΔV, Δθ/ΔI, Δθ/Δf, Δθ/ΔP, and Δθ/ΔQDisturbance in phase angle for change in time, voltage, current, frequency, active power, and reactive power, respectively.
Active power at PCC (P)-based combinations
31–36ΔP/ΔT, ΔP/ΔV, ΔP/ΔI, ΔP/Δf, ΔP/Δθ, and ΔP/ΔQDisturbance in active power for change in time, voltage, current, frequency, phase angle, and reactive power, respectively.
Reactive power at PCC (Q)-based combinations
37–42ΔQ/ΔT, ΔQ/ΔV, ΔQ/ΔI, ΔQ/Δf, ΔQ/Δθ, and ΔQ/ΔPDisturbance in reactive power for change in time, voltage, current, frequency, phase angle, and active power, respectively.
Fundamental harmonic-based
43–44THDV and THDITotal harmonic Distortion (THD) of voltage and current at PCC
45–46HF5V and HF5I5th harmonic factor (HF) of voltage and current at PCC, respectively.
Fundamental harmonic-based combinations
47–52THDV*THDI, THDV*HF5V, THDV*HF5I, THDV/THDI, THDV/HF5V, and THDV/HF5I
53–54THDI*HF5V and THDI*HF5I
55–57THDI/THDV, THDI/HF5V, and THDI/HF5I
58HF5V*HF5I
59–61HF5V/THDV, HF5V/THDI, and HF5V/HF5I
62–64HF5I/THDV, HF5I/THDI, and HF5I/HF5V
Table 2. Specifications of standard IEEE distribution test feeders (DTFs) and DG sources.
Distribution Test Feeder (DTF)DTF-1DTF-2DTF-3
Number of buses133437
Grid supply (mains)115 kV
3-phase, 50 Hz
69 kV
3-phase, 50 Hz
230 kV
3-phase, 50 Hz
Substation transformer rating115 kV/4.16 kV
5000 kVA
69 kV/24.9 kV 2500 kVA230 kV/4.8 kV
2500 kVA
Connection typedelta-grounded Ydelta-delta
XFMR (Step-down transformer)4.16 kV/0.4 kV
500 kVA
24.9 kV/4.16 kV
500 kVA
4.8 kV/0.4 kV
500 kVA
Connection typegrounded Y-grounded Ydelta-delta
Feeder lines3-phase balanced type
Net active power load975 kW1515 kW1059 kW
Net reactive power load660 kVAr1021 kVAr513 kVAr
Number of DG sources integrated into three DTFs040710
All PV inverter and rotating-based DGs are integrated into DTF-1, DTF-2, and DTF-3 at different buses through 3-phase 4.16/0.4 kV, 500 kVA, 24.9/0.4 kV, 500 kVA, and 4.8/0.4 kV, 500 kVA step-down transformers, respectively.
Type-1 *020406
* Type-1: PV inverter-based DG source (80 kW output, 400 Vac, 600 Vdc, and 20 kHz switching frequency voltage source inverter operating at unity power factor)
Type-2 *020304
* Type-2: Rotating-based DG source (75 kW and 100 kVAr power output, 400 Vac, and 1484 RPM Squirrel Cage Induction Generator)
PV inverter DG integration level3.2%12.8%19.2%
Rotating DG integration level5%15%20%
Total DG sources integration level8.2%27.8%39.2%
Table 3. Islanding switching events and the total number of simulations.
S.no.Type of Island Formation At PCC
Point(s)
DG Source(s) Islanded
Possible Combinations
No. of Switches OpeningIslanding Simulations
DTF-1 (IEEE 13 bus system shown in Figure 2)
1–4* Category IOpening of switches
SW1 to
SW4 at
PCC 1, 2, 3, and 4
PV inverter
DG1 and
DG2
one(1 × 8(no. of different types of local loads) × 21 (no. of loading values)) × 4
Rotating
DG1 and
DG2
5–6* Category IIPV inverter
DG1 and
DG2
two(1 × 8 × 21) × 2
Rotating
DG1 and
DG2
7–11* Category IIIboth
PV inverter
DG1,
DG2, and Rotating
DG1,
DG2
two and four(1 × 8 × 21) × 5
Total number of islanding event simulations for DTF-1 = (1 × 8 × 21) × 11 = 1848
DTF-2 (IEEE 34 bus system shown in Figure 3)
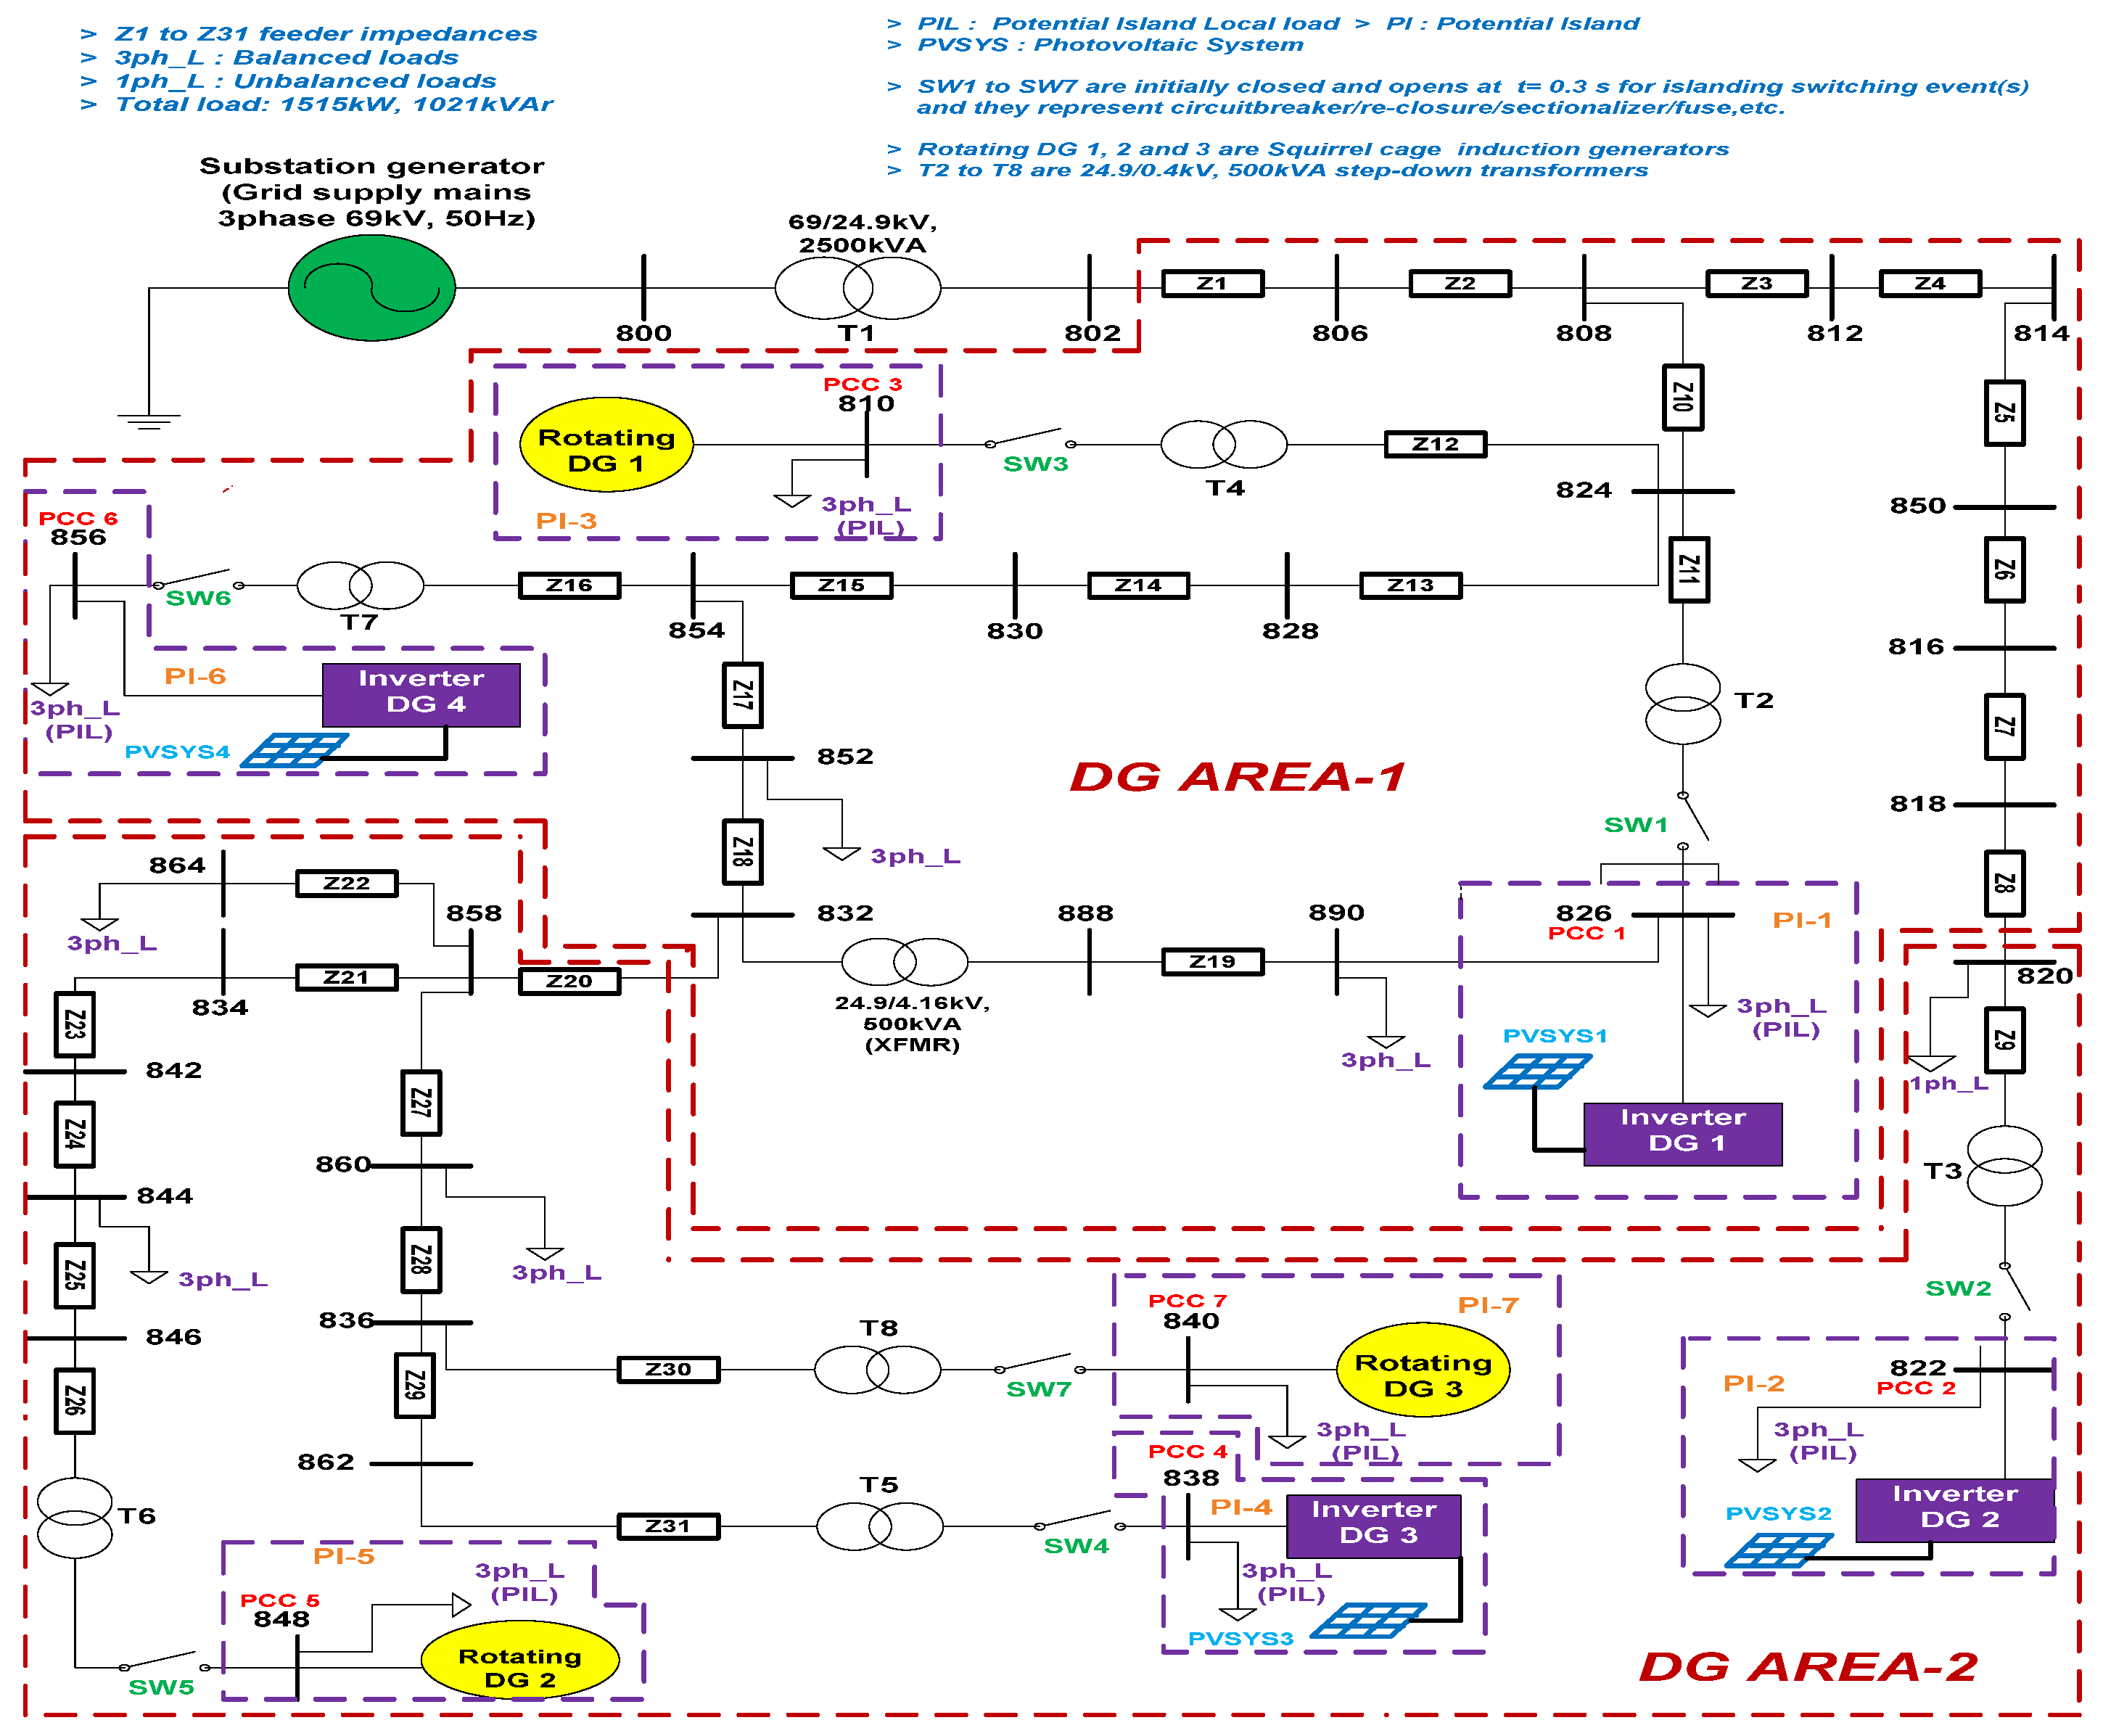
1–7* Category IOpening of switches
SW1 to
SW7 at
PCC 1, 2, 3, 4, 5, 6, and 7
PV inverter
DG1,
DG2,
DG3, and
DG4
one(1 × 8 × 21) × 7
Rotating
DG1,
DG2,
and
DG3
8–22* Category IIPV inverter
DG1,
DG2,
DG3, and
DG4
two, three, and four(1 × 8 × 21) × 15
Rotating
DG1,
DG2,
and
DG3
23–75* Category IIIboth
PV inverter
DG1,
DG2,
DG3,
DG4, and Rotating
DG1,
DG2, and
DG3
two, four, five, six, and seven(1 × 8 × 21) × 53
Total number of islanding event simulations for DTF-2 = (1 × 8 × 21) × 75 = 12,600
DTF-3 (IEEE 37 bus system shown in Figure 4)
1–10* Category IOpening of switches
SW1 to
SW10 at
PCC 1, 2, 3, 4, 5, 6, 7, 8, 9 and 10
PV inverter
DG1,
DG2,
DG3,
DG4,
DG5, and
DG6
one(1 × 8 × 21) × 10
Rotating
DG1,
DG2,
DG3, and
DG4
11–68* Category IIPV inverter
DG1,
DG2,
DG3,
DG4,
DG5, and
DG6
two, three, four, five, and six(1 × 8 × 21) × 58
Rotating
DG1,
DG2,
DG3, and
DG4
two, three, and four
69–258* Category IIIboth
PV inverter
DG1,
DG2,
DG3,
DG4,
DG5,
DG6, and Rotating
DG1,
DG2,
DG3, and
DG4
two, four, six, eight, nine, and ten(1 × 8 × 21) × 190
Total number of islanding event simulations for DTF-3 = (1 × 8 × 21) × 258 = 43,344
* Category-I: Single DG(* type-1) Single location and Single DG(* type-2)-single location island formations
* Category-II: Multi-DG(* type-1) Multi-location and Multi-DG(* type-2)-Multi-location island formations
* Category-III: Multi-DG(both * type-1 and * type-2) Multi-location island formations
* Type-1 DG source is PV inverter-based and * Type-2 DG source is Rotating-based
Table 4. Non-islanding switching events and the total number of simulations.
S.no.Category *Range of VariationNon-Islanding Simulations
DTF-1: IEEE 13 bus distribution test feeder shown in Figure 2
1–6* Passive load switching
at all ‘4′ PCC points and other buses, i.e., 633, 692, 645, 684, and 650 at t = 0.3 s
(100 to 290) kVAr for capacitive and inductive banks and (100 to 290) kW for the resistive bank in steps of 10 kW and 10 kVAr((‘20’ i.e., no. of values) × (‘4’, i.e., no. of PCC points + ‘5’, i.e., no. of other buses)) × 6 = (20 × (4 + 5)) × 6
7Switching ON DG sources (both PV inverter-based and rotating-based DG sources) at buses 633, 692, 645, 684, and 650 at t = 0.3 s5 (no. of other buses) * 2 (no. of DGs)
8Switching ON a non-linear load (a 3-phase diode rectifier) at
buses 633, 692, 645, 684, and 650 at t = 0.3 s
5 (no. of other buses)
Total number of non-islanding event simulations for DTF-1 = (20 × 9 × 6)+ (5 × 2) + 5 = 1095
DTF-2: IEEE 34 bus distribution test feeder shown in Figure 3
1–6* Passive load switching at all ‘7’ PCC points and other buses i.e.,
828, 808, 818, 836, 842, 802 at t = 0.3 s
(1000 to 2900) kVAr and
(1000 to 2900) kW in steps of 100 kW and 100 kVAr
(20 × (7 + 6)) × 6
7Switching ON a DG source (both PV inverter-based and rotating-based DG sources)at buses 828, 808, 818, 836, 842, 802 at t = 0.3 s6 × 2
8Switching ON a non-linear load (a 3-phase diode rectifier)
at buses 828, 808, 818, 836, 842, 802 at t = 0.3 s
6
Total number of non-islanding event simulations for DTF-2 = (20 × 13 × 6) + (6 × 2) + 6 = 1578
DTF-3: IEEE 37 bus distribution test feeder shown in Figure 4
1–6* Passive load switching at all ‘10’ PCC points and at other buses i.e.,
703, 744, 710, 720, 705, and 709 at t = 0.3 s
(1000 to 2900) kVAr and
(1000 to 2900) kW in steps of 100 kW and 100 kVAr
(20 × (10 + 6)) × 6
7Switching ON a DG source (both PV inverter-based and rotating-based DG sources) at buses 703, 744, 710, 720, 705, and 709 at t = 0.3 s6*2
8Switching ON a non-linear load (a 3-phase diode rectifier)
at buses 703, 744, 710, 720, 705, and 709 at t = 0.3 s
6
Total number of non-islanding event simulations for DTF-3 = (20 × 16 × 6) + (6 × 2) + 6 = 1938
* Passive load switching refers to switching ON/OFF of 3-phase capacitive, inductive, and resistive banks
* Power system faults [20] are not as considered since at any given location on three DTFs if a fault occurs, DG sources will feed the fault, and eventually those DGs have to shut down, i.e., DG sources are isolated from the grid.
Table 5. Description of symbols used in the expressions for the computation of averaged islanding values.
ExpressionSymbolDescription
(8)–(10),
(13)–(15),
and (18)–(20)
Pai,j, Pbi,j, Pci,j
Pam,n, Pbm,n, Pcm,n
Par,s, Pbr,s, and Pcr,s
These notations represent passive parameter P’s instantaneous normal and islanding values.
Where i, m, and r are no. of power mismatch values,
j, n, and s are no. of islanding switching events and
a, b, and c represent different types of islanding switching events i.e., ISW1, ISW2, and ISW3 for DTF-1, DTF-2, and DTF-3,
respectively, at a given PCC point.
(11),
(16),
and (21)
PAV_ISW1,x, PAV_ISW2,x, PAV_ISW3,x
PAV_ISW1,y, PAV_ISW2,y, PAV_ISW3,y
PAV_ISW1,z, PAV_ISW2,z, and PAV_ISW3,z
These notations represent averaging of three types of islanding switching events for a particular load ‘x’ for DTF-1, ‘y’ for DTF-2, and ‘z’ for DTF-3 at a given PCC point for a parameter ‘P’.
(12)
(17),
and (22)
PIAV_PCC1_DTF-1, PIAV_PCC1_DTF-2, and PIAV_PCC1_DTF-3These notations represent final averaged normal and islanding values for DTFs-1, 2, and 3, respectively, at a PCC point for a
parameter ‘P’.
Table 6. Description of symbols used in the expressions for computation of the averaged non-islanding values.
ExpressionSymbolDescription
DTF-1 (shown in Figure 2)
(23)Pa,i, Pb,j, and Pc,kThese notations represent passive parameter P’s instantaneous normal
and non-islanding values
where i, j, and k are the number of capacitive/inductive/resistive loading values.
PNIAV_PCC1_DTF-1Passive parameter P’s averaged non-islanding value for PCC1 for DTF-1.
DTF-2 (shown in Figure 3)
(24)Pa,m, Pb,n, and Pc,oThese notations represent passive parameter P’s instantaneous normal
and non-islanding values
where m, n, and o are the number of capacitive/inductive/resistive loading values.
PNIAV_PCC1_DTF-2Passive parameter P’s averaged non-islanding value for PCC1 for DTF-2.
DTF-3 (shown in Figure 4)
(25)Pa,x, Pb,y, and Pc,zThese notations represent passive parameter P’s instantaneous normal
and non-islanding values
where x, y, and z are the number of capacitive/inductive/resistive loading values.
PNIAV_PCC1_DTF-3Passive parameter P’s averaged non-islanding value for PCC1 for DTF-3.
a, b, and c represent different categories of non-islanding events (as per Table 4), i.e., passive load switching, switching ON a DG source, and switching ON a non-linear load in expressions (23)–(25) for DTF-1, DTF-2, and DTF-3,
respectively.
Table 7. Summarization of the effective passive parameters obtained from the proposed MAAC methodology.
PCC PointEffective Passive Parameters for DTF-1 (3.2% PV Inverter and 5% Rotating DG Integration Levels)DG Area
(Figure 2)
LPMMPMHPM
1ΔI/ΔƟ, ΔQ/ΔT, ΔQ/ΔI, and THDV/HF5IΔI/ΔT, ΔƟ/Δf, ΔQ/ΔT, ΔQ/ΔI, and THDV/HF5IΔI/ΔT, ΔI/ΔP, ΔƟ/Δf, ΔP/ΔT, ΔQ/ΔT, ΔQ/ΔI, and THDV/HF5I1
In a similar manner, the effective passive parameters (whose final performance value is ‘1’) are obtained for remaining PCC points 2, 3, and 4, respectively, using the procedure shown inFigure 5.
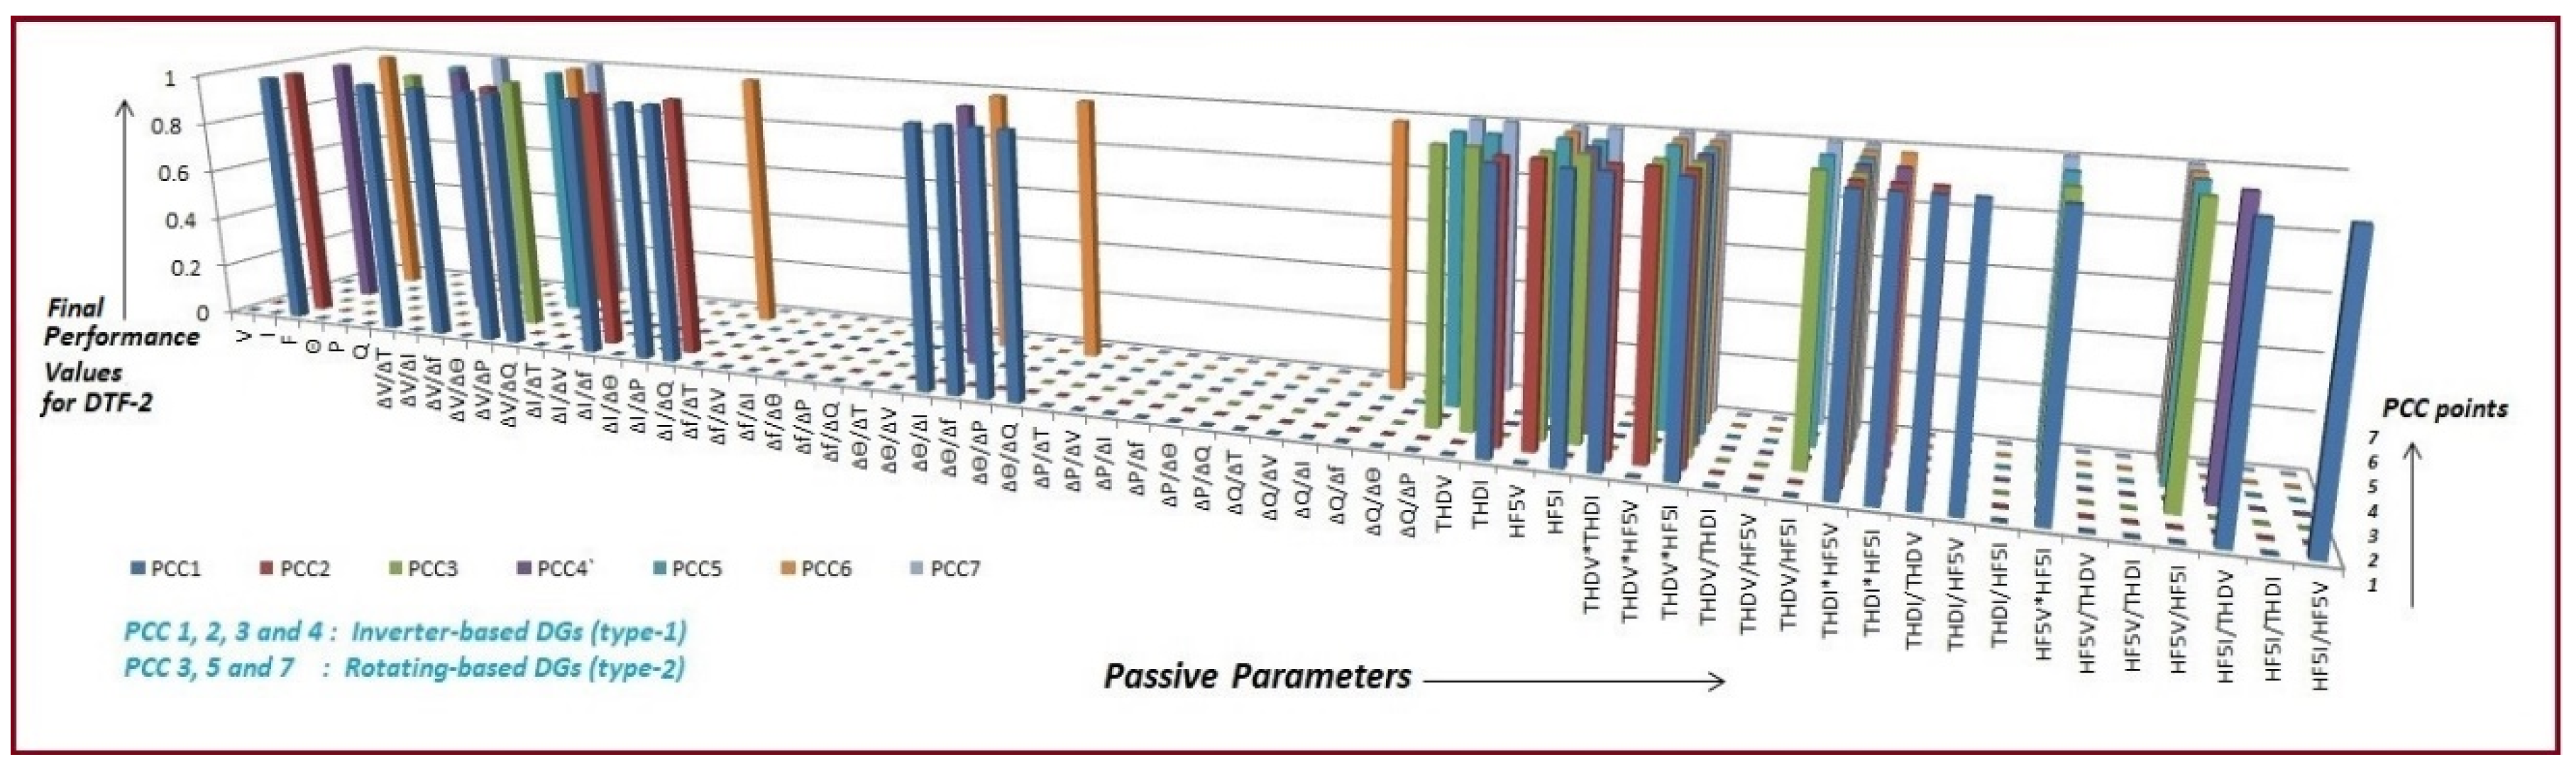
PCC PointEffective Passive Parameters for DTF-2 (12.8% PV Inverter and 15% Rotating DG Integration Levels)DG Area
(Figure 3)
LPMMPMHPM
1f, ΔV/ΔT, ΔV/Δf, ΔV/ΔP, ΔV/ΔQ, ΔI/Δf, ΔI/ΔP, ΔI/ΔQ, ΔƟ/ΔI, ΔƟ/Δf, ΔƟ/ΔP, ΔƟ/ΔQ, THDI, HF5I, THDV*THDI, THDV*HF5I, THDI*HF5V, THDI*HF5I, THDI/THDV, THDI/HF5V, HF5V*HF5I, HF5I/THDV, and HF5I/HF5Vf, ΔV/ΔT, ΔV/Δf, ΔV/ΔP, ΔV/ΔQ, ΔI/Δf, ΔI/ΔP, ΔI/ΔQ, ΔƟ/ΔI, ΔƟ/Δf, ΔƟ/ΔP, ΔƟ/ΔQ, THDI, HF5I, THDV*THDI, THDV*HF5I, THDI*HF5V, THDI*HF5I, THDI/THDV, THDI/HF5V, HF5V*HF5I, HF5I/THDV, and HF5I/HF5Vf, ΔV/ΔT, ΔV/Δf, ΔV/ΔP, ΔV/ΔQ, ΔI/Δf, ΔI/ΔP, ΔI/ΔQ, ΔƟ/ΔI, ΔƟ/Δf, ΔƟ/ΔP, ΔƟ/ΔQ, THDI, HF5I, THDV*THDI, THDV*HF5I, THDI*HF5V, THDI*HF5I, THDI/THDV, THDI/HF5V, HF5V*HF5I, HF5I/THDV, and HF5I/HF5V1
In a similar manner, the effective passive parameters (whose final performance value is ‘1’) are obtained for the remaining PCC points 2, 3, 4, 5, 6, and 7, respectively, using the procedure shown inFigure 5.
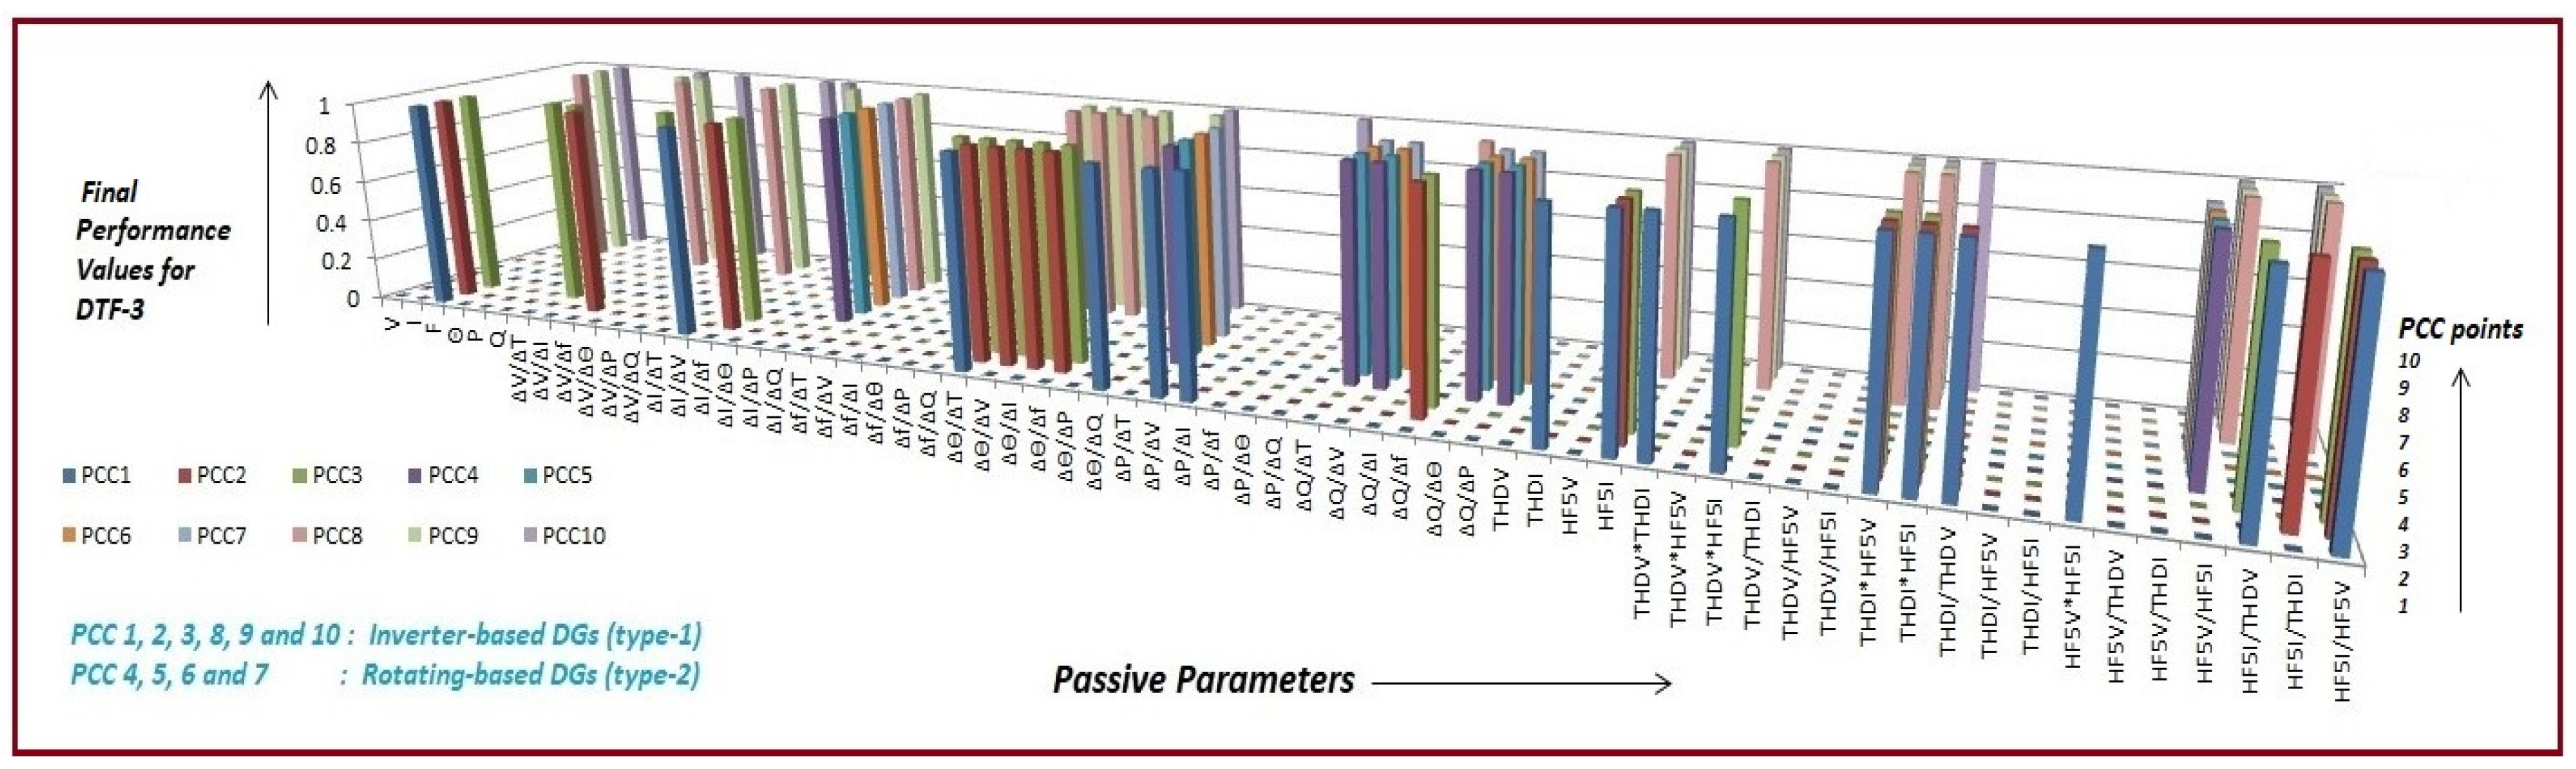
PCC PointEffective Passive Parameters for DTF–3 (19.2% PV Inverter and 20% Rotating DG Integration Levels)DG Area
(Figure 4)
LPMMPMHPM
1f, ΔI/ΔV, ΔƟ/ΔT, ΔƟ/ΔQ, ΔP/ΔV, ΔP/ΔI, THDI, HF5I, THDV*THDI, THDV*HF5I, THDI*HF5V, THDI*HF5I, THDI/THDV, HF5V*HF5I, HF5I/THDV, and HF5I/HF5Vf, ΔI/ΔV, ΔƟ/ΔT, ΔƟ/ΔQ, ΔP/ΔV, ΔP/ΔI, THDI, HF5I, THDV*THDI, THDV*HF5I, THDI*HF5V, THDI*HF5I, THDI/THDV, HF5V*HF5I, HF5I/THDV, and HF5I/HF5Vf, ΔƟ/ΔT, ΔƟ/ΔQ, ΔP/ΔV, ΔP/ΔI, ΔQ/Δf, THDI, HF5I, THDV*THDI, THDV*HF5I, THDI*HF5V, THDI*HF5I, THDI/THDV, HF5I/THDV, and HF5I/HF5V2
In a similar manner, the effective passive parameters (whose final performance value is ‘1’) are obtained for the remaining PCC points 2, 3, 4, 5, 6, 7, 8, 9, and 10, respectively, using the procedure shown inFigure 5.
Table 8. Reduction in data size and computational values.
Type of Data and Computational Burden (for a Given Passive Parameter)Prioritization Scheme Given in [32,33,34,39,40]Averaging Approach-Based Prioritization Scheme Given in [41]Proposed MAAC-Based Prioritization Methodology
Islanding values are themselves threshold values in these schemesThreshold values are obtained from DG grid-interconnection standards [6,7,10]
Islanding values data size (as per Table 3)1848 (DTF-1), 12,600 (DTF-2), and 43,344 (DTF-3)1 (for DTF-1, DTF-2, and DTF-3)
Non-islanding values data size (as per Table 4)1095 (DTF-1), 1578 (DTF-2), and 1938 (DTF-3)1 (for DTF-1, DTF-2, and DTF-3)
Threshold values data size1848 (DTF-1), 12,600 (DTF-2), and 43,344 (DTF-3)1 (for DTF-1, DTF-2, and DTF-3)
Percentage reduction in islanding values data size0% (for DTF-1, DTF-2, and DTF-3)99.95% (DTF-1), 99.99% (DTF-2), and 99.99% (DTF-3)
Percentage reduction in non-islanding values data size0% (for DTF-1, DTF-2, and DTF-3)0% (for DTF-1, DTF-2, and DTF-3) 99.91% (DTF-1),
99.94% (DTF-2), and 99.95% (DTF-3)
Percentage reduction in threshold value data size0% (DTF-1), 0% (DTF-2), and 0% (DTF-3)99.95% (DTF-1), 99.99% (DTF-2), and 99.99% (DTF-3)
Computational burden (obtained by computing the number of comparisons)Here, the number of comparisons required is obtained by computing, i.e., (no. of averaged islanding values + no. of averaged non-islanding values) * no. of threshold values for the proposed MAAC methodology.
Publisher’s Note: MDPI stays neutral with regard to jurisdictional claims in published maps and institutional affiliations.

