
A Fault Detection Method Based on CNN and Symmetrized Dot Pattern for PV Modules


Abstract
:1. Introduction
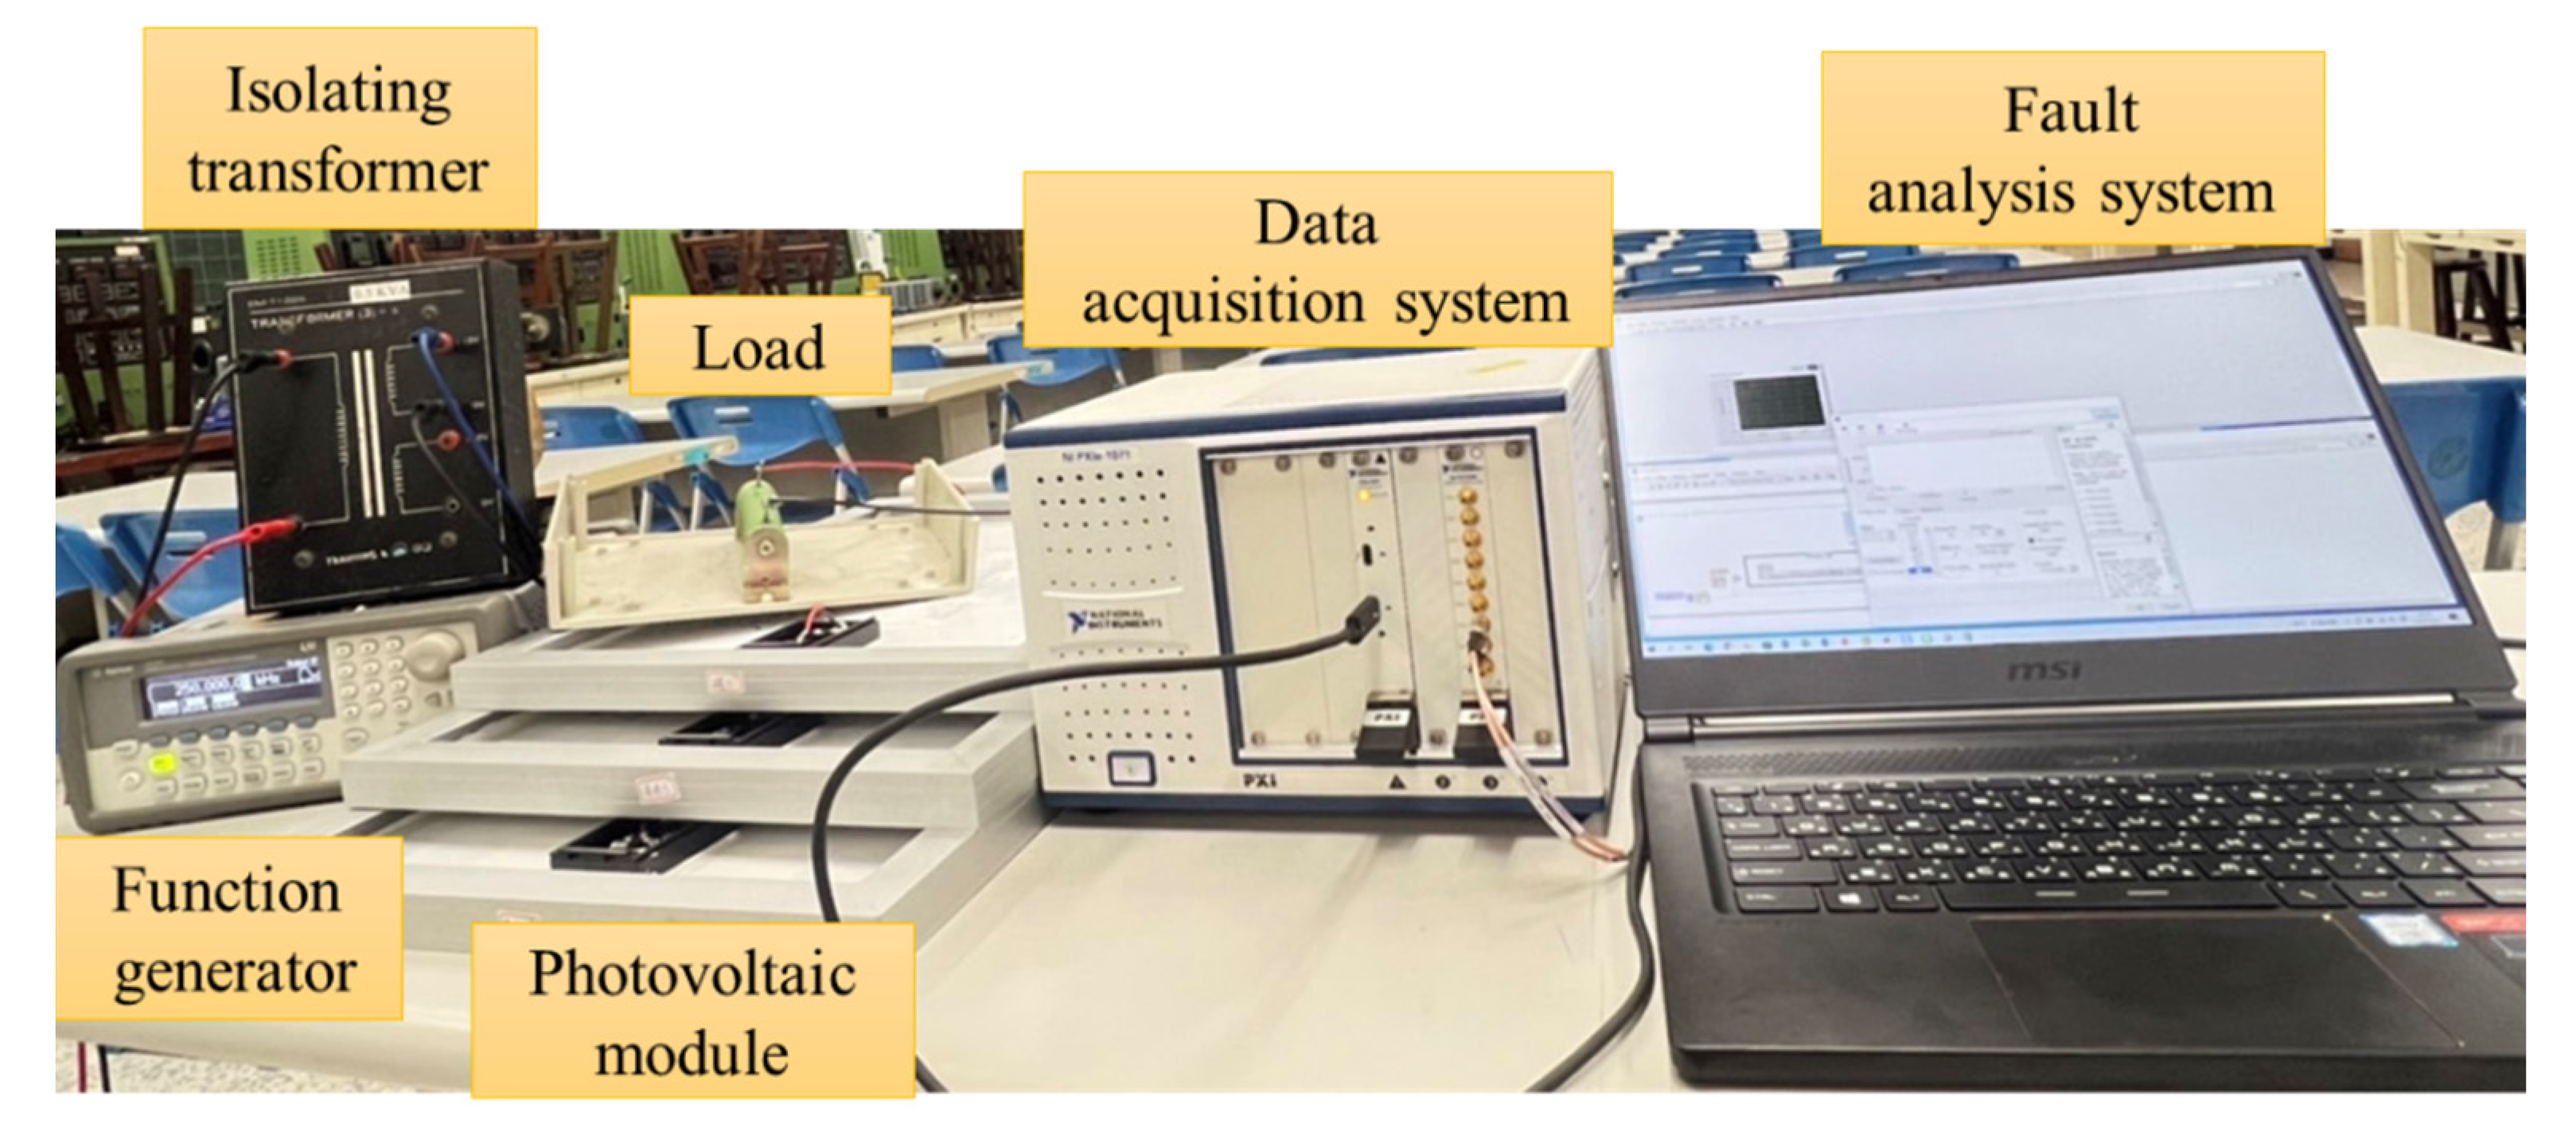
2. Architecture and Design of the Research System
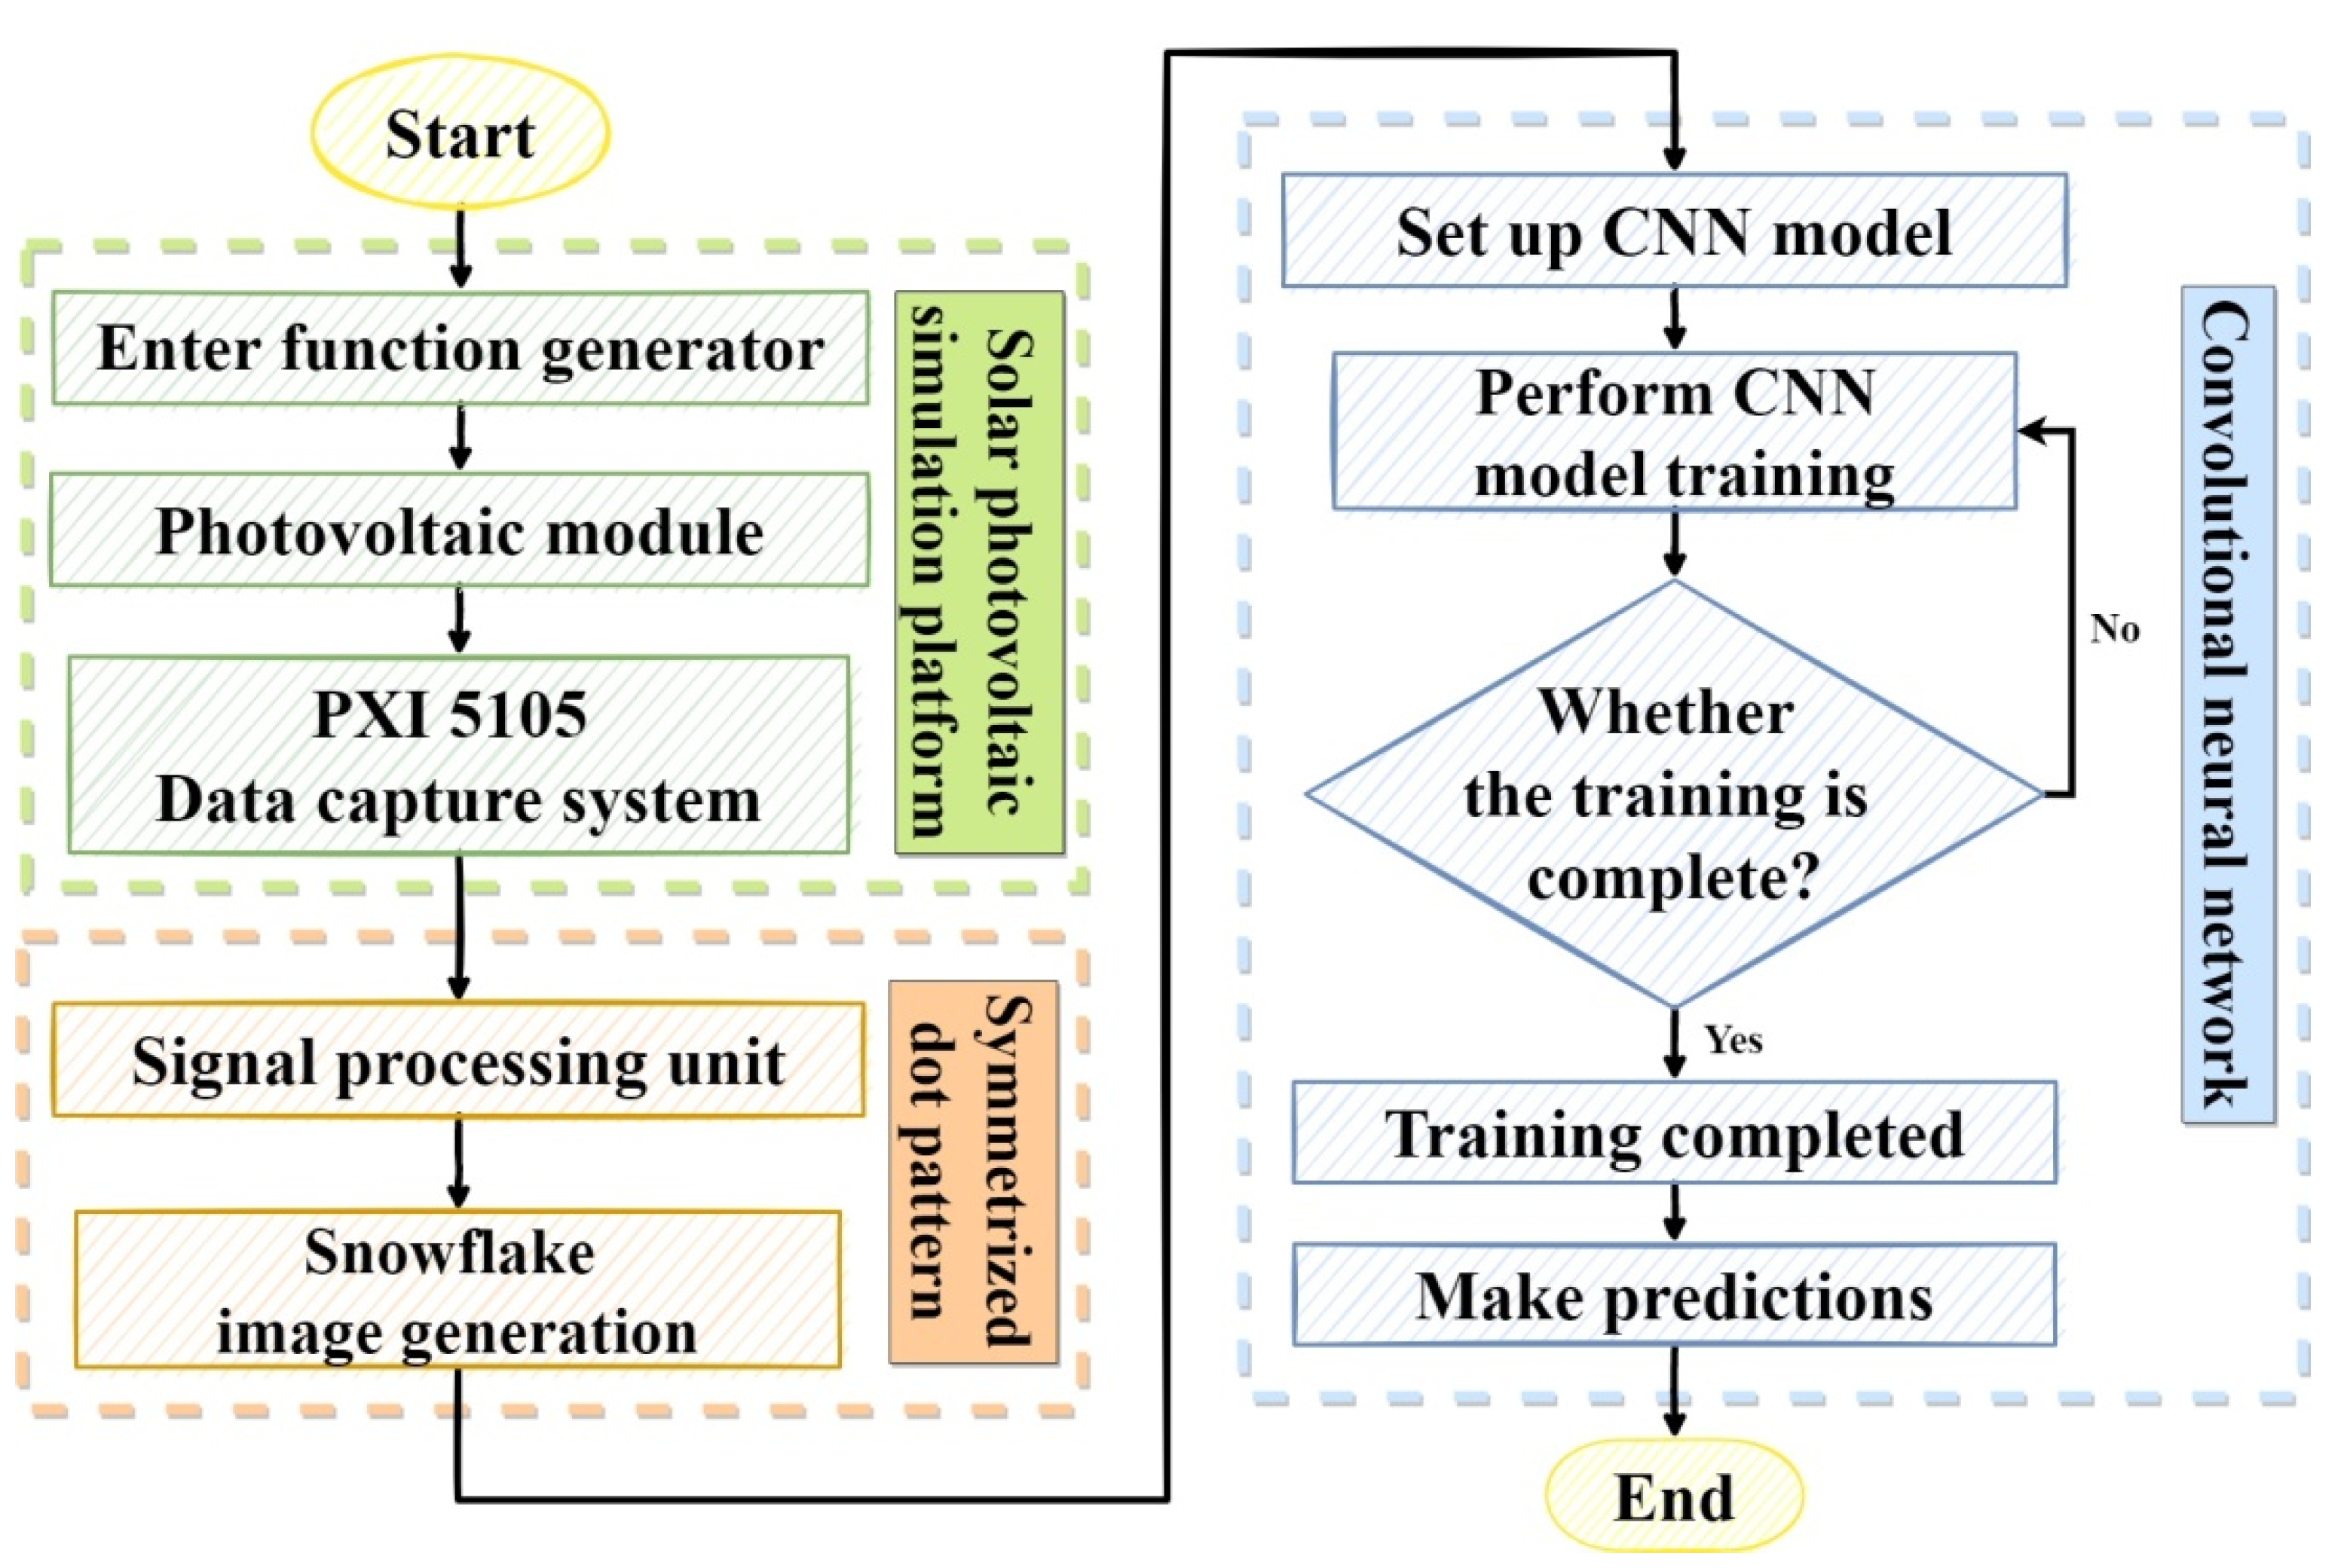
2.1. The Overall System Detection Process Architecture
2.2. A Fault-Testing Platform and PV Module Fault-Type Construction
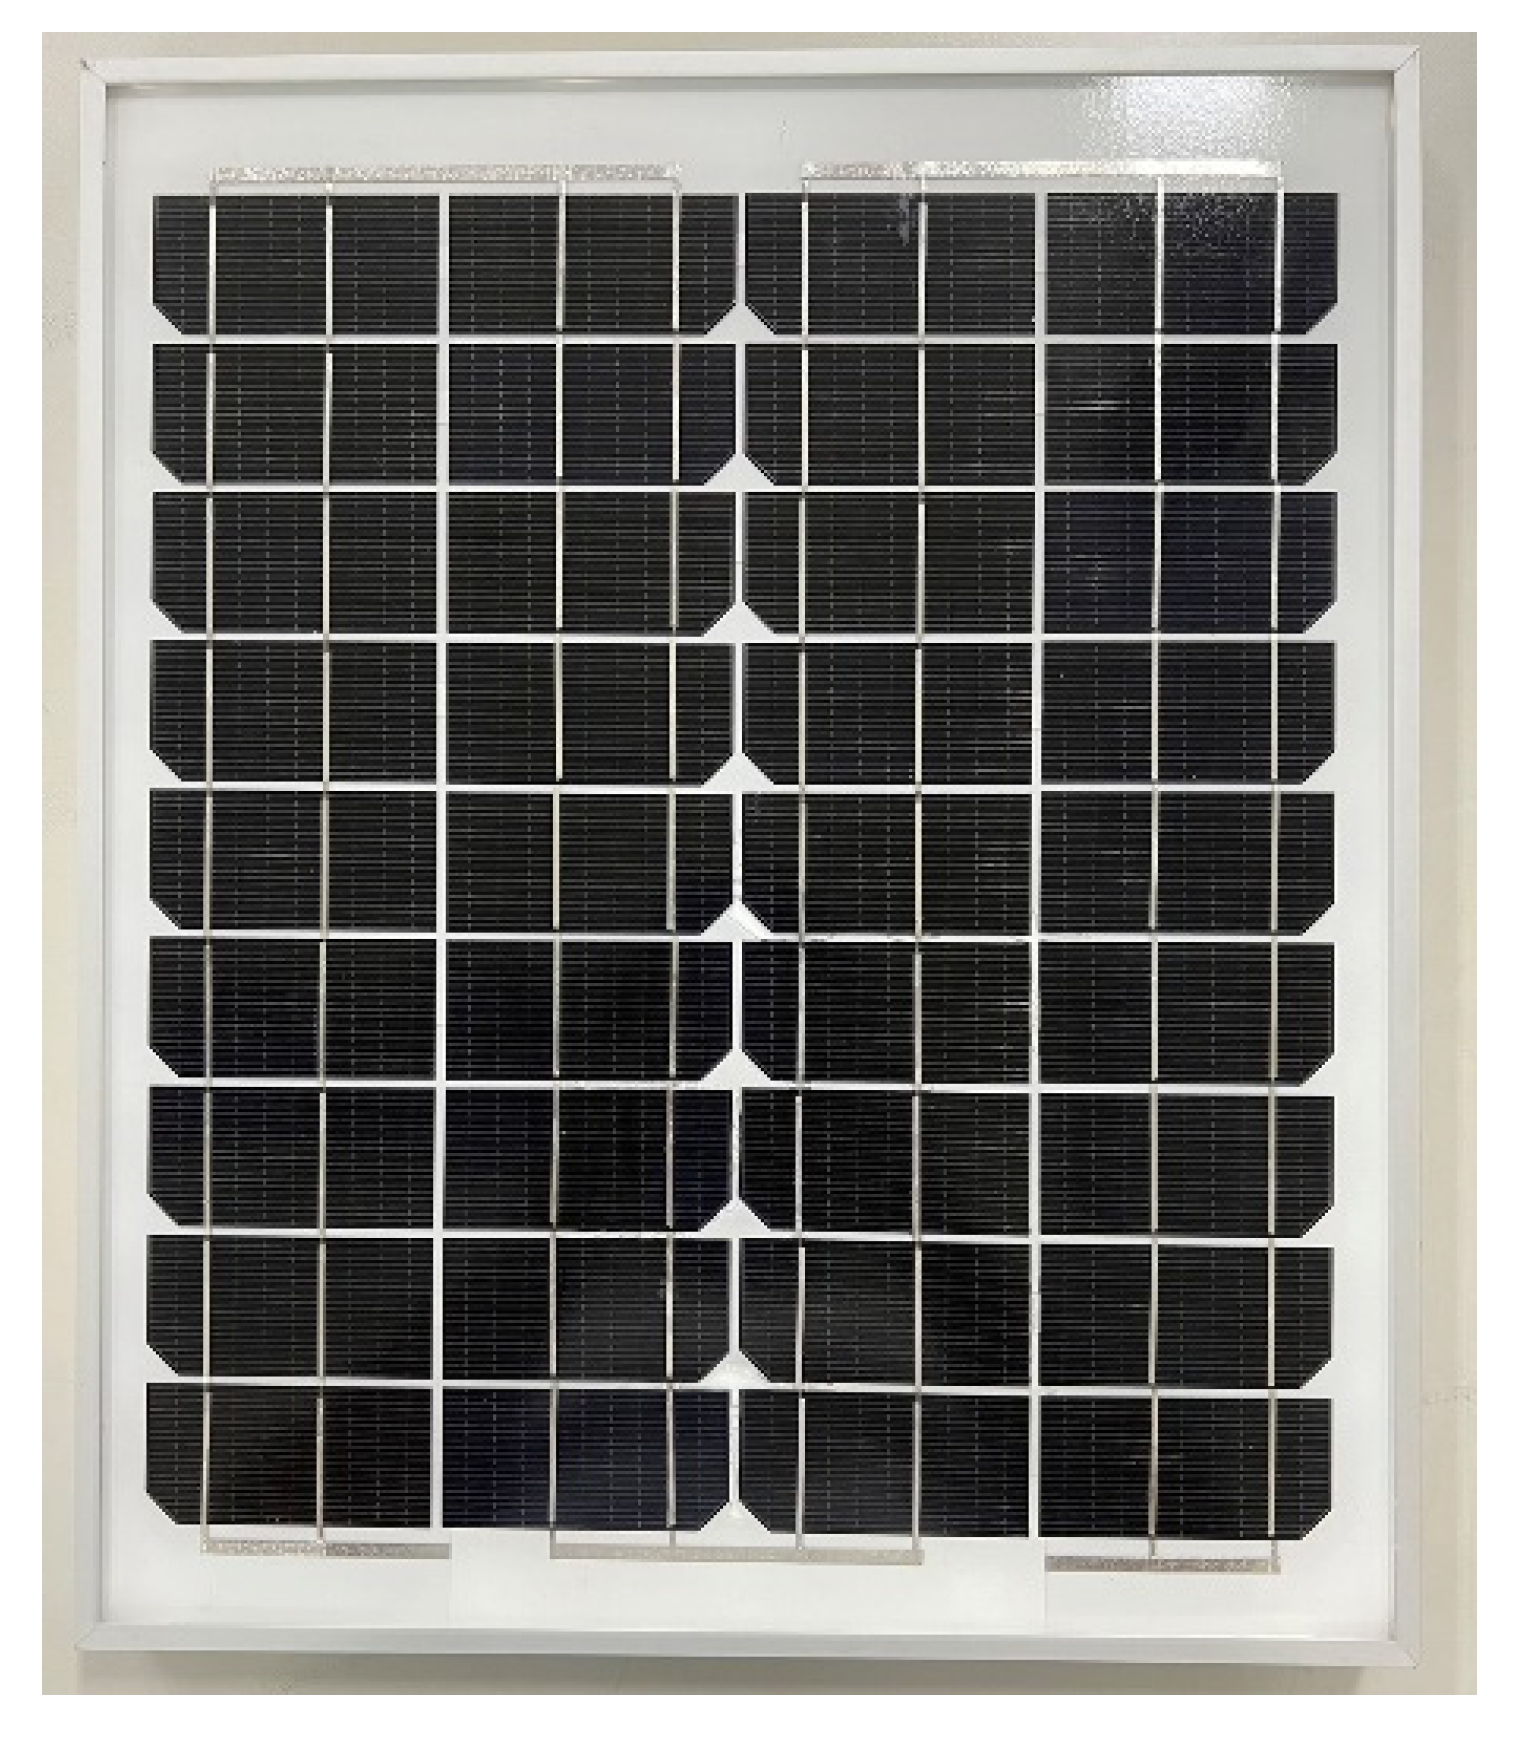
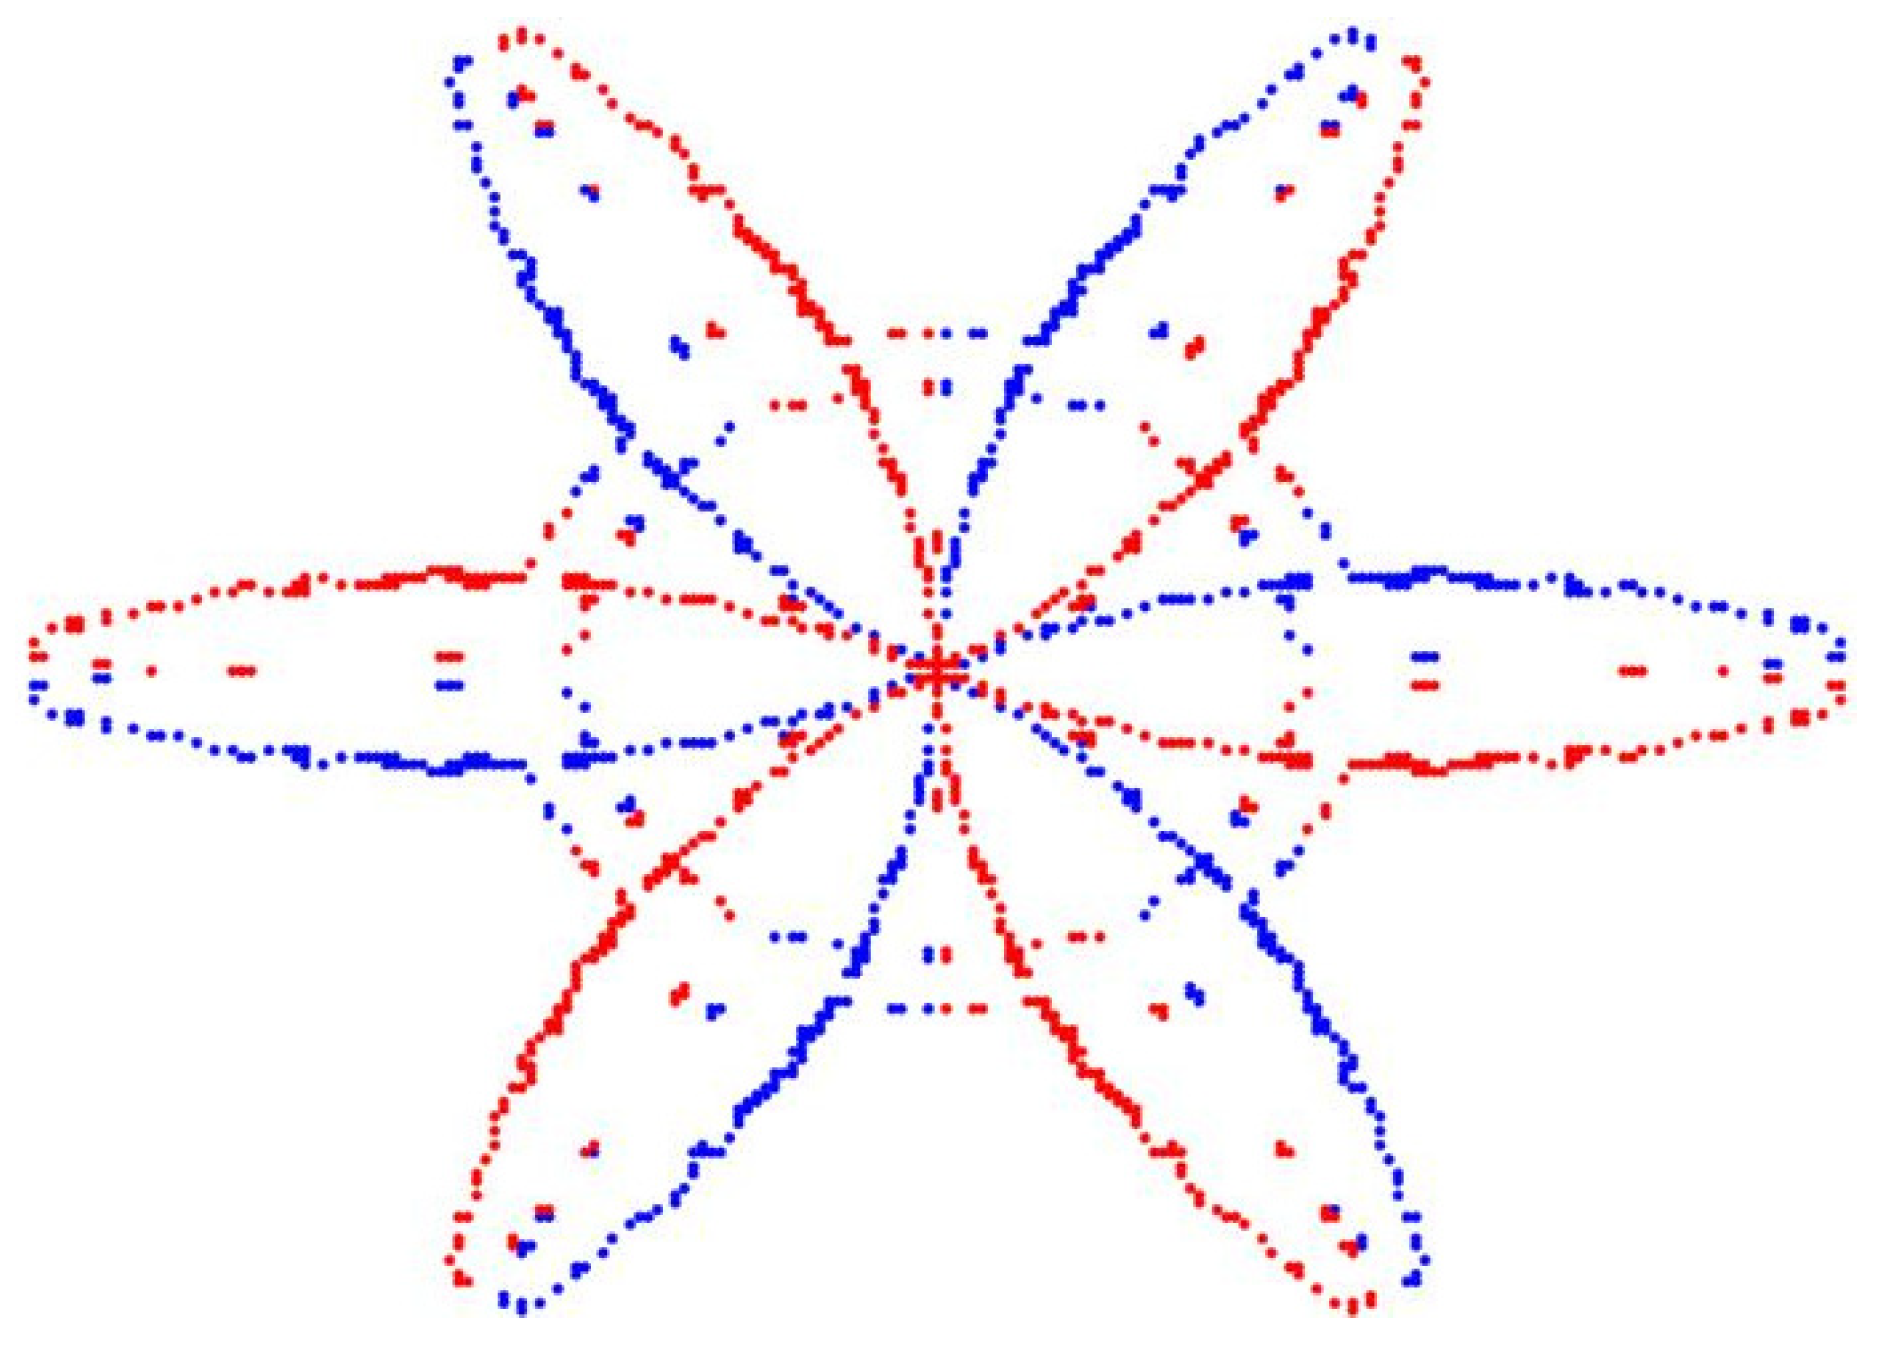
2.2.1. Normal PV Module (Type 1)
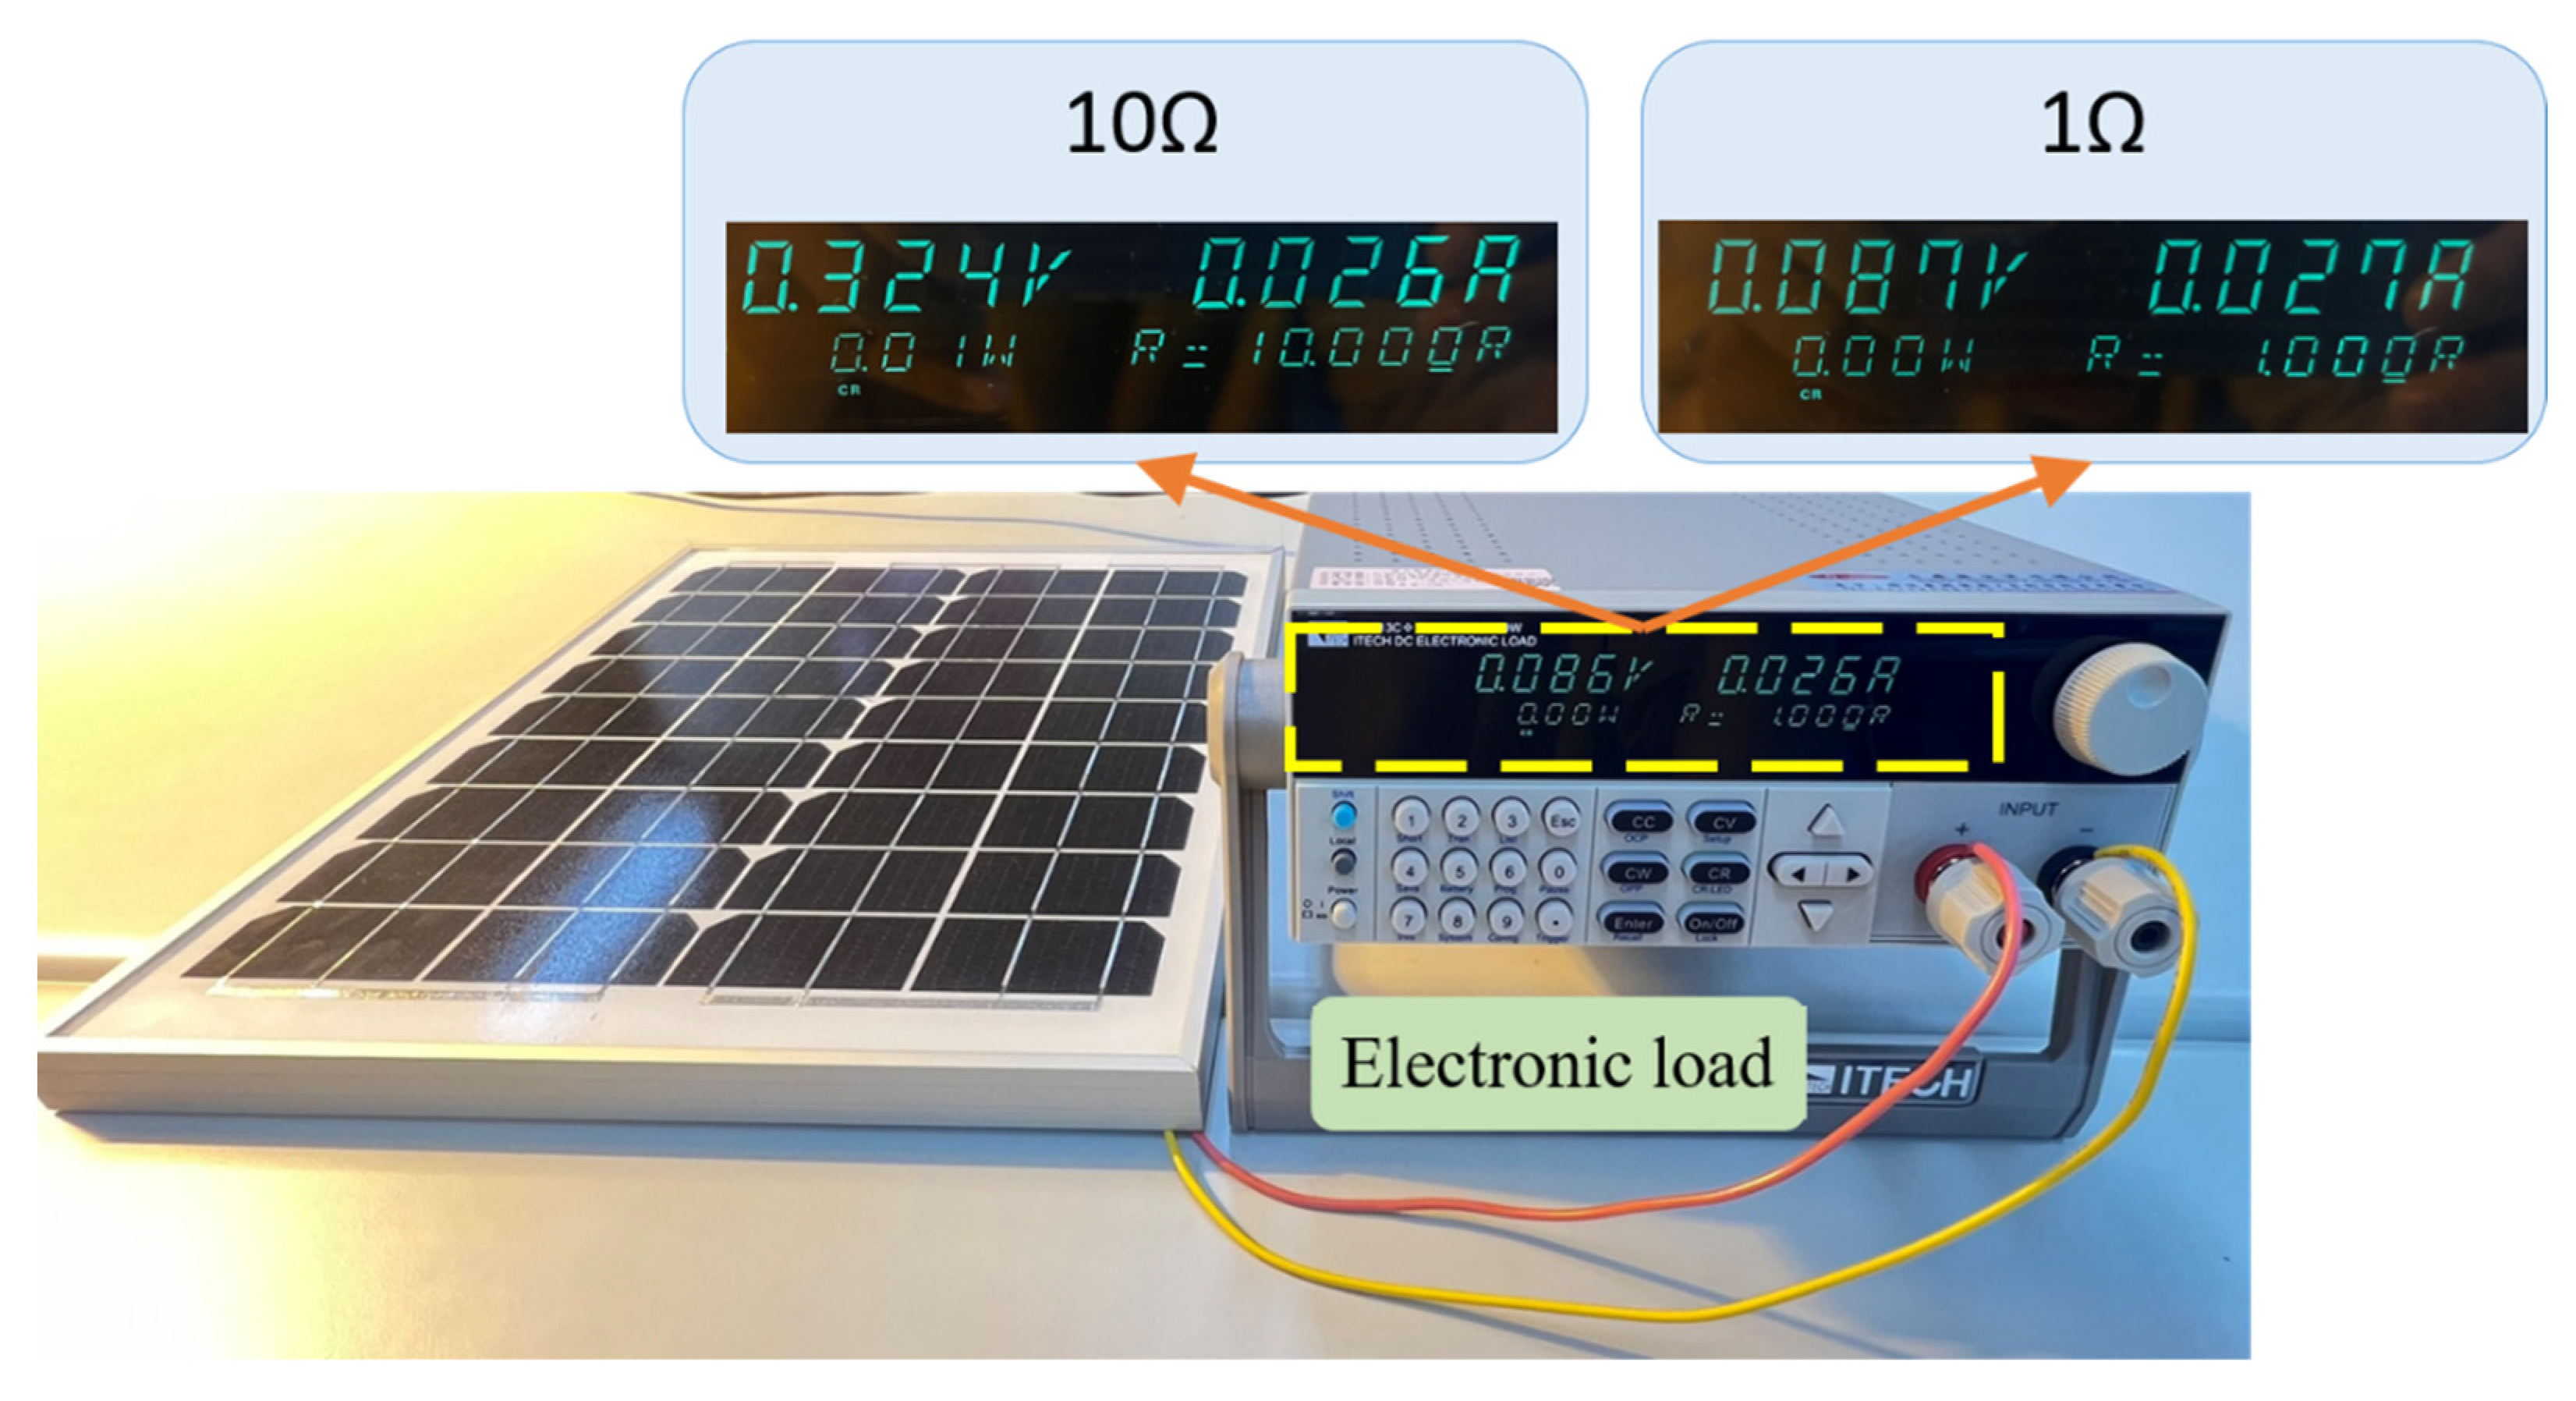
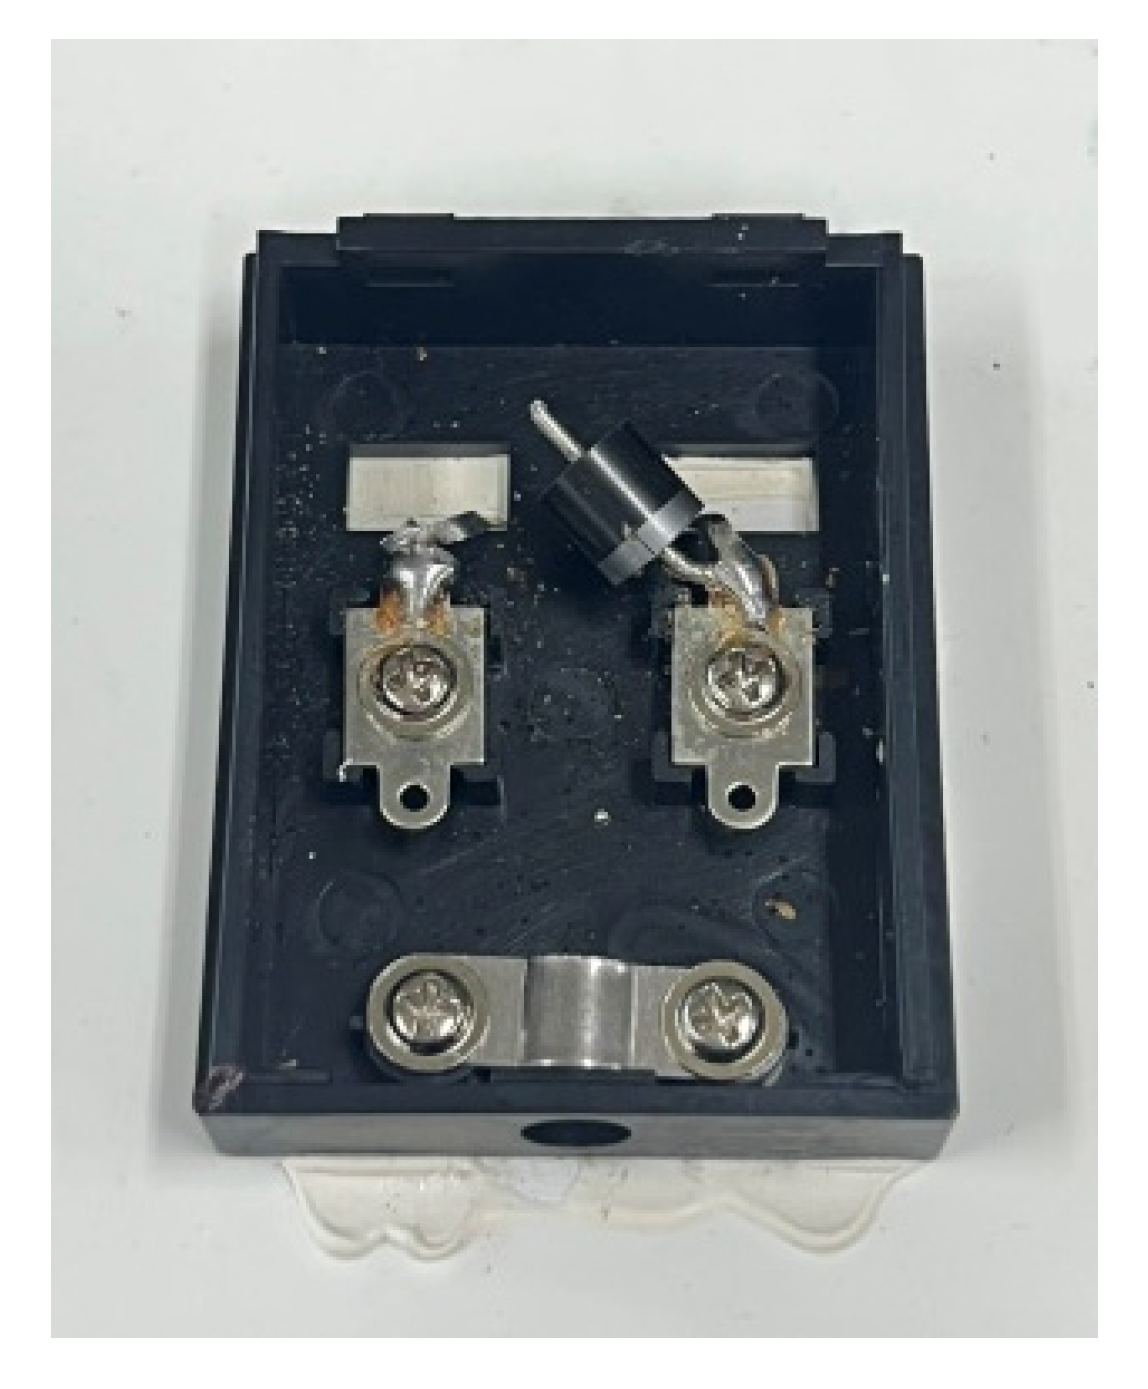
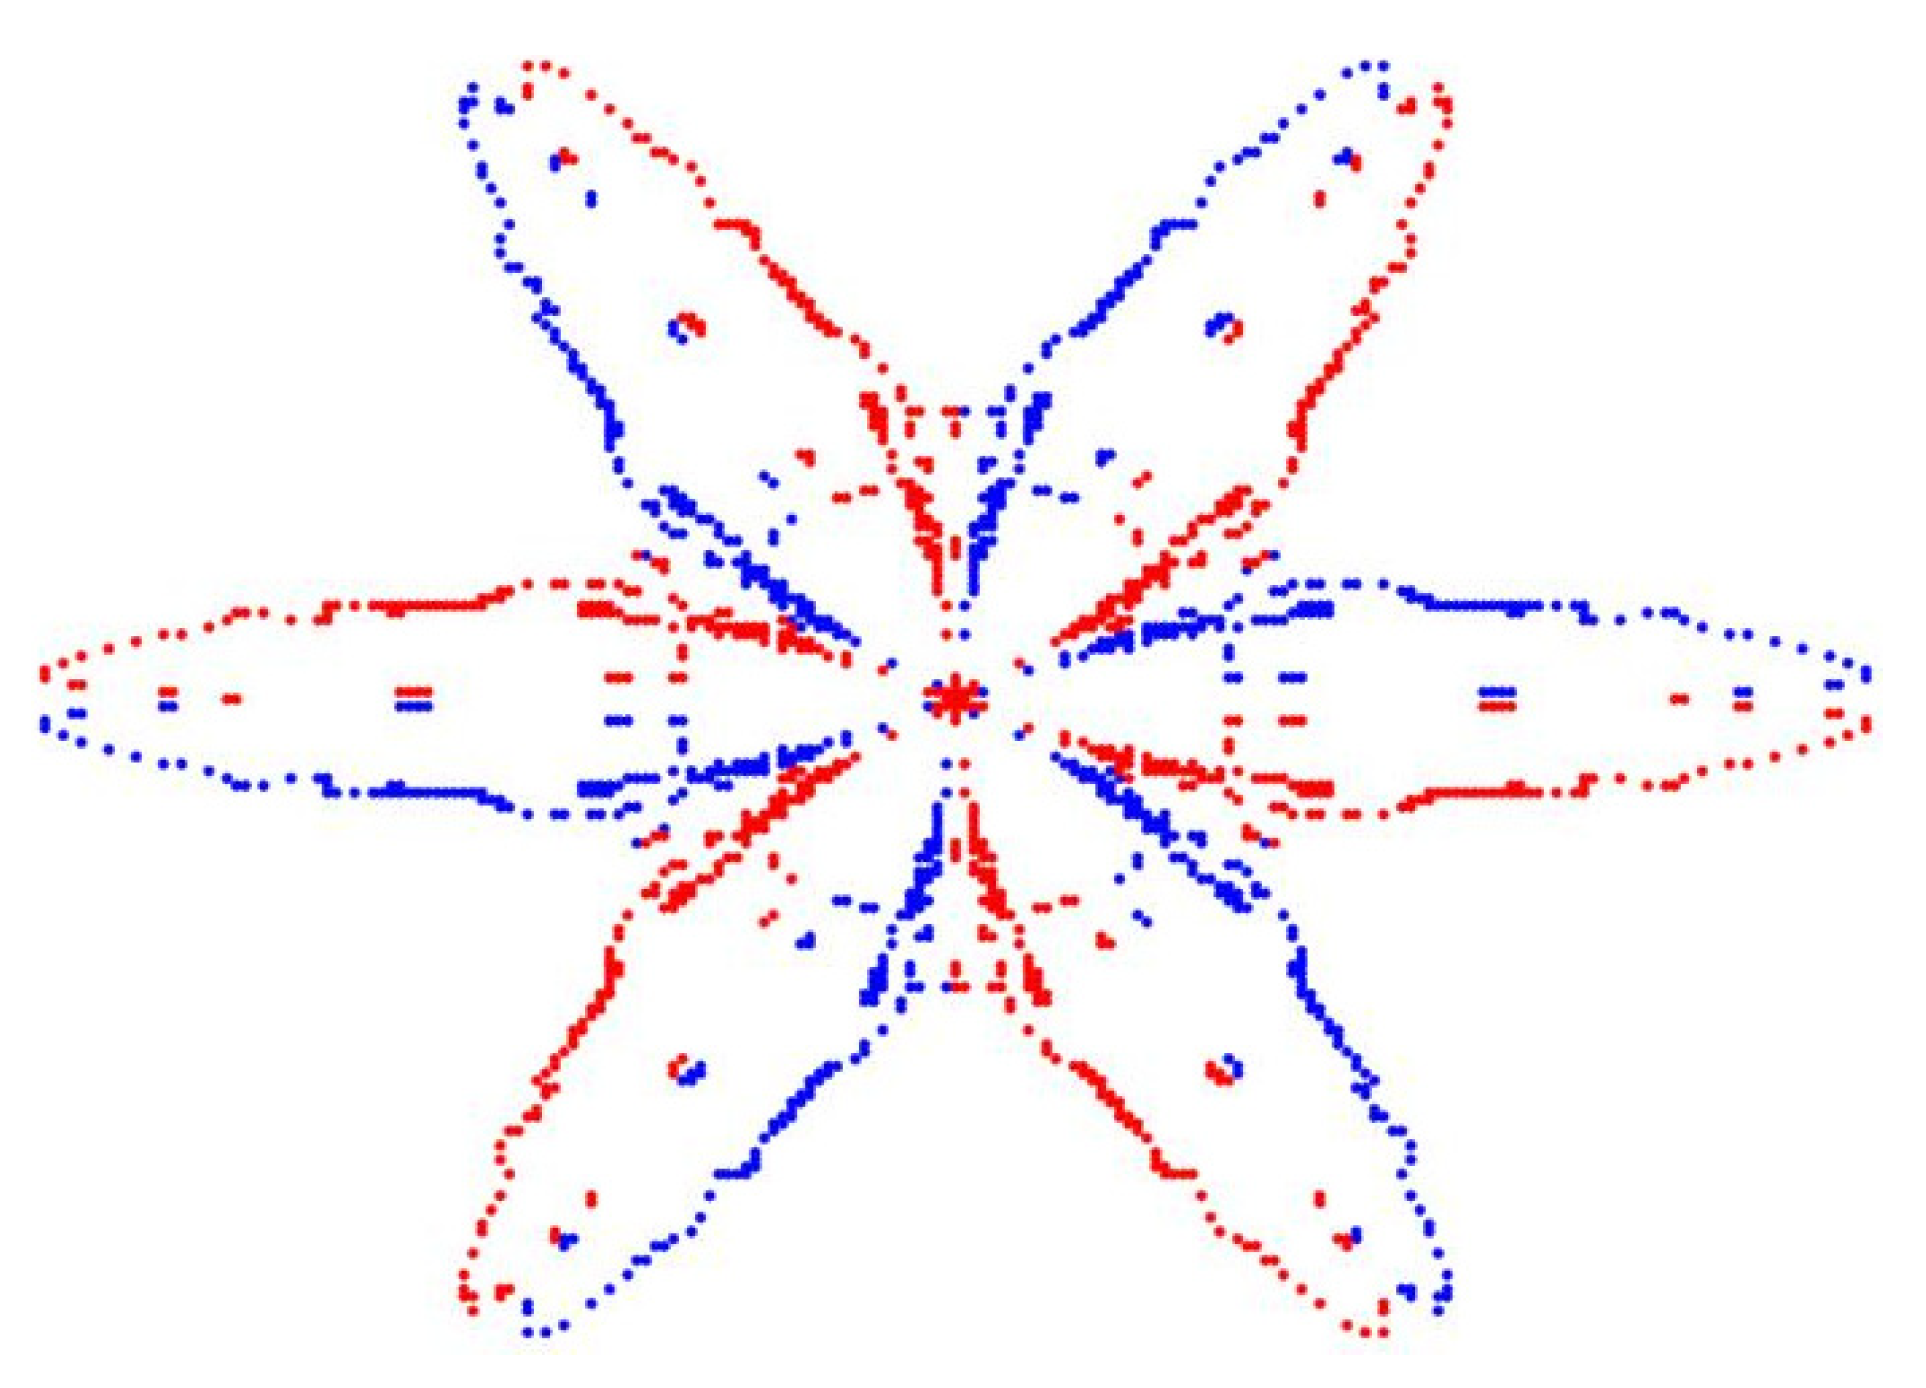
2.2.2. Poor Connection on a PV Module (Type 2)
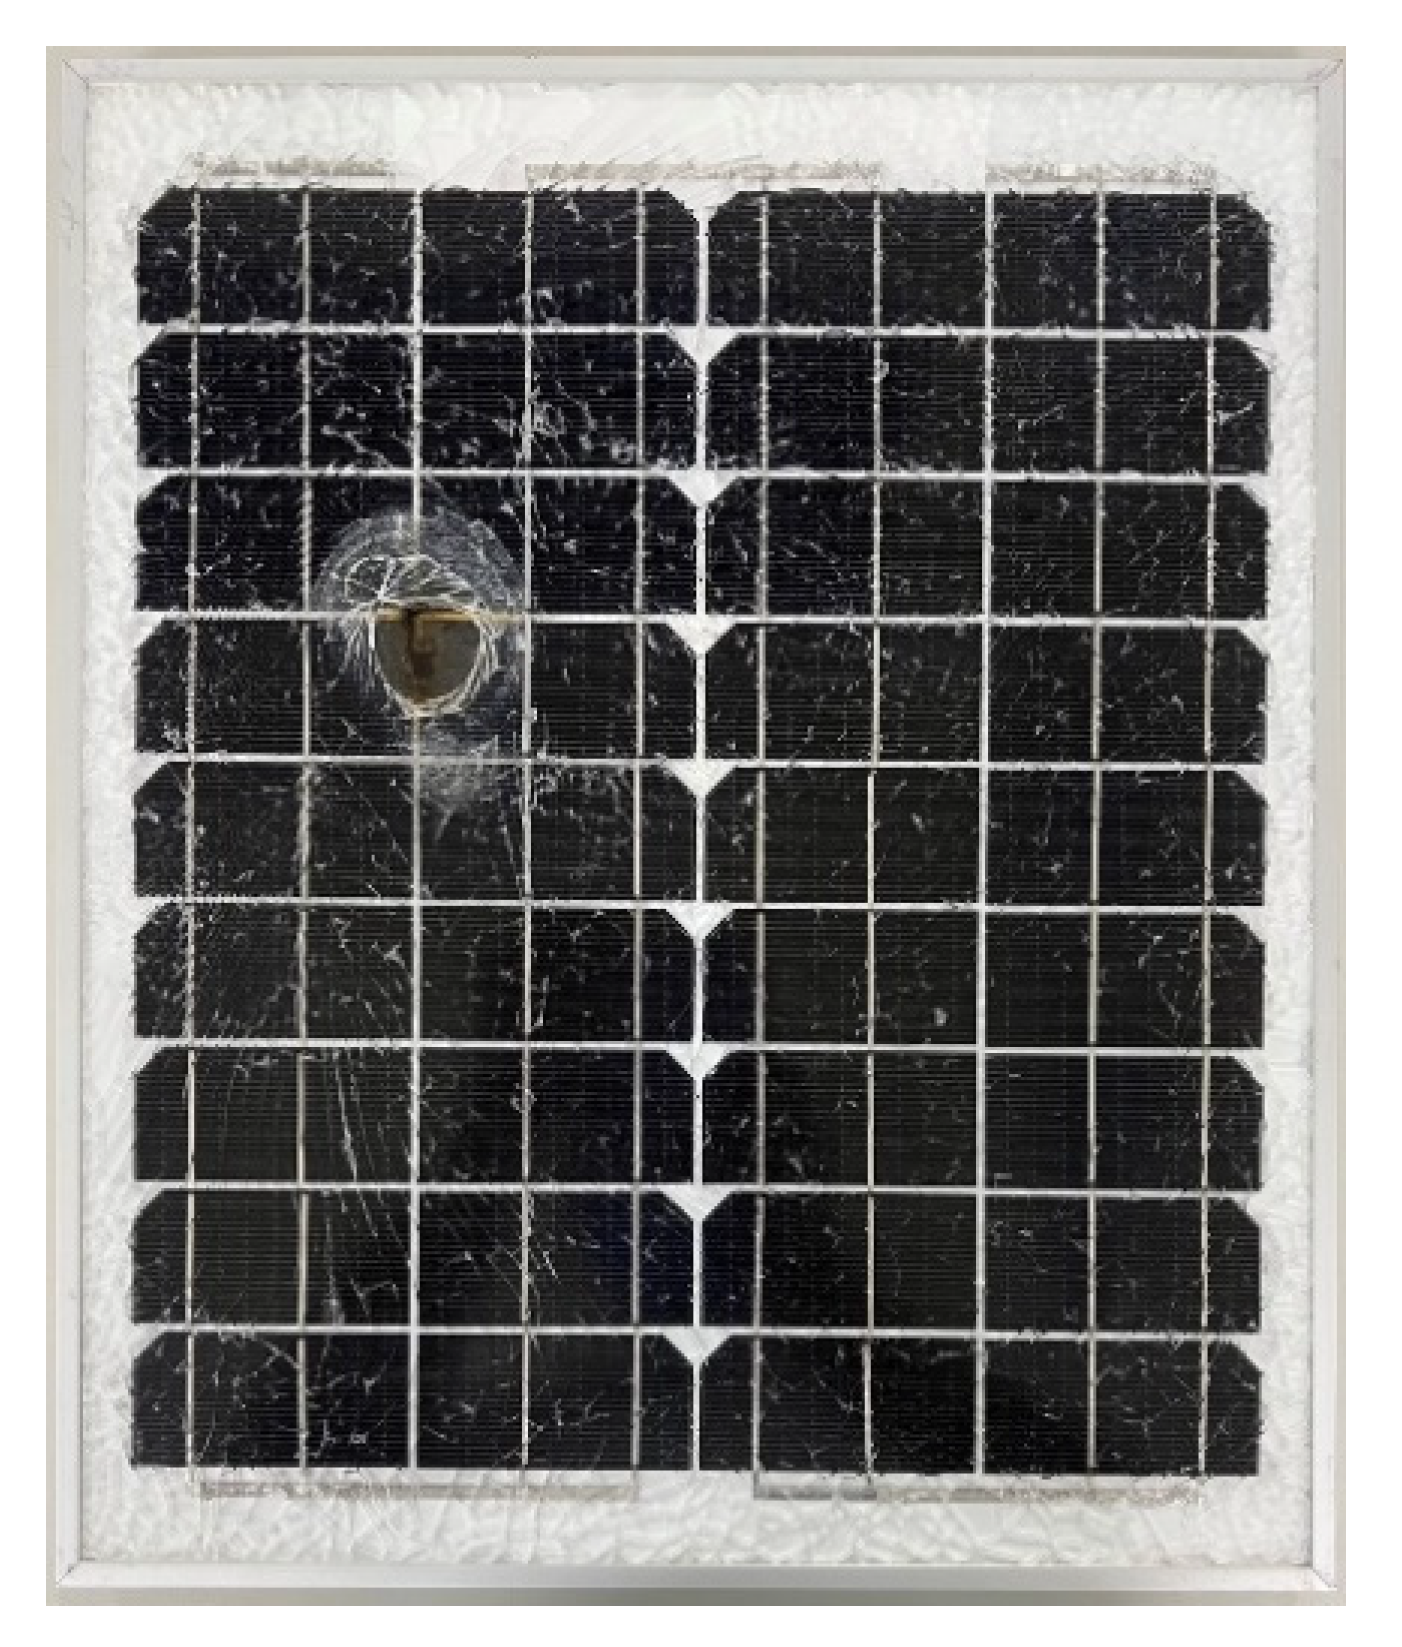
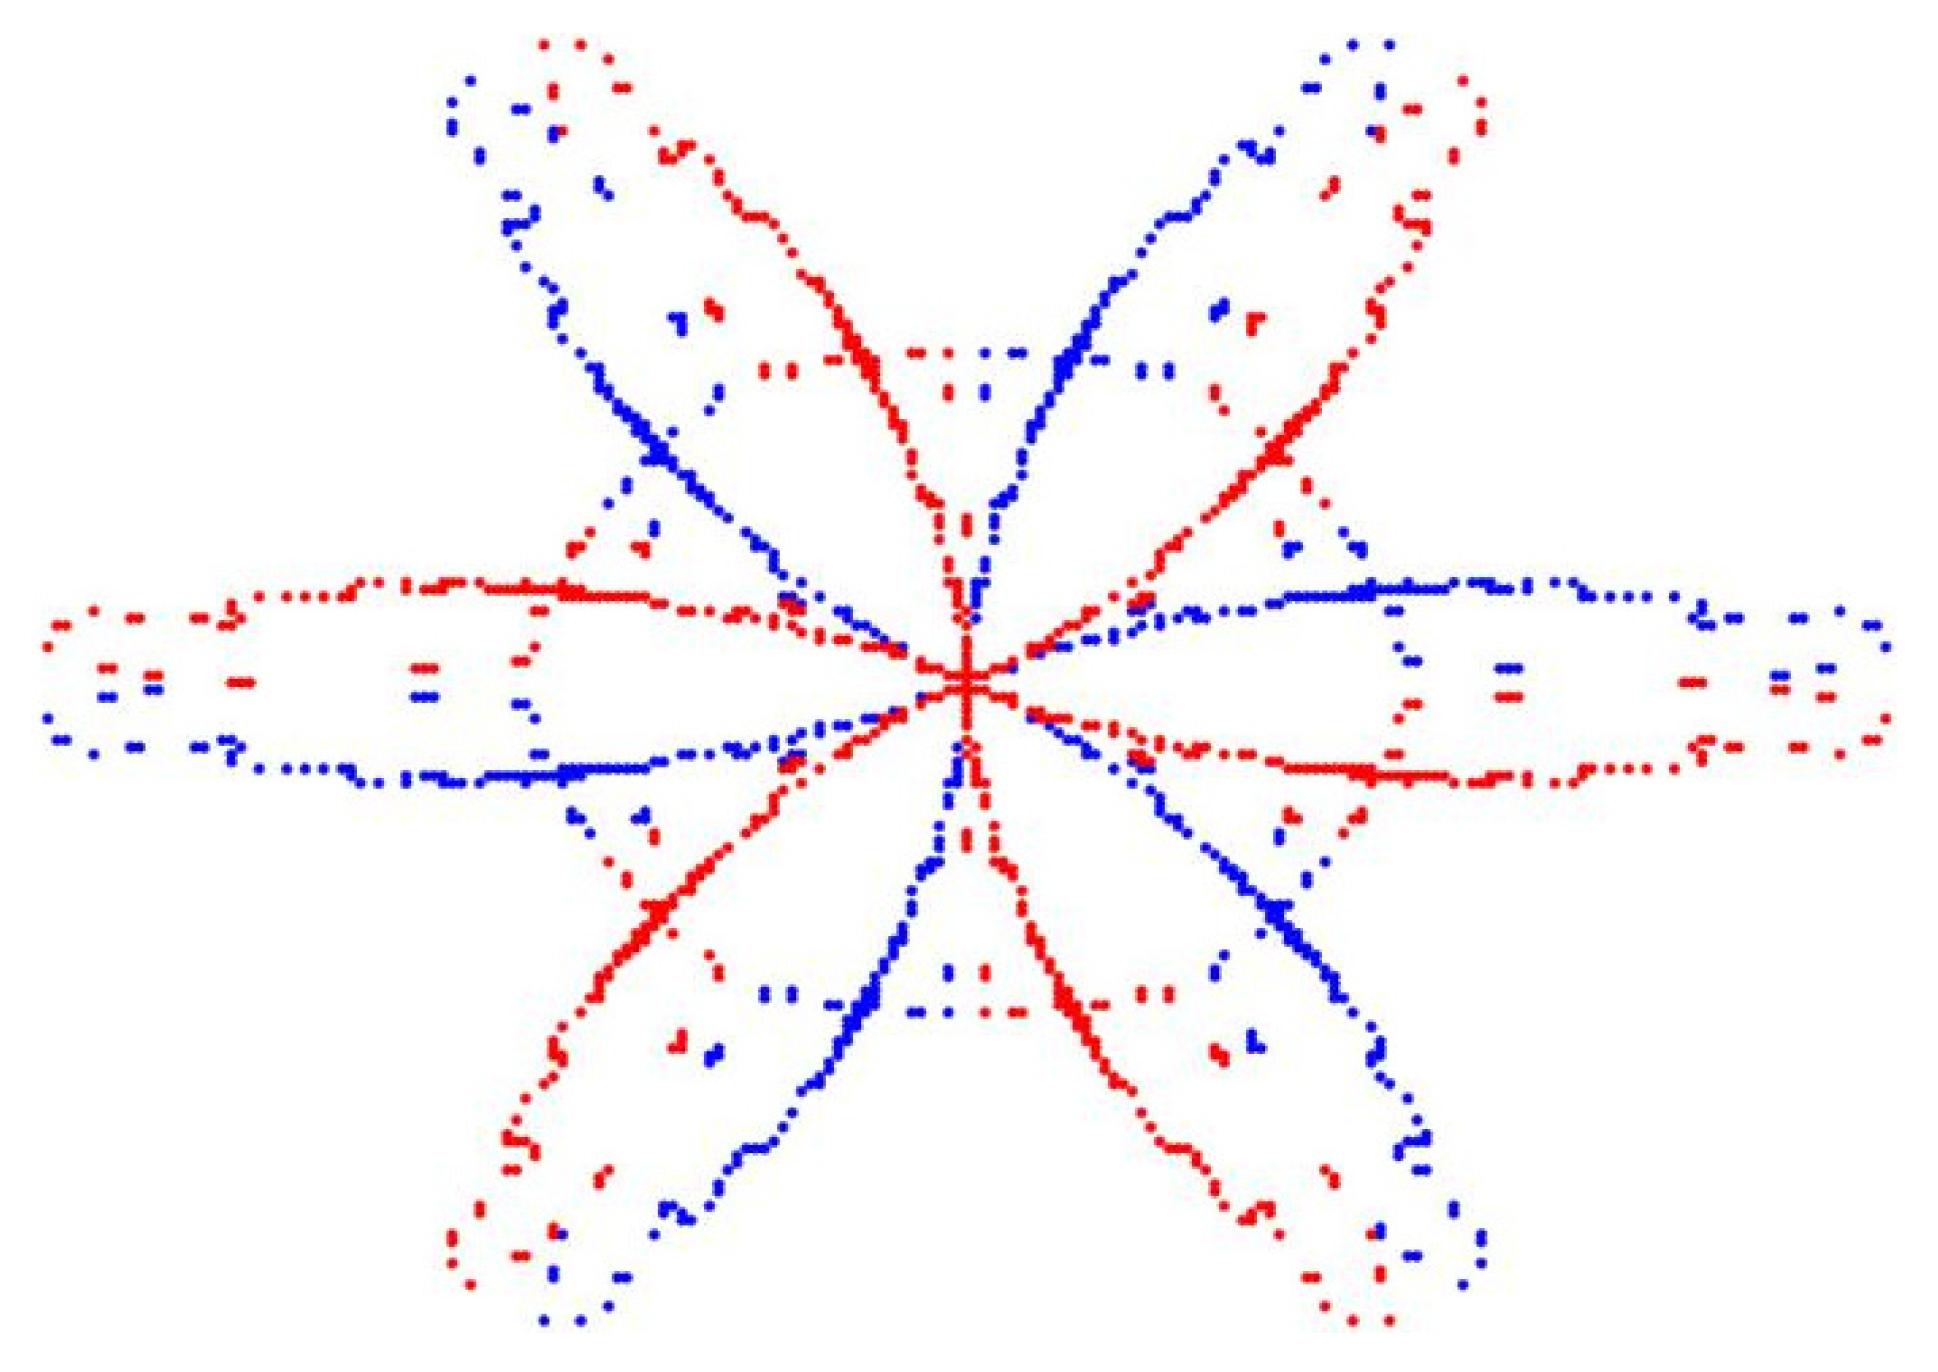
2.2.3. PV Module Breakage (Type 3)
2.2.4. Bypass Diode Failure (Type 4)
3. Research Methods
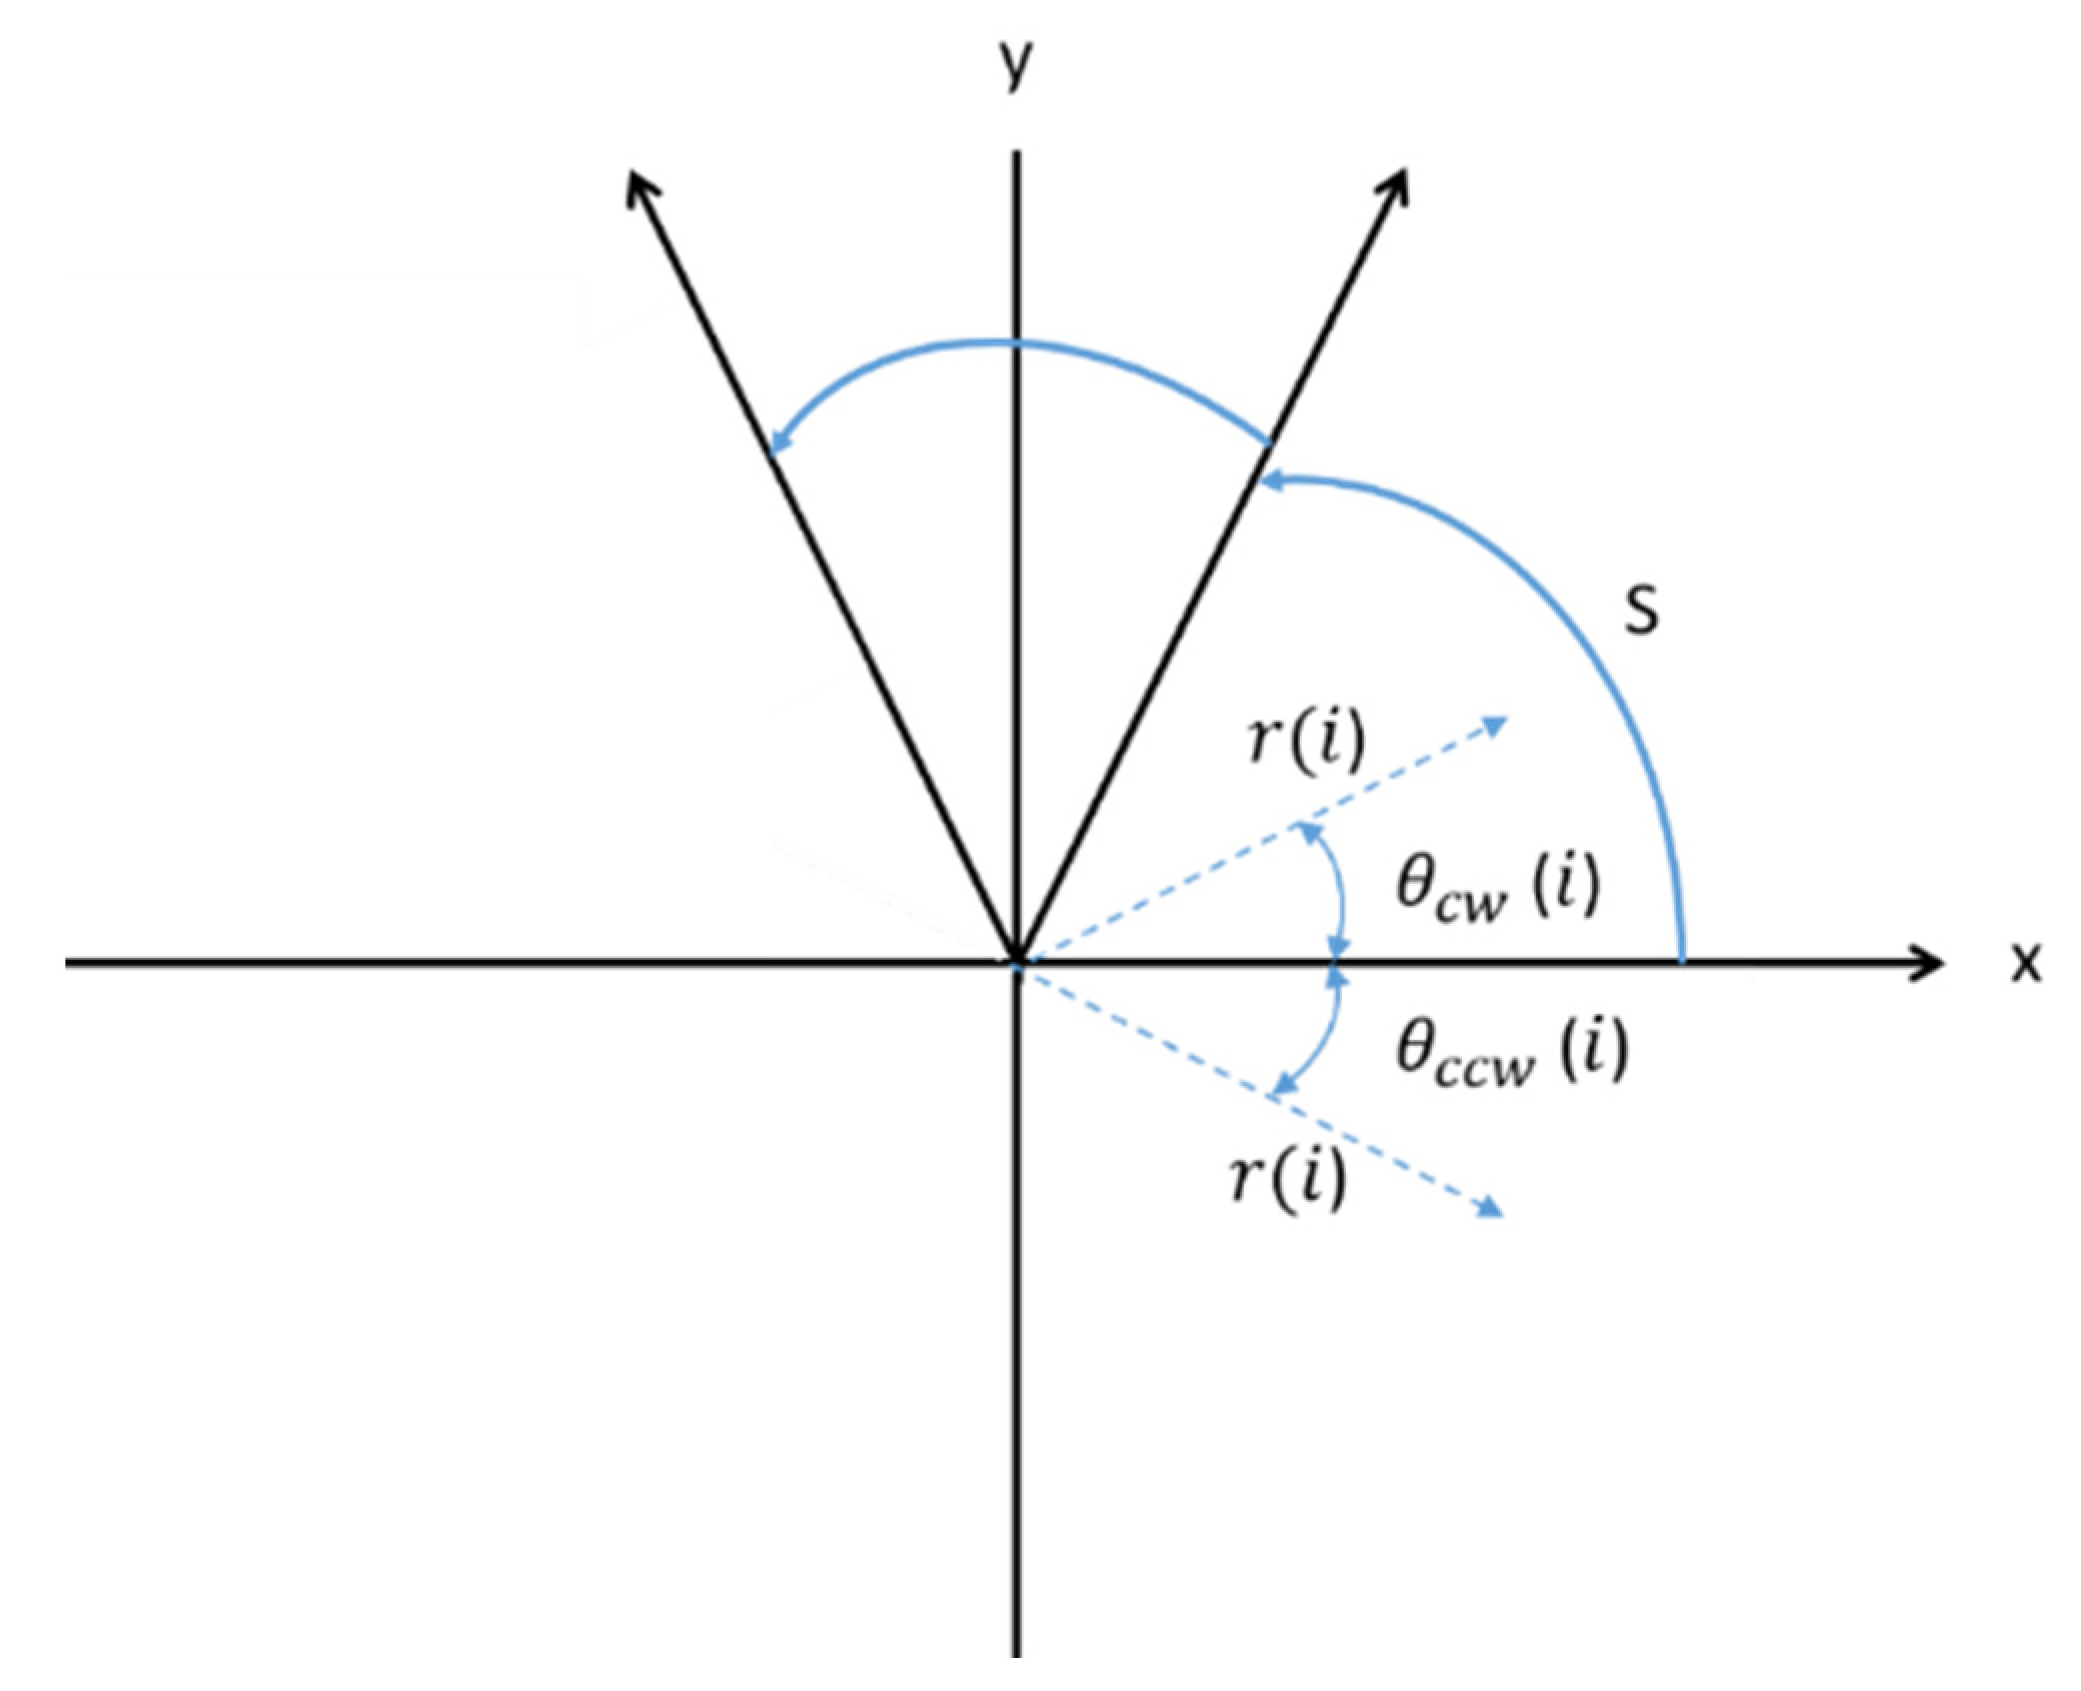
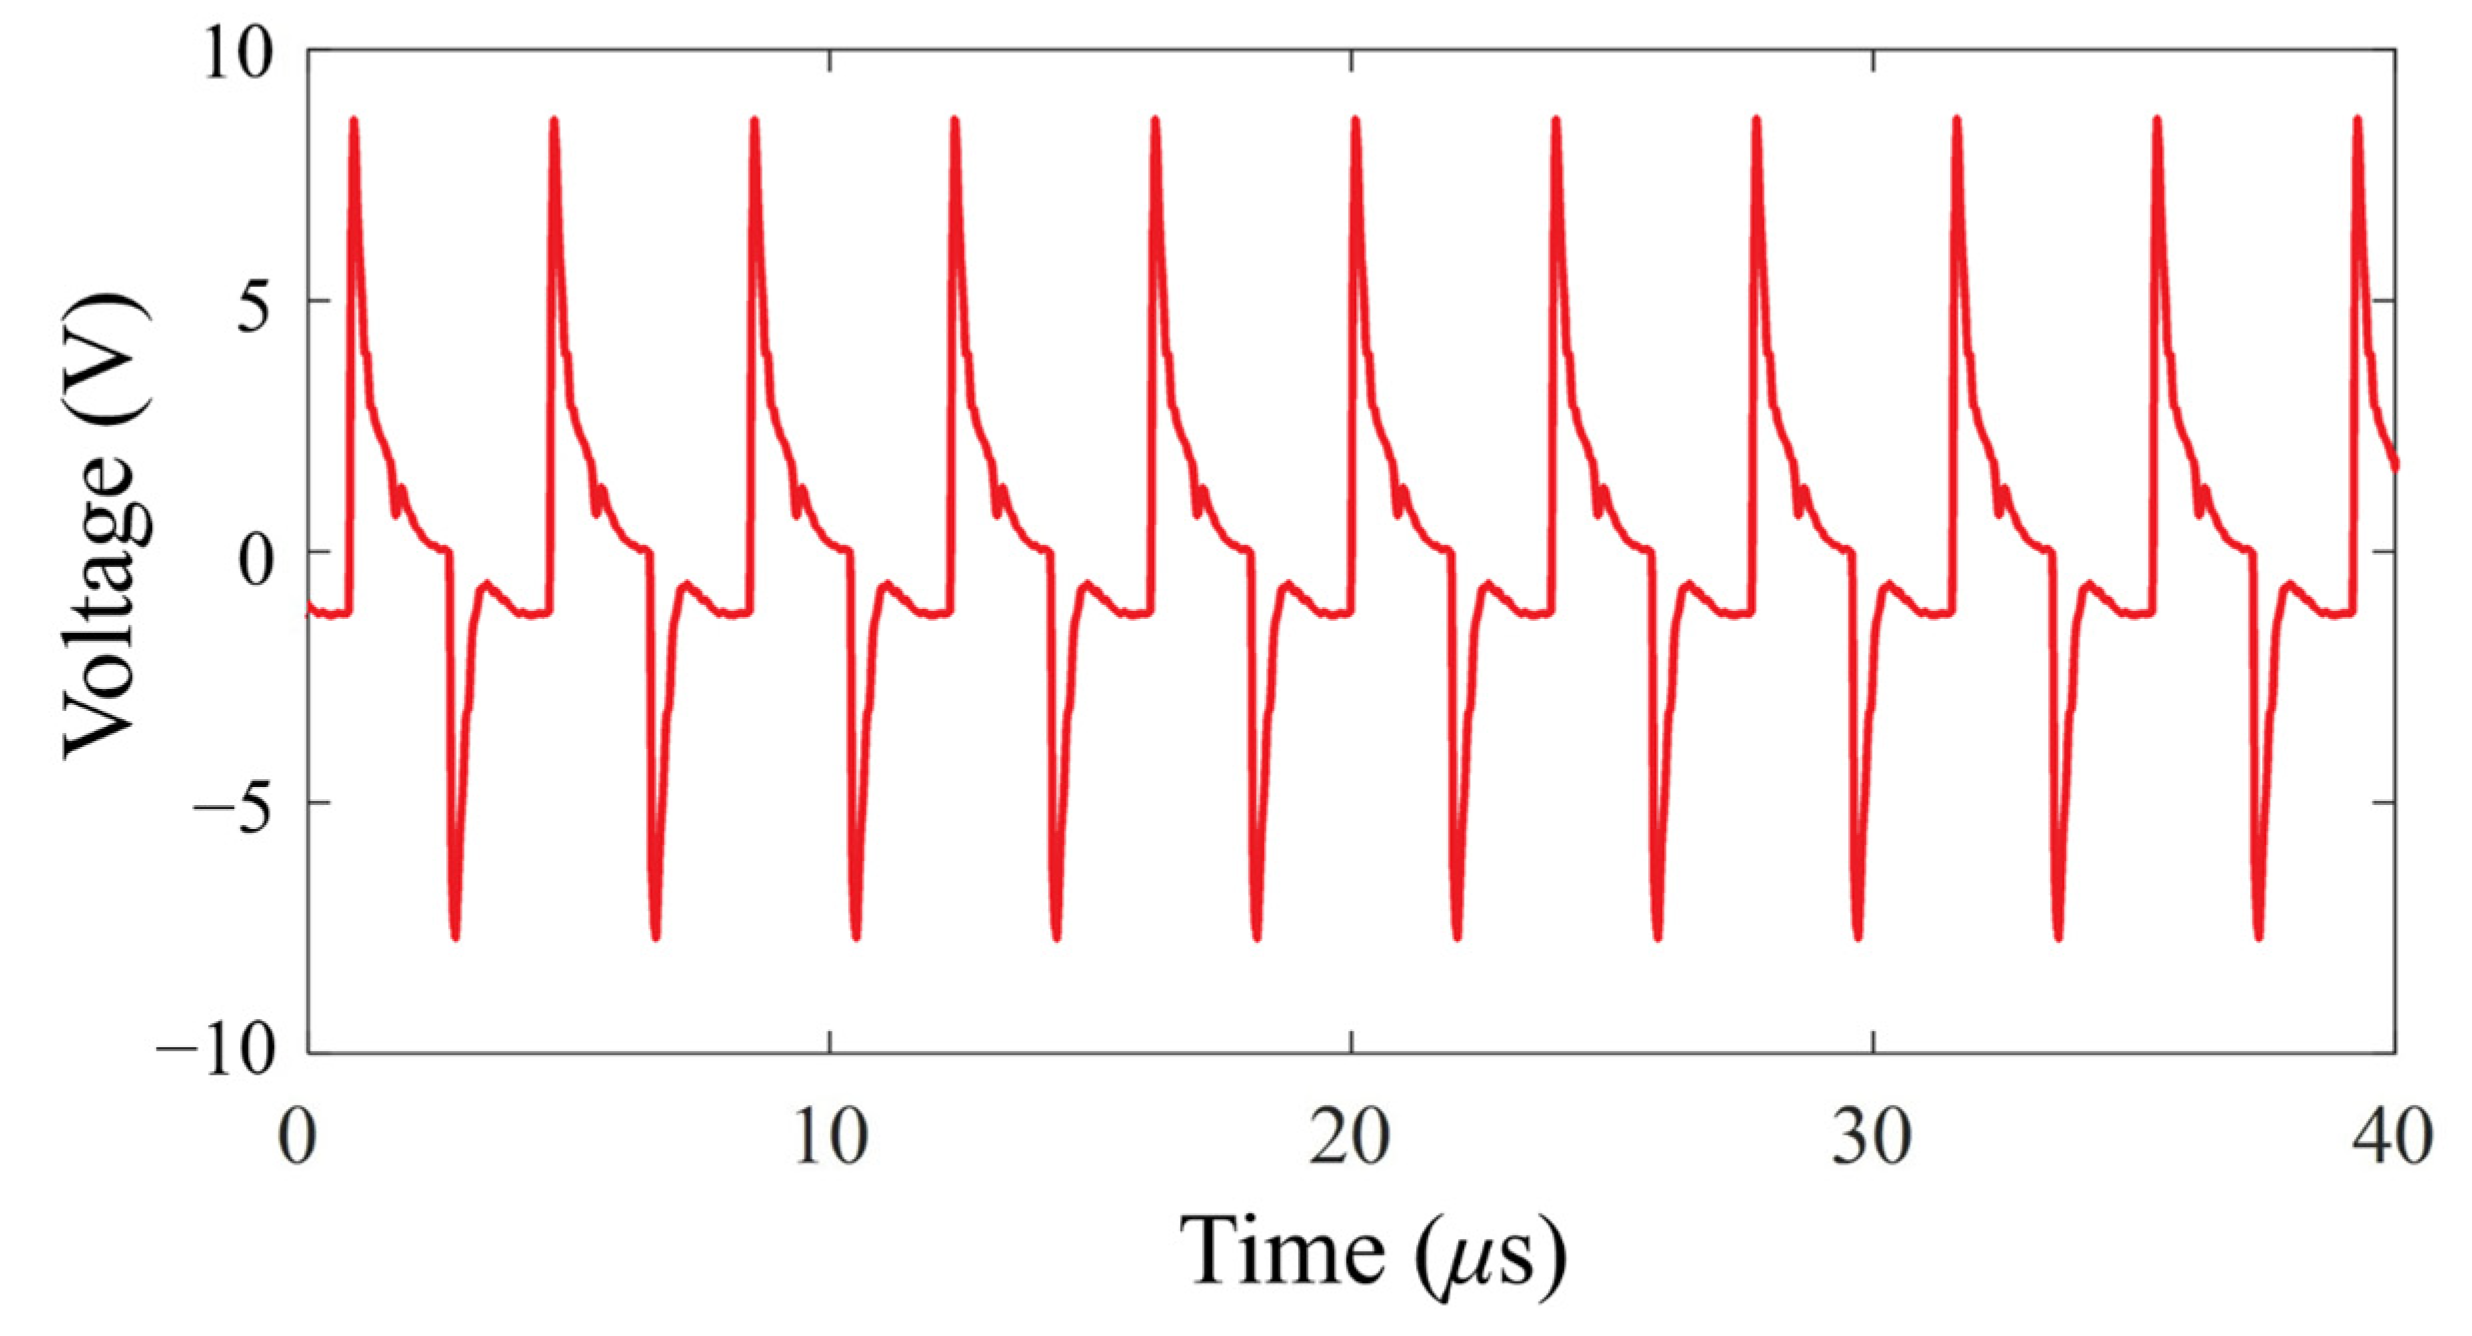
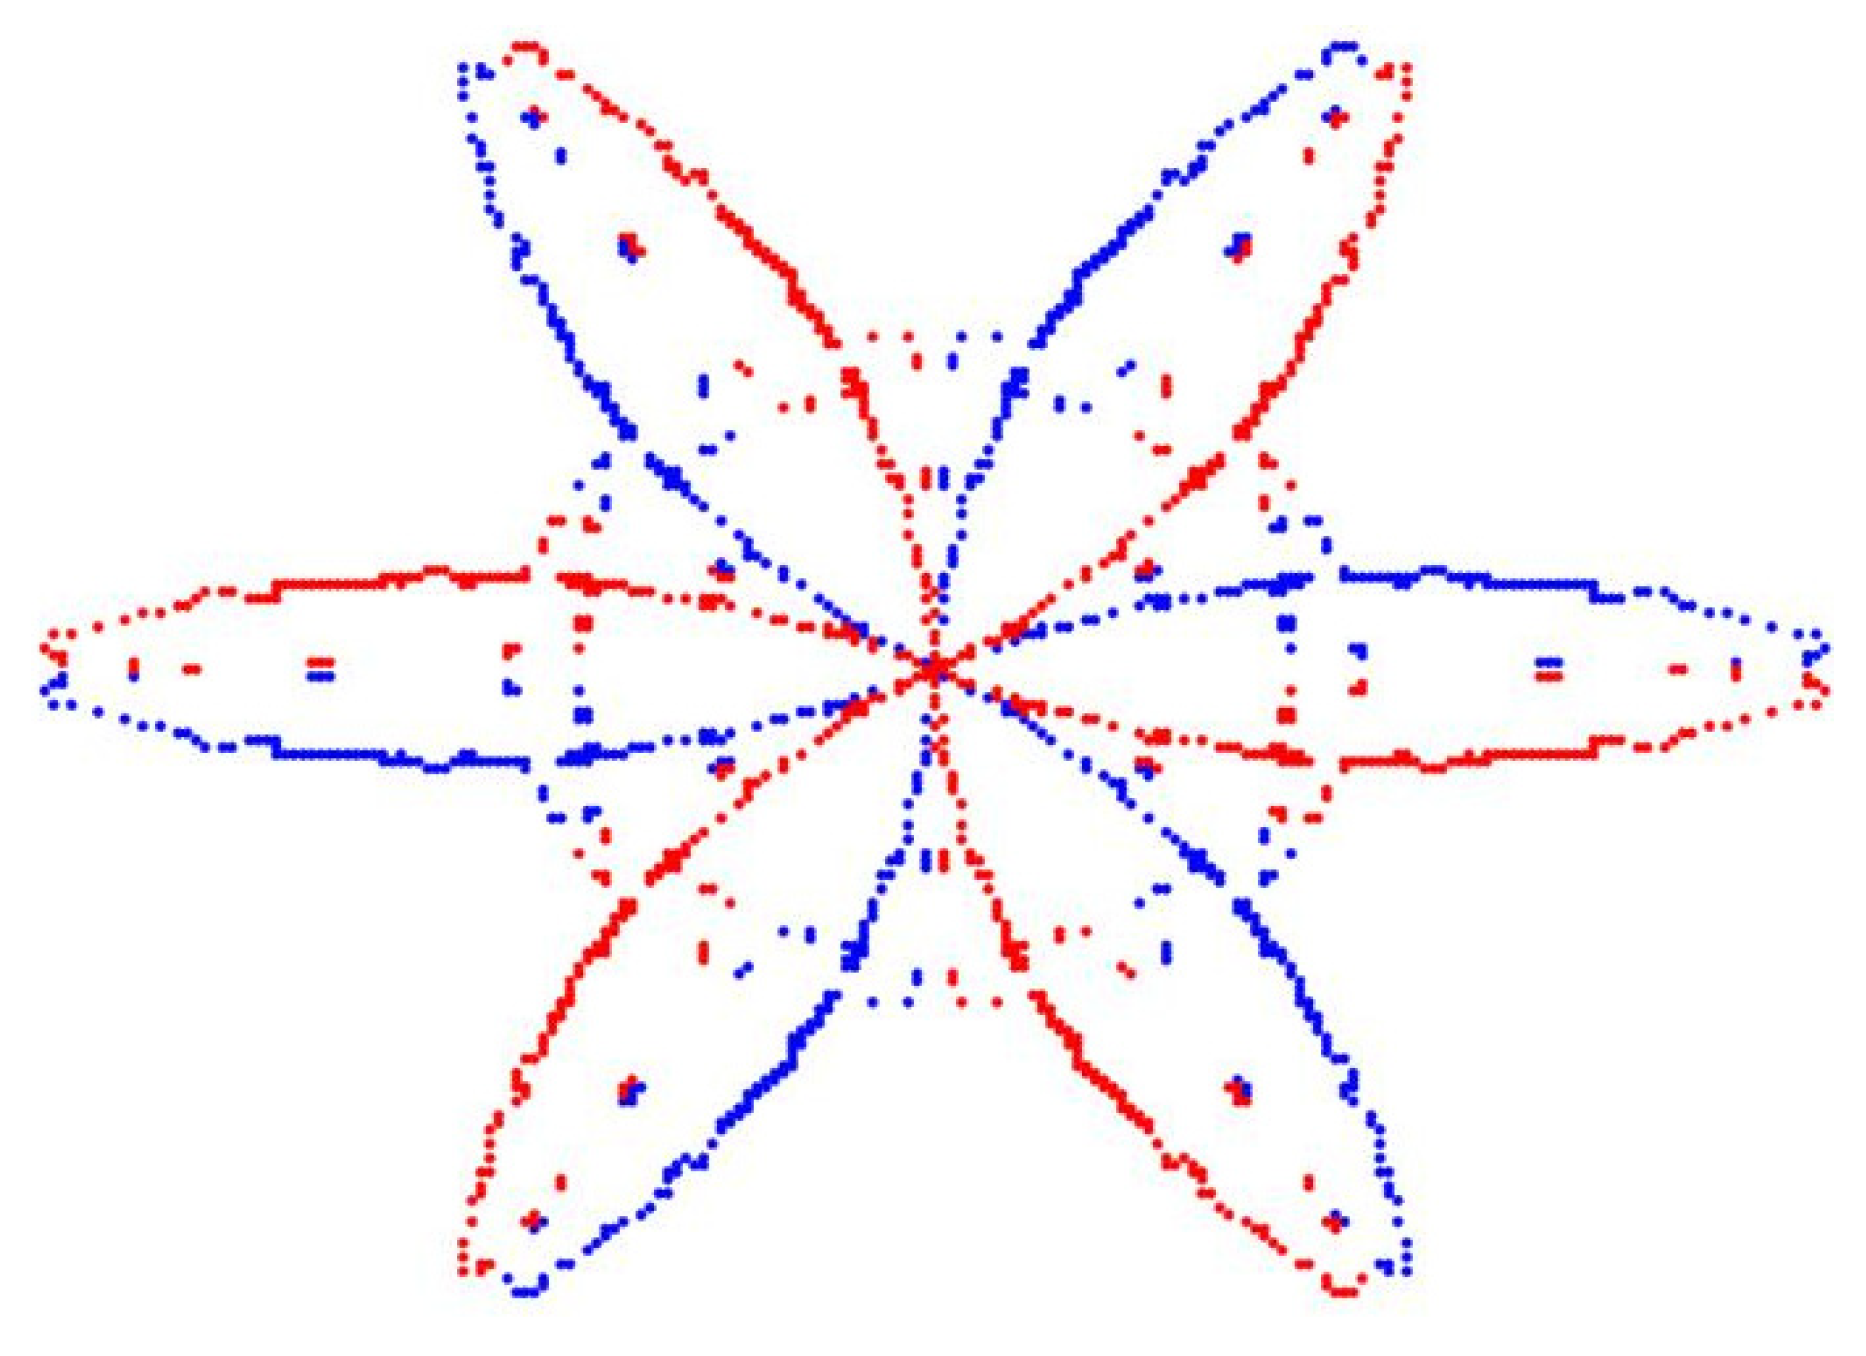
3.1. SDP
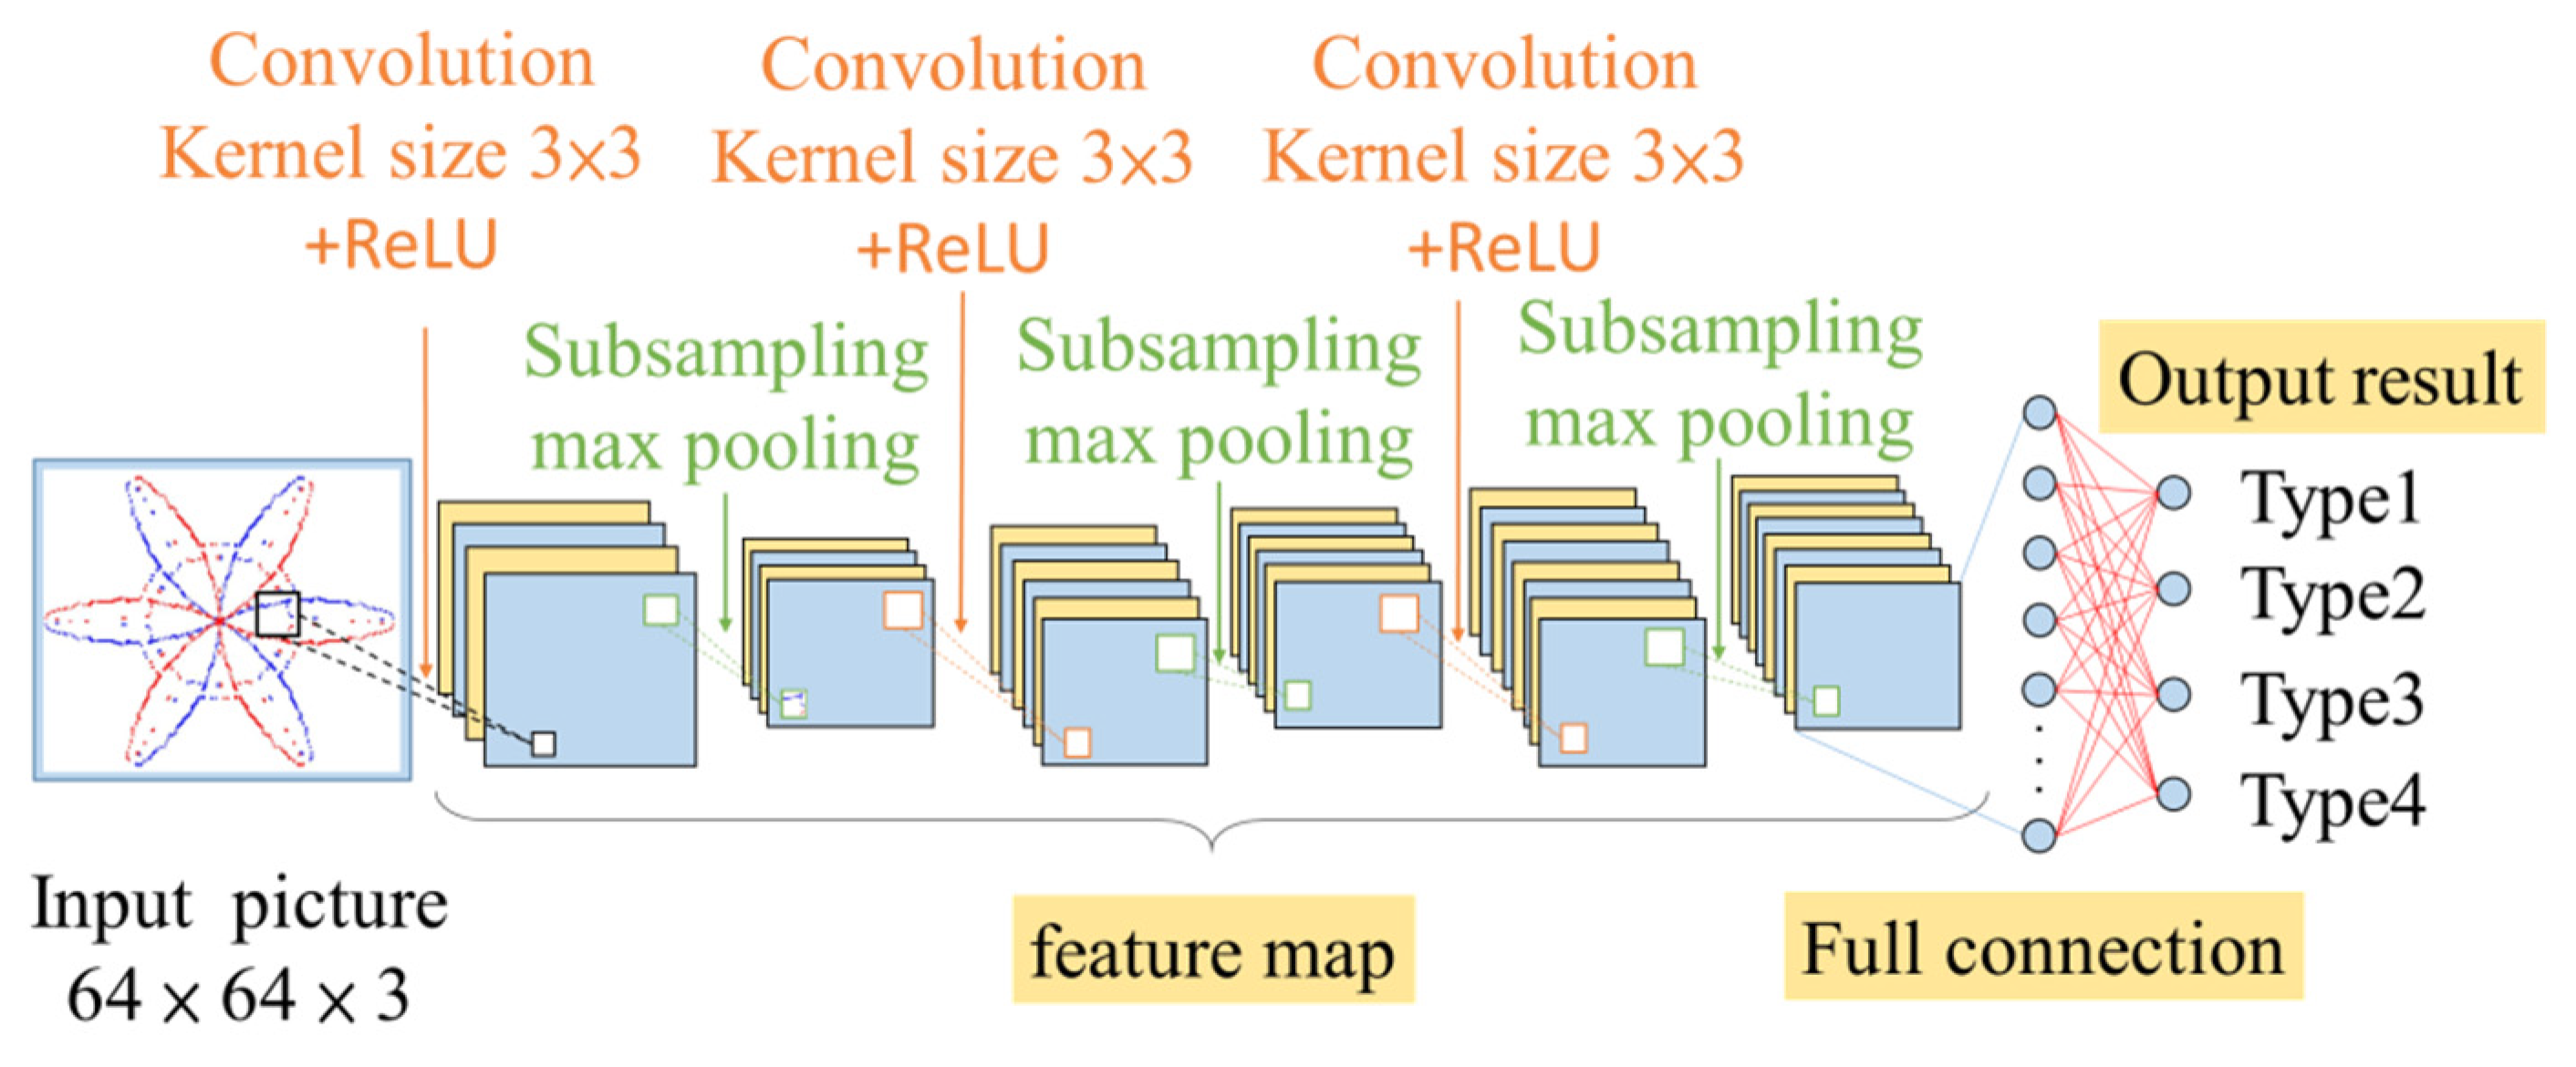
3.2. Convolutional Neural Networks (CNN)
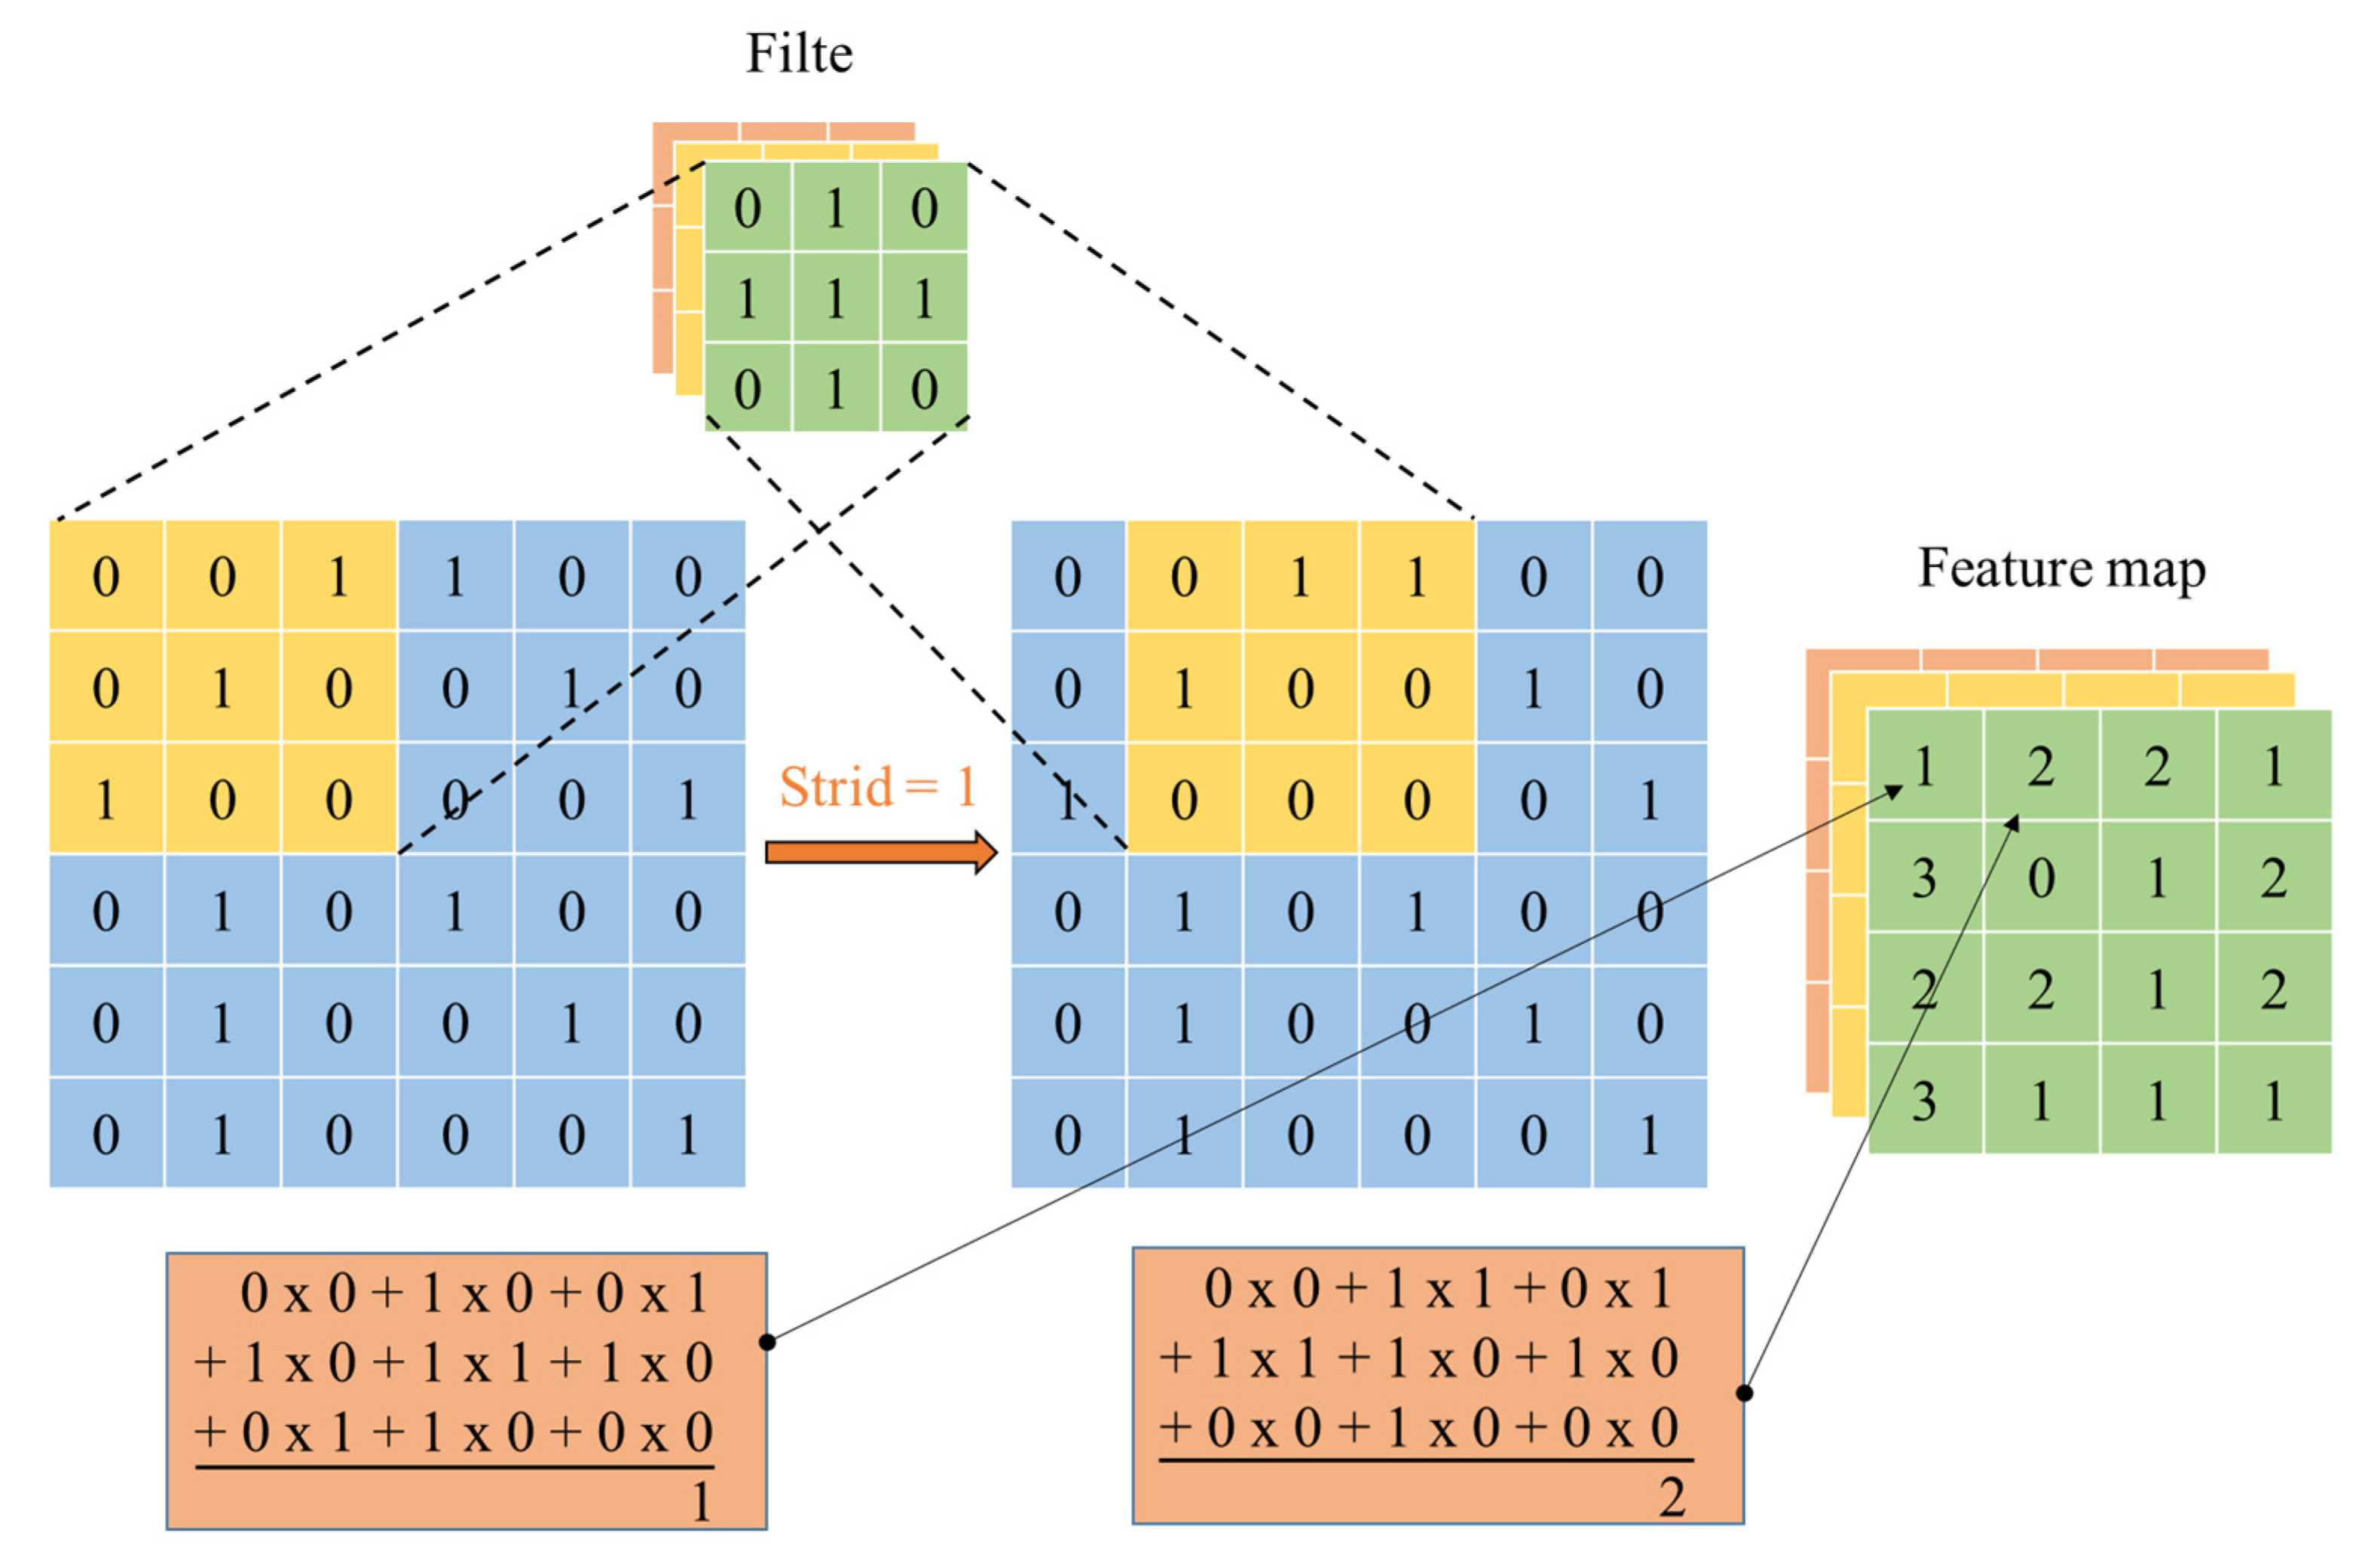
3.2.1. Function of Convolution Layer
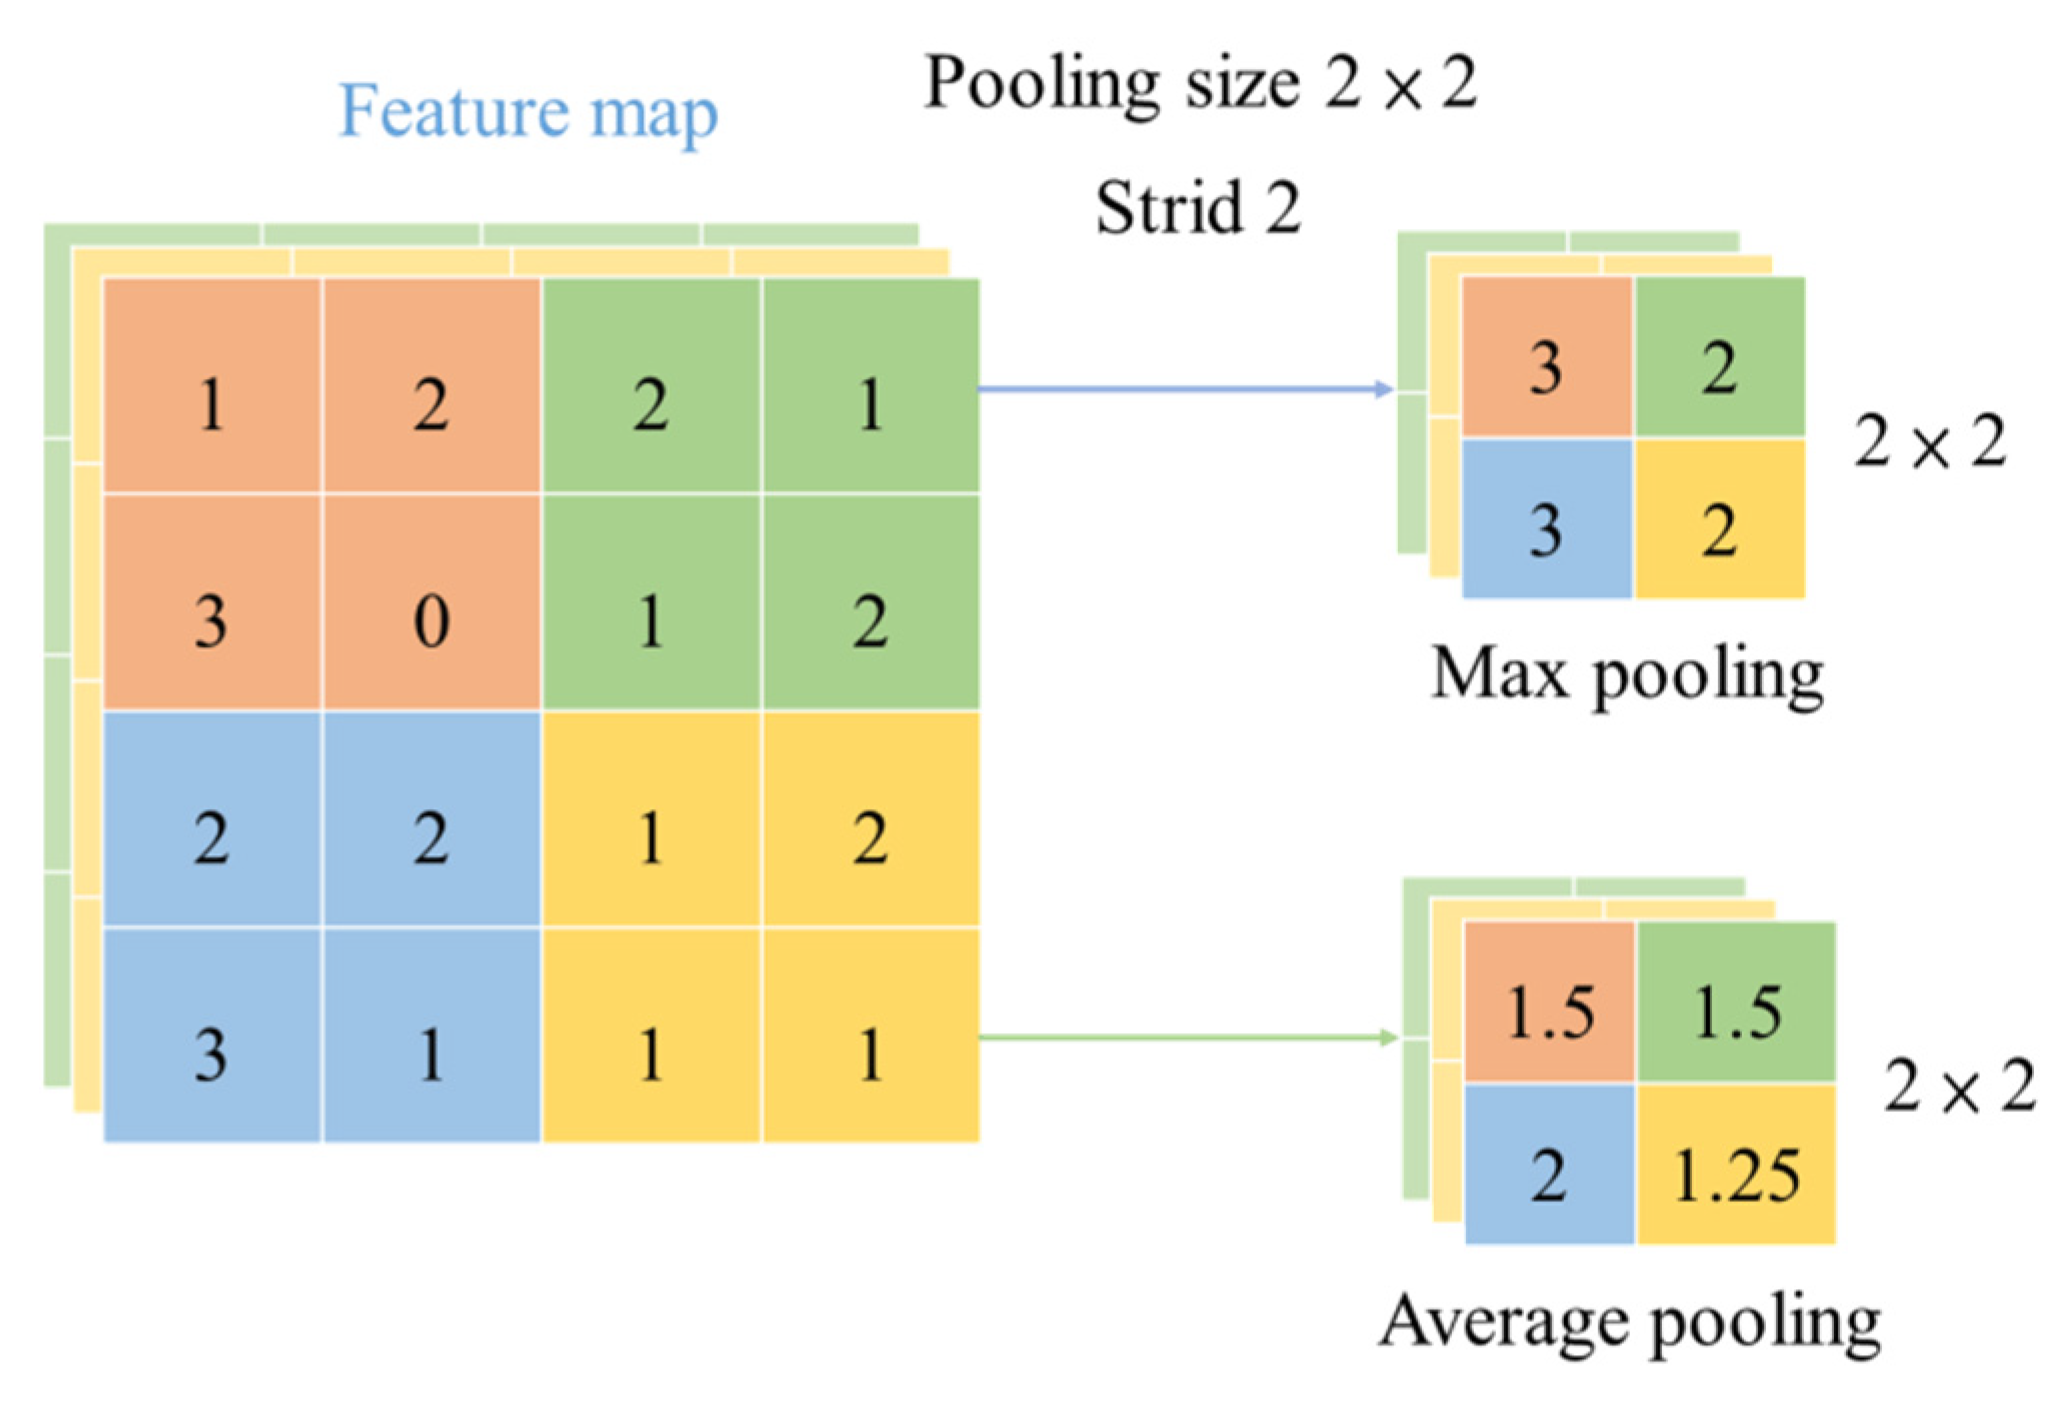
3.2.2. Function of the Pooling Layer
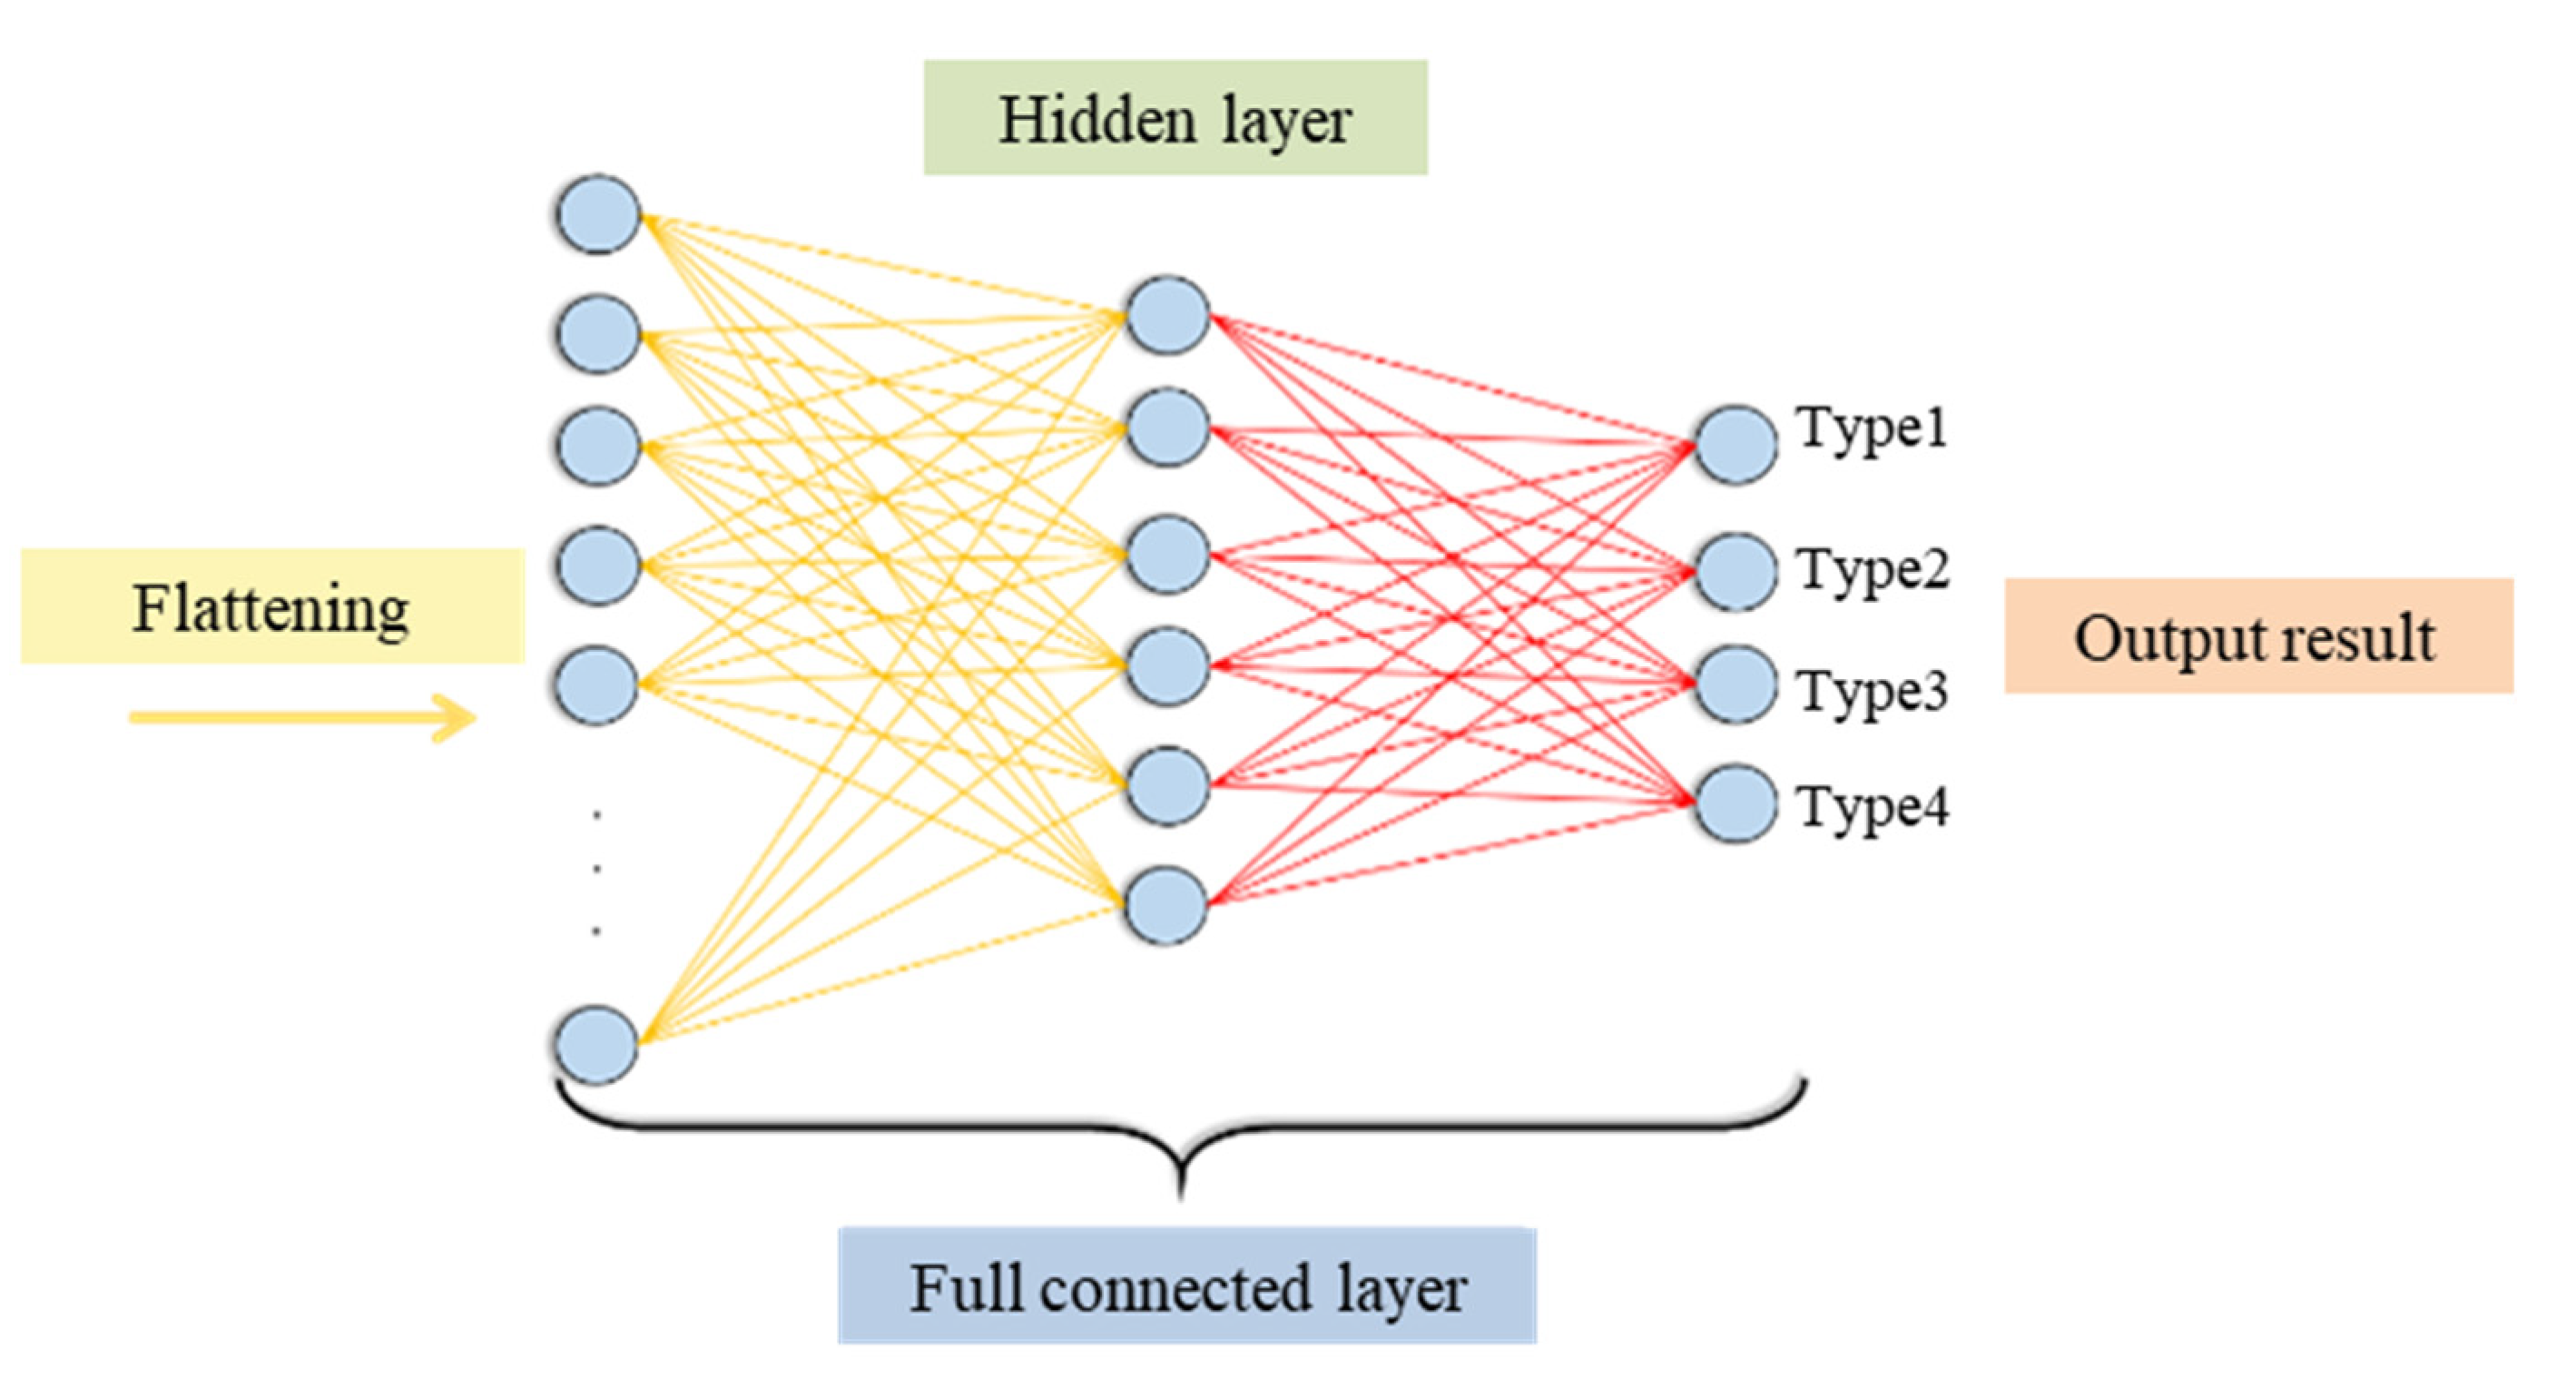
3.2.3. Function of Fully Connected Layer
4. Experimental Results
Recognition Result
5. Conclusions
Author Contributions
Funding
Conflicts of Interest
Nomenclature
| Short circuit current | |
| Voltage at maximum power point | |
| ENN | Extension neural network |
| CSDM | Chaos synchronization detection method |
| Vp-p | Voltage peak to peak value |
| 𝑟(𝑖) | Radius of polar coordinates in the snowflake image |
| () | Clockwise rotation angle of the x-axis |
| () | Counterclockwise rotation angle of the x-axis |
| ith sampling point of signal x | |
| Sampling point at No. time of signal x | |
| Maximum value of the original signal | |
| Minimum value of the original signal | |
| Signal interval time parameter | |
| Initial deflection angle of the x-axis | |
| Amplification coefficient of rotation angle | |
| No. j element of layer 1 | |
| No. j convolution region of layer feature image | |
| Weighting matrix corresponding to the convolution kernel | |
| Deviation | |
| Output of a fully connected layer | |
| X | Input of a fully connected layer |
| Additive deviation | |
| Activation function |
References
- Tobias, R.R.; Mital, M.E.; Lauguico, S.; Guillermo, M.; Naidas, J.R.; Lopena, M.; Dizon, M.E.; Dadios, E. Design and Construction of a Solar Energy Module for Optimizing Solar Energy Efficiency. In Proceedings of the 2020 IEEE 12th International Conference on Humanoid, Nanotechnology, Information Technology, Communication and Control, Environment, and Management (HNICEM), Manila, Philippines, 3–7 December 2020. [Google Scholar]
- Ayadi, F.; Colak, I.; Garip, I.; Bulbul, H.I. Targets of Countries in Renewable Energy. In Proceedings of the 2020 9th International Conference on Renewable Energy Research and Application (ICRERA), Glasgow, UK, 27–30 September 2020. [Google Scholar]
- Ayadi, F.; Colak, I.; Garip, I.; Bulbul, H.I. Impacts of Renewable Energy Resources in Smart Grid. In Proceedings of the 2020 8th International Conference on Smart Grid (icSmartGrid), Paris, France, 17–19 June 2020. [Google Scholar]
- Usova, M.A.; Velkin, V.I. Possibility to use renewable energy sources for increasing the reliability of the responsible energy consumers on the enterprise. In Proceedings of the 2018 17th International Ural Conference on AC Electric Drives (ACED), Ekaterinburg, Russia, 26–30 March 2018. [Google Scholar]
- Matusz-Kalász, D.; Bodnár, I. Monitoring and Diagnostics of Photovoltaic Cells by Electroluminescence. In Proceedings of the 2022 23rd International Carpathian Control Conference (ICCC), Sinaia, Romania, 29 May–1 June 2022. [Google Scholar]
- Lv, R.; Tang, J.; Jaubert, J.N.; Xing, G. Highly Accelerated Thermal Cycling Test for New Type of Crystalline Silicon Photovoltaic Modules. In Proceedings of the 2019 IEEE 46th Photovoltaic Specialists Conference (PVSC), Chicago, IL, USA, 16–21 June 2019. [Google Scholar]
- Predan, F.; Franke, A.; Hoehn, O.; Lackner, D.; Helmers, H.; Siefer, G.; Bett, A.W.; Dimroth, F. Wafer-bonded GaInP/GaAs/GaInAs//GaSb four-junction solar cells with 43.8% efficiency under concentration. In Proceedings of the 2020 47th IEEE Photovoltaic Specialists Conference (PVSC), Calgary, AB, Canada, 15 June–21 August 2020. [Google Scholar]
- Golive, Y.R.; Zachariah, S.; Bhaduri, S.; Dubey, R.; Chattopadhyay, S.; Singh, H.K.; Kottantharayil, A.; Shiradkar, N.; Vasi, J. Analysis and Failure Modes of Highly Degraded PV Modules Inspected during the 2018 All India Survey of PV Module Reliability. In Proceedings of the 2020 4th IEEE Electron Devices Technology & Manufacturing Conference (EDTM), Penang, Malaysia, 6–21 April 2020. [Google Scholar]
- Mehmood, A.; Sher, H.A.; Murtaza, A.F.; Al-Haddad, K. Fault Detection, Classification and Localization Algorithm for Photovoltaic Array. IEEE Trans. Energy Convers. 2021, 36, 2945–2955. [Google Scholar] [CrossRef]
- Mehmood, A.; Sher, H.A.; Murtaza, A.F.; Al-Haddad, K. A Diode-Based Fault Detection, Classification, and Localization Method for Photovoltaic Array. IEEE Trans. Instrum. Meas. 2021, 70, 3516812. [Google Scholar] [CrossRef]
- Zhang, J.; Ai, C.; Zheng, Z.; Ding, K.; Chen, X.; Liu, Y.; Chen, L. Module-Level Fault Diagnosis of Photovoltaic Array based on Wireless Sensor Networks and Inverter Activated I-V Scanning. In Proceedings of the 2022 IEEE 5th International Electrical and Energy Conference (CIEEC), Nangjing, China, 27–29 May 2022. [Google Scholar]
- Cai, X.; Wai, R.J. Intelligent DC Arc-Fault Detection of Solar PV Power Generation System via Optimized VMD-Based Signal Processing and PSO–SVM Classifier. IEEE J. Photovolt. 2022, 12, 1058–1077. [Google Scholar] [CrossRef]
- Dhimish, M.; Chen, Z. Novel Open-Circuit Photovoltaic Bypass Diode Fault Detection Algorithm. IEEE J. Photovolt. 2019, 9, 1819–1827. [Google Scholar] [CrossRef]
- Serfa Juan, R.O.; Kim, J. Photovoltaic Cell Defect Detection Model based-on Extracted Electroluminescence Images using SVM Classifier. In Proceedings of the 2020 International Conference on Artificial Intelligence in Information and Communication (ICAIIC), Fukuoka, Japan, 19–21 February 2020. [Google Scholar]
- Yun, L.; Bofeng, Y.; Dan, Q.; Fengshuo, L. Research on Fault Diagnosis of Photovoltaic Array Based on Random Forest Algorithm. In Proceedings of the 2021 IEEE International Conference on Power Electronics, Computer Applications (ICPECA), Shenyang, China, 22–24 January 2021. [Google Scholar]
- Lu, S.D.; Wei, S.E.; Wang, M.H.; Sian, H.-W.; Kuo, C.-C. Hybrid Methodology Based on Extension Neural Network for Fault Diagnosis of Photovoltaic Module. Sens. Mater. 2021, 33, 2925–2941. [Google Scholar] [CrossRef]
- Lu, S.-D.; Wang, M.-H.; Wei, S.-E.; Liu, H.-D.; Wu, C.-C. Photovoltaic Module Fault Detection Based on a Convolutional Neural Network. Processes 2021, 9, 1635. [Google Scholar] [CrossRef]
- Sizkouhi, A.M.; Aghaei, M.; Esmailifar, S.M. A deep convolutional encoder-decoder architecture for autonomous fault detection of PV plants using multi-copters. Sol. Energy 2021, 223, 217–228. [Google Scholar] [CrossRef]
- Trinh, N.T.N.; Hung, D.T.; Dat, N.H.T.; Dung, P.Q. Application of Artificial Intelligence in Detecting and Classifying Faults of Solar Panels. In Proceedings of the 2022 IEEE Ninth International Conference on Communications and Electronics (ICCE), Nha Trang, Vietnam, 27–29 July 2022. [Google Scholar]
- Al-Katheri, A.A.; Al-Ammar, E.A.; Alotaibi, M.; Ghazi, G.A. Artificial Neural Network Application for Faults Detection in PV Systems. In Proceedings of the 2022 IEEE Delhi Section Conference (DELCON), New Delhi, India, 11–13 February 2022. [Google Scholar]
- Lu, H.; Zhao, X.; Tao, B.; Yin, Z. Online Process Monitoring Based on Vibration-Surface Quality Map for Robotic Grinding. IEEE/ASME Trans. Mechatron. 2020, 25, 2882–2892. [Google Scholar] [CrossRef]
- Yang, J.; Yan, R. A Multidimensional Feature Extraction and Selection Method for ECG Arrhythmias Classification. IEEE Sens. J. 2020, 21, 14180–14190. [Google Scholar] [CrossRef]
- Zhu, X.; Zhao, J.; Hou, D.; Han, Z. An SDP Characteristic Information Fusion-Based CNN Vibration Fault Diagnosis Method. Hindawi Shock Viction Vol. 2019, 2019, 3926963. [Google Scholar] [CrossRef]
- Shrestha, S.M.; Mallineni, J.K.; Yedidi, K.R.; Knisely, B.; Tatapudi, S.; Kuitche, J.; TamizhMani, G. Determination of Dominant Failure Modes Using FMECA on the Field Deployed c-Si Modules Under Hot-Dry Desert Climate. IEEE J. Photovolt. 2014, 5, 174–182. [Google Scholar] [CrossRef]
- Tatapudi, S.; Libby, C.; Raupp, C.; Srinivasan, D.; Kuitche, J.; Bicer, B.; Tamizhmani, G. Defect and safety inspection of 6 PV technologies from 56,000 modules representing 257,000 modules in 4 climatic regions of the United States. In Proceedings of the 2016 IEEE 43rd Photovoltaic Specialists Conference (PVSC), Portland, OR, USA, 5–10 June 2016. [Google Scholar]
- Brooks, A.E.; Cormode, D.; Cronin, A.D.; Kam-Lum, E. PV system power loss and module damage due to partial shade and bypass diode failure depend on cell behavior in reverse bias. In Proceedings of the 2015 IEEE 42nd Photovoltaic Specialist Conference (PVSC), New Orleans, LA, USA, 14–19 June 2015. [Google Scholar]
- Yeh, C.W.; Chen, R. Using Convolutional Neural Network for Vibration Fault Diagnosis Monitoring in Machinery. In Proceedings of the 2018 IEEE International Conference on Advanced Manufacturing (ICAM), Yunlin, Taiwan, 16–18 November 2018. [Google Scholar]
- Aziz, F.; Haq, A.U.; Ahmad, S.; Mahmoud, Y.; Jalal, M.; Ali, U. A Novel Convolutional Neural Network-Based Approach for Fault Classification in Photovoltaic Arrays. IEEE Access 2020, 8, 41889–41904. [Google Scholar] [CrossRef]
- Krizhevsky, A.; Sutskever, I.; Hinton, G.E. ImageNet Classification with Deep Convolutional Neural Networks. Assoc. Comput. Mach. 2017, 60, 84–90. [Google Scholar] [CrossRef]
- Wang, H.; Xu, J.; Yan, R. Bearing Fault Diagnosis Based on Visual Symmetrized Dot Pattern and CNNs. In Proceedings of the 2019 IEEE International Instrumentation and Measurement Technology Conference (I2MTC), Auckland, New Zealand, 20–23 May 2019. [Google Scholar]


| Fault Types | Cracks | Bypass Diode Failure | Aging | Open Circuit | Short Circuit | Hot Spot | Partial Shading | Accuracy Rate (%) | |
|---|---|---|---|---|---|---|---|---|---|
| Methods | |||||||||
| SVM [14] | ✔ | ✔ | 95 | ||||||
| Random forest [15] | ✔ | ✔ | ✔ | ✔ | ✔ | 60~80 | |||
| CSDM + ENN [16] | ✔ | ✔ | ✔ | 87.5 | |||||
| CSDM + CNN [17] | ✔ | ✔ | ✔ | 99.5 | |||||
| FCN [18] | ✔ | 93 | |||||||
| SVM [19] | ✔ | ✔ | ✔ | 90 | |||||
| ANN [20] | ✔ | ✔ | ✔ | 95 | |||||
| PV module types |
| Normal PV module (Type 1) |
| Poor connection of PV module (Type 2) |
| PV module breakage (Type 3) |
| Bypass diode failure (Type 4) |
| Algorithm | Training Time (s) | Testing Time (s) | Epoch | Training Rate (%) | Accuracy Rate (%) | Ranking |
|---|---|---|---|---|---|---|
| SDP + CNN | 181 | 0.24 | 100 | 100 | 99.88 | 1 |
| SDP + HOG + ENN | 3518 | 1.63 | 100 | 96.31 | 91.75 | 2 |
Publisher’s Note: MDPI stays neutral with regard to jurisdictional claims in published maps and institutional affiliations. |
© 2022 by the authors. Licensee MDPI, Basel, Switzerland. This article is an open access article distributed under the terms and conditions of the Creative Commons Attribution (CC BY) license (https://creativecommons.org/licenses/by/4.0/).
Share and Cite
Wang, M.-H.; Lin, Z.-H.; Lu, S.-D. A Fault Detection Method Based on CNN and Symmetrized Dot Pattern for PV Modules. Energies 2022, 15, 6449. https://doi.org/10.3390/en15176449
Wang M-H, Lin Z-H, Lu S-D. A Fault Detection Method Based on CNN and Symmetrized Dot Pattern for PV Modules. Energies. 2022; 15(17):6449. https://doi.org/10.3390/en15176449
Chicago/Turabian StyleWang, Meng-Hui, Zong-Han Lin, and Shiue-Der Lu. 2022. "A Fault Detection Method Based on CNN and Symmetrized Dot Pattern for PV Modules" Energies 15, no. 17: 6449. https://doi.org/10.3390/en15176449
APA StyleWang, M.-H., Lin, Z.-H., & Lu, S.-D. (2022). A Fault Detection Method Based on CNN and Symmetrized Dot Pattern for PV Modules. Energies, 15(17), 6449. https://doi.org/10.3390/en15176449