
Experimental Study on the Compressive and Shear Mechanical Properties of Cement–Formation Interface Considering Surface Roughness and Drilling Mud Contamination

Abstract
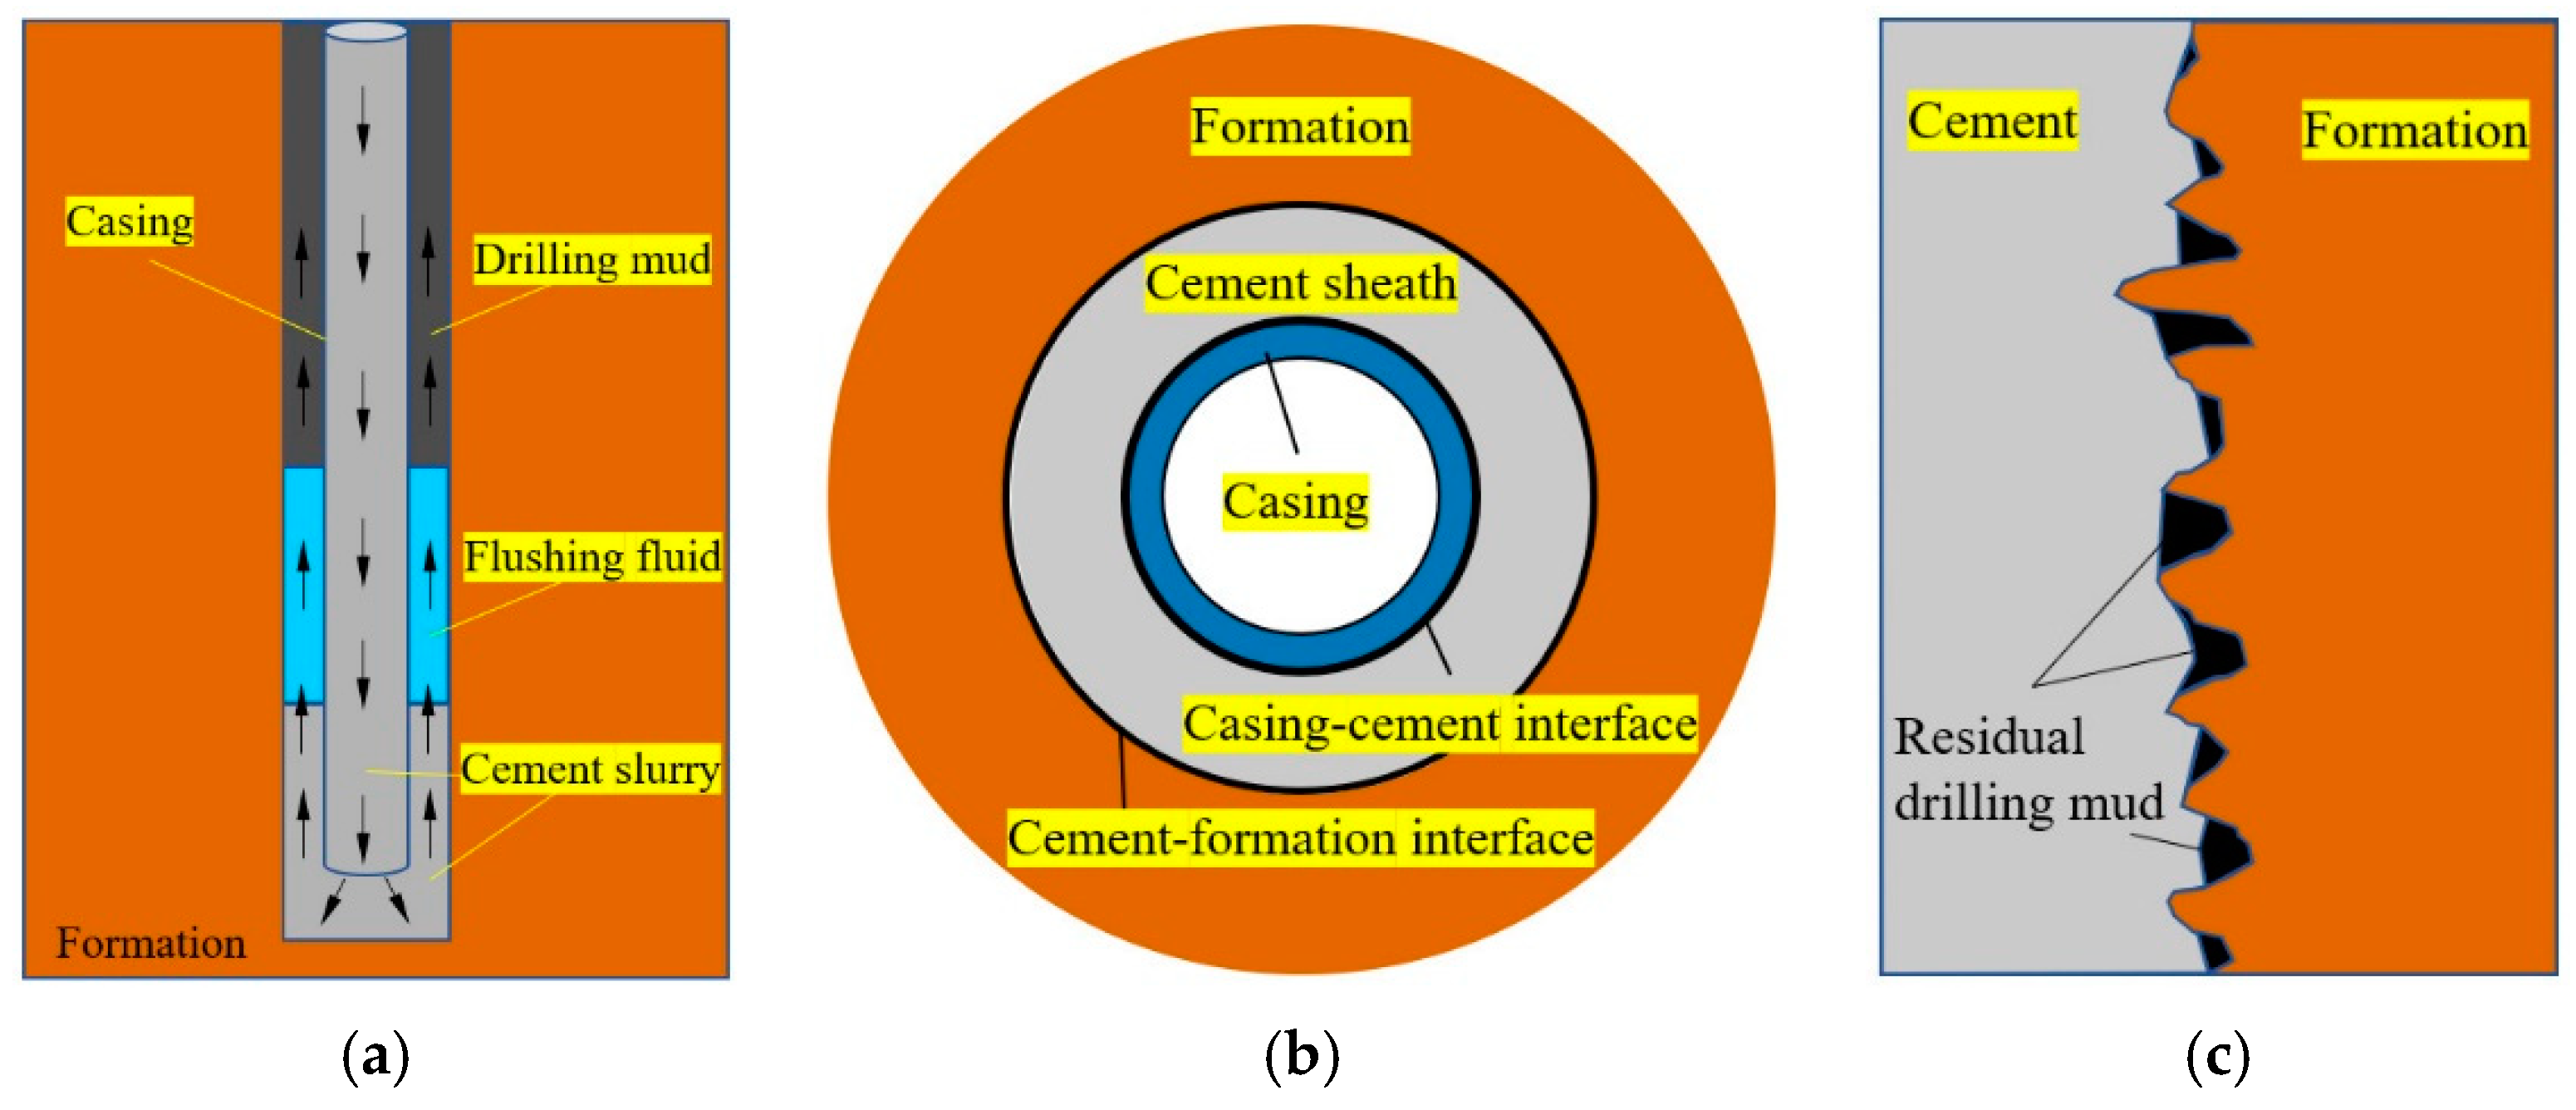
:1. Introduction
2. Materials and Test Methods
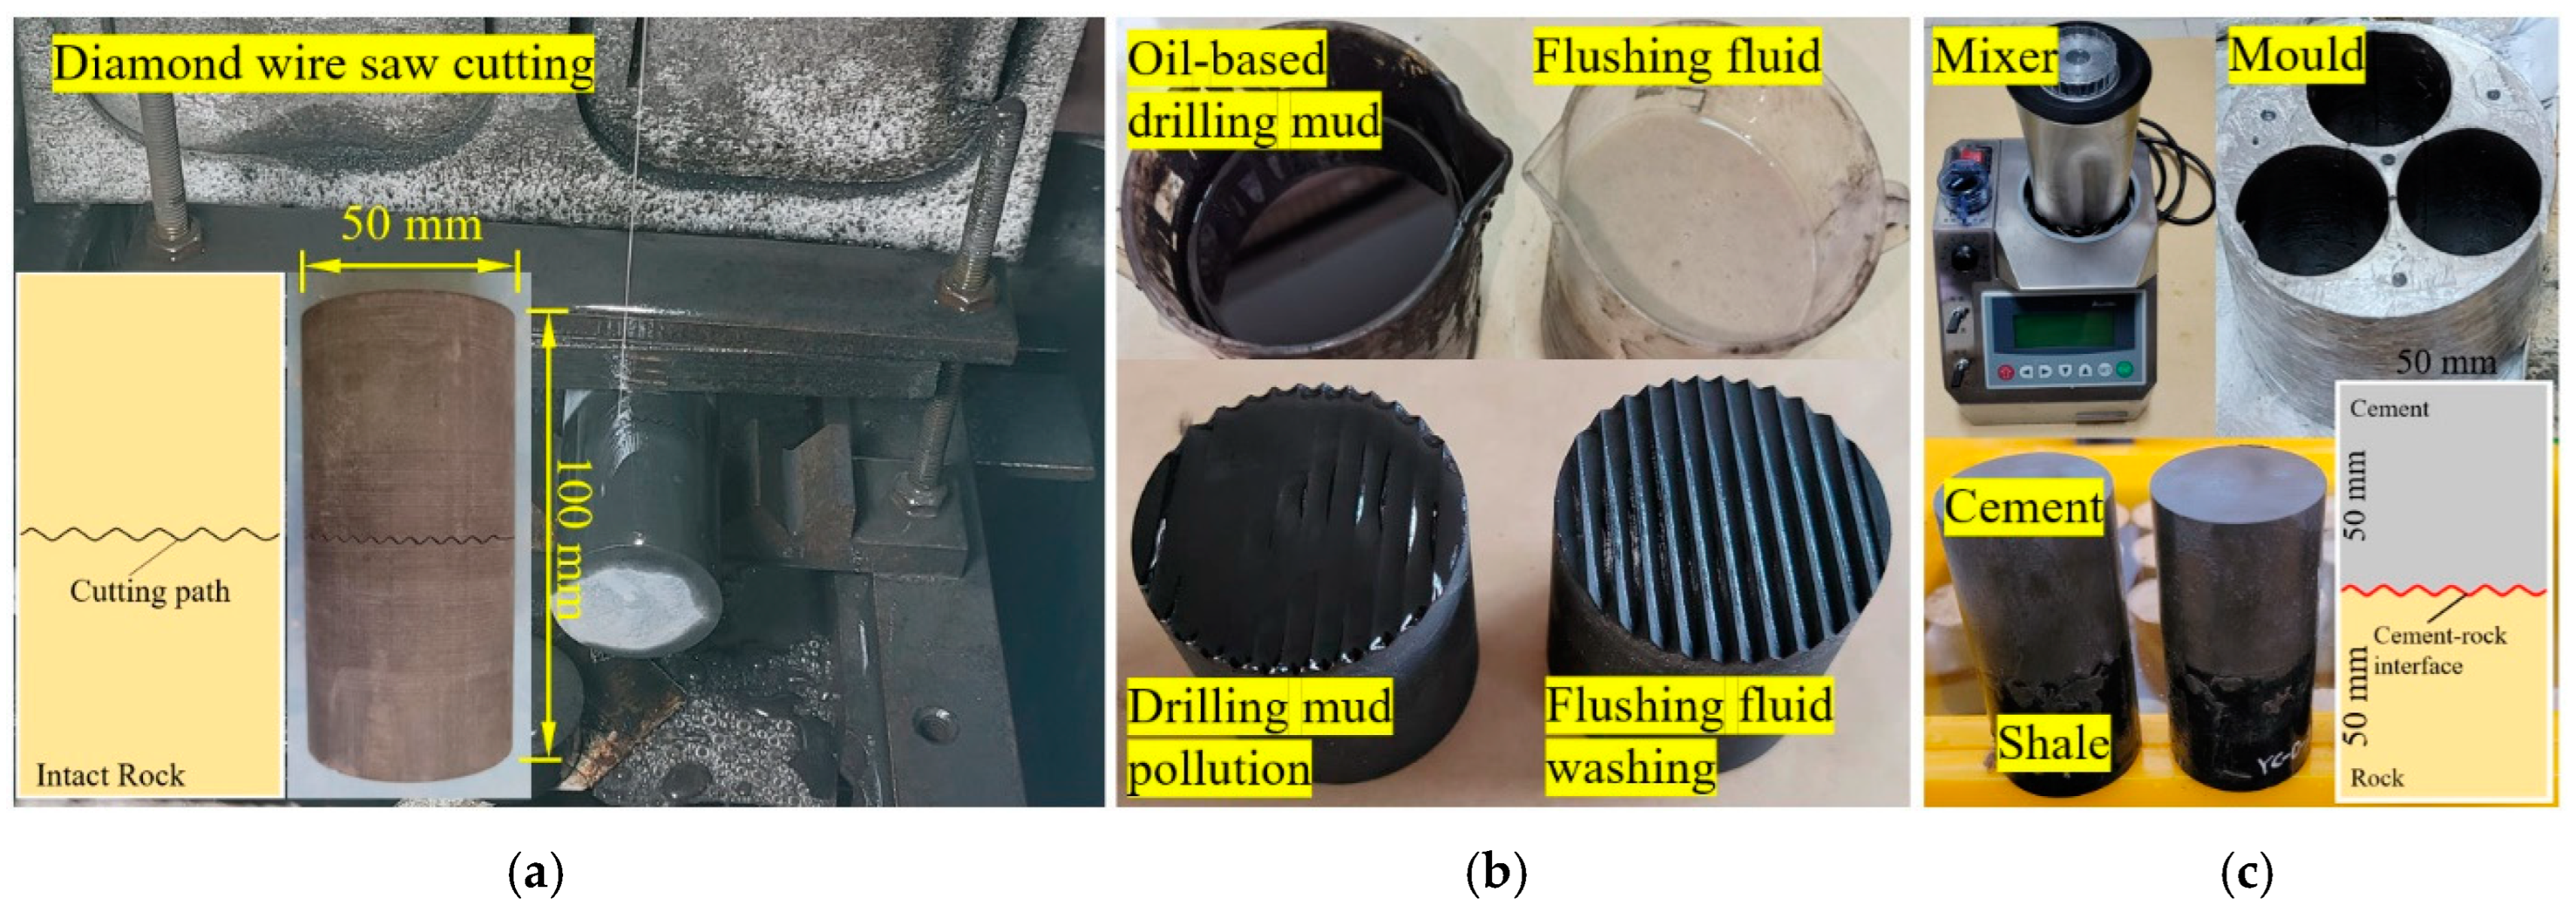
2.1. Sample Preparation
2.2. Experimental Design
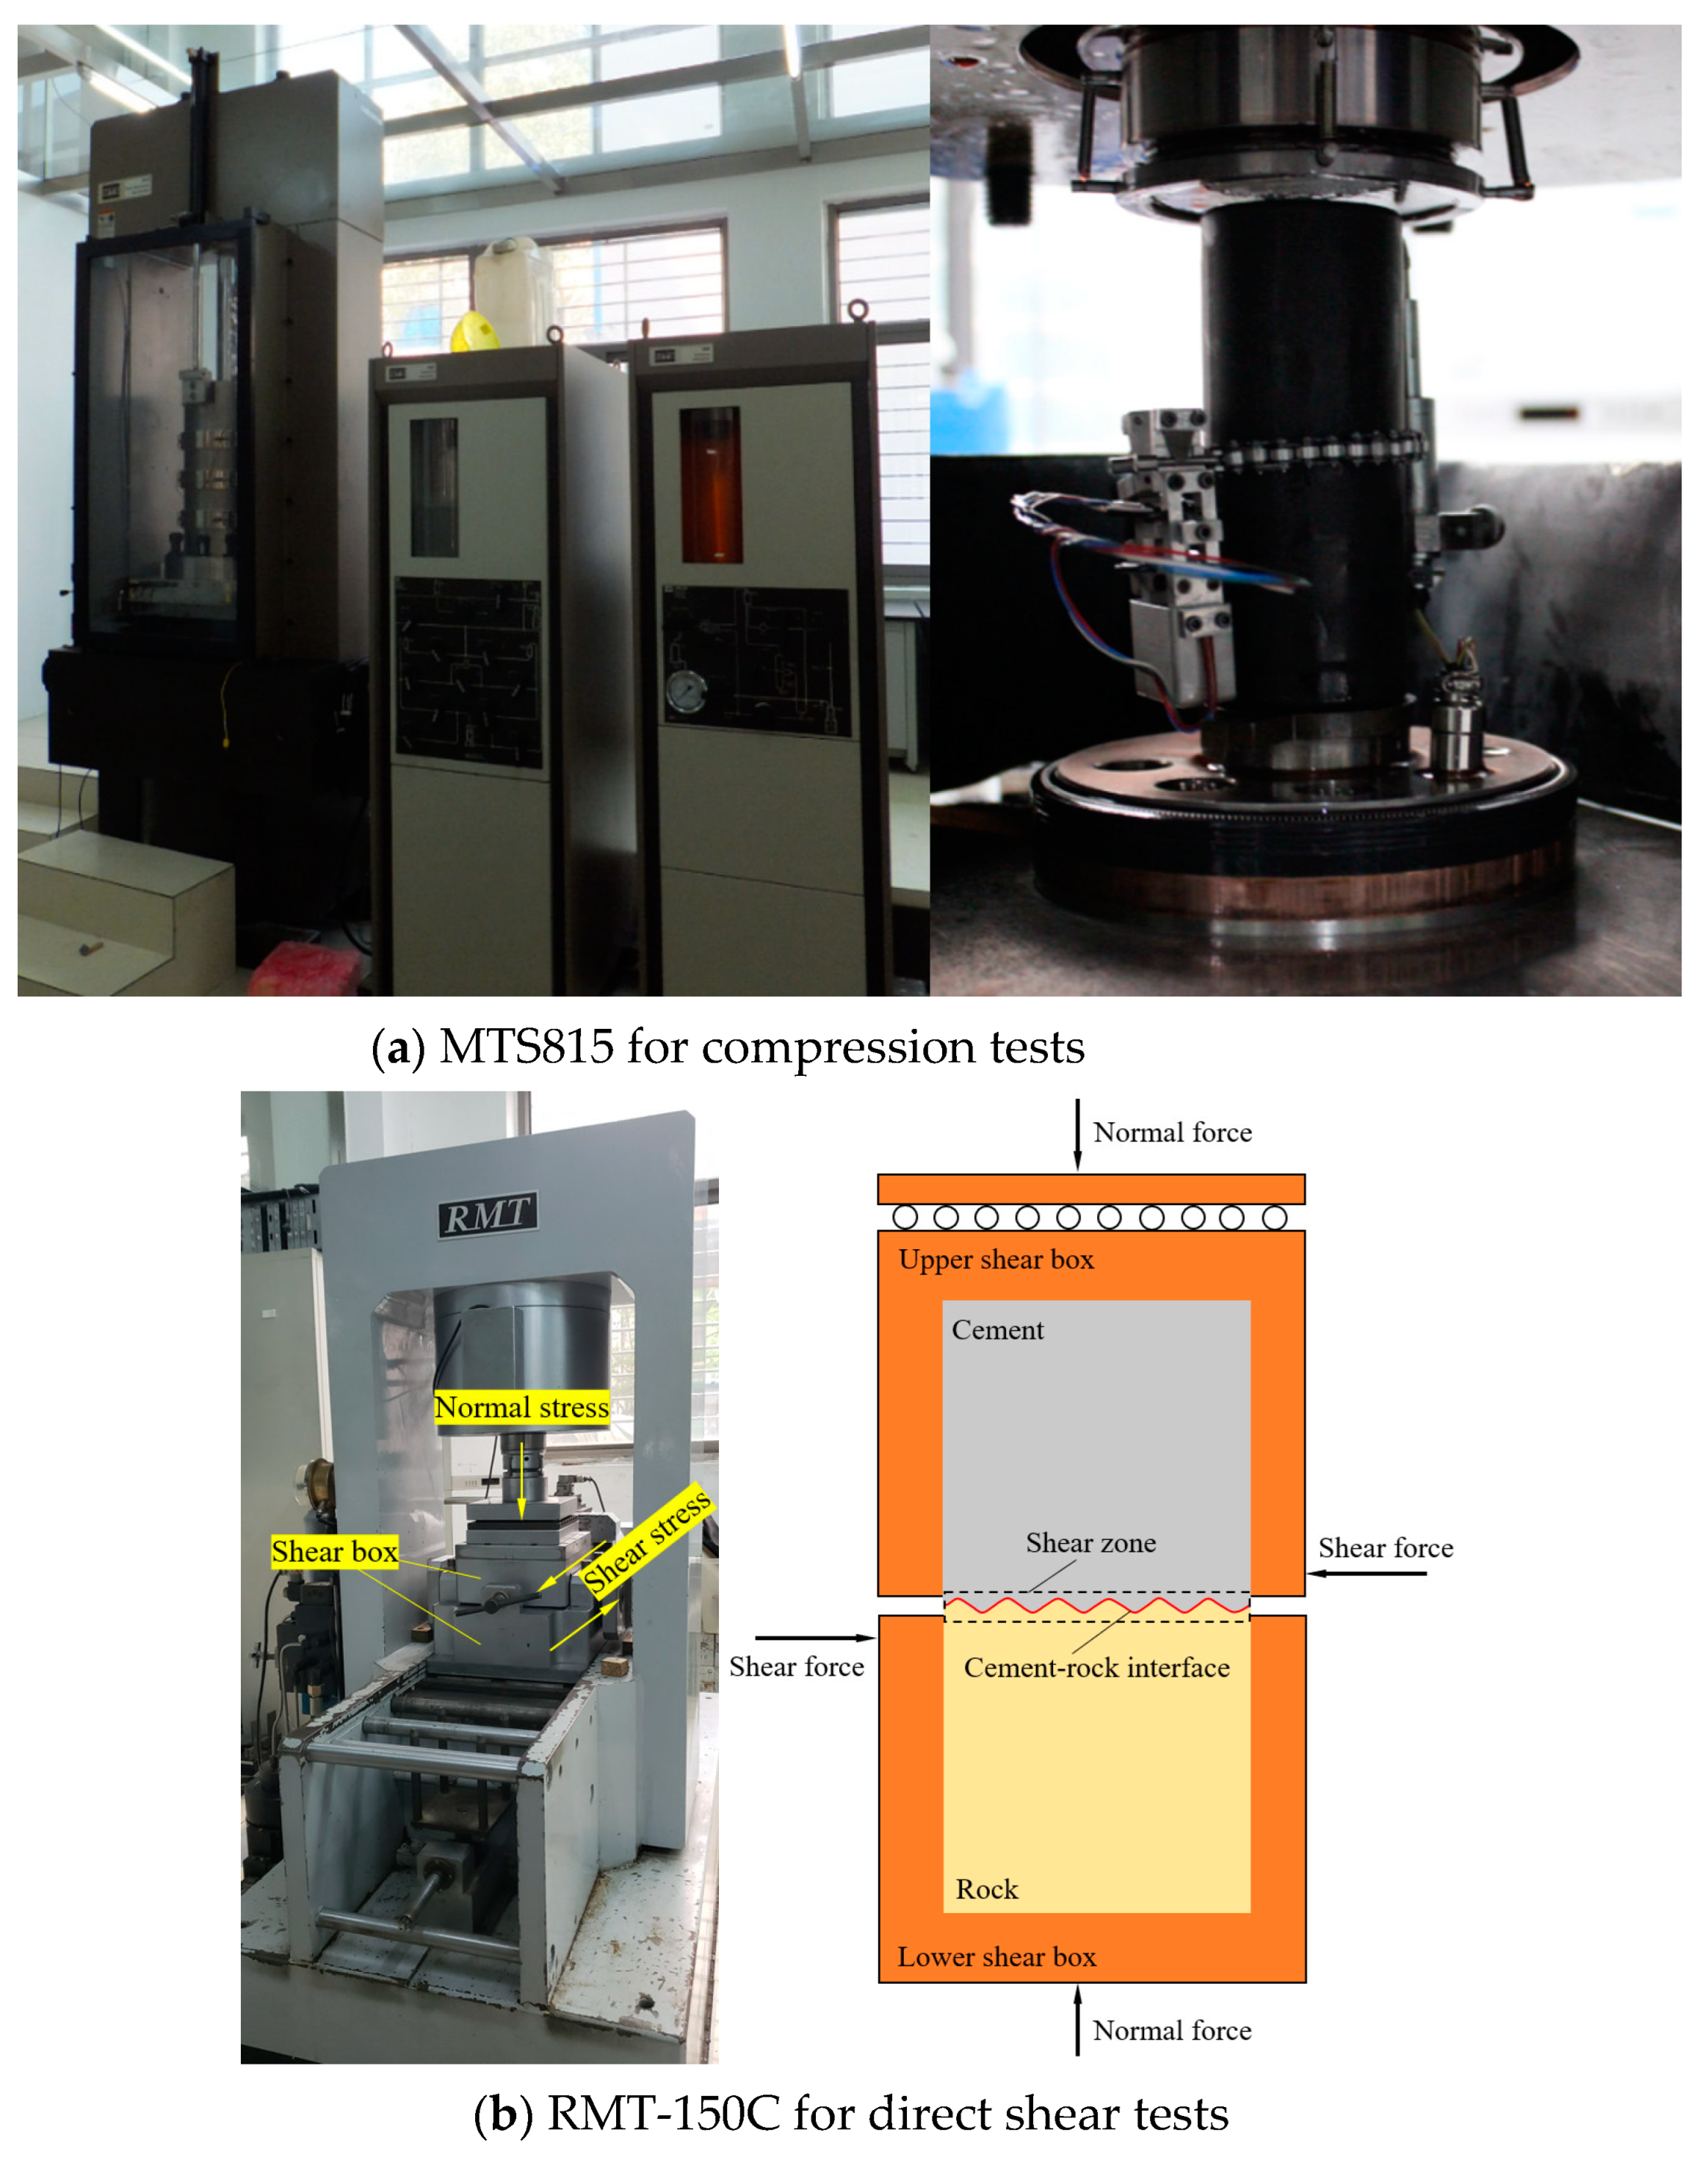
2.3. Experimental Equipment
3. Experimental Results and Analysis
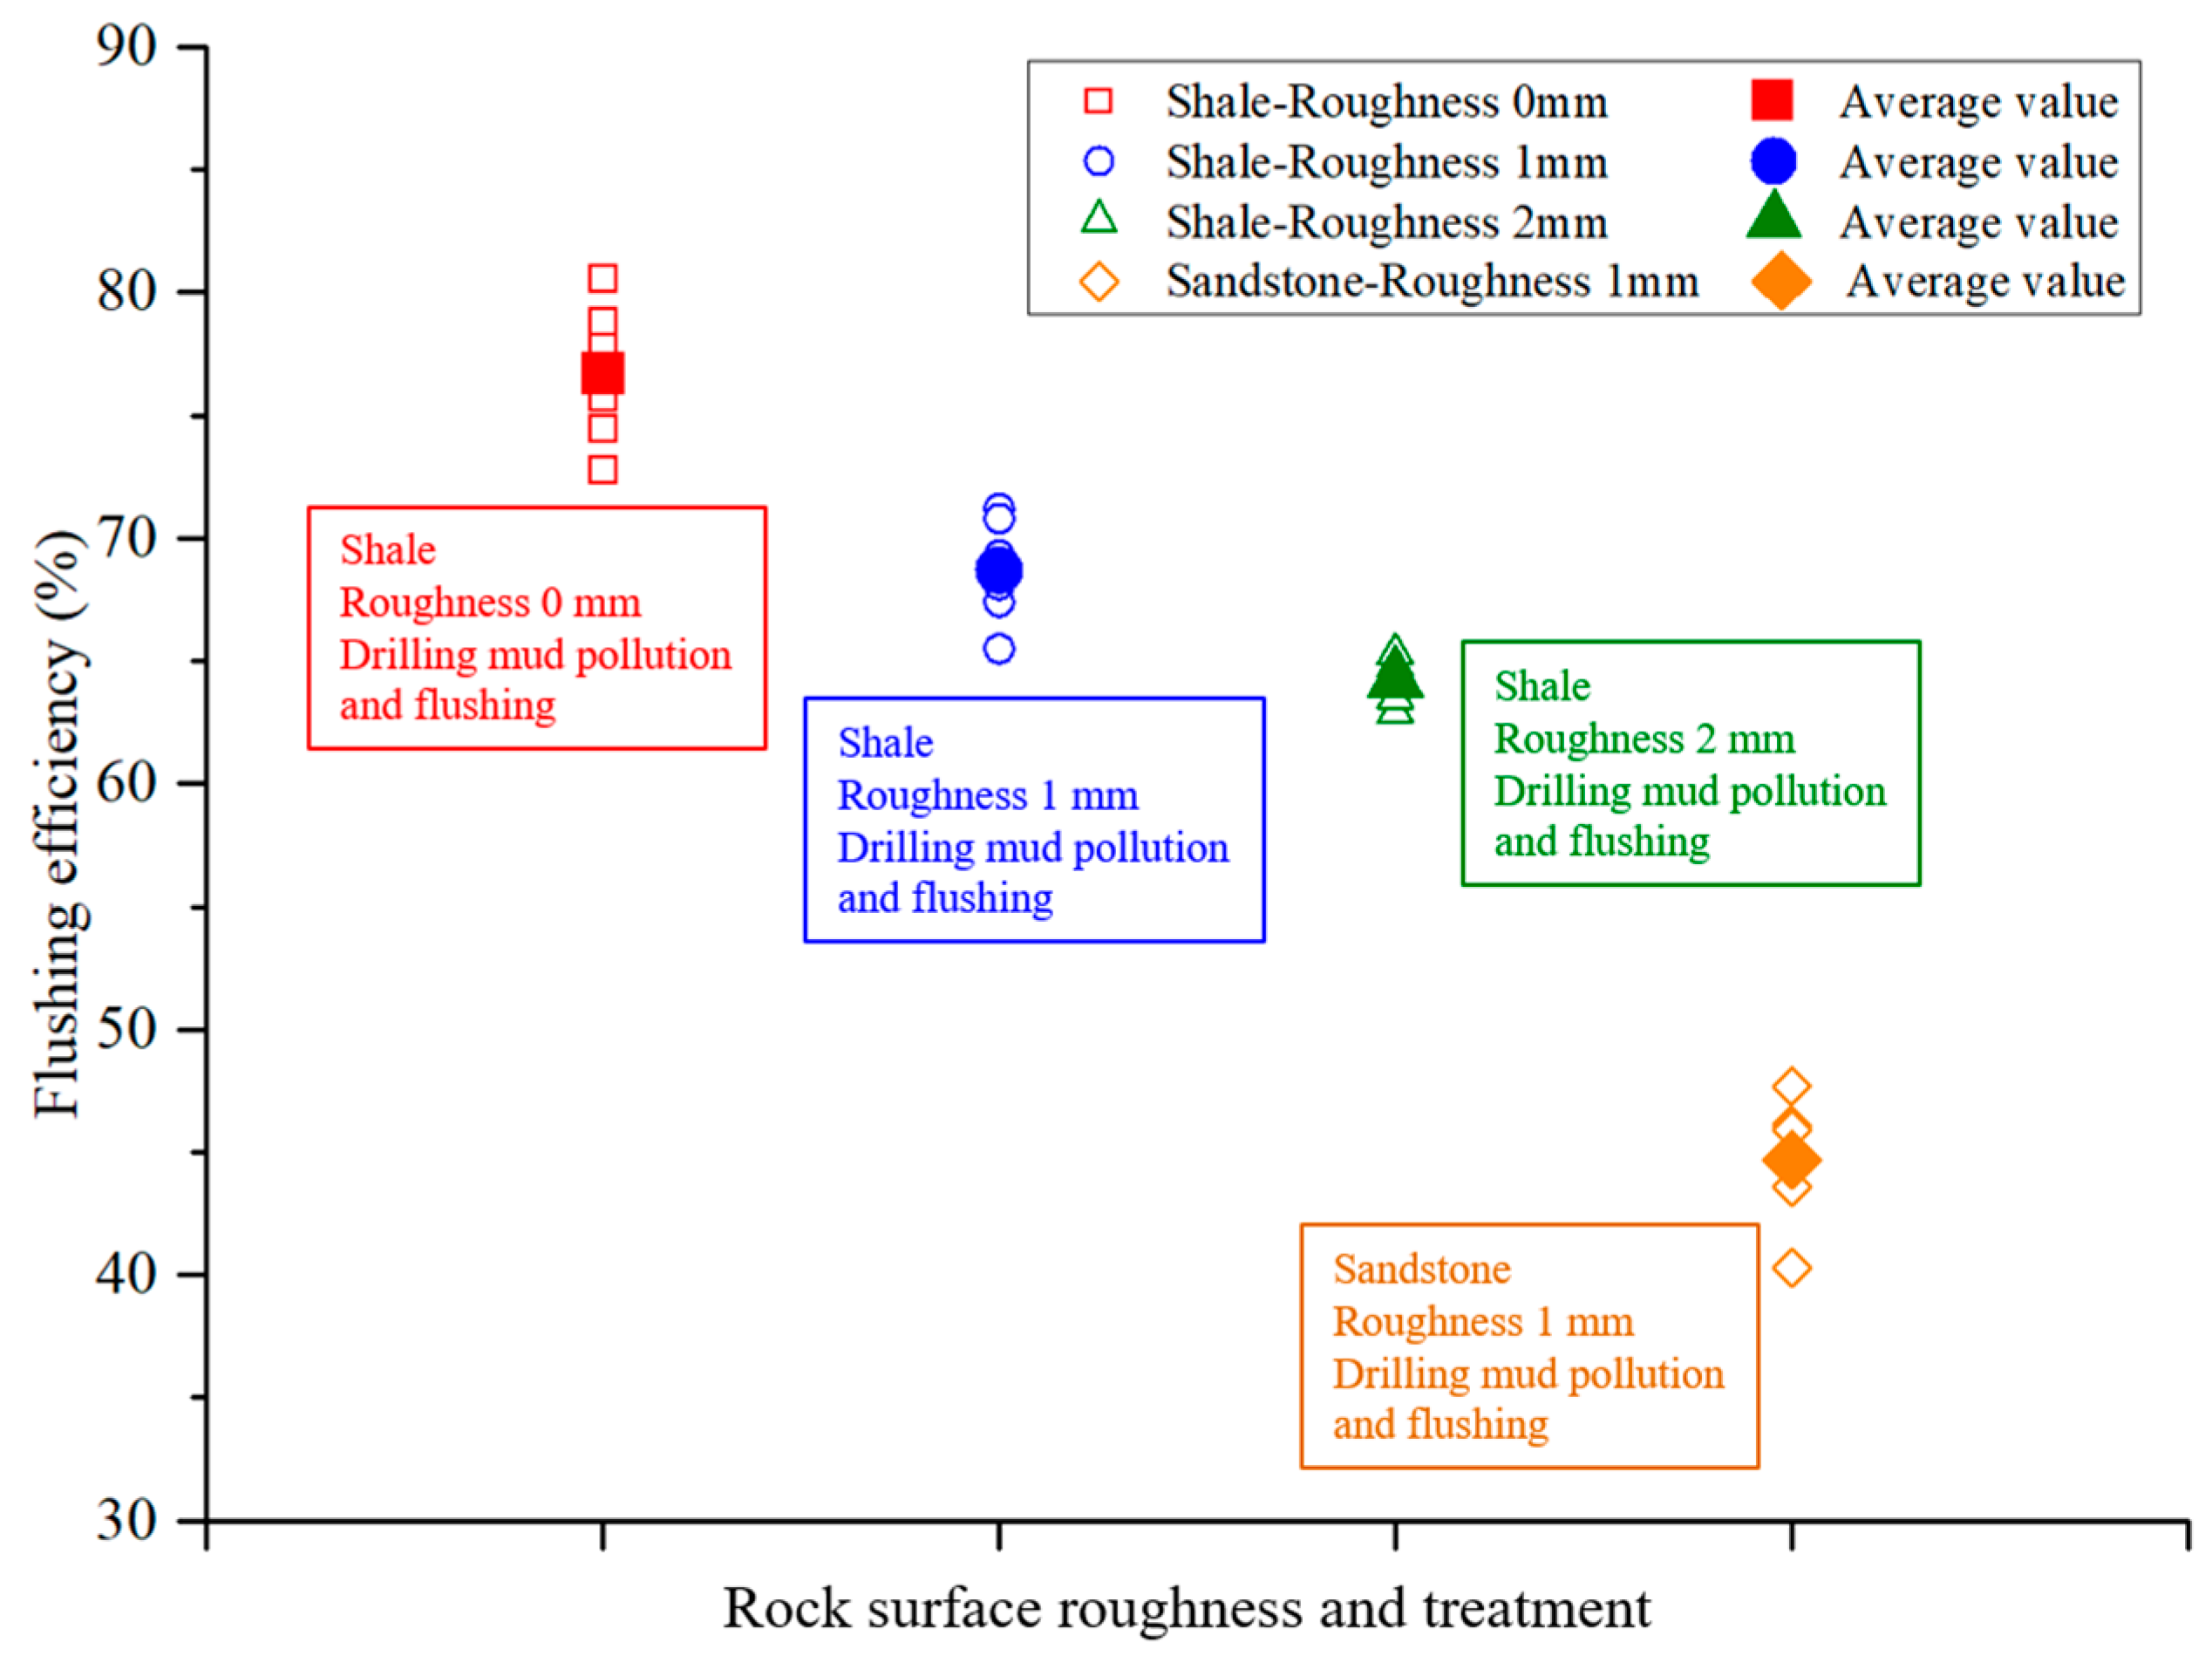
3.1. Mud Flushing Efficiency of Rock Surface
3.2. Mechanical Behavior of Rock–Cement Specimen in Compression
- (1)
- Compressive strength
- (2)
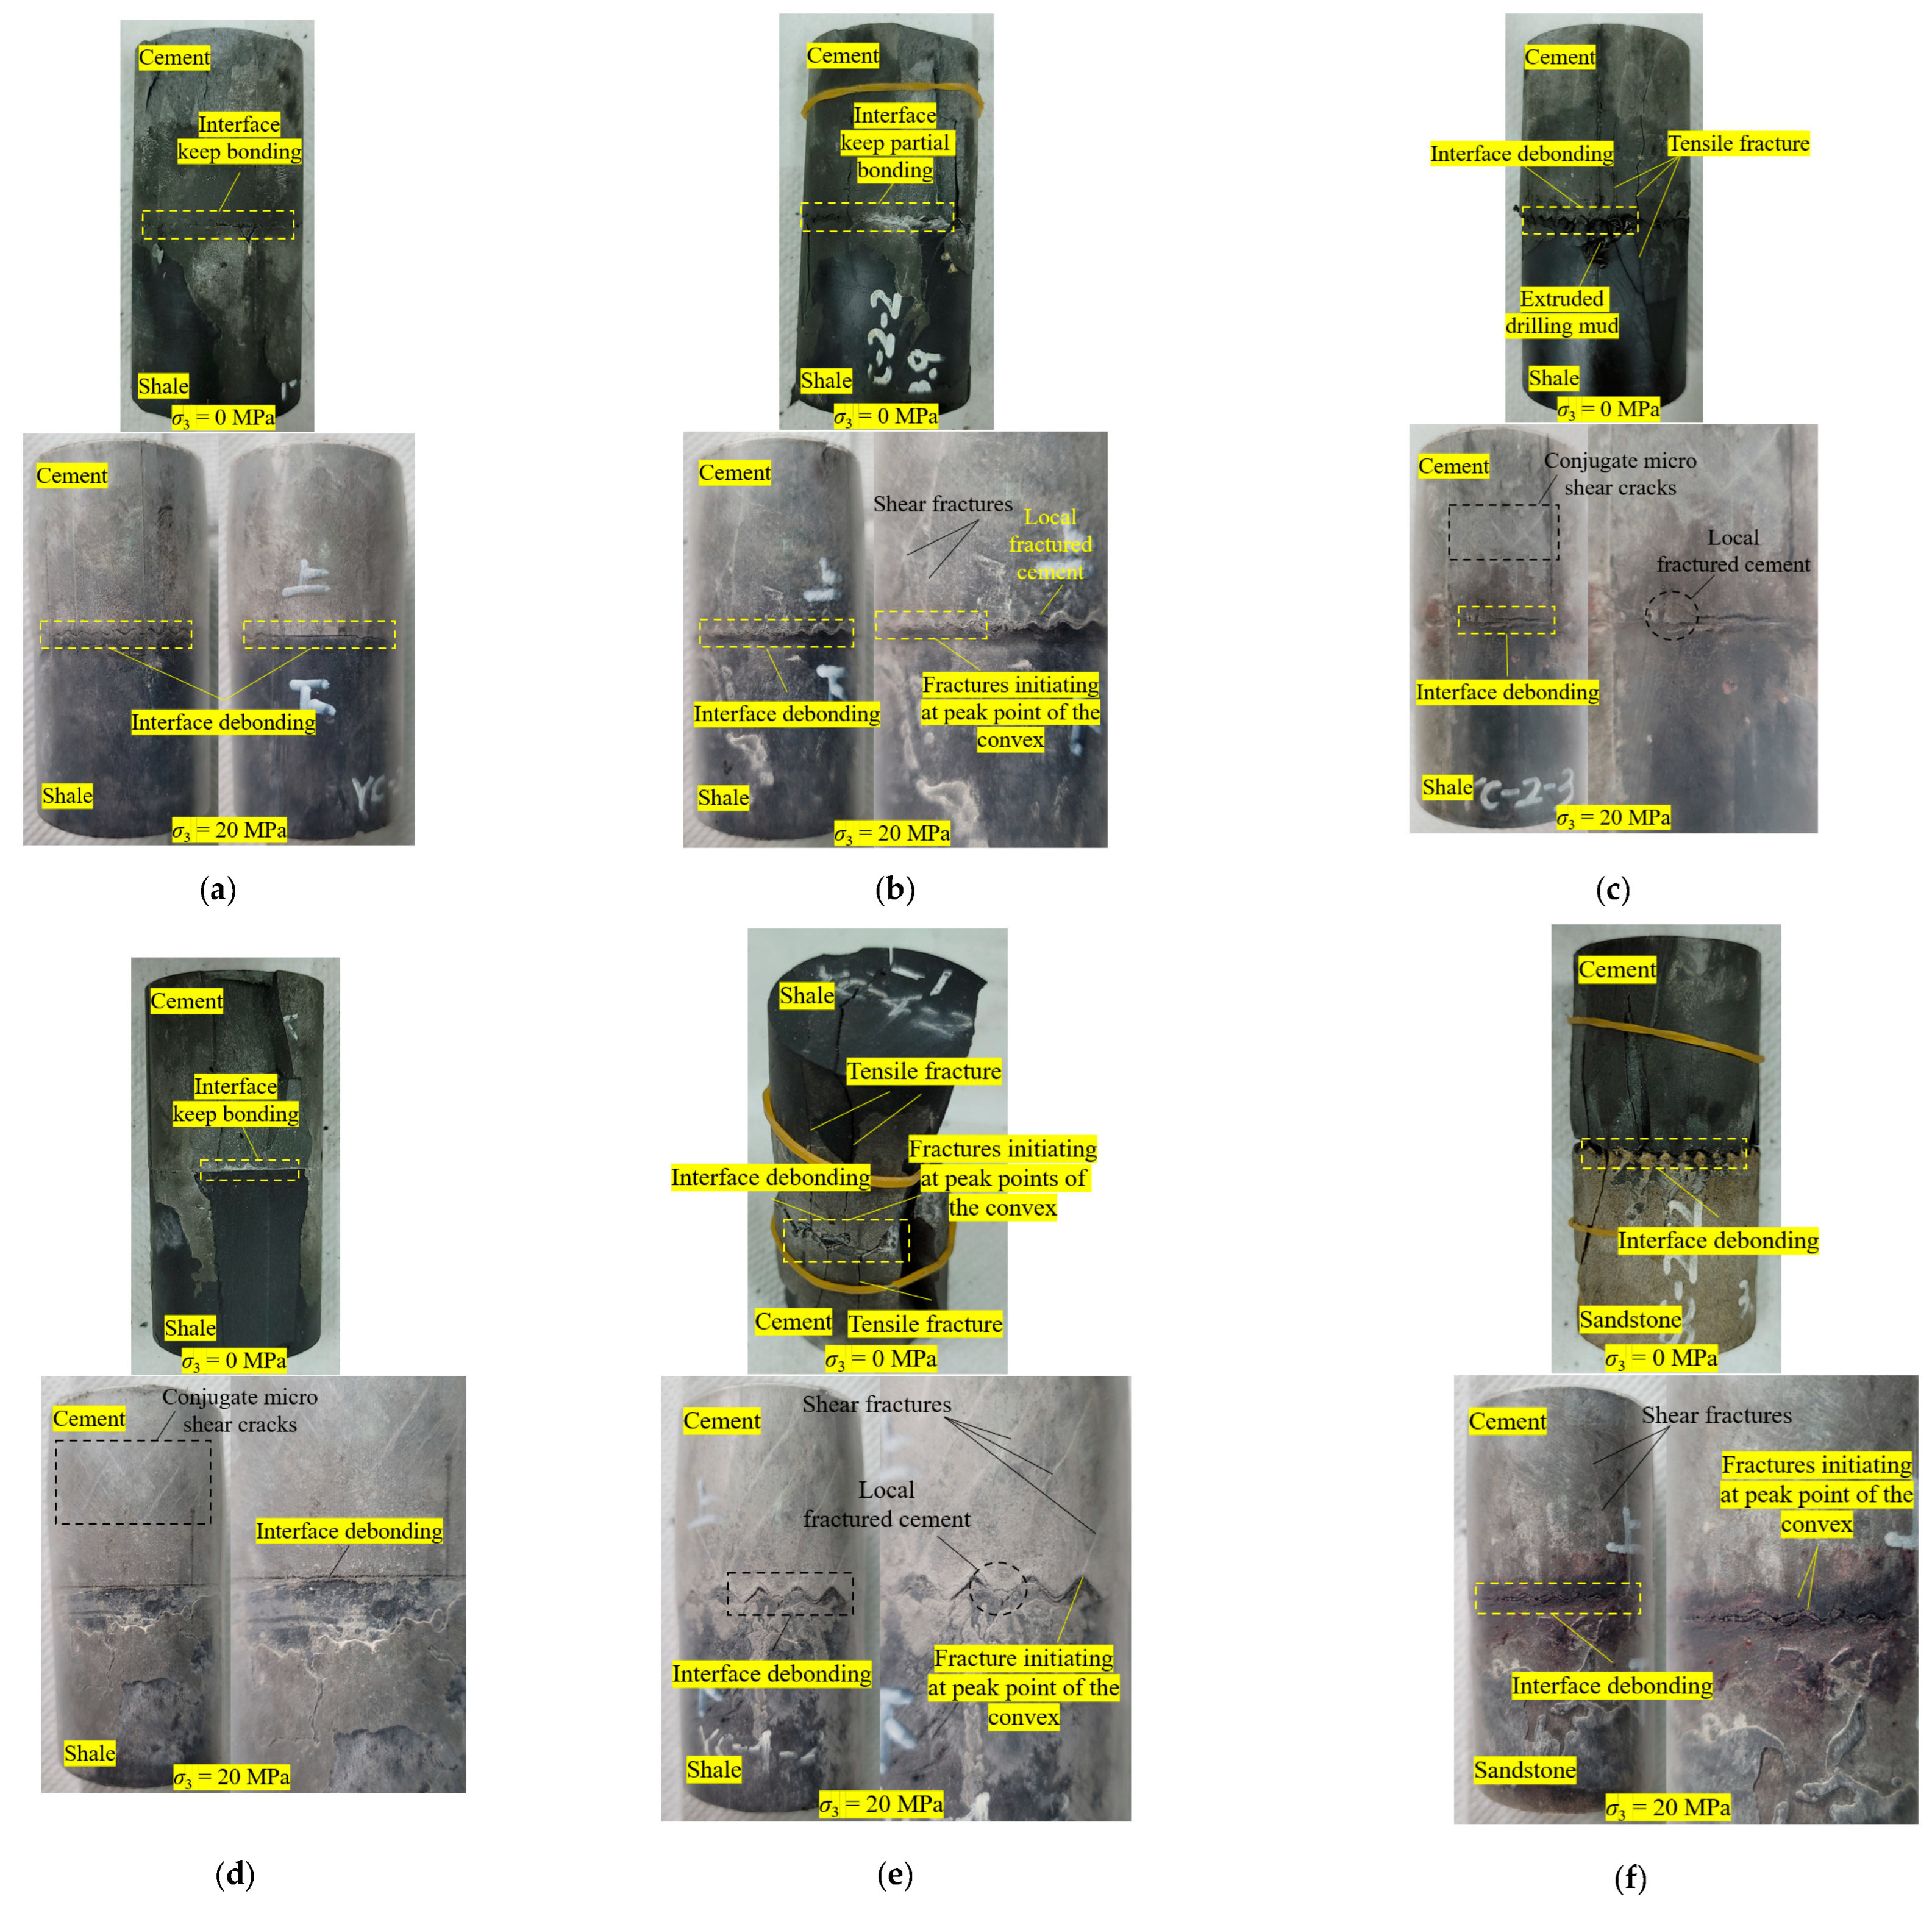
- Failure mode
3.3. Shear Behavior of Rock–Cement Interface
4. Discussion
4.1. The Simulation of the Surface Roughness
4.2. The Contribution of Rock Cohesion to the Interface Shear Failure
4.3. The Limitations
5. Conclusions
- (1)
- With the shale surface roughness increasing from 0 to 2 mm, the flushing efficiency decreases from 76.7% to 64.2%. Under the same washing procedure, the flushing efficiency of sandstone is only 44.7%, remarkably lower than that of shale (68.7%);
- (2)
- In a uniaxial compression state, the compressive strength varies in a wide range (20.6~60.1 Mpa). Tensile splitting in a vertical direction is the dominate failure mode. The integrity of interface cementation depends on the interface cleanliness and roughness;
- (3)
- Under triaxial compression, all the stress–strain curves exhibit remarkable elastoplastic characteristics, and the compressive strength focuses on the range of 110~120 Mpa. The cement part presents noteworthy plastic deformation and several micro shear fractures develop. There is incompatible deformation between cement- and rock-induced interface debonding;
- (4)
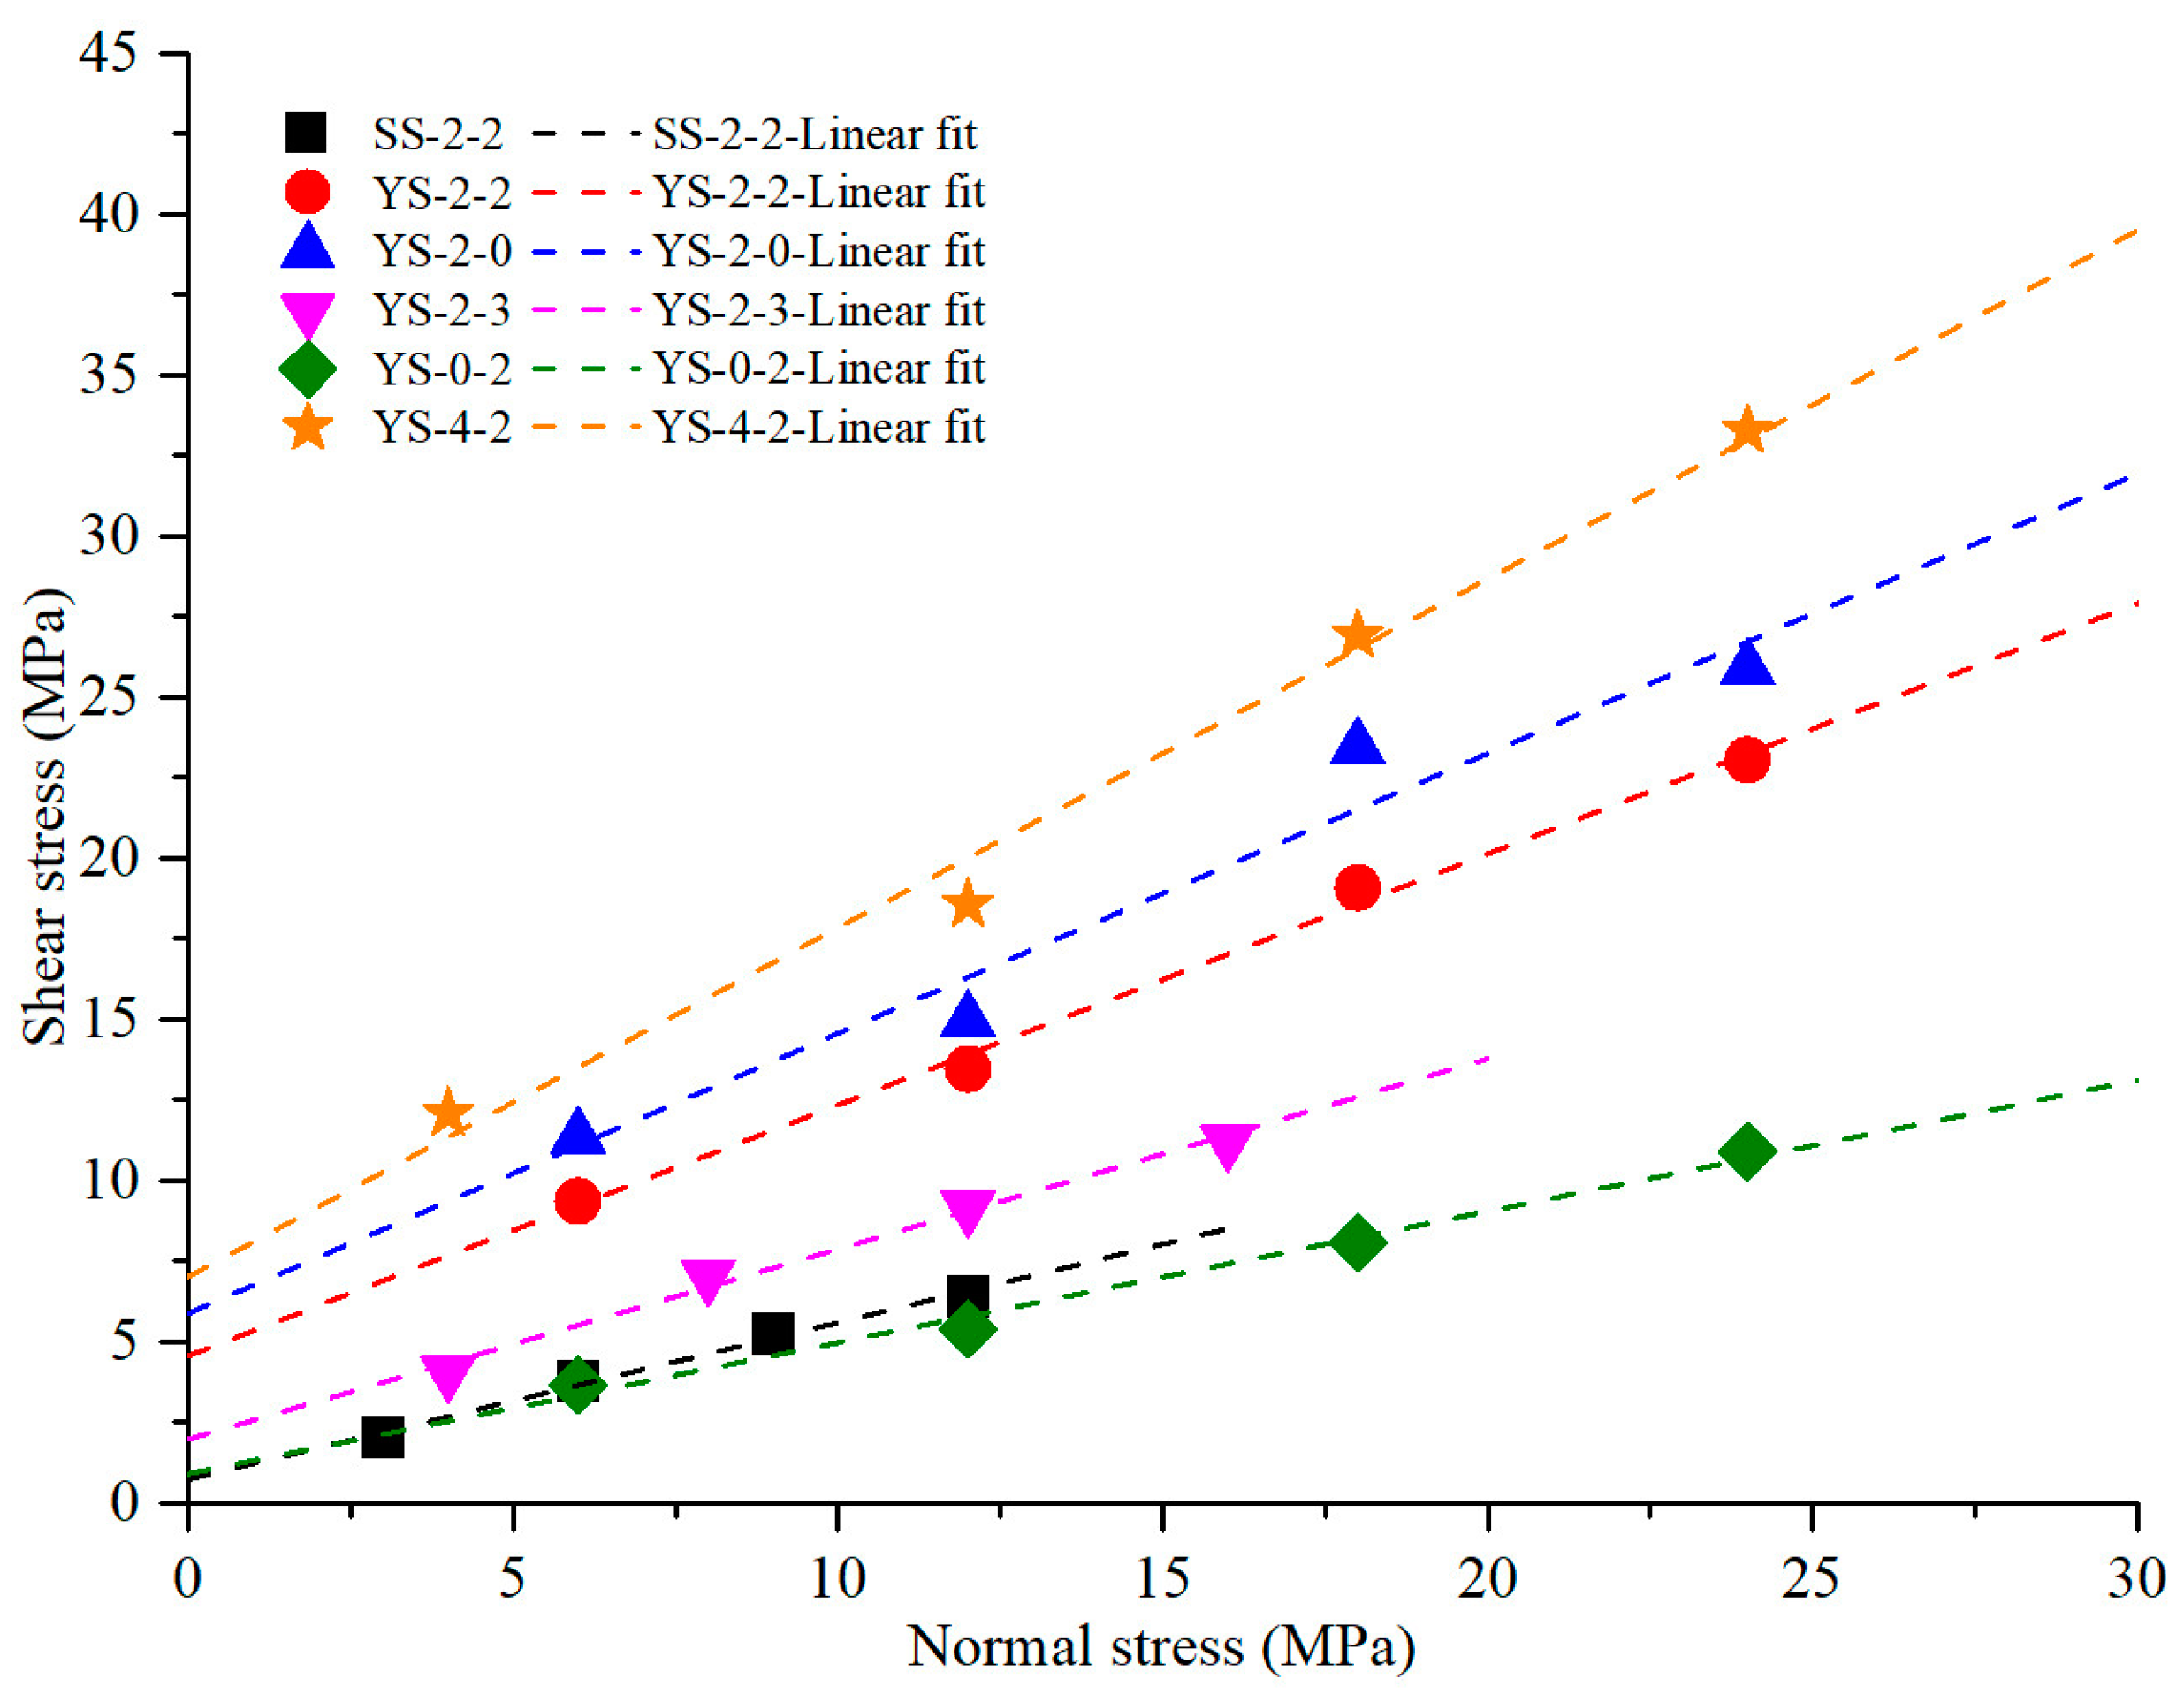
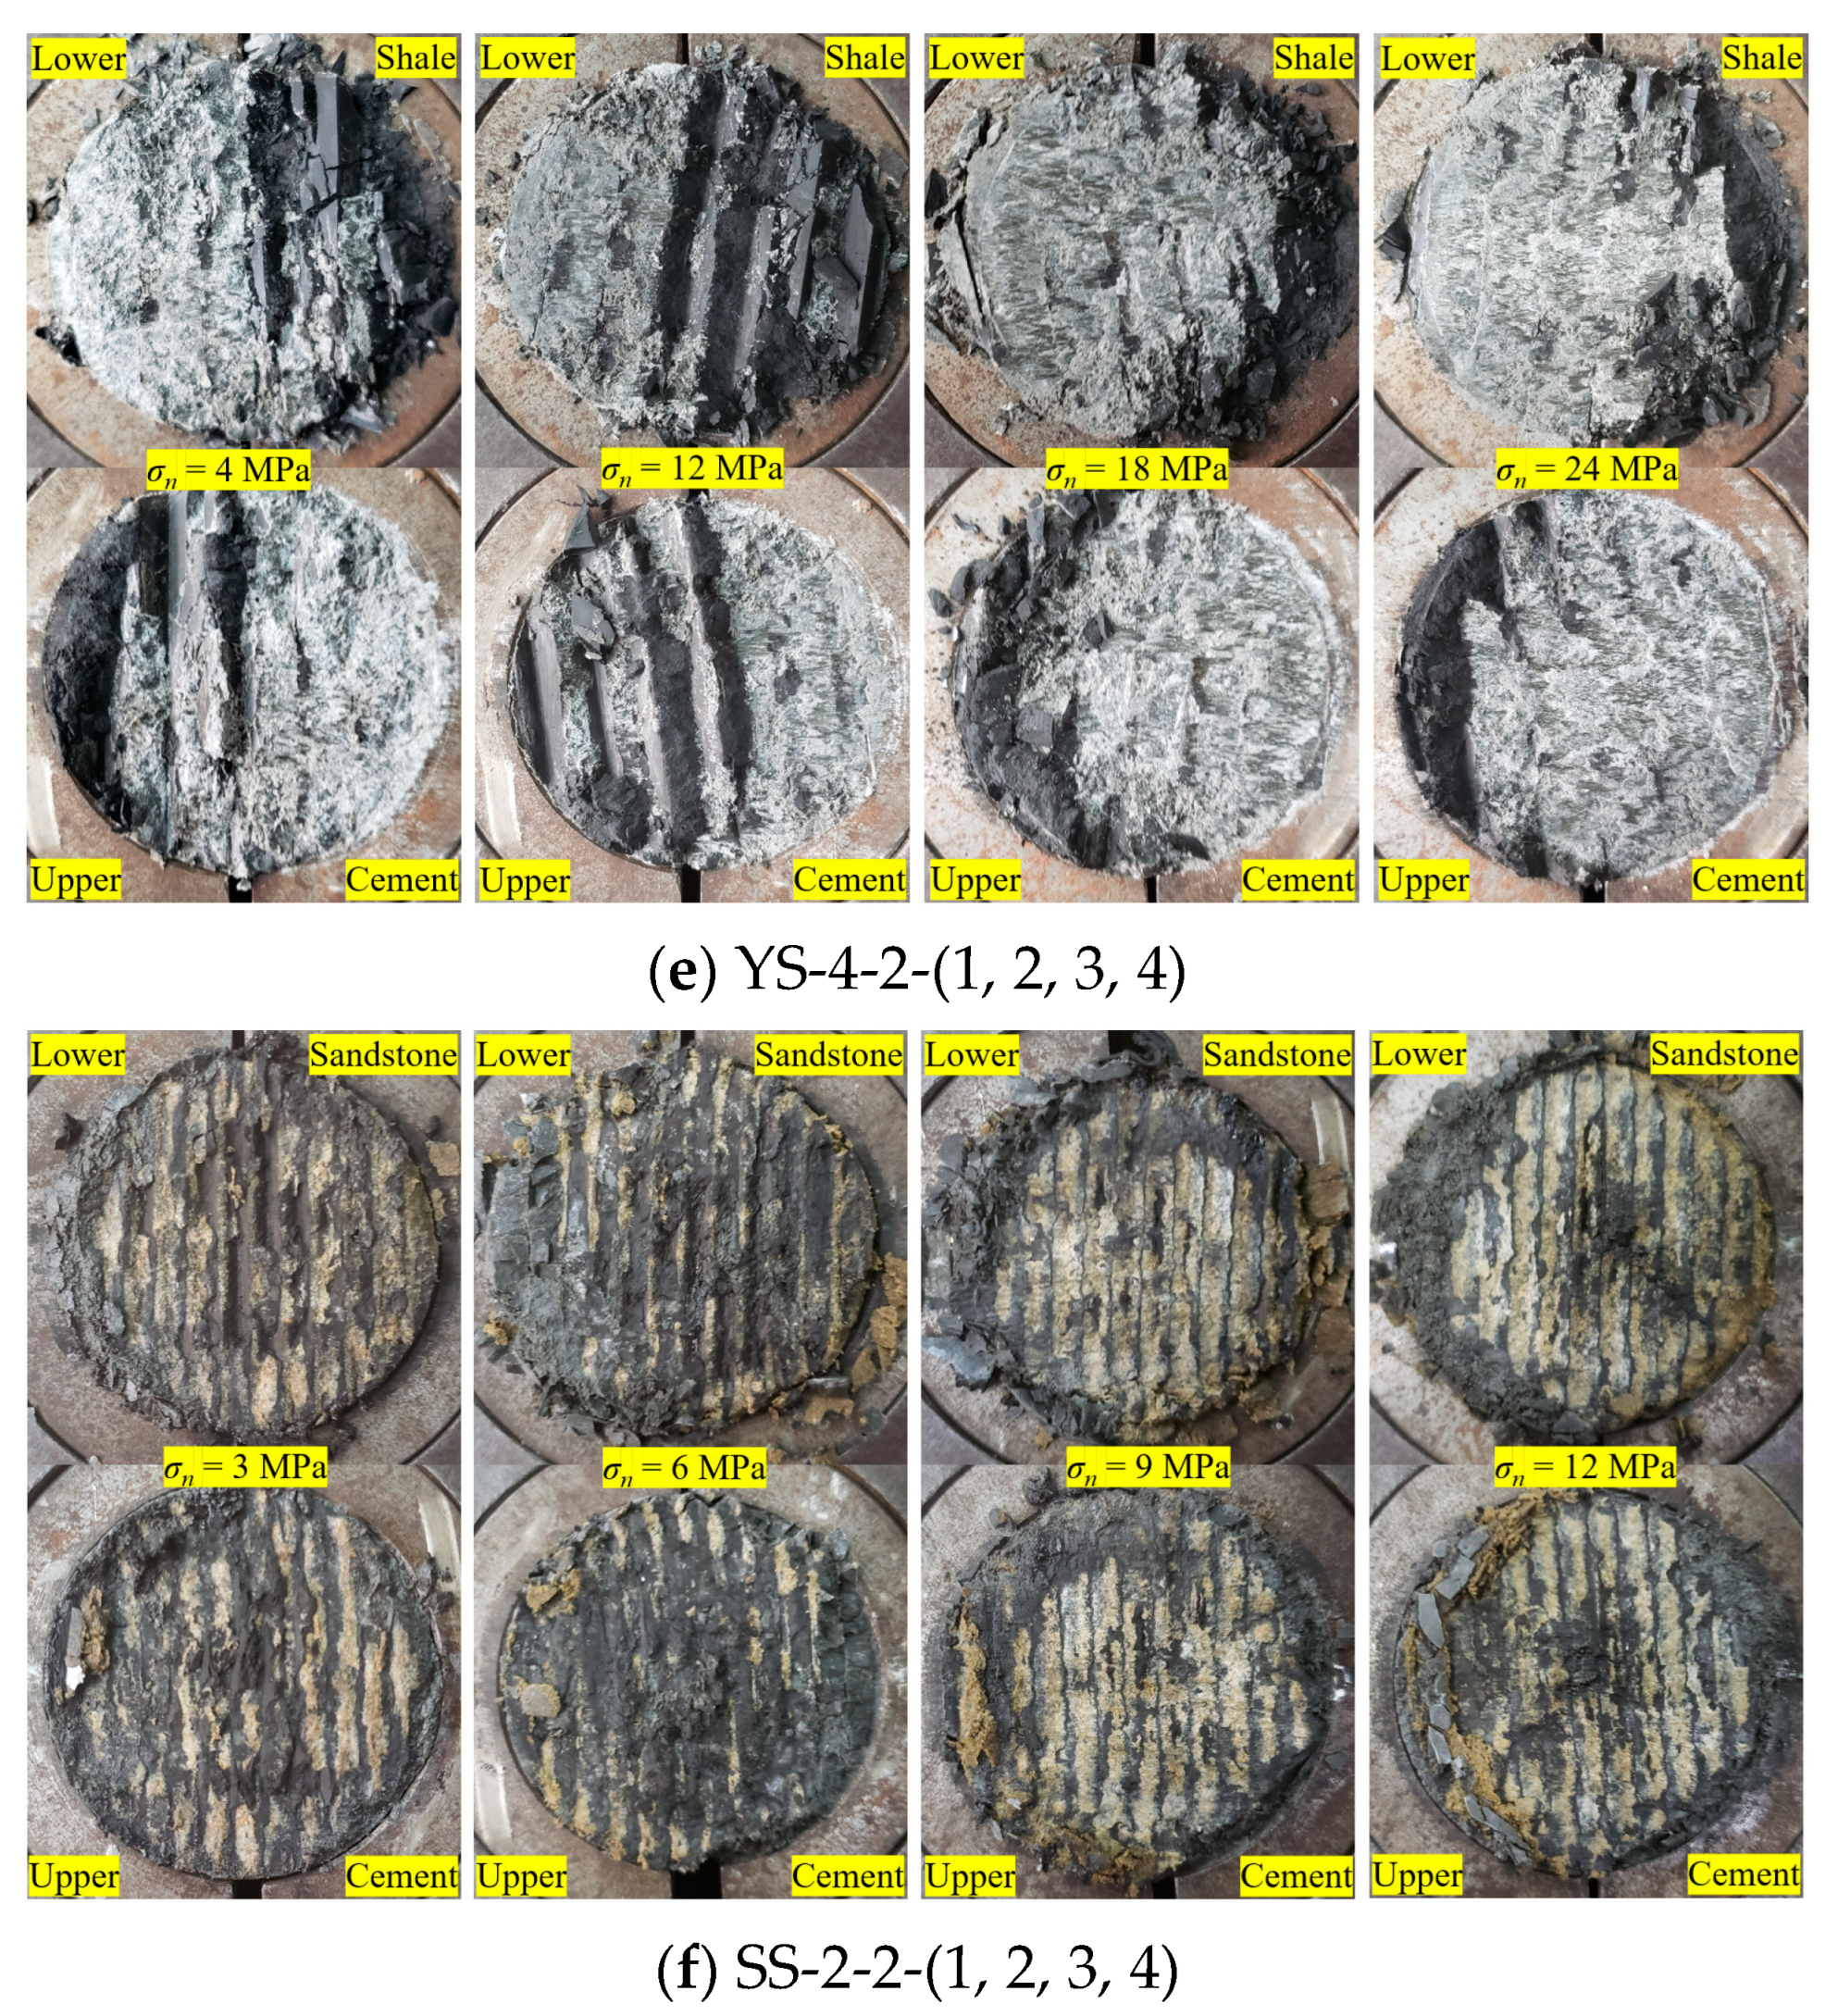
- The internal friction angle and cohesive strength decrease with the increase in the degree of drilling mud pollution and increase with the rise in surface roughness. The shear facture surface usually manifests as a shear zone, in which the rock, cement, and interface all contribute to the final shear failure.
Author Contributions
Funding
Institutional Review Board Statement
Informed Consent Statement
Data Availability Statement
Conflicts of Interest
References
- Yin, F.; Hou, D.; Liu, W.; Deng, Y. Novel assessment and countermeasure for micro-annulus initiation of cement sheath during injection/fracturing. Fuel 2019, 252, 157–163. [Google Scholar] [CrossRef]
- Gray, K.E.; Podnos, E.; Becker, E. Finite-element studies of near-wellbore region during cementing operations: Part I. SPE Drill. Complet. 2009, 24, 127–136. [Google Scholar] [CrossRef]
- Li, J.; Xi, Y.; Tao, Q.; Li, Y.; Qu, G. Experimental investigation and numerical simulation of the emergence and development of micro-annulus in shale gas wells subjected to multistage fracturing. J. Nat. Gas Sci. Eng. 2020, 78, 103314. [Google Scholar] [CrossRef]
- Fan, Z.; Parashar, R. Analytical Solutions for a Wellbore Subjected to a Non-isothermal Fluid Flux: Implications for Optimizing Injection Rates, Fracture Reactivation, and EGS Hydraulic Stimulation. Rock Mech. Rock Eng. 2019, 52, 4715–4729. [Google Scholar] [CrossRef]
- Fan, Z.Q.; Jin, Z.H.; Johnson, S.E. Modelling petroleum migration through microcrack propagation in transversely isotropic source rocks. Geophys. J. Int. 2012, 190, 179–187. [Google Scholar] [CrossRef]
- Zhang, N.; Shi, X.; Wang, T.; Yang, C.; Liu, W.; Ma, H.; Daemen, J.J.K. Stability and availability evaluation of underground strategic petroleum reserve (SPR) caverns in bedded rock salt of Jintan, China. Energy 2017, 134, 504–514. [Google Scholar] [CrossRef]
- Lankof, L.; Tarkowski, R. Assessment of the potential for underground hydrogen storage in bedded salt formation. Int. J. Hydrog. Energy 2020, 45, 19479–19492. [Google Scholar] [CrossRef]
- Raju, M.; Kumar Khaitan, S. Modeling and simulation of compressed air storage in caverns: A case study of the Huntorf plant. Appl. Energy 2012, 89, 474–481. [Google Scholar] [CrossRef]
- Liu, W.; Zhang, Z.; Chen, J.; Jiang, D.; Wu, F.; Fan, J.; Li, Y. Feasibility evaluation of large-scale underground hydrogen storage in bedded salt rocks of China: A case study in Jiangsu province. Energy 2020, 198, 117348. [Google Scholar] [CrossRef]
- Wang, T.; Yang, C.; Ma, H.; Li, Y.; Shi, X.; Li, J.; Daemen, J.J.K. Safety evaluation of salt cavern gas storage close to an old cavern. Int. J. Rock Mech. Min. Sci. 2016, 83, 95–106. [Google Scholar] [CrossRef]
- Lavrov, A.; Torsæter, M. Physics and Mechanics of Primary Well Cementing; Springer International Publishing AG: Cham, Switzerland, 2016; ISBN 9783319431642. [Google Scholar]
- Opedal, N.; Todorovic, J.; Torsæter, M.; Vrålstad, T.; Mushtaq, W. Experimental study on the cement-formation bonding. SPE Eur. Form. Damage Conf. Proc. EFDC 2014, 1, 227–238. [Google Scholar] [CrossRef]
- Xu, H.; Ma, T.; Peng, N.; Yang, B. Influences of fracturing fluid injection on mechanical integrity of cement sheath under four failure modes. Energies 2018, 11, 3534. [Google Scholar] [CrossRef]
- Xu, F.; Xu, Z.; Tang, S.; Ren, Q.; Guo, Y.; Wang, L.; Hou, Z.; Liu, Z. Evolution of physical and mechanical properties of cementing materials during underground energy exploitation and storage. J. Energy Storage 2022, 45, 103775. [Google Scholar] [CrossRef]
- He, T.; Wang, T.; Xie, D.; Daemen, J.J.K. The mechanism of pores enhancing the deformation of completion cement under confining pressure. Cem. Concr. Compos. 2022, 125, 104322. [Google Scholar] [CrossRef]
- Quercia, G.; Chan, D.; Luke, K. Weibull statistics applied to tensile testing for oil well cement compositions. J. Pet. Sci. Eng. 2016, 146, 536–544. [Google Scholar] [CrossRef]
- Wang, L.; Zeng, Y.; Zhang, Q.; Xu, F.; Yang, C.; Guo, Y.; Tao, Q.; Liu, J. Experimental study on mechanical properties of oil well cement under high temperature. J. China Univ. Pet. Ed. Nat. Sci. 2018, 42, 88–95. [Google Scholar] [CrossRef]
- Li, Z.; Sun, J.; Luo, P.Y.; Lin, L.; Deng, Z.; Guo, X. Research on the law of mechanical damage-induced deformation of cement sheaths of a gas storage well. J. Nat. Gas Sci. Eng. 2017, 43, 48–57. [Google Scholar] [CrossRef]
- Ladva, H.K.J.; Craster, B.; Jones, T.G.J.; Goldsmith, G.; Scott, D. The cement-to-formation interface in zonal isolation. SPE Drill. Complet. 2005, 20, 186–197. [Google Scholar] [CrossRef]
- Plank, J.; Tiemeyer, C.; Buelichen, D. A study of cement/mudcake/formation interfaces and their impact on the sealing quality of oilwell cement. In Proceedings of the IADC/SPE Asia Pacific Drilling Technology Conference, Bangkok, Thailand, 25–27 August 2014. [Google Scholar] [CrossRef]
- Liu, X.; Nair, S.D.; Cowan, M.; Van Oort, E. A novel method to evaluate cement-shale bond strength. In Proceedings of the SPE International Symposium on Oilfield Chemistry, The Woodlands, TX, USA, 13 April 2015. [Google Scholar]
- Lian, W.; Li, J.; Liu, G.; Tao, Q. Numerical simulation of cement-to-formation interface debonding during hydraulic fracturing of shale gas wells. J. Adhes. Sci. Technol. 2020, 34, 917–935. [Google Scholar] [CrossRef]
- Zhou, J.; Zeng, Y.; Guo, Y.; Chang, X.; Liu, L.; Wang, L.; Hou, Z.; Yang, C. Effect of natural filling fracture on the cracking process of shale Brazilian disc containing a central straight notched flaw. J. Pet. Sci. Eng. 2021, 196, 107993. [Google Scholar] [CrossRef]
- Zhou, X.; Liu, H.; Guo, Y.; Wang, L.; Hou, Z.; Deng, P. An evaluation method of brittleness characteristics of shale based on the unloading experiment. Energies 2019, 12, 1779. [Google Scholar] [CrossRef]
- Yang, H.; Guo, Y.; Wang, L.; Bi, Z.; Guo, W.; Zhao, G.; Yang, C. Study on the Stimulation Effectiveness Evaluation of Large- Scale Hydraulic Fracturing Simulation Experiment Based on Optical Scanning Technology. SPE J. 2022, 1–19. [Google Scholar] [CrossRef]
- Heng, S.; Guo, Y.; Yang, C.; Daemen, J.J.K.; Li, Z. Experimental and theoretical study of the anisotropic properties of shale. Int. J. Rock Mech. Min. Sci. 2015, 74, 58–68. [Google Scholar] [CrossRef]
- Jaeger, J.C.; Cook, N.G.W.; Zimmerman, R.W. Fundamentals of Rock Mechanics, 4th ed.; Blackwell Publishing: Oxford, UK, 2007; ISBN 9788578110796. [Google Scholar]
- Wang, L.; Guo, Y.; Yang, C.; Xiao, J.; Lu, C.; Song, Y. Mechanical characterization of continental shale in Sichuan Basin of China and its potential impact on reservoir stimulation. J. Nat. Gas Sci. Eng. 2020, 79, 103346. [Google Scholar] [CrossRef]


| Materials | Uniaxial Compression Strength (MPa) | Young’s Modulus (GPa) | Poisson’s Ratio | Brazilian Tensile Strength (MPa) |
|---|---|---|---|---|
| Rock–shale | 98.5 | 24.10 | 0.20 | 13.0 |
| Rock–sandstone | 41.2 | 6.23 | 0.13 | 4.4 |
| Cement stone | 59.3 | 9.85 | 0.15 | 3.2 |
| Minerals (%) | Quartz | Albite | Calcite | Dolomite | Pyrite | Illite | Microcline | Clinochlore | |
|---|---|---|---|---|---|---|---|---|---|
| Rock Type | |||||||||
| Shale | 69.78 | 11.40 | 2.80 | 2.16 | 2.93 | 10.93 | -- | -- | |
| Sandstone | 20.19 | 15.65 | 47.76 | 2.01 | -- | -- | 8.56 | 5.83 | |
| Composite Type | Interface Roughness (mm) | Interface Pollution and Flushing | Sample Number | |
|---|---|---|---|---|
| Compression Test | Shear Test | |||
| Shale + Cement | 0 | Drilling mud (15 mL) + Flushing fluid (15 mL) | YC-0-2-(1, 2) | YS-0-2-(1, 2, 3, 4) |
| 1 | YC-2-2-(1, 2) | YS-2-2-(1, 2, 3, 4) | ||
| 2 | YC-4-2-(1, 2) | YS-4-2-(1, 2, 3, 4) | ||
| 1 | Fresh and untreated | YC-2-0-(1, 2) | YS-2-0-(1, 2, 3, 4) | |
| 1 | Drilling mud (15 mL) | YC-2-3-(1, 2) | YS-2-3-(1, 2, 3, 4) | |
| Sandstone + Cement | 1 | Drilling mud (15 mL) + Flushing fluid (15 mL) | SC-2-2-(1, 2) | SS-2-2-(1, 2, 3, 4) |
| Test Type | Sample No. | Compressive Strength (MPa) | Test Type | Sample No. | Deviatoric Stress (MPa) | Compressive Strength (MPa) |
|---|---|---|---|---|---|---|
| Uniaxial compression | YC-2-0-1 | 60.1 | Triaxial compression (σ3 = 20 MPa) | YC-2-0-2 | 99.8 | 119.8 |
| YC-2-2-1 | 55.9 | YC-2-2-2 | 95.9 | 115.9 | ||
| YC-2-3-1 | 31.7 | YC-2-3-2 | 92.8 | 112.8 | ||
| YC-0-2-1 | 59.4 | YC-0-2-2 | 96.5 | 116.5 | ||
| YC-4-2-1 | 31.6 | YC-4-2-2 | 90.7 | 110.7 | ||
| SC-2-2-1 | 20.6 | SC-2-2-2 | 92.6 | 112.6 |
| Sample Number | σn (MPa) | τn (MPa) | tanφ | φ (°) | c (MPa) | Linear Fit |
|---|---|---|---|---|---|---|
| τn = σn tanφ + c | ||||||
| YS-2-0-1 | 6 | 11.34 | 0.8688 | 40.9 | 5.87 | τn = 0.8688 σn + 5.87 R2 = 0.9339 |
| YS-2-0-2 | 12 | 14.95 | ||||
| YS-2-0-3 | 18 | 23.43 | ||||
| YS-2-0-4 | 24 | 25.89 | ||||
| YS-2-2-1 | 6 | 9.35 | 0.7788 | 37.9 | 4.55 | τn = 0.7788 σn + 4.55 R2 = 0.9930 |
| YS-2-2-2 | 12 | 13.45 | ||||
| YS-2-2-3 | 18 | 19.08 | ||||
| YS-2-2-4 | 24 | 23.05 | ||||
| YS-2-3-1 | 4 | 4.05 | 0.5905 | 30.6 | 1.96 | τn = 0.5905 σn + 1.96 R2 = 0.9868 |
| YS-2-3-2 | 8 | 7.03 | ||||
| YS-2-3-3 | 12 | 9.17 | ||||
| YS-2-3-4 | 16 | 11.21 | ||||
| YS-0-2-1 | 6 | 3.64 | 0.4071 | 22.2 | 0.89 | τn = 0.4071 σn + 0.89 R2 = 0.9843 |
| YS-0-2-2 | 12 | 5.39 | ||||
| YS-0-2-3 | 18 | 8.07 | ||||
| YS-0-2-4 | 24 | 10.89 | ||||
| YS-4-2-1 | 4 | 12.08 | 1.0833 | 47.3 | 7.01 | τn =1.0833 σn + 7.01 R2 = 0.9833 |
| YS-4-2-2 | 12 | 18.56 | ||||
| YS-4-2-3 | 18 | 26.92 | ||||
| YS-4-2-4 | 24 | 33.29 | ||||
| SS-2-2-1 | 3 | 2.03 | 0.4863 | 25.9 | 0.72 | τn = 0.4863 σn + 0.72 R2 = 0.9878 |
| SS-2-2-2 | 6 | 3.79 | ||||
| SS-2-2-3 | 9 | 5.24 | ||||
| SS-2-2-4 | 12 | 6.41 |
Publisher’s Note: MDPI stays neutral with regard to jurisdictional claims in published maps and institutional affiliations. |
© 2022 by the authors. Licensee MDPI, Basel, Switzerland. This article is an open access article distributed under the terms and conditions of the Creative Commons Attribution (CC BY) license (https://creativecommons.org/licenses/by/4.0/).
Share and Cite
Wang, L.; Liu, B.; Yang, H.; Guo, Y.; Li, J.; Liu, H. Experimental Study on the Compressive and Shear Mechanical Properties of Cement–Formation Interface Considering Surface Roughness and Drilling Mud Contamination. Energies 2022, 15, 6472. https://doi.org/10.3390/en15176472
Wang L, Liu B, Yang H, Guo Y, Li J, Liu H. Experimental Study on the Compressive and Shear Mechanical Properties of Cement–Formation Interface Considering Surface Roughness and Drilling Mud Contamination. Energies. 2022; 15(17):6472. https://doi.org/10.3390/en15176472
Chicago/Turabian StyleWang, Lei, Bohang Liu, Hanzhi Yang, Yintong Guo, Jing Li, and Hejuan Liu. 2022. "Experimental Study on the Compressive and Shear Mechanical Properties of Cement–Formation Interface Considering Surface Roughness and Drilling Mud Contamination" Energies 15, no. 17: 6472. https://doi.org/10.3390/en15176472