Article

Operation Method of On-Load Tap Changer on Main Transformer Considering Reverse Power Flow in Distribution System Connected with High Penetration on Photovoltaic System

Department of Electrical Engineering, Soongsil University, 369 Sangdo-ro, Dongjak-gu, Seoul 06978, Korea
*
Author to whom correspondence should be addressed.
Energies 2022, 15(17), 6473; https://doi.org/10.3390/en15176473
Submission received: 1 August 2022 / Revised: 24 August 2022 / Accepted: 30 August 2022 / Published: 5 September 2022

Abstract

:
The increasing use of photovoltaics (PVs) in distribution systems owing to the low-carbon policy has given rise to the need for various technological changes. In particular, the operation of on-load tap changers (OLTCs) has attracted attention. In traditional distribution systems, the OLTC operates via a line-drop compensator (LDC), which focuses on the load to solve the low-voltage problem; however, the problem of over-voltage caused by PVs persists. Currently, a method for operating an OLTC using the measured voltage is being researched; however, solving the voltage problem for several feeders connected to a main transformer (MT) is not viable. Therefore, this study proposes an OLTC operation method to address the feeder with the largest voltage problem depending on the direction of power flow. The proposed method selects a point where the OLTC operates using the difference between the measured and reference voltages. Setting the reference voltage can solve the problem that occurs due to the direction of power flow. Finally, the effectiveness of the proposed method is verified via case studies. Based on the results, we can conclude that the proposed method effectively solves the voltage problem, and an increase in hosting capacity can be expected.

1. Introduction

According to the Paris Climate Agreement, more emphasis has been given to low-carbon facilities; as a result, the use of photovoltaics (PVs) in the distribution system has rapidly increased [1,2,3,4,5]. However, unlike in traditional distribution systems wherein only loads exist, the voltage increases toward the end of the feeder owing to PVs, which lowers the power quality [6,7,8,9]. Therefore, various technological changes are required in the distribution system. Among them, active efforts of distribution system operators (DSOs) and PV companies are required to solve the voltage problem. In [10,11,12,13], the voltage problem could be solved by installing a step voltage regulator (SVR). However, the use of SVR includes a high investment cost and increases the burden of DSOs. A voltage adjustment method using a smart inverter is presented in [14,15,16,17]. However, it is difficult to increase the penetration rate of smart inverters because the current inverters of PV companies should be replaced with smart inverters. In addition, there is an issue of requirement of compensation based on the curtailment function of smart inverters. Voltage regulation through energy storage system (ESS) is suggested in [18,19,20,21]. However, the ESS has high economic operation cost and lacks the ability to recompensate, unlike a smart inverter. Therefore, an on-load tap changer (OLTC) operation method that could solve the voltage problem by changing the control method of the existing equipment is currently being researched. Based on recent developments, the main transformer (MT) is capable of tolerating reverse power flow to accommodate the high penetration rates of PV [22,23,24,25,26]. In addition, the OLTC should be operated to solve the voltage problem of all connected feeders by allowing reverse power flow. In particular, there is a need for an OLTC operation plan that can solve the problem of low-voltage caused by the load and over-voltage caused by the PV. A solution to the low-voltage problems using the line-drop compensator (LDC) for OLTC operation in the load feeder is suggested in [27]. However, because the LDC method measures the current and calculates the voltage, it cannot operate properly when the current decreases owing to the influence of PV; furthermore, negative current occurs owing to the reverse power flow. Therefore, it is necessary to improve the control method focusing on the load. An operation method of the OLTC on a single feeder by installing a voltage measuring facility to solve the problem of LDC is presented in [28,29]. However, multiple feeders are connected to MT. If the OLTC operation focuses on over-voltage, low- voltage could occur in some feeders. Therefore, the reference of operation is required to solve the voltage problem of all lines. The OLTC operation method is suggested in multiple-feeder in [30,31]. However, the reference voltage according to the reverse power flow was not set. The same problem as the previous method could occur. OLTC optimization methods that use the OLTCs to solve voltage issues are suggested in [32,33]. However, analyzing the problem of the OLTC operation method and finding a solution is necessary. Therefore, this study presents a method for setting the reference point for the OLTC operation using the voltage difference and reference voltage based on the direction of the power flow. The reference voltage is established by considering the normal voltage and dividing it depending on the purpose (over-voltage or low-voltage). In addition, it is configured to operate as a negative tap in case of reverse power flow to solve the over-voltage problem. Finally, the effectiveness of the proposed method was verified by estimating the cost of additional facilities through case studies.

2. Existing OLTC Operation Methods and Problems

Owing to various characteristics, voltage fluctuations may occur in the lines connected to the MT, making it unfeasible to be operated within the normal range. OLTC automatically adjusts the voltage by changing the tap to operate all lines connected to the MT within the normal range. In general, the secondary voltage is varied by changing the tap on the primary side of the transformer with a small current. The method of changing the tap could be divided into three cases, and the DSO selects and uses it depending on the situation.

2.1. Constant Voltage Method

The constant voltage method is fixing the tap position to a constant value regardless of the load. The fixed value is established through the experience of the DSO, and no voltage problem should exist in all the lines [34]. However, it is difficult to solve the voltage problem according to the change of the load and PV using the constant tap position. As a result, additional facilities are required to solve the over-voltage problem caused by the penetration rate of the PV.

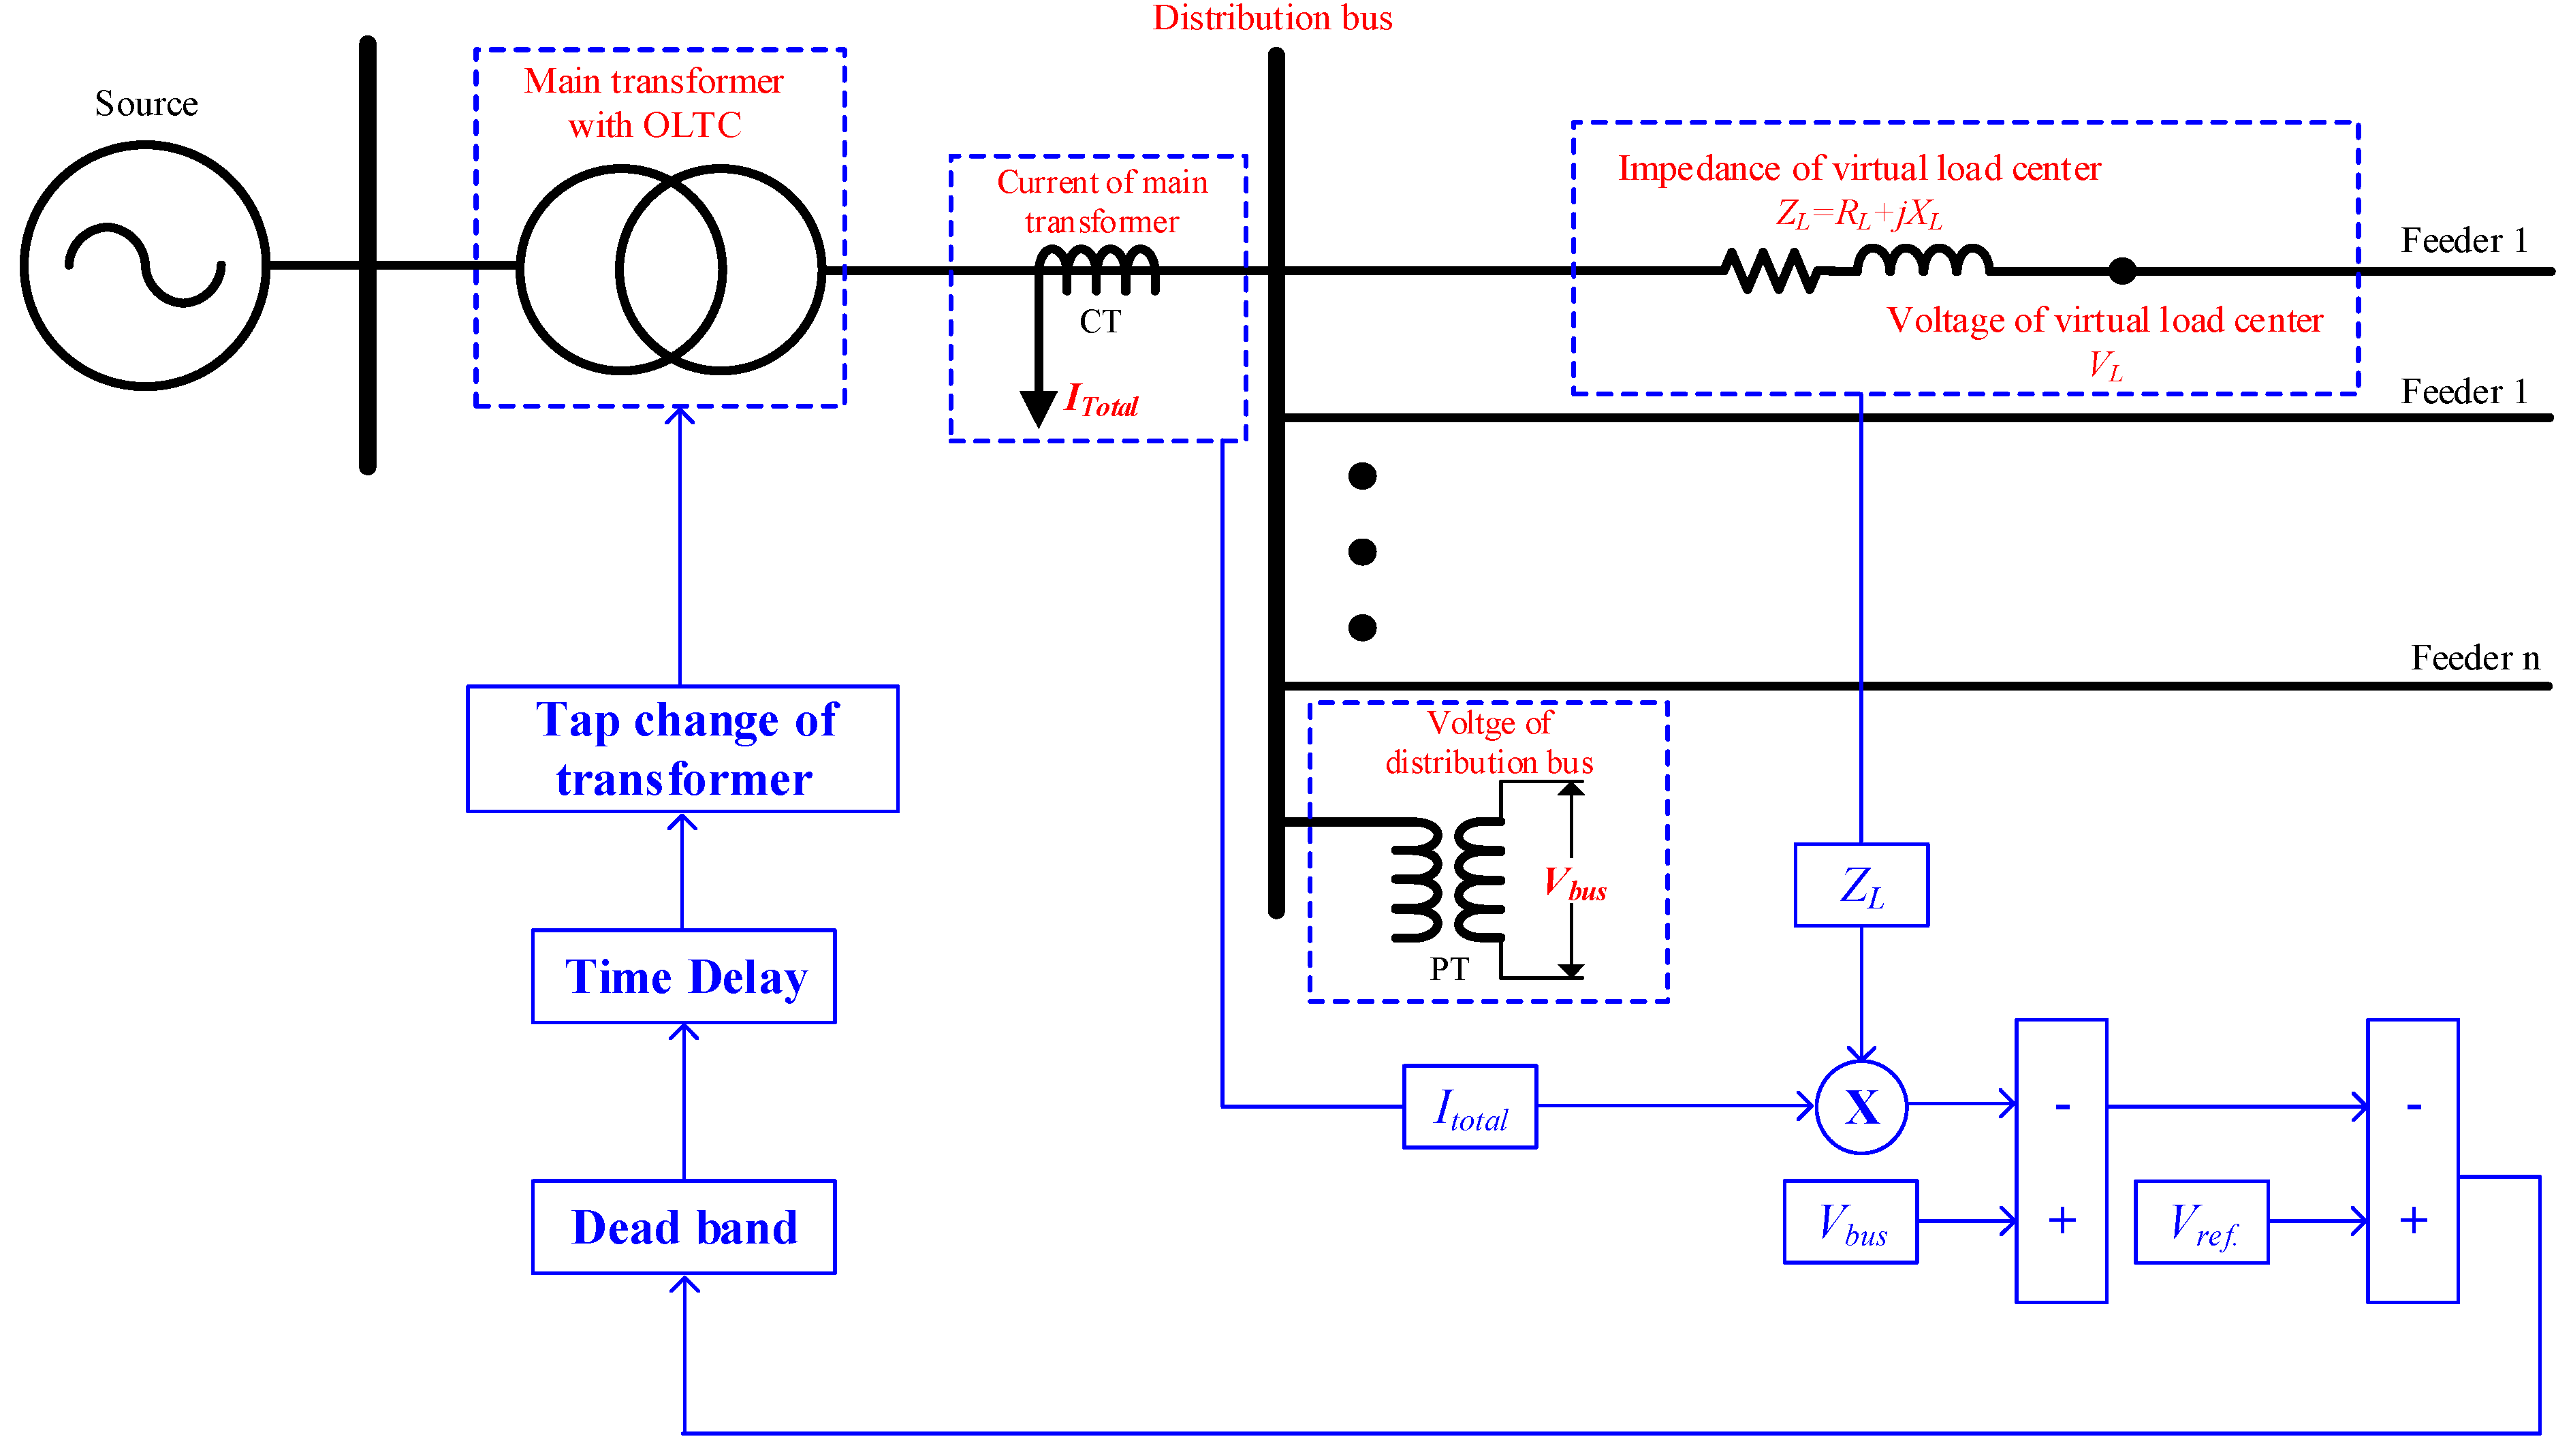
2.2. Line-Drop Conpensation Method

The LDC method is an OLTC operation method for solving the low-voltage problem caused by the load in traditional distribution systems [26,27]. In case the voltage measuring equipment is located only in the distribution bus, the method infers the line voltage for compensation of the voltage drop. Figure 1 demonstrates the mechanism of the LDC method. The LDC method controls the voltage using measured values, using a current transformer (CT) and a potential transformer (PT). The current measured in CT ( I t o t a l ) is divided by the number of feeders and then multiplied with the impedance of the virtual load center. Subsequently, the voltage of the load center ( V L ) is calculated using the difference of the voltage of distribution bus ( V b u s ). The OLTC adjusts the tap such that the load center voltage becomes the same as the reference voltage ( V r e f . ). Further, it uses a dead band and time delay to prevent sudden voltage fluctuations due to tap control. However, it is difficult for LDC to respond to the influence of PV, as it considers only the influence of the load. As the connected capacity of the PV increases, the value of I t o t a l decreases, and a reduction in the load can be observed. As a result, the tap position is lowered, and low-voltage may occur in the line where only the load is connected. To solve this problem, a method of determining V L by installing the voltage measuring equipment in a specific section of each line was proposed. In addition, if the direction of I t o t a l is reversed owing to the PV output, the OLTC does not operate properly. Simultaneously, to suppress the ripple force caused by the tap adjustment, the OLTC sets the tap position to neutral [34]. In this case, the tap position is lowered, which may cause a low-voltage in the load line as aforementioned.

2.3. Digital Volt Meter Method

As shown in Figure 2, a digital volt meter (DVM) can be used to control the tap so that the voltage measured in PT becomes the same as the preset reference voltage [28,29,30,35]. Unlike an LDC, the voltage can be measured directly form the load center, making the line voltage more stable. However, the DVM is primarily used for voltage control in a single feeder, and an algorithm that can set a reference point is required for use in a multiple-feeder. In addition, in [30], a method to minimize voltage deviation using VDM in multiple-feeder is presented. However, it becomes the same as the result of using countercurrent for the LDC used by the average value.

2.4. Forecasting Method

It is a method of forecasting the load and PV output and presetting the tap position for each time period to solve the voltage problem [35,36,37]. Unlike LDC which operates automatically, the forecasting method operates with a set value through the DSO. Consequently, this method is significantly affected by the accuracy of the forecasting. However, the behind-the-meter PV and a sudden change of load increases the error, which may cause voltage problems. Therefore, continuous monitoring is required for real-time control, and an increased number of voltage stabilization facilities that can respond may be needed.

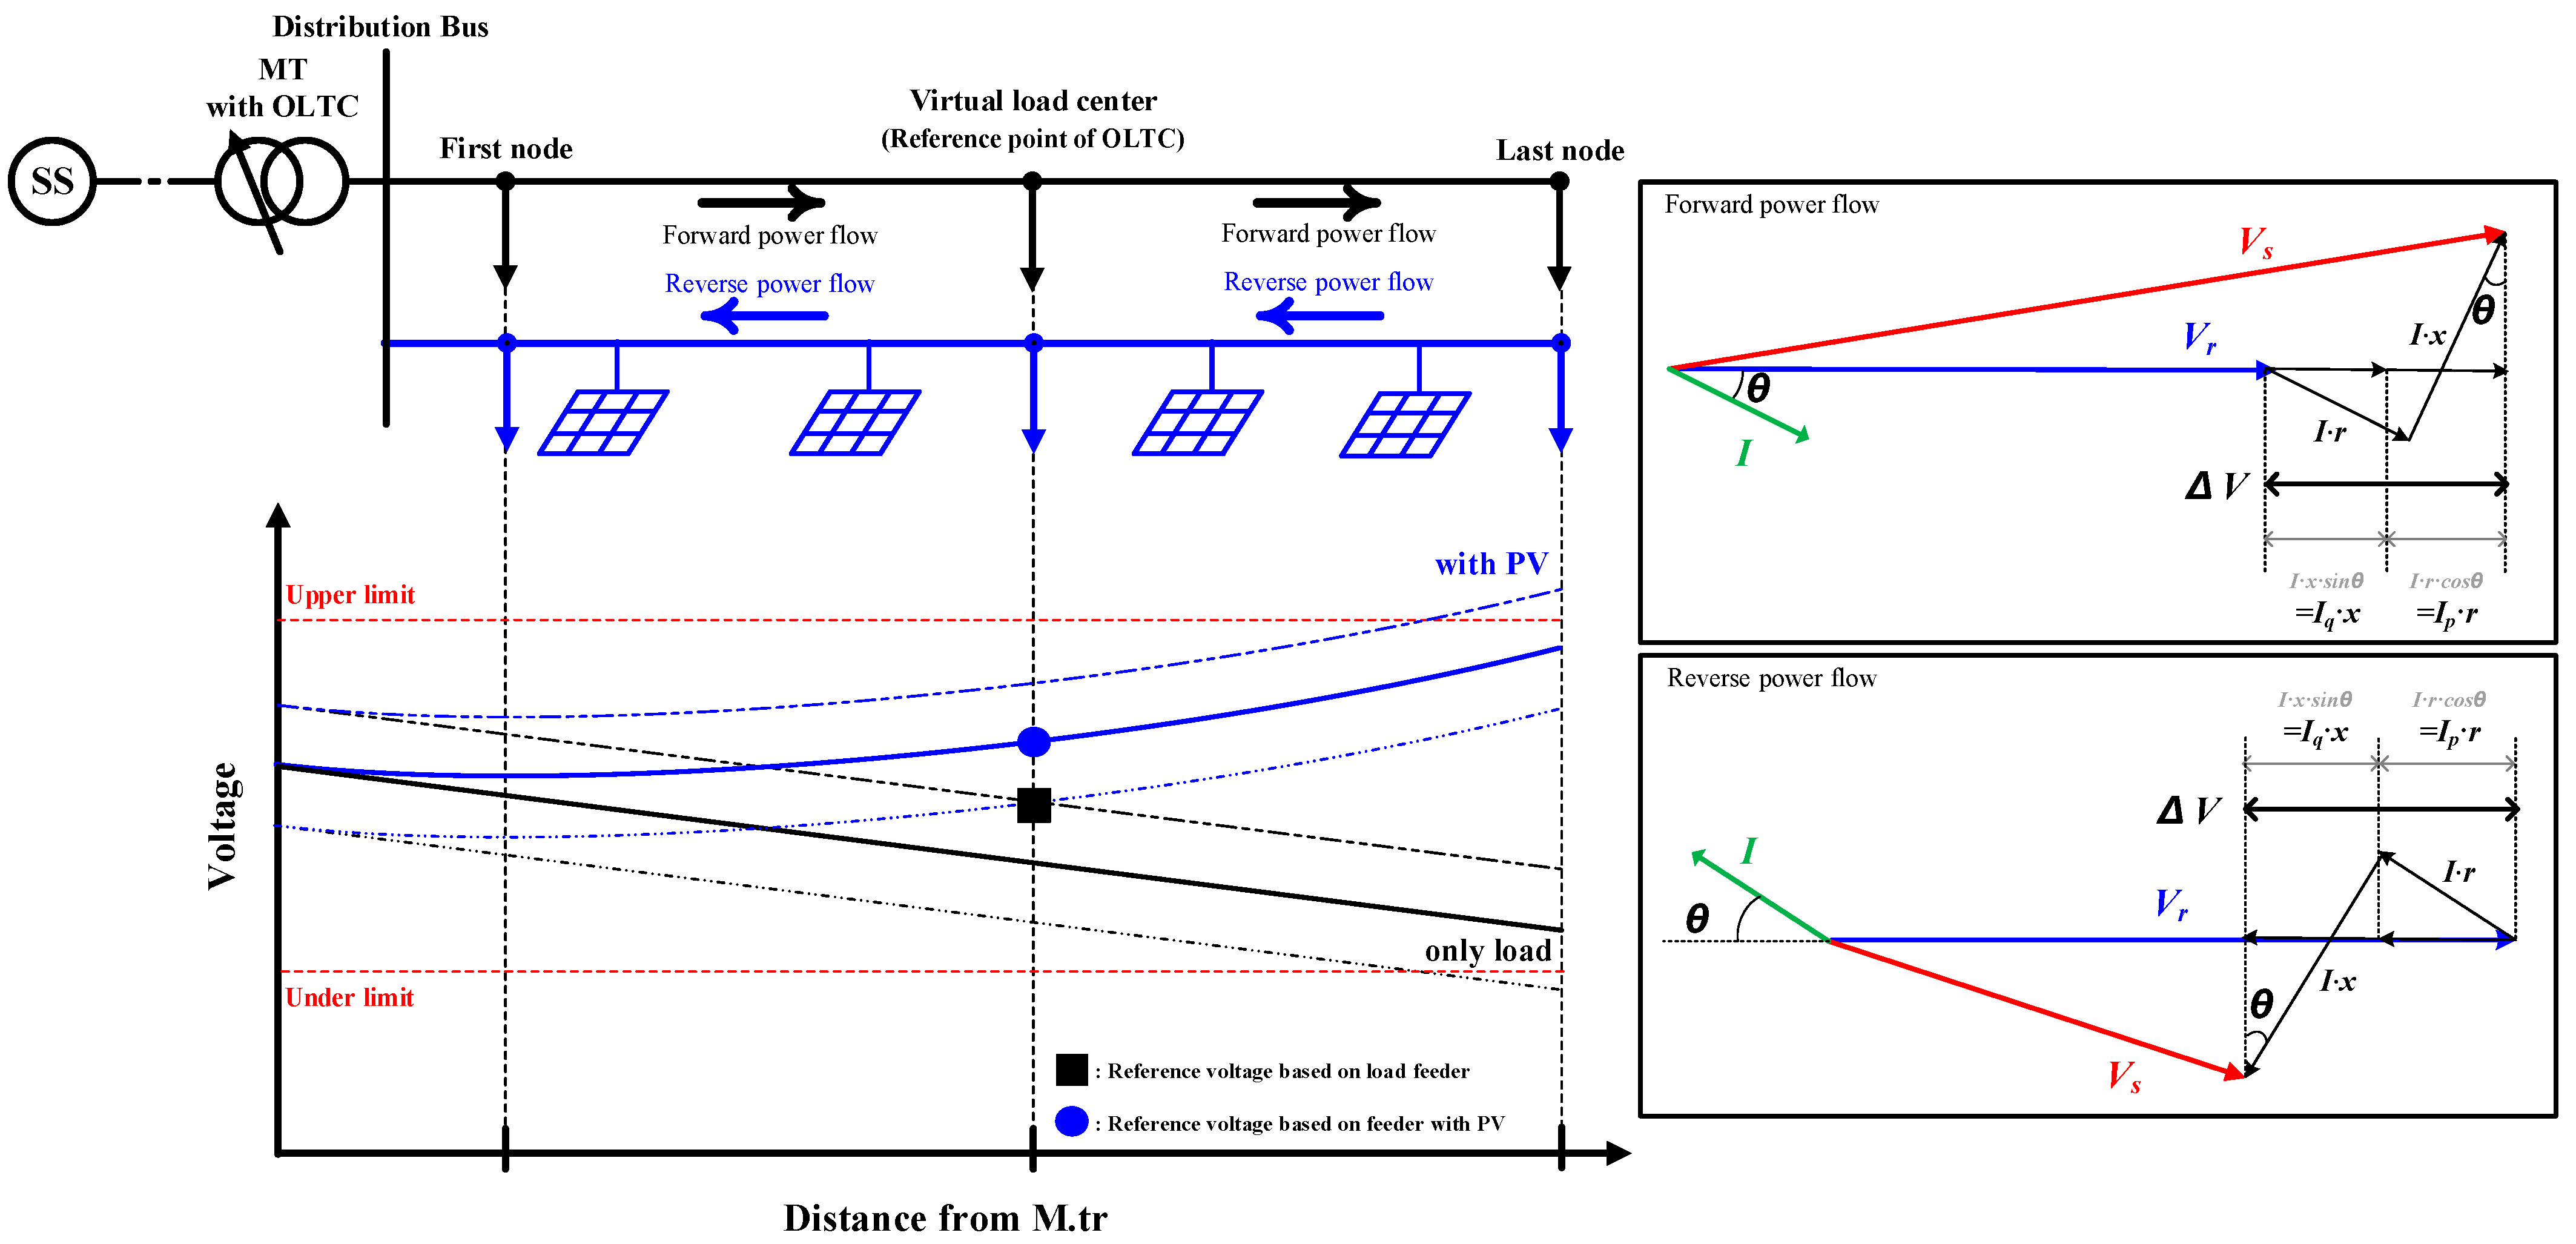
3. Proposed Solution to Solve Voltage Problem Caused by Reverse Power Flow

Recently, with the aim of controlling PV systems, PV companies have been sharing real-time information with the DSOs, making it possible to measure the voltage of the PV connection point. Therefore, this study proposed an improved OLTC operation method to solve the voltage problem under the condition that voltage measurement for each section of the line is possible.

3.1. Setting the Reference Point and Reference Voltage for OLTC Operation

The OLTC operates frequently to set the voltage at a selected reference point. To solve the voltage problem of all feeders, it is important to properly set the reference point and voltage. Figure 3 shows the voltage based on the distance from the substation when the reference point and voltage are changed. V s is the distribution bus voltage, V r is the node voltage, and r and x are the node impedances. The forward current flows in the line with only the load even when a reverse current flows on the MT. Consequently, the voltage drops from the first to the last node. For the PV, the voltage increases as the voltage advances towards the last node due to the reverse flow. When the OLTC operates based on the load line, it is necessary to prevent the low-voltage problem of the last node due to the line and load impedances. Simultaneously, the PV line is not considered, and an over-voltage appears at the last node due to the reverse power flow. Conversely, if the same reference voltage is operated based on the PV line, a low-voltage problem occurs in the load line due to the lowered voltage. Therefore, to solve the voltage problem depending on the direction of the current, it is necessary to reset the reference voltage and point.
As listed in Table 1, Korea Electric Power Corporation (KEPCO) operates in the normal voltage range 0.909–1.039 p.u. [26]. Equation (1) is a method for setting a reference voltage for the OLTC operation. In the forward power flow, the reference voltage decreases gradually to the last node to solve the low-voltage problem. Conversely, in the reverse power flow, it increases gradually. Therefore, it is possible to set the reference voltage considering the voltage characteristics shown in Figure 3.
V i . k . r e f . = V u n d e r l i m i t + V n o m . × α i × 1 r i . k r i . t o t a l , i f f o r w a r d p o w e r f l o w V u p p e r l i m i t V n o m . × α i × 1 r i . k r i . t o t a l , i f r e v e r s e p o w e r f l o w
  • i : Feeder number
  • k : Node number
  • V i . k . r e f . : Reference voltage at the k-node on the ith-feeder
  • V n o m . : Nominal voltage
  • V u p p e r   l i m i t : Upper limit of normal voltage
  • V u n d e r   l i m i t : Under limit of normal voltage
  • α i : Voltage fluctuation rate of the first and last nodes
  • r i . t o t a l : Total length of ith-feeder
  • r i . k : Length from the MT to the kth-node on the ith-feeder
To solve the voltage problem of all lines connected to the MT, it is important to properly set the reference point of the OLTC because over-voltage or under-voltage may occur on some lines. Equation (2) shows the difference between the reference and measured voltages at the kth-node on the ith-feeder. In the forward power flow, the OLTC operates based on the feeder containing the node with the smallest V, and the low-voltage problem can be effectively solved. Conversely, in the reverse power flow, the over-voltage problem can be solved if the line containing the node with the largest V is referenced. In general, the last node is selected owing to the influence of the load and PV. The voltage at the first node may fluctuate significantly when the OLTC operates at the last node. Therefore, to minimize voltage fluctuations, the OLTC should operate at a point in the middle of the line in a similar manner to that of the LDC method.
Δ V i . k = V i . k . r e f . V i . k
  • Δ V i . k : Difference between the reference and measured voltages at the kth-node on the ith-feeder
  • V i . k : Measured voltage at the kth-node on the ith-feeder

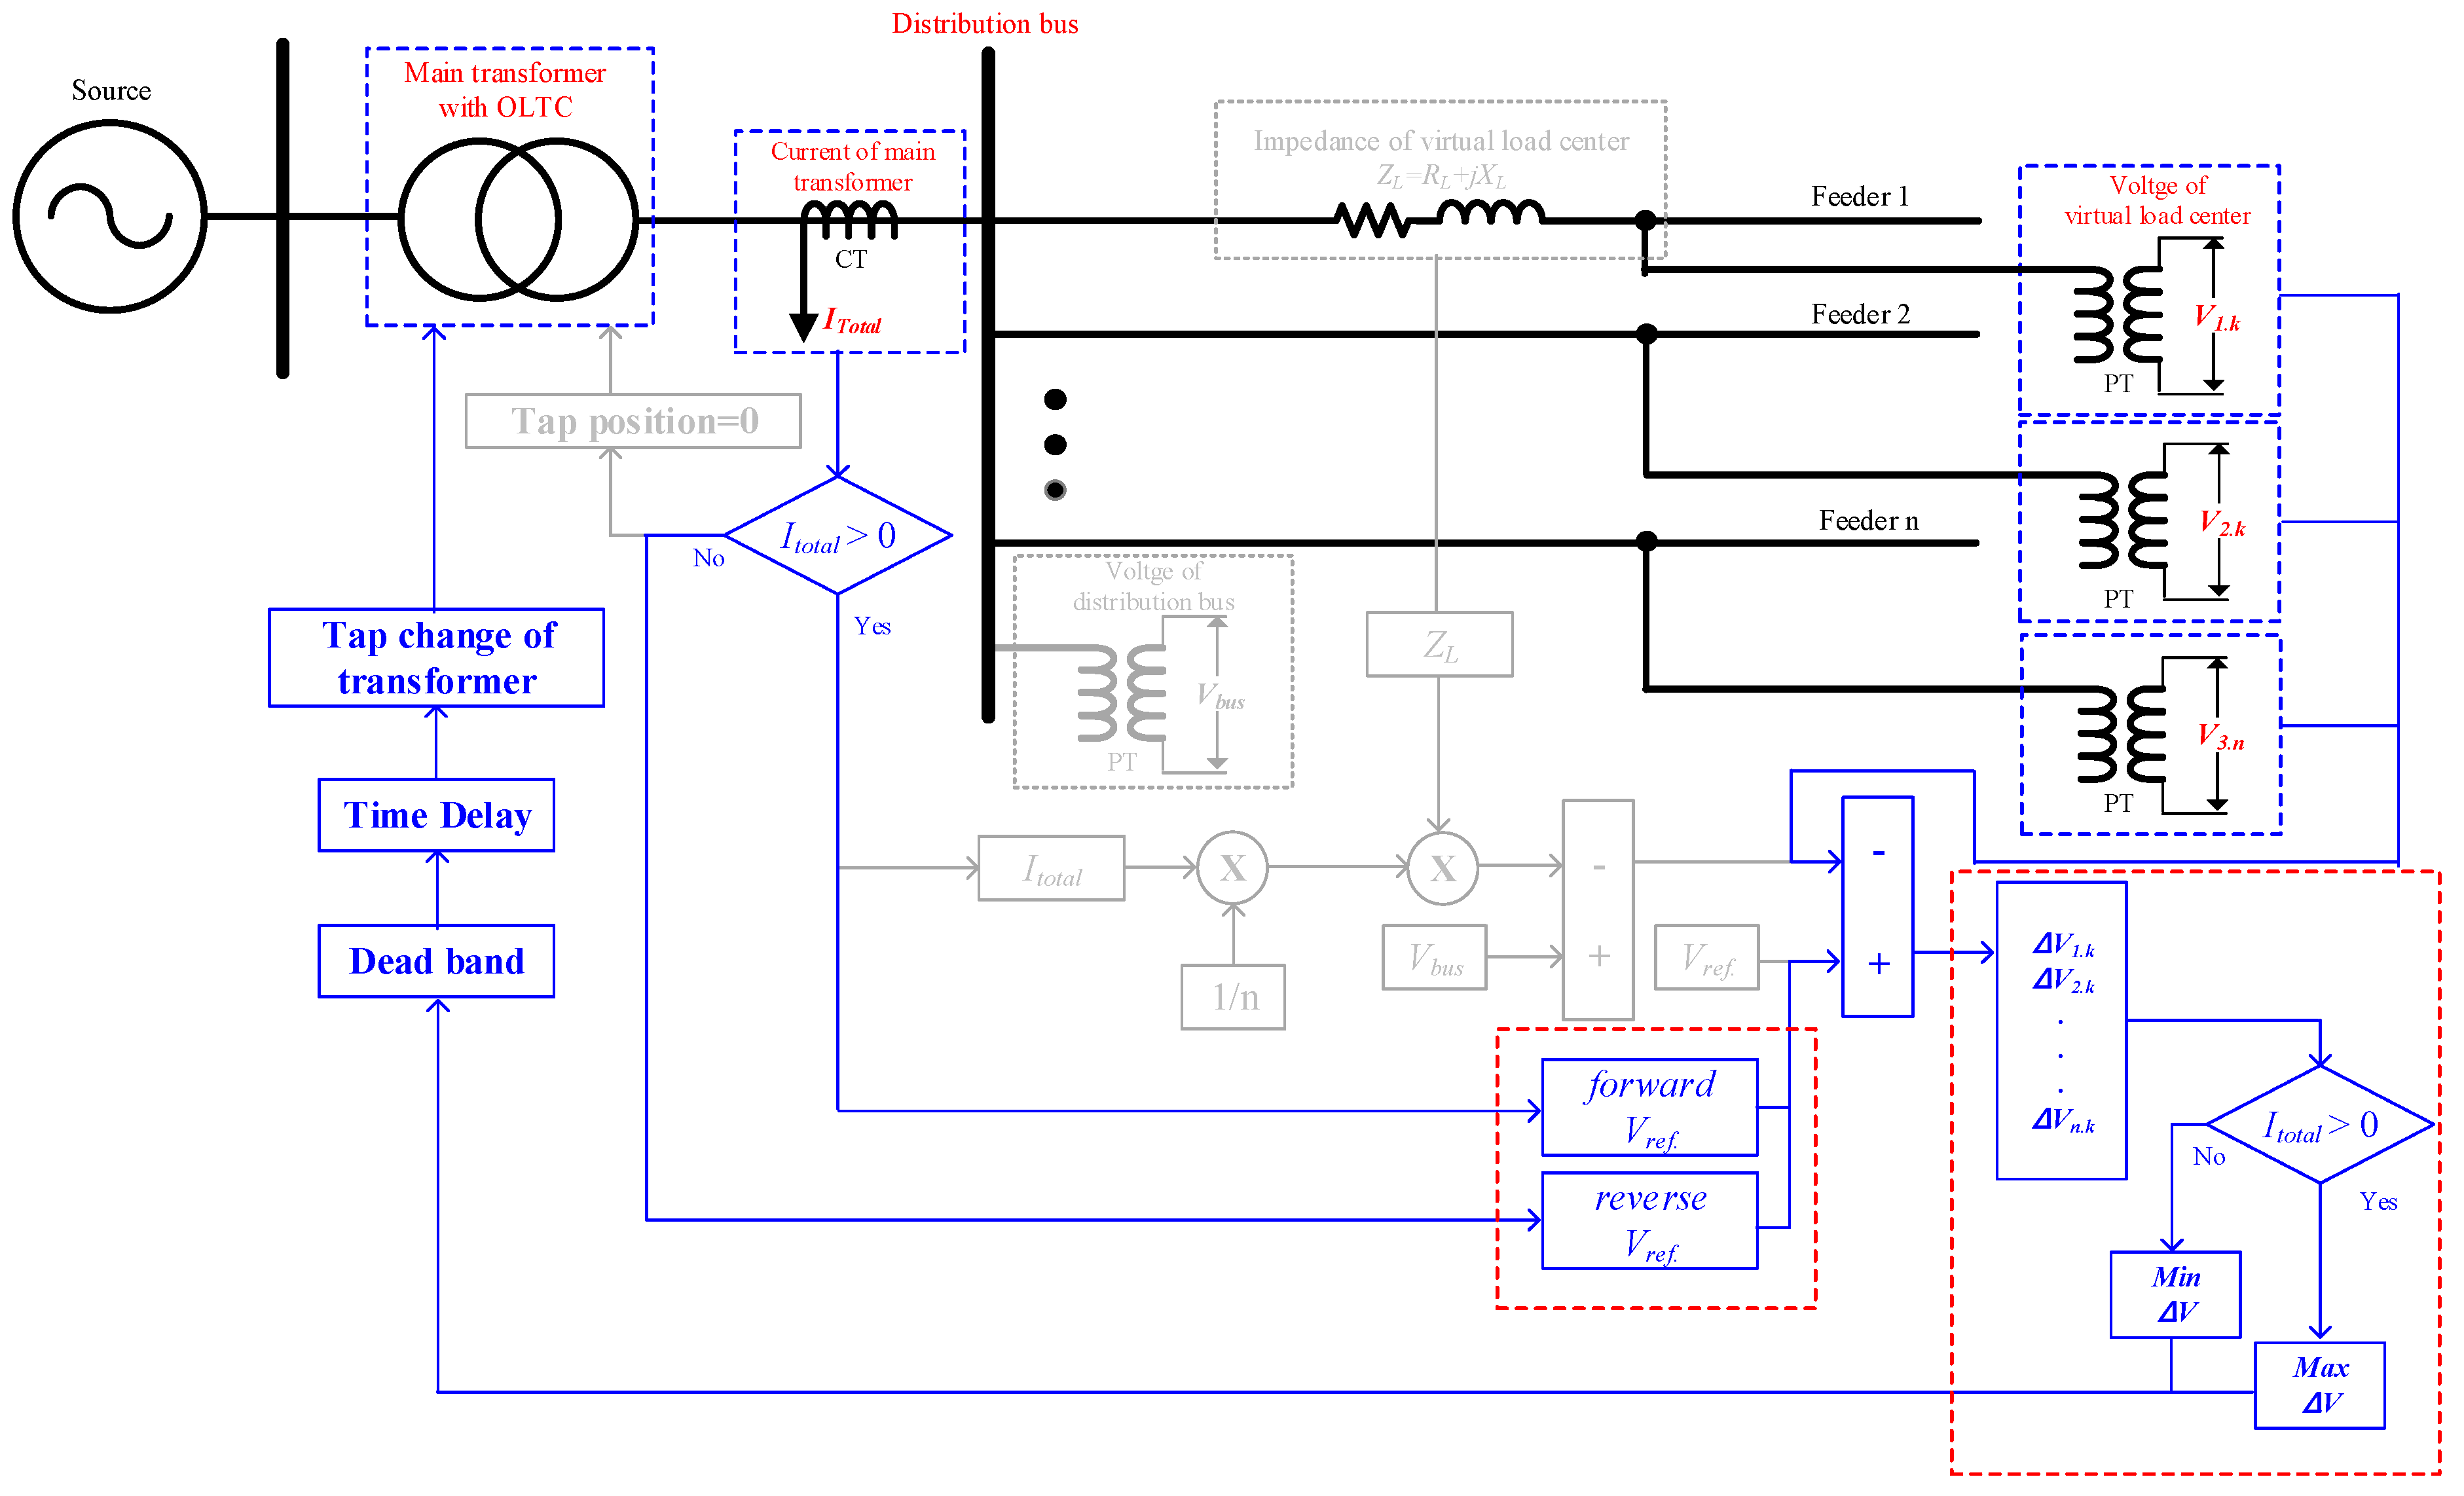
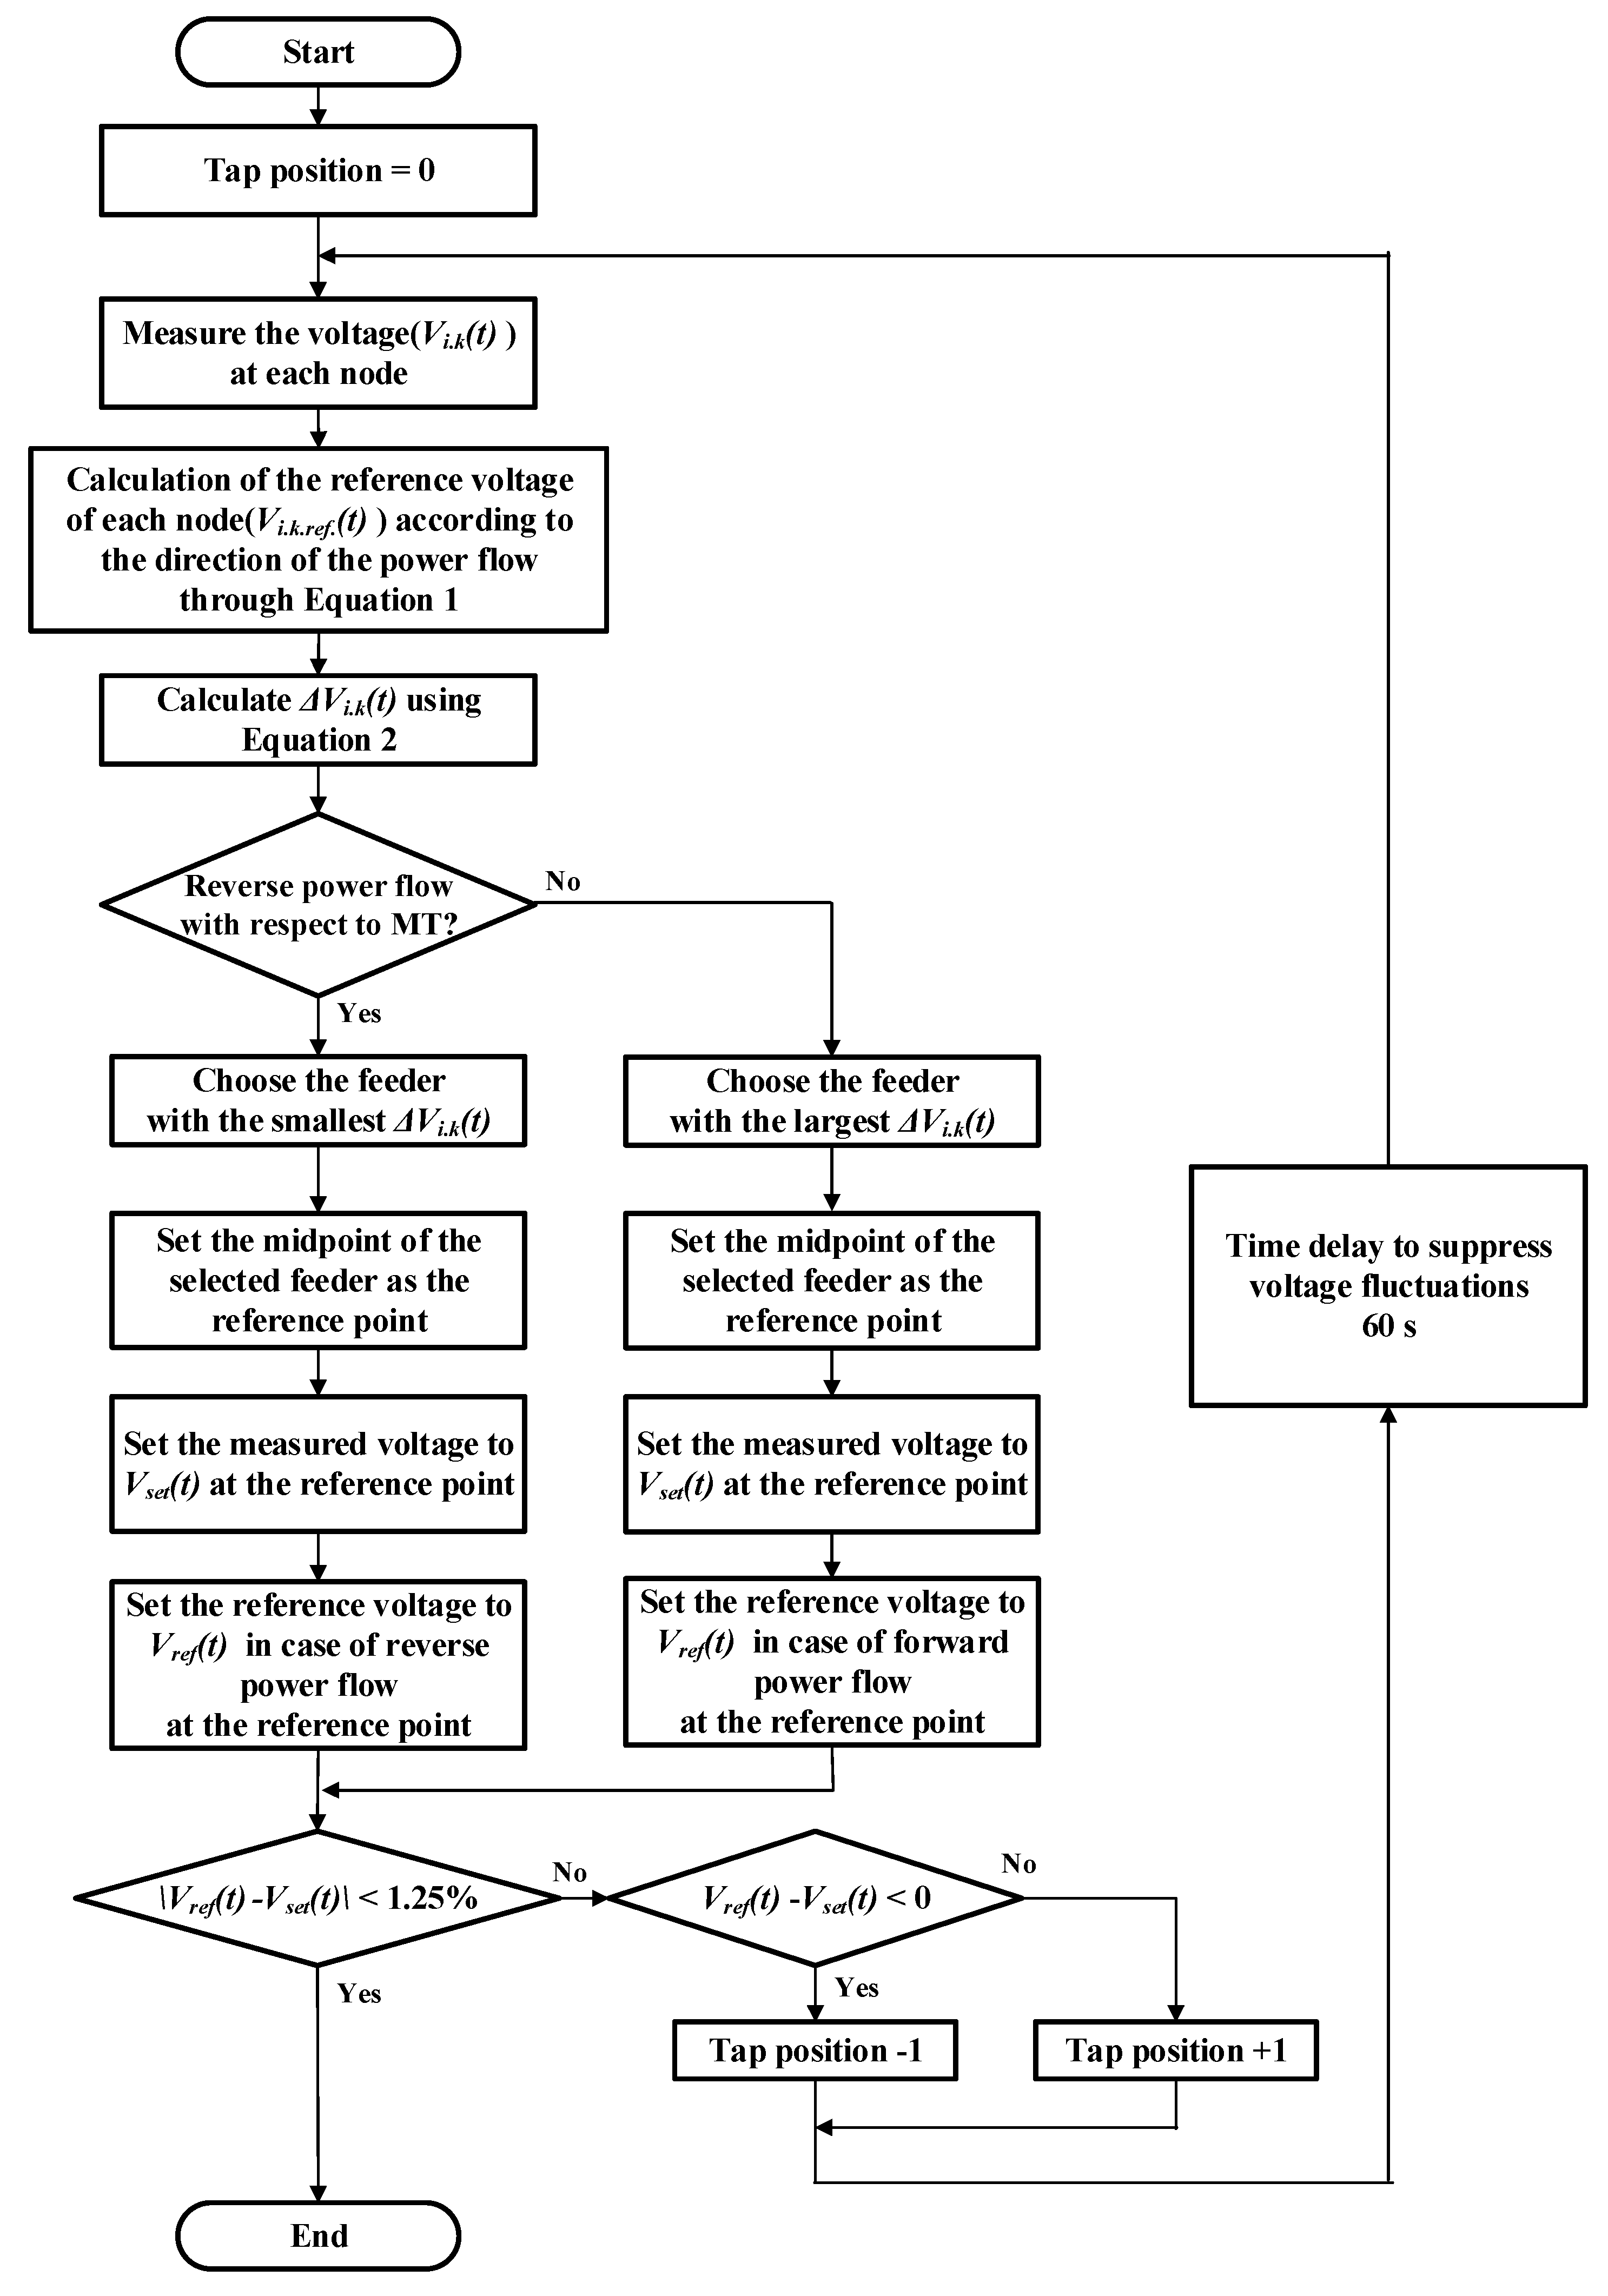
3.2. Proposed OLTC Operation Algorithm

Figure 4 shows the proposed method to solve the problems of LDC and DVM. It can solve the problem of using the neutral tap of the LDC method and the problem of selecting the reference point of the DVM method. The proposed method sets the reference voltage to solve the over-voltage problem in the reverse flow through Equation (1). In addition, the reference point selects the line with the largest voltage according to the result of Equation (2). In a forward flow, the line with the lowest voltage is selected to solve the low-voltage problem.
Figure 5 shows the flowchart of the method proposed to solve the voltage problem even in the reverse power flow. Using Equation (1), the different reference voltages are applied depending on the direction of the power flow at the node. Subsequently, the difference between the reference and measured voltages is calculated using Equation (2), and the line for OLTC operation is selected based on the direction of the power flow in the MT.
Based on the MT, the line with the largest and smallest Δ V are selected for the forward and reverse power flow, respectively. Similar to the LDC, the OLTC operates based on a virtual load center of the selected line. The tap position descends if the measured voltage is higher than that of the reference voltage; otherwise, it ascends. To suppress voltage fluctuations, the tap is changed by one step every 60 s; previous steps are repeated until the reference voltage is the same as that before the measurement. The tap position is zero at the nominal voltage; the voltage increases and decreases at the positive and negative positions, respectively. In conclusion, the positive position is applied to prevent low-voltage in the forward section, and the negative position is applied to prevent over-voltage in the reverse section.

4. Simulations to Establish the Effects of the Proposed Method

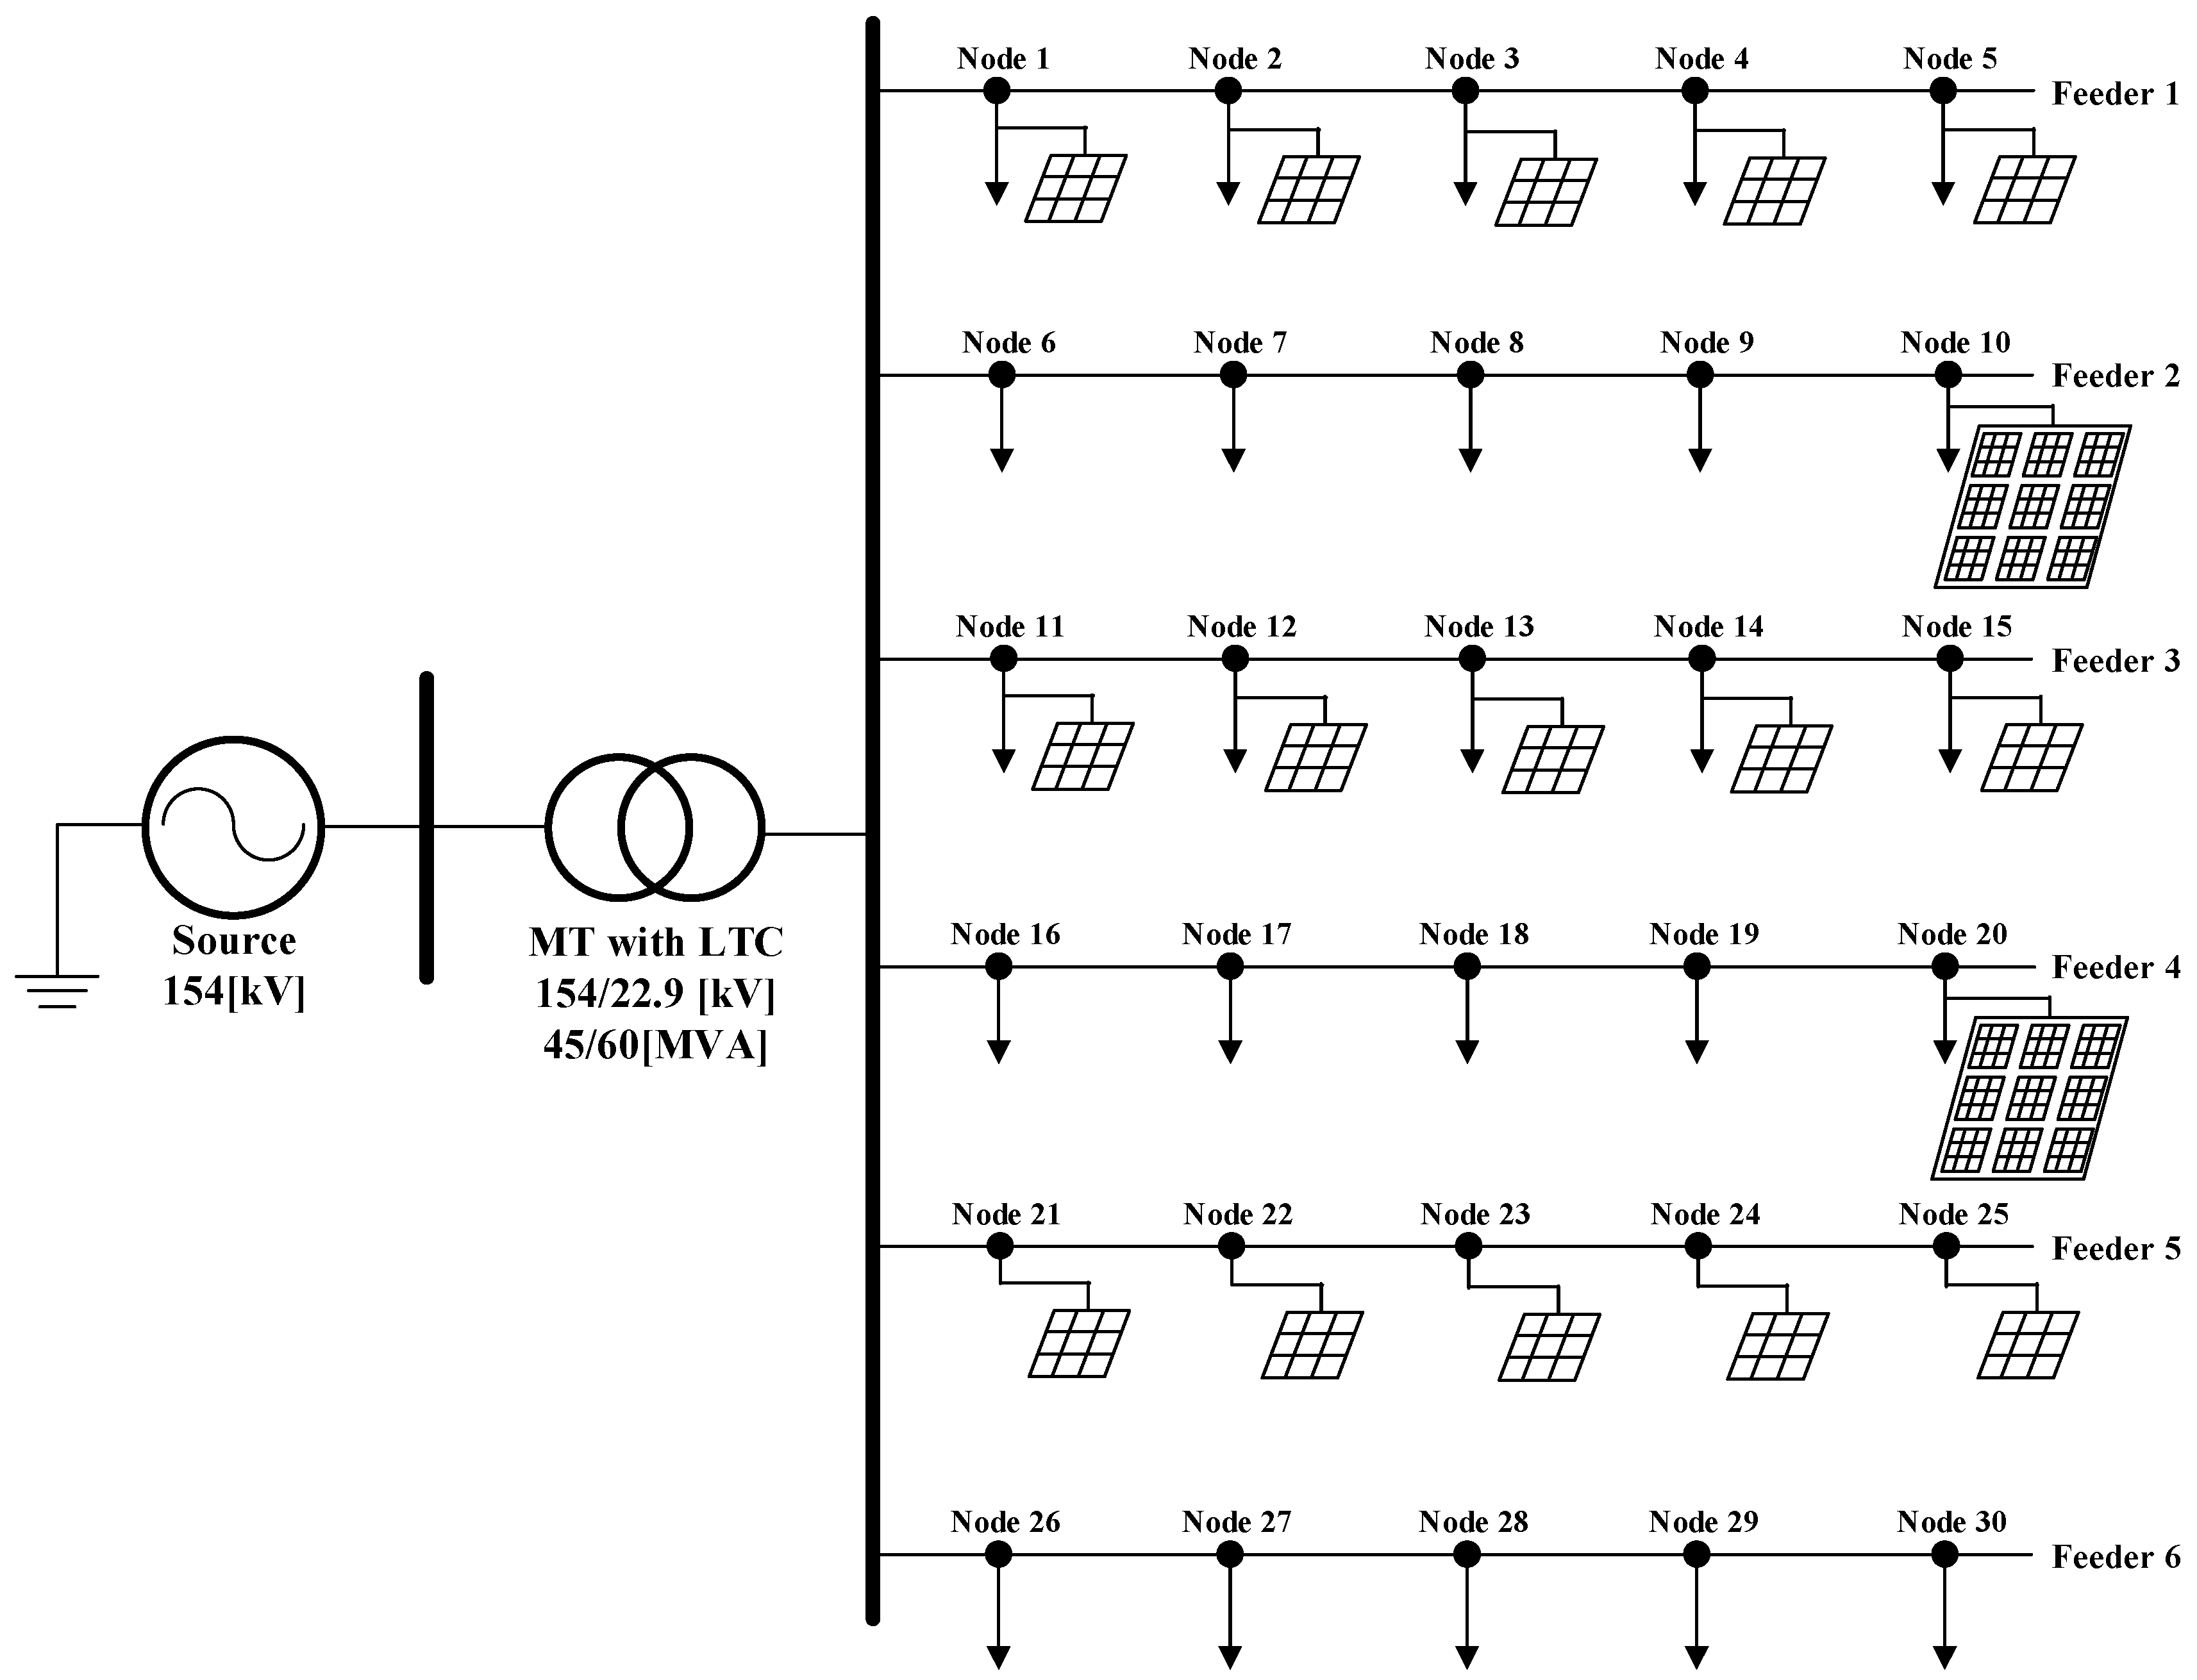
4.1. Distribution System Modeling with OLTC

As shown in Figure 6 and Table 2, a test model was constructed to verify the proposed method. The effect of the suggested algorithm was analyzed in various features by connecting six feeders to the MT. Reverse power flow should occur owing to the PV output because the proposed algorithm operates the OLTC based on the direction of the power flow. Therefore, considering the maximum static thermal capacity of the line, the PV capacity per feeder was set to 14 MWp, as listed in Table 2. The effect of the load was set to light (3 MW) and heavy (7 MW) loads. The influence based on the PV location was set to be equally connected and concentrated to the last node. In addition, a solar-only and load-only feeder were added. The simulation was analyzed for one day, and the load and PV were operated in the pattern shown in Figure 7.

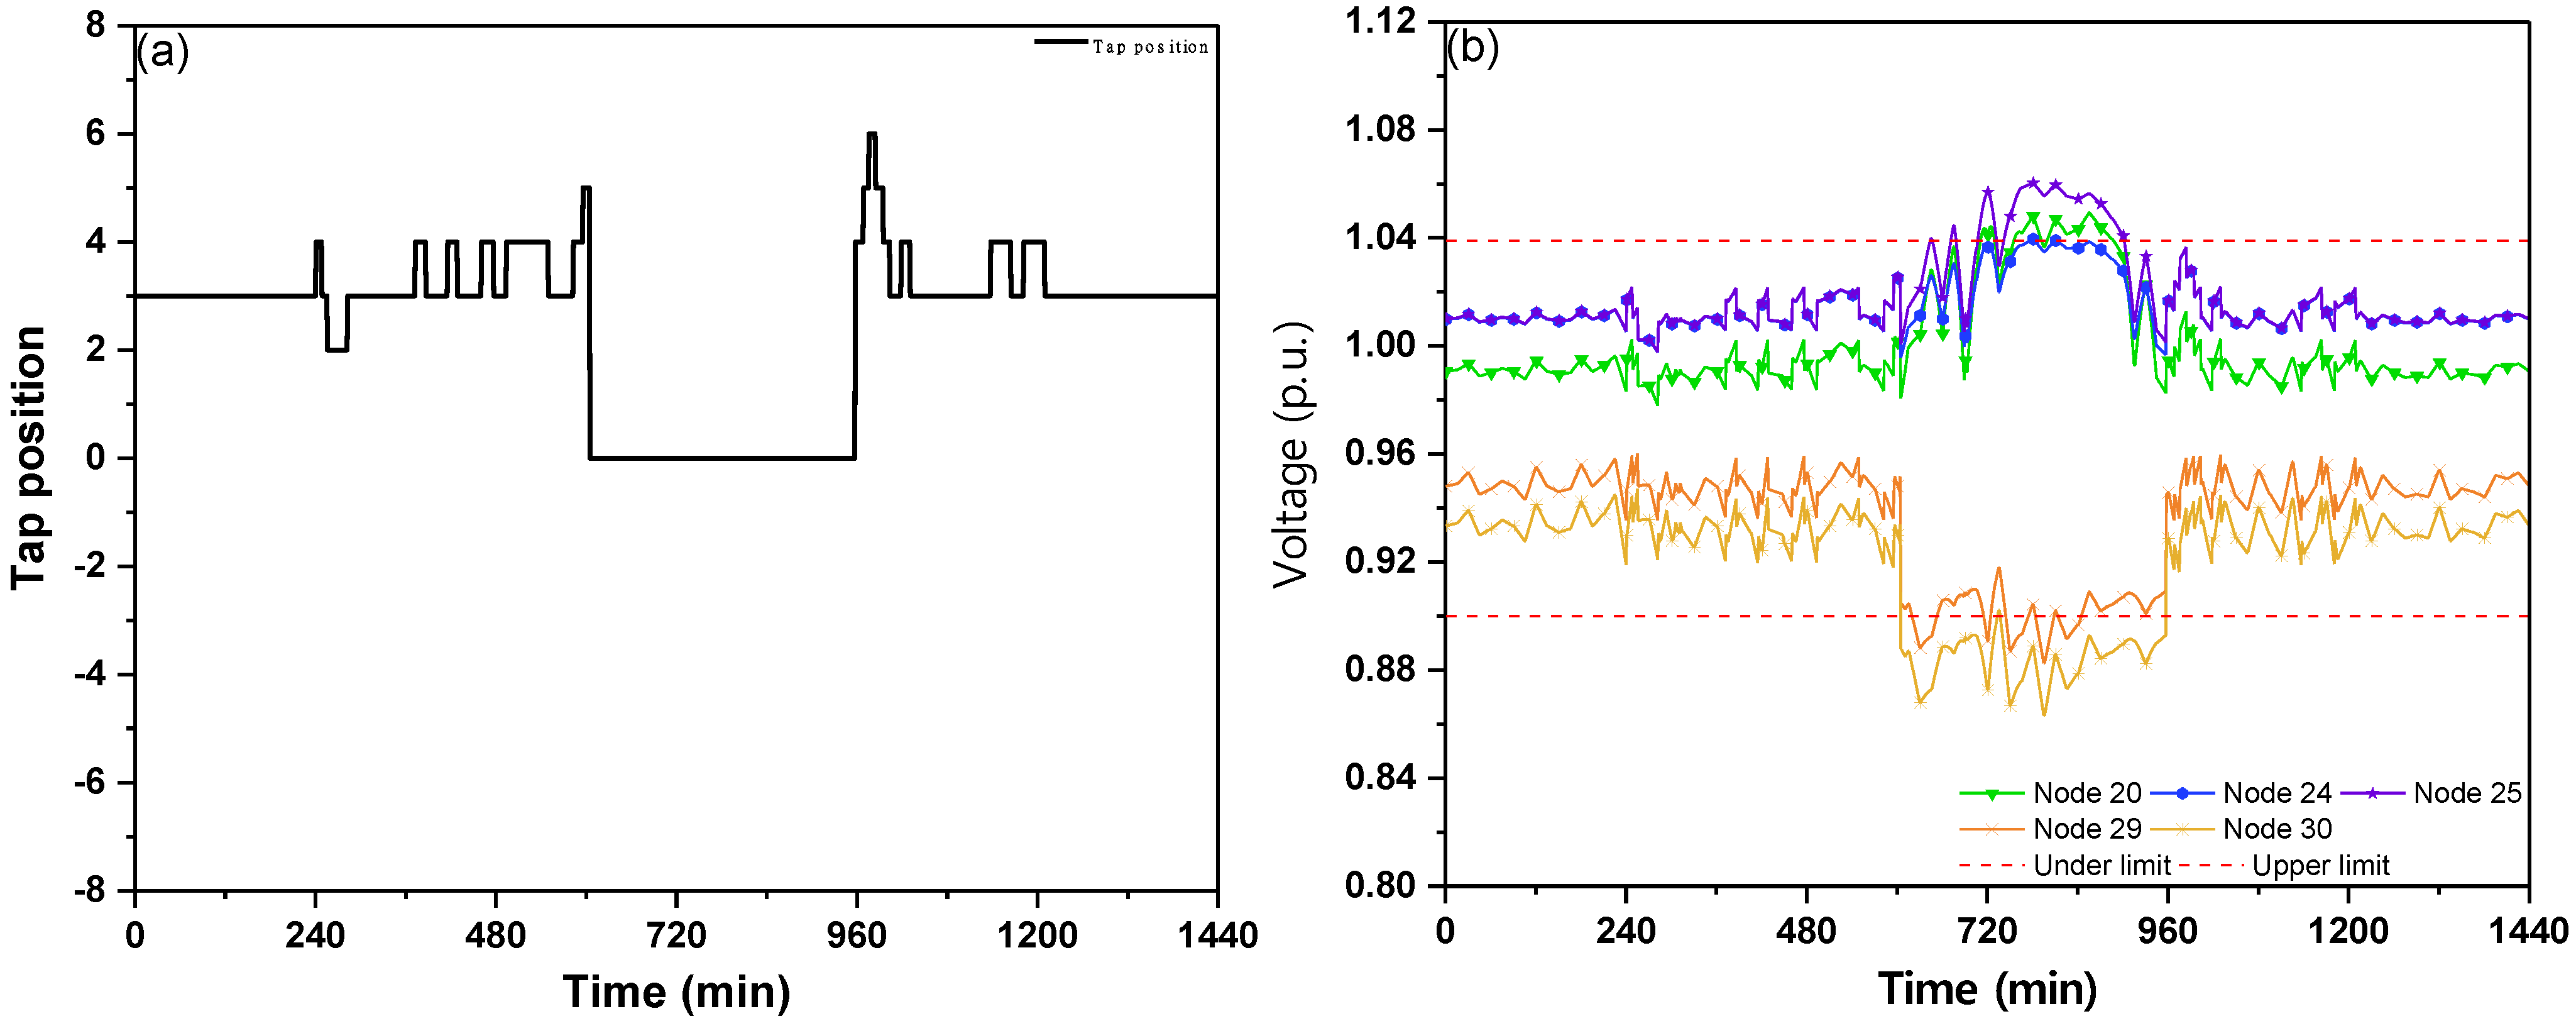
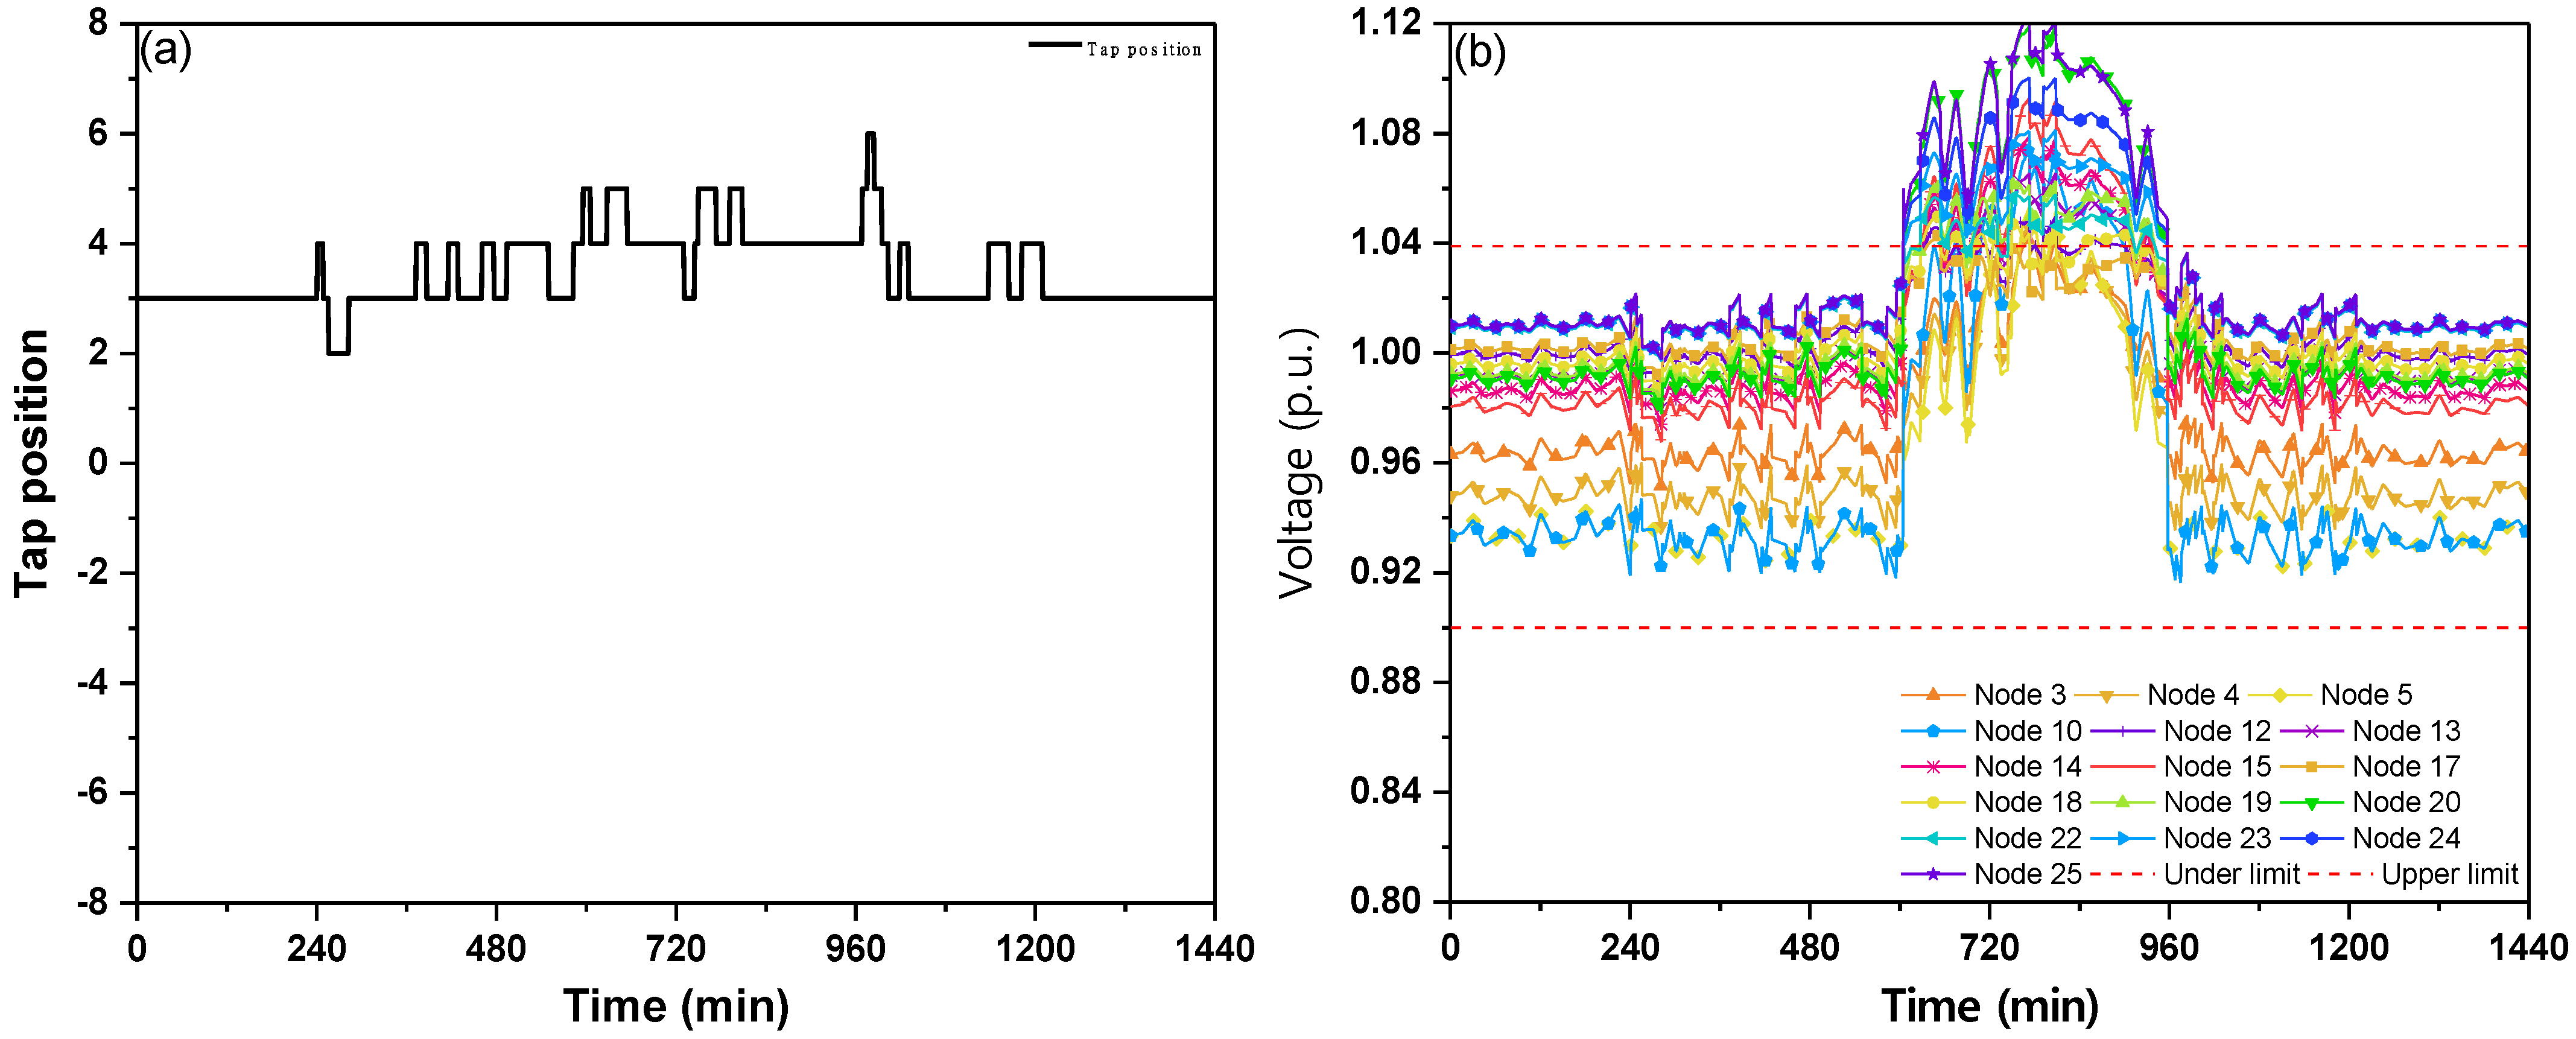
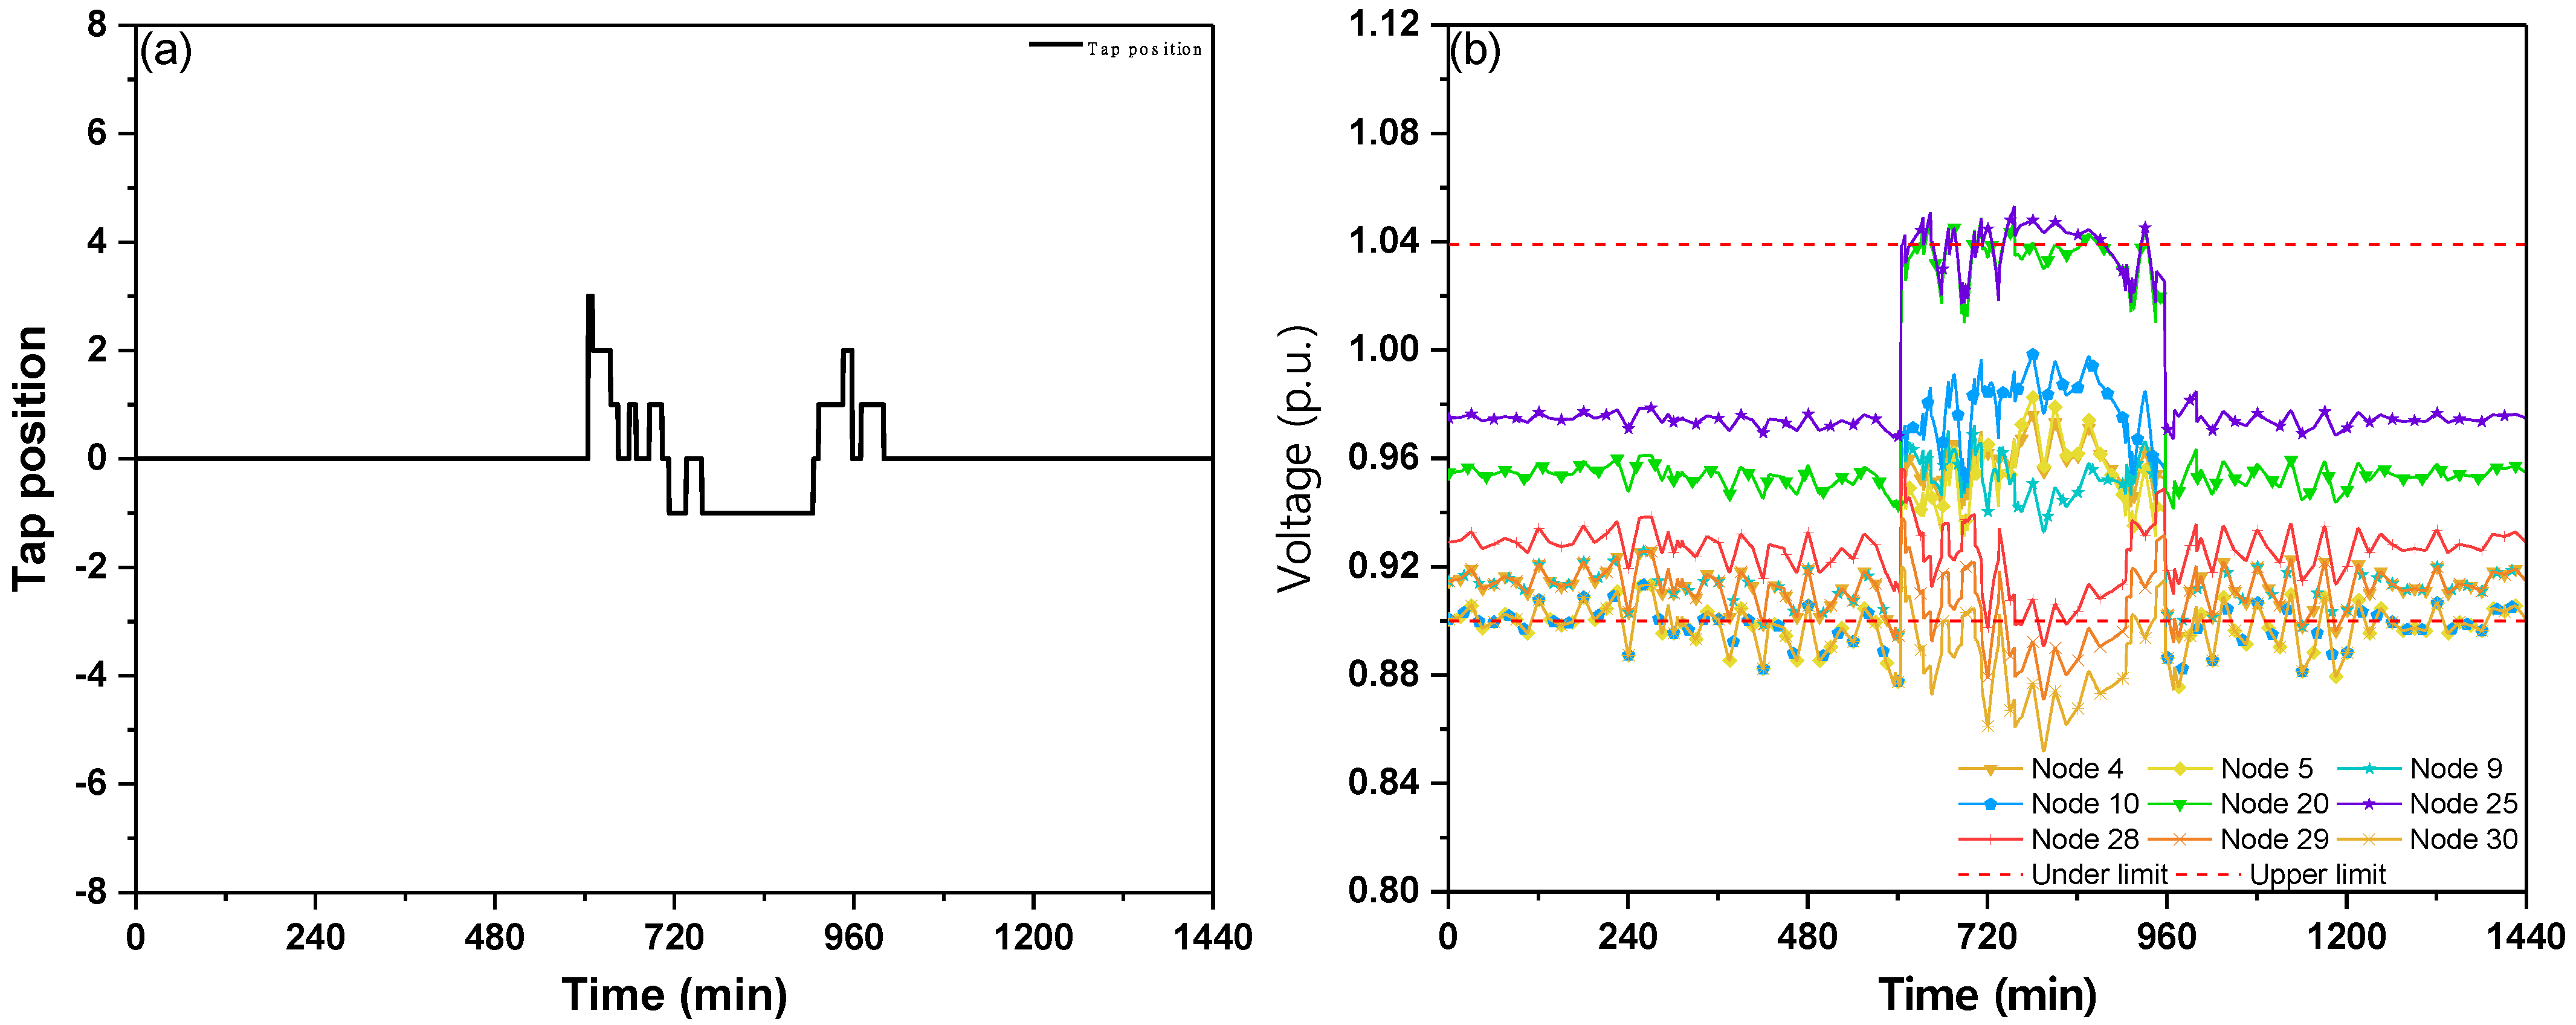
4.2. Case Studies to Verify the Proposed Method

As listed in Table 3, cases were constructed to analyze the voltage problem depending on the OLTC operation method. Case 1 represents a method that applies the traditional LDC method. The OLTC was operated based on the feeder with the largest load, and it is set to use a neutral tap (tap position = 0) when reverse power flow occurs. In the neutral tap, the secondary voltage of the MT is 1.0 p.u. Cases 2–5 represent the problem when the reference point was not selected in the proposed method. In these cases, the problem was analyzed when the reference voltage was reset in the reverse power flow without setting the reference point. Finally, Case 6 represents the proposed method, in which the reference point and voltage are reset.
Figure 8 shows the (a) tap position and (b) voltage of the feeders for Case 1. In the forward power flow, the OLTC operates as a feeder with the largest voltage drop due to the load and line impedance; it operates as a positive tap position to compensate for the voltage. When reverse power flow occurs owing to the PV, the OLTC is operated as a neutral tap, which causes a voltage problem. In the case of feeders connected to the PV, Feeders 1–2 do not have an over-voltage problem owing to a voltage drop due to heavy load; however, in Feeders 4–5, an over-voltage occurs at the end of the line owing to a light load. In addition, in Feeder 6, which is only connected to the load, the voltage drop cannot be compensated owing to the neutral tap; therefore, a low-voltage problem occurs from the middle to the last line.
Figure 9 shows the simulation results of Case 2. Unlike Case 1, the reference voltage is reset based on the direction of the power flow, but the reference point is fixed in the middle node of Feeder 5. The tap position on the forward power flow was set lower than that of Case 1 because the voltage drop in Feeder 5 occurs only with the line impedance. As a result, Feeders 1, 2, and 6 connected to heavy loads generated low-voltages. In addition, in the reverse power flow situation, as the reference voltage increases, the tap position increases in some periods; but as the PV output increases, the tap position decreases to suppress the voltage increase. Owing to this, it is possible to prevent the over-voltage of the PV-connected line; however, the low-voltage of Feeder 6 is larger.
Figure 10 shows the simulation results of Case 3. Because Case 3 only operates with the load line (Feeder 6), only the voltage of the Feeder 6 is compensated even if a reverse power flow occurs. Therefore, the positive tap position is maintained even in the reverse power flow situation. This can solve the low-voltage problem of all lines in the forward power flow; however, over-voltage occurs in the PV-connected line in the reverse power flow situation.
Figure 11 and Figure 12 show the simulation results of Cases 4 and 5. Because Case 4 has the same load capacity as that of Case 3, the tap position in the forward power flow remains the same. When the reverse power flow occurs due to the PV influence, the reference voltage is changed, and the tap position is lowered accordingly. In addition, the PV influence is reduced owing to the heavy load; therefore, it is set to a tap position higher than that of Case 2. As a result, over-voltage occurs in the light load lines (Feeders 3 and 4) in the reverse power flow, and low-voltage occurs in the load line (Feeder 6) in the forward power flow.
In Case 5, the voltage drop is small because the light load and tap position do not change owing to the dead band. In the reverse power flow, the tap position is increased with the increase in the reference voltage; however, in some sections where the PV output is at maximum, the negative tap position appears. As a result, a low-voltage problem occurs in the heavy load (Feeders 1, 2, and 5) during forward power flow, and over-voltage occurs in the line with large PV influence (Feeders 4, 5).
Based on the results, setting the reference voltage and point is required to solve the voltage problem. Figure 13 shows the voltage of the PV-connected line (Feeders 1–5) based on the proposed method (Case 6). In the forward power flow, the OLTC was operated based on the heavy load line with the largest voltage difference to solve the low-voltage problem. In the reverse power flow, the OLTC was operated as a PV-only connected line to solve the over-voltage problem. However, due to the delay time of OLTC, an over-voltage occurs in Feeder 5, which is only connected to PVs.
Table 4 lists the case analysis results. When the OLTC is operated as a heavy load line, the low-voltage problem is solved, but the over-voltage problem worsens. Conversely, when it is operated as a PV line, a low-voltage problem occurs. The proposed method is a suitable combination of the two methods depending on the direction of the power flow, thereby solving the voltage problem most effectively. However, the low-voltage problem in Feeder 6 remained unresolved when a negative tap was applied in the reverse power flow.

4.3. Analysis of the Required Compensation Facilities

To verify the economical effectiveness of the proposed method, the cost of required compensation equipment to solve the voltage problems was calculated. The necessary compensation equipment is assumed to be a smart inverter and SVR. The smart inverter is considered first. It is assumed that SVR is installed when the smart inverter at 100% penetration rate cannot resolve the voltage problems. Figure 14 shows the penetration rate of smart inverters to solve the low-voltage problem in Cases 2 and 5. Smart inverter penetration rates of 63% and 32% are required for Cases 2 and 5, respectively. In addition, because Feeder 6 is not connected to the PV, SVR installation is required in all cases except in Case 3. To solve the over-voltage problem, Figure 15 shows the penetration rate of smart inverters. Over-voltage occurs in Cases 1, 3, 4, and 5, and a high penetration rate of smart inverters is required because the excess of the threshold (upper limit) is greater than the low-voltage. In addition, in Cases 3 and 4, the over-voltage problem remains unresolved even for 100% penetration rate; therefore; SVR installation is required.
Table 5 lists the cost of the additional equipment required to solve the voltage problem. Countries with a high penetration rate of distributed energy resources must install smart inverters to connect PVs. However, smart inverters are more expensive than normal inverters by 150 US$/kW [38]. The cost of installing these smart inverters is a burden on PV operators. Hence, time and policies are needed to achieve the desired penetration rate and solve the voltage problem. Accordingly, the proposed method can solve the voltage problem with a few compensation facilities, providing time for the adoption of smart inverters.

5. Conclusions

Unlike traditional distribution systems, as the penetration rate of PV increases, the existing OLTC operation method cannot solve the voltage problem in the reverse power flow. In particular, when the load feeder without PV and the feeder with a high PV penetration rate are connected to the MT, the voltage deviation between the feeders is large. In this case, since the existing method minimizes the sum of voltage deviations, many compensation facilities are required to solve the voltage problem.
In addition, existing research suggests a method to solve problems such as power loss and number of taps by considering the situation in which voltage problems have been solved with compensation facilities such as smart inverter penetration and traditional OLTC control. However, in countries where policies on PV connections are not established, these compensation facilities may adversely affect PV penetration rates due to the economic burden on the DSOs and PV companies.
In this study, to solve the voltage problem in multi-feeder systems, we proposed a reference point selection method for OLTC operation using the difference between the reference and measured voltages.
The existing method uses a reference point setting method using an average value or a preset reference point, but the proposed method changes the line with the greatest voltage problem to the reference point in real time. In addition, a reference voltage setting method based on the current direction is presented. Existing OLTC control uses one reference voltage, but this paper presents two reference voltage setting methods, considering the voltage characteristics according to the direction of the current.
The proposed method effectively reduced the number of compensation facilities by operating the OLTC based on the feeder with the largest voltage problem. Therefore, it can reduce the economic burden of DSO and PV companies. Further, in countries where PV adoption rates are at a standstill, the proposed method will buy the time necessary for the widespread adoption of smart inverters. Moreover, there is the advantage of increasing the penetration rate of the PV in problematic load lines.
However, there is a problem that the number of tap changes increases because OLTC operates on the line with the biggest voltage problem. In the future, it is necessary to analyze the OLTC operation using the prediction results, change the system configuration, develop methods to minimize voltage fluctuations, and analyze the effect of the OLTC according to the penetration rate of smart inverters.

Author Contributions

Writing—original draft preparation, K.-H.Y.; methodology, J.-W.S.; data curation, T.-Y.N.; supervision, J.-C.K.; review and editing, W.-S.M. All authors have read and agreed to the published version of the manuscript.

Funding

This research was supported by the Basic Science Research Program through the National Research Foundation of Korea (NRF) funded by the Ministry of Education (2022R1G1A1013373).

Institutional Review Board Statement

Not applicable.

Informed Consent Statement

Not applicable.

Conflicts of Interest

The authors declare no conflict of interest. The funder had no role in the design of the study; in the collection, analyses, or interpretation of data; in the writing of the manuscript, or in the decision to publish the results.

References

  1. Paris, B.; Foteini, V.; Tyris, D.; Balafoutis, A.T.; Vaiopoulos, K.; Kyriakarakos, G.; Manolakos, D.; Papadakis, G. Energy use in open-field agriculture in the EU: A critical review recommending energy efficiency measures and renewable energy sources adoption. Renew. Sustain. Energy Rev. 2022, 158, 112098. [Google Scholar] [CrossRef]
  2. Paris, B.; Foteini, V.; Tyris, D.; Balafoutis, A.T.; Vaiopoulos, K.; Kyriakarakos, G.; Manolakos, D.; Papadakis, G. Energy use in the EU livestock sector: A review recommending energy efficiency measures and renewable energy sources adoption. Appl. Sci. 2022, 12, 12042142. [Google Scholar]
  3. Gea-Bermúdez, J.; Kitzing, L.; Koivisto, M.; Das, K.; León, J.P.M.; Sørensen, P. The value of sector coupling for the development of offshore power grids. Energies 2022, 15, 747. [Google Scholar] [CrossRef]
  4. Karimi, M.; Mokhlis, H.; Naidu, K.; Uddin, S.; Bakar, A.A. Bakar Photovoltaic penetration issues and impact distribution network—A review. Renew. Sustain. Energy Rev. 2016, 53, 594–605. [Google Scholar] [CrossRef]
  5. Seguin, R.; Woyak, J.; Costyk, D.; Hambrick, J.; Mather, B. High-Penetration PV Integration Handbook for Distribution Engineers; National Renewable Energy Lab.: Golden, CO, USA, 2016; pp. 4–26.
  6. Rahman, S.; Aburub, H.; Moghaddami, M.; Sarwat, A.I. Reverse power flow protection in grid connected PV systems. In Proceedings of the IEEE SoutheastConb 2018, Tampa Bay Area, FL, USA, 19–22 April 2018; p. 18147426. [Google Scholar]
  7. Iioka, D.; Fujii, T.; Orihara, D.; Tanaka, T.; Harimoto, T.; Shimada, A.; Goto, T.; Kubuk, M. Voltage reduction due to reverse power flow in distribution feeder with photovoltaic system. Int. J. Electr. Power Energy Syst. 2019, 113, 411–418. [Google Scholar] [CrossRef]
  8. Iioka, D.; Fujii, T.; Tanaka, T.; Harimoto, T.; Motoyama, J. Voltage reduction in medium voltage distribution systems using constant power factor control of PV PCS. Energies 2020, 13, 5430. [Google Scholar] [CrossRef]
  9. Tshivhase, N.; Hasan, A.N.; Shongwe, T. Proposed fuzzy logic system for voltage regulation and power factor improvement in power systems with high infiltration of distributed generation. Energies 2020, 13, 4241. [Google Scholar]
  10. Walling, R.A.; Saint, R.; Dugan, R.C.; Burke, J.; Kojovic, L.A. Summary of distributed resources impact on power delivery systems. IEEE Trans. Power Deliv. 2008, 23, 1636–1644. [Google Scholar]
  11. Yao, H.; Qin, W.; Jing, X.; Zhu, Z.; Wang, K.; Han, X.; Wang, P. Possibilistic evaluation of photovoltaic hosting capacity on distribution networks under uncertain environment. Appl. Energy 2022, 324, 119681. [Google Scholar] [CrossRef]
  12. de Souza, V.M.; Vieira, J.P.A.; de Brito, H.R. Mitigating the impact of high-capacity dispatchable distributed generation on reconfigurable distribution networks with step voltage regulators: A real case study on voltage issues. Electr. Power Syst. Res. 2022, 207, 107842. [Google Scholar] [CrossRef]
  13. Ryu, J.C. Control Method of Step Voltage Regulator on Distribution Line with Distributed Generation. Master’s Thesis, Chungbuk National University, Cheongju, Korea, 2020. [Google Scholar]
  14. Lee, H.J.; Yoon, K.H.; Shin, J.W.; Kim, J.C.; Cho, S.M. Optimal parameters of volt–var function in smart inverters for improving system performance. Energies 2020, 13, 2294. [Google Scholar] [CrossRef]
  15. Malekpour, A.R.; Pahwa, A. A dynamic operational scheme for residential PV smart inverters. IEEE Trans. Smart Grid 2017, 8, 2258–2267. [Google Scholar] [CrossRef]
  16. Karunarathne, E.; Wijethunge, A.; Ekanayake, J. Enhancing PV hosting capacity using voltage control and employing dynamic line rating. Energies 2022, 15, 134. [Google Scholar] [CrossRef]
  17. Iioka, D.; Kusano, K.; Matsuura, T.; Hamada, H.; Miyazaki, T. Appropriate volt–Var curve settings for PV inverters based on distribution network characteristics using match rate of operating point. Energies 2022, 15, 1375. [Google Scholar] [CrossRef]
  18. Kang, W.; Chen, M.; Guan, Y.; Wei, B.; Juan, C.; Vasquez, Q.; Josep, M. Guerrero Event-triggered distributed voltage regulation by heterogeneous BESS in low-voltage distribution networks. Appl. Energy 2022, 312, 118597. [Google Scholar] [CrossRef]
  19. Rafaq, M.S.; Basit, B.A.; Mohammed, S.A.Q.; Jung, J.W. A comprehensive state-of-the-art review of power conditioning systems for energy storage systems: Topology and control applications in power systems. IET Renew. Power Gener. 2022, 16, 1971–1991. [Google Scholar] [CrossRef]
  20. Wasiak, I.; Szypowski, M.; Kelm, P.; Mieński, R.; Wędzik, A.; Pawełek, R.; Małaczek, M.; Urbanek, P. Innovative energy management system for low-voltage networks with distributed generation based on prosumers’ active participation. Appl. Energy 2022, 312, 118705. [Google Scholar] [CrossRef]
  21. Shan, Y.; Hu, J.; Guerrero, J.M. A model predictive power control method for PV and energy storage systems with voltage support capability. IEEE Trans. Smart Grid 2020, 11, 1018–1029. [Google Scholar] [CrossRef]
  22. Fundamentals. Enhanced Voltage Control EAVC Settings Calculation Guide (Fundamentals reference F9183); Electricity North West Ltd.: Warrington, UK, 2018; pp. 27–43. [Google Scholar]
  23. Micallef, A.; Spiteri Staines, C.; Cassar, A. Utility-scale storage integration in the maltese medium-voltage distribution network. Energies 2022, 15, 2724. [Google Scholar] [CrossRef]
  24. Nagarajan, A.; Coddington, M.H.; Brown, D.; Hassan, S.; Franciosa, L.; Sison-Lebrilla, E. Studies on the Effects of High Renewable Penetrations on Driving Point Impedance and Voltage Regulator Performance; National Renewable Energy Lab.: Golden, CO, USA, 2018; pp. 9–19.
  25. Katiraei, F.; Agüero, J.R. Solar PV integration challenges. IEEE Power Energy Mag. 2011, 9, 62–71. [Google Scholar] [CrossRef]
  26. Korea Electric Power Company (KEPCO). Regulation on the Use of Electrical Equipment for Transmission Distribution System (Appendix 4). Available online: http://cyber.kepco.co.kr/ckepco/front/jsp/CY/H/C/CYHCHP00704.jsp# (accessed on 20 July 2022).
  27. Lee, S.Y.; Lee, H.D.; Tae, D.H.; Rho, D.S. Evaluation algorithm for hosting capacity of PV system using LDC method of step voltage regulator in distribution systems. J. Korea Acad.-Indust. Coop. Soci. 2020, 21, 20–28. [Google Scholar]
  28. Li, C.; Disfani, V.R.; Haghi, H.V.; Kleissl, J. Optimal voltage regulation of unbalanced distribution networks with coordination of OLTC and PV generation. In Proceedings of the IEEE Power Energy Society General Meeting (PESGM), Atlanta, GA, USA, 4–8 August 2019; pp. 1–5. [Google Scholar]
  29. Khan, H.A.; Zuhaib, M.; Rihan, M. Voltage fluctuation mitigation with coordinated OLTC and energy storage control in high PV penetrating distribution network. Electr. Power Syst. Res. 2022, 208, 107924. [Google Scholar] [CrossRef]
  30. Choi, J.H.; Moon, S.I. The Dead Band Control of LTC Transformer at Distribution Substation. IEEE Trans. Power Syst. 2009, 24, 319–326. [Google Scholar]
  31. Bot, Y.; Allali, A. Using DGUPFC to control the voltage of multi-feeder smart distribution system. Int. J. Renew. Energy Res. 2017, 7, 1656–1662. [Google Scholar]
  32. Iria, J.; Heleno, M.; Cardoso, G. Optimal sizing and placement of energy storage systems and on-load tap changer transformers in distribution networks. Appl. Energy 2019, 250, 1147–1157. [Google Scholar] [CrossRef]
  33. Long, C.; Ochoa, L.F. Voltage control of PV-Rich LV networks: OLTC-Fitted transformer and capacitor banks. IEEE Trans. Power Syst. 2016, 31, 4016–4025. [Google Scholar] [CrossRef]
  34. Cipcigan, L.M.; Taylor, P.C. Taylor Investigation of the reverse power flow requirements of high penetrations of small-scale embedded generation. IET Renew. Power Gener. 2007, 1, 160–166. [Google Scholar] [CrossRef]
  35. Jeon, J.G.; Won, D.J.; Kim, T.H. Voltage control of ULTC and distributed generations in distribution system. Trans. Korean Instit. Electr. Eng. 2011, 60, 2206–2214. [Google Scholar] [CrossRef]
  36. Broderick, R.J.; Quiroz, J.E.; Ellis, A.; Reno, M.J.; Smith, J.; Dugan, R. Time Series Power Flow Analysis for Distribution Connected PV Generation; Sandia National Lab.: Albuquerque, NM, USA, 2013.
  37. Won, G.H. Effect of RNN-Based Voltage Control on Renewable Energy Penetration in Power Distribution System. Master’s Thesis, Kookmin University, Seoul, Korea, 2019. [Google Scholar]
  38. Hsieh, S.C.; Lee, Y.D.; Chang, Y.R. Economic evaluation of smart PV inverters with a three-operation-phase watt-var control scheme for enhancing PV penetration in distribution systems in Taiwan. Appl. Sci. 2018, 8, 995. [Google Scholar]
Figure 1. Mechanism of the LDC method.
Energies 15 06473 g001
Figure 2. Mechanism of the DVM method and difference from the LDC method.
Energies 15 06473 g002
Figure 3. Voltage of feeders based on the reference point and voltage of the OLTC operation.
Energies 15 06473 g003
Figure 4. Mechanism of the proposed method.
Energies 15 06473 g004
Figure 5. Flowchart of the proposed method.
Energies 15 06473 g005
Figure 6. Test model of the MT with six feeders.
Energies 15 06473 g006
Figure 7. One-day pattern of the load (b) and PV (a).
Energies 15 06473 g007
Figure 8. Simulation results of Case 1: (a) tap position and (b) feeder voltages.
Energies 15 06473 g008
Figure 9. Simulation results of Case 2: (a) tap position and (b) feeder voltages.
Energies 15 06473 g009
Figure 10. Simulation results of Case 3: (a) tap position and (b) feeder voltages.
Energies 15 06473 g010
Figure 11. Simulation results of Case 4: (a) tap position and (b) feeder voltages.
Energies 15 06473 g011
Figure 12. Simulation results of Case 5: (a) tap position and (b) feeder voltages.
Energies 15 06473 g012
Figure 13. Simulation results of Case 6: (a) tap position and (b) voltages of the feeders.
Energies 15 06473 g013
Figure 14. Minimum feeder voltages according to the penetration rate of smart inverters: (a) Case 2 and (b) Case 5.
Energies 15 06473 g014
Figure 15. Maximum feeder voltages according to the penetration rate of smart inverters: (a) Case 1, (b) Case 3, (c) Case 4, (d) Case 5, and (e) Case 6.
Energies 15 06473 g015
Table 1. Operating voltage of the distribution system in KEPCO.
Nominal Voltage [V]Range of Normal Voltage [V]
13,200/22,900
(1.0 [p.u.])
12,000–13,800/20,800–23,800
(0.909–1.039 [p.u.])
Table 2. Parameters of the test model.
ComponentInformationParameter
Main transformerRated voltage154/22.9 kV
Rated capacity45/60 MVA
Total tap16 (±8)
Dead band±1.25%
Voltage change per tap1.25% of rated voltage
Waiting time60 s
LoadPeak load per nodeFeeder 1, 2, 6 = 1.5 MW
Feeder 3, 4 = 0.6 MW
Power factor0.9 (lagging)
PVCapacityFeeder 1~5 = 14 MWp
Power factor1
FeederType of line ACSR-160 mm2
Static thermal capacity14 MVA
Length40 km
Table 3. Case studies information.
CaseInformation
1Existing method (LDC & neutral tap in case of reverse power flow)
2Existing method (DVM & the reference point to feeder 5)
3Existing method (DVM & the reference point to feeder 6)
4Existing method (DVM & the reference point to feeder 3)
5Existing method (DVM & the reference point to feeder 1)
6Proposed method (the reference voltage and reference point are changed)
Table 4. Voltage problem according to the case studies.
CaseVoltage Problem
Feeder 1Feeder 2Feeder 3 Feeder 4Feeder 5Feeder 6
1---Over-voltageOver-voltageLow-voltage
2Low-voltageLow-voltage---Low-voltage
3Over-voltageOver-voltageOver-voltageOver-voltageOver-voltage-
4--Over-voltageOver-voltageOver-voltageLow-voltage
5Low-voltageLow-voltage-Over-voltageOver-voltageLow-voltage
6----Over-voltageLow-voltage
Table 5. Required compensation facilities and costs to solve the voltage problem.
CaseRequired Smart Inverter Penetration Rate [%]Total Smart Inverter Capacity [MWp]Number of SVRs
Feeder 1Feeder 2Feeder 3 Feeder 4Feeder 5Feeder 6
1---2399SVR17.081
24023---SVR8.821
34853SVRSVRSVR-14.143
4--7869SVRSVR20.582
52340-347SVR15.821
6----3SVR1.261
Publisher’s Note: MDPI stays neutral with regard to jurisdictional claims in published maps and institutional affiliations.

