1. Introduction
A regulating valve is one of the key control elements in the coal liquefaction industry, there is often energy loss that occurs during its operation, whose short life and high price have restricted the production efficiency of the direct coal liquefaction process system [
1]. The regulating valve in the coal liquefaction industry mainly depends on import, our country spent about hundreds of millions to import them ever year. Although many active steps were adopted, such as material upgrade, added wear resistant layer and structure optimization, to make the lifetime of the valve exceed 2700 h. More effort still needs to be addressed to improve the performance of the valve. Cavitation is a common phenomenon in the valves, which often cause structural deformation and spalling of flow channel [
2], and reduce valve lifetime and increase replacement costs [
3]. Serious cavitation damage often occurs when the valves are used under high temperature and high-pressure conditions, Duan [
4] pointed that the phase transformation rate could be used to predict the cavitation damage region. Chern [
5] pointed that cavitation could be prevented when two cages are installed in the globe valve. Zhang [
6] pointed that increasing back pressure appropriately improves the flow capacity of the valve, so as to improve the performance of the valve. Wu [
7] reported an optimized structure of the relief valve could decrease the maximum/total vapor volume of the cavitation flow in the channel. Trivedi [
8] predicted the location of the cavitation in the valve by identifying the low pressure and high velocity regions, and valves’ hydraulic loss coefficient was also calculated. However, it is difficult to evaluate the energy loss in the flow field experimentally because it is difficult to obtain very detailed information inside the valve. To evaluated energy loss quantitatively and find the key part where the flow deteriorating is of great significance for the optimization of the valve, and thus prolong the working life and improve the valve’s working efficiency.
The occurrence of cavitation flow will also result in energy loss in the hydraulic system [
8], which are studied mainly in the perspective of fluid dynamics, but the magnitude and position of hydraulic losses in the valve are not precise positioning. The CFD method could obtain the distribution of pressure and velocity [
9,
10,
11], and the energy loss could only be indirectly analyzed. Energy efficiency represents one of the main requisites in mechanical design [
12]. Entropy production theory which derives from the second law of thermodynamics, describing energy is converted from mechanical energy to unusable energy, which could be used to evaluate the flow field. Yu [
13] applied five kinds of entropy production terms such as direct dissipation, turbulent dissipation, wall shear stress, mean and fluctuating temperature gradients in order to understand the interactions between unsteady cavitating flow and entropy around NACA0015 hydrofoil at 343 K. Kock [
14] analyzed entropy production in incompressible turbulent shear flows of Newtonian fluids systematically. Entropy production theory is used in the design and optimization of hydraulic machinery recently [
15,
16]. Soltanmohamadi [
17] demonstrated a 26.02% average decrease in entropy generation of the optimal design of Wells turbines throughout the full operating range. Sciacovelli [
18] pointed that entropy generation analysis could be a popular thermodynamic method for the design and the optimization of less unsustainable systems. Yu [
19] pointed that the hydraulic loss of a hydraulic turbine is closely related to flow separation, vortex and reflux, and the entropy production of the diversion tube is the largest, followed by the flow passage. Based on entropy production theory, Liu [
20] analyzed the pressure and entropy production distribution of the internal flow field, which revealed the flow mechanism of vortex recession frequency in the reduction of metering characteristics by the throttling effect of compressed air. Ghorani [
21] showed that turbulence entropy is the main cause of hydraulic loss, while shock waves at the blade inlet, flow deviation at blade outlet, flow separation, reflux and passage vortex are the main causes of entropy and irreversible hydraulic loss in PAT. Osman [
22] evaluated turbulent dissipation by the entropy production method to characterize flow losses. However, entropy production theory is seldom used for the analysis of the flow field in the valve illustrating the perfect degree of energy conversion and utilization, especially in the analysis of cavitation flow.
When the oil flows through the orifice in the regulate valve of the coal liquefaction industry, there will always some energy inevitably converted into the internal energy of the oil and accompanied by the occurrence of entropy. Due to its viscous force and Reynolds stress, part of mechanical energy is irreversibly converted into internal energy dissipation. However, few studies focus on the flow loss in the valve by using entropy generation theory, part of them focus on the turbine and pump. The evaluation of energy loss in cavitation flow field is still lacking in-depth research. For reliability analysis of complicated flow in the regulate valve of the coal liquefaction industry, entropy generation theory can display the distribution of energy loss in the flow field visually and quantitatively, so as to make optimization design for flow deterioration area, which is of great significance for the performance improvement of hydraulic machinery. Therefore, the value of energy loss in the regulate valve will be evaluated through the pressure and velocity of the flow field inside the valve. The relationship between energy loss in cavitation flow and entropy production of the regulating valve will be discussed in this paper. The flow loss in the flow passage is evaluated, and the relationship between the total entropy production of the flow in the regulating valve and the steady-state flow force are also discussed. The results in this paper is help the structural optimization by combining with external characteristics and internal flow field in the valve, and the extension of its service life.
2. Entropy Production Theory
When the oil flows in the regulating valve, it is turbulent flow. From the perspective of thermodynamics, entropy production could be used to measure the energy dissipation in the regulating valve, so as to calculate the hydraulic loss.
The Entropy Production Rate (EPR) [
15] in per unit volume of fluid could be defined as follows:
where
represents the heat conduction of fluid per unit volume in unit time,
T represents the temperature, and
represents the local entropy production rate in the cavity.
In Reynolds time-mean equation, the fluid motion is divided into time-mean motion and pulsation motion. Therefore, entropy production rate also includes time-mean entropy production (TMEP) and pulsation entropy production (TPEP) in the flow process. The entropy production rate caused by the time-average velocity (TMEPR) [
15] could be calculated by the following formula:
Here μ is the effective dynamic viscosity of fluid medium.
The entropy production rate caused by pulsation velocity (TPEPR) [
15] could be calculated as follows:
Cavitation will occur in the regulating valve when a volume of liquid is subjected to a pressure that falls below a “cavitation threshold” [
23]. It is in the gas and liquid phases; the effective dynamic viscosity of the flow could be expressed as follows:
Here μl is the viscosity of liquid, μv is the viscosity of gas, and αv is the volume fraction of gas.
The partial derivative in the Equations (2) and (3) cannot directly calculate the entropy generation caused by turbulent pulsation velocity numerically. Herwig [
24] numerically analyzed and calculated the dissipation rate of turbulence pulsation, and proposed a calculation method of entropy production based on the turbulence model. The entropy production rate caused by the pulsation velocity (TPEPR) could be calculated as follows:
Here ε is the dissipation rate of turbulent kinetic energy.
By integrating the above entropy production rate (EPR), the total entropy production (TEP) in the regulating valve can be obtained:
The total entropy production of direct dissipation (TMEP) and turbulent dissipation (TPEP) is calculated as:
The entropy production rate of any particle in the flow channel and the total flow entropy production of the whole flow channel could be obtained by analyzing the flow field in the valve numerically. Further, the energy loss also could obtain accurately, which could give a theoretically reference for optimization design of regulating valve.
According to reference [
13], when there is cavitation flow in the regulate valve, the cavitation flow and entropy production are close. The entropy production rate by cavitation (EPRC) effect could be expressed as follows:
Here is the mass transfer rate during the phase transition between liquid and gas, ρl is the density of the liquid, and ρv is the density of the gas.
If no cavitation could be found at that working condition, the result of Equation (9) is equal to zero. Therefore, the change of entropy generated by cavitation is a good reference for investigating cavitation flow in the regulating valve. By integrating Equation (9), the total entropy production by cavitation (TEPC) in the regulating valve could be obtained:
3. Numerical Methods of Regulating Valve
According to the structure of the regulating valve in practical project, the simplified structure is shown in
Figure 1. As discussed in Refs. [
25,
26], this two-dimensional axisymmetric model was used could save calculation time and reduce the complexity of numerical simulation. The simplified geometric structure of the regulating valve is mainly composed of upstream flow channel, throttling part and expansion section.
The mesh is divided into a tetrahedral mesh by ICEM software, the boundary layer on the wall is treated. The divided grid model is shown in the
Figure 2. Structural mesh is applied to divide the geometric model of the regulating valve in this paper, including the flow channel upstream, the throat part, the diffusion section and outlet port. Due to the higher flow velocity and larger pressure drop, the local grid refinement is used to obtain the flow field near the orifice in the regulating valve more accurately, and the region of interest is subdivided into an unstructured grid. The mass flow rate at the inlet of the regulating valve is calculated to verify the grid independence. As shown in
Figure 3, when the number of grids reaches 100,000, the mass flow rate remains stable. Therefore, the number of grids for the regulating valve model is 100,000, most of the near wall y+ of the channel grid is between 30 and 150, which could meet the requirements of calculation speed, calculation accuracy and wall function.
In the simulation, the relative movement between liquid and gas is neglected, the wall condition is set as non-slip wall, the influence of gravity and heat transfer performance are also ignored, and the hydraulic oil is assumed to be isothermal and incompressible. In addition, to employ the law of mass conservation, momentum conservation and energy conservation in the fluid, cavitation phenomenon often occur near the orifice of the regulating valve, so Schnerr-Sauer model was used for modelling and computation of unsteady cavitation flows in the valve, which is shown as:
The phase transition rate is:
The volume fraction of vapor phase is:
Here
RB is the bubble radius:
Finally, the evaporation phase
Re and the condensation phase
Rc could be expressed as follows:
Here P is the pressure in the flow field and Pv is the saturated vapor pressure of the fluid.
Furthermore, the RNG
k-ε model in turbulent flow is used to study the flow in the regulating valve [
27,
28], because the Reynolds number is much greater than the critical Reynolds number, which are shows are follows:
Here Gk represents the generation of turbulence kinetic energy due to the mean velocity gradients, Gb is the generation of turbulence kinetic energy due to buoyancy, ε is the fluid’s turbulent dissipation rate. σk and σε are the inverse effective Prandtl numbers for k and ε, respectively. C1ε, C2ε, and C3ε are constants. Sk and Sε are user-defined source terms.
4. Results and Discussion
4.1. Model Validation
When the oil flowing through the orifice, the momentum change, and the steady-state flow force could be found. The steady-state flow force and the velocity of change is closely related to the pressure and velocity inside the valve. The pressure distribution on the surface of the valve could be obtained numerically and experimentally, so as to obtain the steady-state flow force [
27]. A force measurement system, which is consisted of a displacement sensor and a micro-force sensor, could be used to measure the flow force. The detailed experimental process have been shown in Ref [
27].
Figure 4 shows the comparison between the numerical simulation and experimental results of the steady-state flow force under different openings, while the inlet pressure is 2.2 MPa, and the outlet pressure is 1 MPa.
Figure 4 shows that the steady-state flow force increases firstly and then gradually decreases with the increase of the opening, which is also mentioned in Ref [
29]. Due to the friction resistance, the machining error in the experiment, the influence of gravity and heat transfer performance being ignored in the simulation, there is a small deviation between the experimental and the simulation values. However, the overall trend of them are almost the same, so the numerical framework in this paper could describe the cavitation flow in the regulating valve well.
4.2. Entropy Production in Regulating Valve
Velocity gradients and phase change are two dominate factors controlling entropy change [
13].
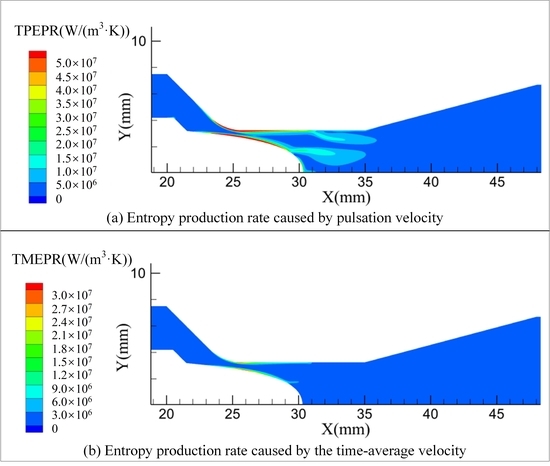
Figure 5 shows the distribution of TPEPR and TMEPR in the regulating valve, and analysis have done on by using ANSYS-15.0(FLUENT), in which the inlet pressure is 3 MPa and the outlet pressure is 1 MPa. It could be found that the TPEPR mainly exist in the orifice and the downstream channel, while the TMEPR mainly exist in the orifice. Because the velocity of oil change drastically near the orifice, and the speed is larger. Furthermore, the turbulence is stronger in the downstream channel, and the formation of vortex leads to complex change in velocity, and the value of velocity is lower than it is in the orifice. In addition, the TPEPR is large, which is the main part in the total entropy production rate, indicating that turbulence is the main reason for energy dissipation in the regulating valve [
30].
Figure 6 shows the distribution of TEPR in regulating valve under different opening. When the opening increases from 40% to 70%, the distribution of TEPR near the head of valve core becomes smaller, while the distribution of TEPR near the valve seat gradually moves toward downstream. Because the increasing opening so as to the increasing flow area will slow down the flow in the orifice, and the high-speed area of the oil becomes larger, resulting in greater entropy production rate in the flow channel.
In order to quantitatively analyze the influence of the opening on entropy production, TEP in the regulating valve under different opening is calculated in
Figure 7. While the opening increases from 40% to 70%, TPEP increase, and the range of turbulence vortex in the flow channel increases, and the intensity and range of turbulence flow near the valve seat increase, while the intensity and range of turbulence flow in the head of the valve core decrease with the increase of the opening. Therefore, the opening of the regulating valve increases from 40% to 70%, the TEP in the regulating valve will increase.
4.3. Characteristics of Entropy Production Analysis in Two-Phase Cavitation Flows
Figure 8 shows EPRC and gas volume fraction under different openings. When the opening increases from 40% to 70%, the EPRC increases firstly and then decreases. Cavitation occurs near the head of the valve core and the downstream of the valve seat, whose distribution is closely related to the gas phase volume fraction in the valve as shown in Refs. [
1,
4], resulting in increased entropy production. The EPRC in the head of the valve core decreases slowly with the opening increasing. The EPRC near the downstream of the valve seat increases with the increasing opening, so the total entropy production rate of these two places increases firstly and then decreases. The larger EPRC occurs near the gas–liquid exchange region in the flow passage, not in the center of cavitation region. The formation of cavitation will aggravate the generation of entropy [
13]. It is consistent with the distribution law of gas phase volume fraction, revealing the process of cavitation occurrence, separation and collapse in the valve.
In order to further analyze the changing of EPRC in regulating valve, the data of EPRC and gas phase volume fraction with 0.1 mm away from the valve seat were extracted, as shown in
Figure 9.
Figure 10 shows the distribution of gas phase volume fraction and EPRC at the selected curve with different openings. With the increasing opening, the value and scope of gas phase volume fraction are gradually increasing, which shows the length and intensity of cavitation increases gradually so as the rising rate of gas phase volume, this results are in accordance with the reports in Refs [
1,
4]. Furthermore, the distribution of EPRC is in good agreement with the distribution of gas phase volume fraction. The occurrence of gas phase could lead to the entropy production, the growth rates of EPRC is larger than the growth rate of the gas phase volume fraction. Because EPRC is mainly produced in gas–liquid exchange region, which is smaller than the whole cavitation region, leading to a sharp increase in EPRC, and then a decrease later. With the increasing opening, the axial distance of EPRC in the rising stage is almost the same which is near the throttle orifice. In addition, the decreasing range of EPRC develops gradually downstream with the increasing cavitation range. In addition, there are some fluctuations near the downstream of the valve wall, because the tail of the cavitation region is also in the gas–liquid exchange region, which will produce some EPRC. However, this part is far away from the orifice, the cavitation intensity is weak, so the increase of EPRC is small. In a word, with the increasing opening of regulating valve, the cavitation intensity near the downstream of the valve seat will increase so as the EPRC.
In order to quantitatively analyze the influence of the openings on EPC,
Figure 11 shows the distribution of total EPC in the valve with different openings. EPC increases firstly and then decreases with the increasing openings. As discussed above, cavitation in the flow passage is mainly distributed near the spool head and the downstream of the valve seat, resulting in entropy production in both places. With the increase of the openings, cavitation will gradually decrease in the spool head, but cavitation in the downstream of the seat slowly rises. In addition, EPC reduced gradually near the spool head, which increased gradually near the downstream wall. Finally, the total entropy production rise firstly and then decreases with the increase of the openings.
4.4. Study on Steady-State Flow Force of Regulating Valve Based on Entropy Production Analysis
The change law of entropy production caused by cavitation flow in the flow passage of regulating valve is discussed above. The entropy production is closely related to the velocity in the flow field, which will result in the change of the steady-state flow force. Therefore, the relationship between the entropy production and flow force should be discussed.
Figure 12 presented the relationship among TPEP, TMEP and steady-state flow force at different openings. It shows that the change law between entropy production and steady-state flow force is closely related although the openings is different. With the increasing steady-state flow force, the value of TPEP and the value of TMEP in the flow passage of regulating valve will increase, and the increasing amplitude of TPEP and TMEP is almost the same. The increasing steady-state flow force indicates that the momentum transformation in the flow passage will be strengthened, the flow will be more intensely. So, the energy loss will be larger, and the entropy production will increase.
Figure 13 shows the relationship between TEP and steady-state flow force in the flow passage of the regulating valve under different openings. It shows that although the openings of regulating valve are different, the variation laws of TEP and steady-state flow force could be fitted as
, and the fitting degree is as R
2 > 99%, which indicates a high fitting degree. The coefficients a, b and c of this formula are different with different openings. That is to say, the relationship between the TEP and the steady-state flow force could be approximated expressed by an exponential relationship. As the steady-state flow force increases, the TEP in the flow process also increases.
4.5. Influence of Cavitation Effect on Steady-State Flow Force
Figure 14 shows the change of steady-state flow force of the regulating valve under different inlet pressures and the opening, while the outlet pressure is 1 MPa. It could be seen that the openings have an obviously influence on the steady-state flow force. With the increase of the inlet pressure, the steady-state flow force in regulating valve will gradually increase, but the increase magnitude is different, which is the same as the experimental results reported in Ref [
31]. The red dotted line is the fitting curve of steady-state flow force of single-phase flow without cavitation. When cavitation occurs, the rising trend of the steady-state flow force will become smaller, that is to say, the generation of cavitation reduces the steady-state flow force. When the opening is 40%, the increasing trend of the steady-state flow force of single-phase flow and two-phase flow is close to linear. The cavitation intensity is small, so the influence of cavitation on the steady-state flow force is small. With the increase of the opening, the steady-state flow force increases slowly because the increase of the opening leads to the cavitation strengthening so as to the decreasing steady-state flow force. Further, when the opening reaches to 70%, the increasing trend of the steady-state flow force decreases under cavitation condition, which is smaller than it is at 60% opening. Because the cavitation intensity is slightly weakened than it is at 60% opening. Therefore, the effect of cavitation on the steady-state flow force under increasing opening increased firstly and then weakened. Cavitation reduces the steady-state flow force which is affected by the valve core. The stronger the cavitation, the greater the pressure fluctuation of the valve core.
The severity of cavitation has some effect on steady-state flow force [
32]. There is an obviously demarcation point between cavitation and non-cavitation in
Figure 14, which maybe used to judge whether there is cavitation or not. The inlet pressure corresponding to the above demarcation point under different openings are calculated as shown in
Table 1. As the opening increase from 40% to 70%, the inlet pressure at the demarcation point decreased firstly and then increased.
Figure 15 is the gas volume fraction in the valve based on the calculated inlet pressure in
Table 1. The gas volume fraction is an important parameter to illustrate the cavitation intensity. Although the openings increase from 40% to 70%, the gas volume fraction is small, and the cavitation area is small. That is to say, the inlet pressure calculated according to the change point of the steady-flow force could be used as the critical value to judge whether cavitation occurs in the regulating valve or not.
5. Conclusions
In this paper, the flow loss in the regulating valve is studied based on the entropy production analysis, and the relationship between the total entropy production of the cavitation flow in the regulating valve and the steady-state flow force is also discussed. The main conclusions are as follows:
(1) The EPR is mainly distributed in the throat region of the regulating valve and the downstream of the valve core. The change of the EPRC in the regulating valve reflects the change in the fluid flow velocity. The velocity changes most dramatically and the entropy production reaches the maximum. TPEP is the main part of the TEP of flow. When the opening increases, the distribution area of EPR in the core head becomes smaller and moves closer towards the core head. At the same time, the distribution of EPR near the valve seat gradually moves downstream, and TEP increases. Furthermore, the relationship between TEP in the cavity and the steady-state flow force could be approximated as an exponential relationship. The steady-state flow force increases with the increasing TEP.
(2) EPRC reveals the process of cavitation generation, separation and collapse in the valve, which could be used to explain and analyze the cavitation phenomenon. As the opening increases from 40% to 70%, the cavitation area near the core head gradually decreases, while it increases gradually and develops downstream near the valve seat. EPC increases, while the total cavitation entropy production by cavitation increases firstly and then decreases. The smallest value of EPC is 0.103 W/K at the 40% opening, while the maximum value is 0.119 W/K at 60% opening. The area where the larger EPRC occurs is near the gas-liquid exchange area in the flow passage, rather than the center of the cavitation region.
(3) When the inlet pressure increases from 1 MPa to 3 MPa, the steady-state flow force in regulating valve increase from about 0.5 N to 30 N, whose concrete numbers is closely linked to the opening. In addition, the relationship between the TEP and the steady-state flow force could be approximated expressed by an exponential relationship. As the steady-state flow force increases, the TEP in the flow process also increases. In addition, the cavitation also has an important effect on the steady-state flow force, there is an obviously demarcation point between cavitation and non-cavitation on the curve of steady-state flow force vs the inlet pressure. The inlet pressure corresponding to the appearance of cavitation decrease from 1.68 MPa to 1.62 MPa, when the opening increase from 40% to 60%, then increase to 1.64 MPa at 70% opening. This cavitation discrimination method based on the steady-state flow force is proposed, which could be used to judge whether there is cavitation or not.
Entropy generation theory can not only be used to analyze the overall energy loss of each component in the regulate valve of coal liquefaction industry, but also could be used to map exactly where the location and spatial distribution of energy loss, which can provide information for the performance analysis of the regulate valve. It is of great significance for the optimization of hydraulic machinery to protect the flow deterioration area, so as to extend the service life of the coal liquefaction control valve and ensure the stable operation of the coal liquefaction system.

 ,
, 


