Article

Model Development for State-of-Power Estimation of Large-Capacity Nickel-Manganese-Cobalt Oxide-Based Lithium-Ion Cell Validated Using a Real-Life Profile

by
Abraham Alem Kebede
1,2,*,
Md Sazzad Hosen
1,
Theodoros Kalogiannis
1,
Henok Ayele Behabtu
1,2,
Towfik Jemal
2,
Joeri Van Mierlo
1,
Thierry Coosemans
1 and
Maitane Berecibar
1
1
Mobility, Logistics and Automotive Technology Research Center, Vrije Universiteit Brussels, Pleinlaan 2, 1050 Brussels, Belgium
2
Faculty of Electrical and Computer Engineering, Jimma Institute of Technology, Jimma University, Jimma 378, Ethiopia
*
Author to whom correspondence should be addressed.
Energies 2022, 15(18), 6497; https://doi.org/10.3390/en15186497
Submission received: 21 July 2022 / Revised: 29 August 2022 / Accepted: 3 September 2022 / Published: 6 September 2022

Abstract

:
This paper investigates the model development of the state-of-power (SoP) estimation for a 43 Ah large-capacity prismatic nickel-manganese-cobalt oxide (NMC) based lithium-ion cell with a thorough aging investigation of the cells’ internal resistance increase. For a safe operation of the vehicle system, a battery management system (BMS) integrated with SoP estimation functions is crucial. In this study, the developed SoP model used for the estimation of power throughout the lifetime of the cell is coupled with a dual-polarization equivalent-circuit model (DP_ECM) for achieving the precise estimation of desired parameters. The SoP model is developed based on the pulse-trained internal resistance evolution approach, and hence the power is estimated by determining the rate of internal resistance increase. Hybrid pulse power characterization (HPPC) test results are used for extraction of the impedance parameters. In the DP_ECM, Coulomb counting and extended Kalman filter (EKF) state estimation methods are developed for the accurate estimation of the state of charge (SoC) of the cell. The SoP model validation is performed by using both dynamic Worldwide harmonized Light vehicles Test Cycles (WLTC) and static current profiles, achieving promising results with root-mean-square errors (RMSE) of 2% and 1%, respectively.

1. Introduction

With the consistent increment in power density and specific energy of Li-ion batteries, the intensive use of these battery types is becoming common practice in the automotive application sector. This contributes to a matured battery management system (BMS) utilized in Li-ion batteries, having high charge and discharge current rates and high energy density [1,2]. For the safe operation of the EV battery system, appropriate parameter identification methods of lithium-ion batteries are crucial [3]. Various methods are used for the estimation of SoC and SoP, whereas Xiong et al. [4] used the Kalman filter joint estimator method to calculate SoC and predict the SoP output. The study provides an SoP estimation model using the SoC result as an input without considering the resistance increase in the cells. On the other hand, a recursive extended least-squares (RELS) algorithm is used to estimate SoP using an online equivalent-circuit model parameter identification technique [5] with an assumption of constant current as input and temperature as an influencing factor. However, the study did not consider the use of discharging current and power for effective determination of the desired SoP. Jiang et al. [6] applied the multi-constraint SoP estimation method under high-temperature conditions, proving that the resulting SoP had good precision. Thermal characteristics of batteries during acceleration or deceleration of electric vehicles are also considered for assessing the temperature effect on SoP improving the estimation accuracy [7]. However, the study lacks the incorporation of the SoC and resistance effects on the resulting SoP.
Due to simplicity and a low computational time requirement, the equivalent-circuit model (ECM) approach has also been used by different researchers. Gao et al. [8] used a coupled ECM approach to estimate SoC and SoP. Jia et al. [9] made a comparative analysis between the extended Kalman filter (EKF), strong tracking EKF (STEKF), and multirate strong tracking EKF (MRSTEKF) and verified that the MRSTEKF has faster computation time during estimation of SoC and SoP. However, these methods were found to be relatively complex for utilization purposes. Different studies have also been conducted with online state-of-power estimation techniques of lithium-ion batteries performed using constant-voltage charging current and Kalman filtering state estimation methods [10,11,12,13,14] without assessing the aging effects of internal resistance increase on the SoP estimation. In addition to the SoC determination, a few kinds of research have been conducted to investigate the effect of aging on SoP estimation. Esfandyari et al. [15] and Sun et al. [16] analyzed the effect of aging status using a combined reference mode of constant-current and constant-voltage methods for estimation of fresh-cell SoP where the various aging states are adapted. In this method, the author tried to analyze the aging effect, which is limited to the beginning-of-life (BoL) state-of-health (SoH) data, which might result in inaccuracy on the SoP estimation. The state of charge (SoC) is one of the most important parameters in the battery cell study, which needs accurate determination where it is changed nonlinearly during the charge and discharge process. However, finding the most accurate SoC value becomes challenging as it can be affected by different factors, including temperature and self-discharge. Furthermore, the determination of the state of power (SoP) is the other crucial aspect that uses the estimated output of SoC as an input for its computation. Nowadays, in electric vehicle (EV) applications, the estimation of SoP is becoming an interesting study area that enables optimal control of the battery power management through the BMS to be achieved [17]. Therefore, for the reliable operation of the battery system used in either EV or renewable energy integration applications, an accurate estimation of battery SoP is essential, which is a function of load current, terminal voltage, and SoC [18].
The methods mentioned above have their own pros and cons in terms of complexity, accuracy, and computational time. Moreover, in the previous studies mentioned above, the SoP response of battery cells was not performed until the end of life (EoL) of the cells, and rather focused on the BoL parameter values. In this paper, the main objective of the study is to compromise the gaps observed from the above reviews by developing a robust SoP model used for the estimation of the state of power for an electric vehicle battery cell by considering the effect of internal resistance increase throughout the life of the cell. Following the parametrization of the SoP model with the proposed pulse-trained internal resistance evolution approach, novel results showing the promising accuracy of the model are achieved. The discharge peak currents and the influence of the aging effect in terms of internal resistance increase have been considered for the determination of the SoP output, which was not inclusively considered in previous studies. In addition to the SoP model, the dual-polarization equivalent-circuit model (DP_ECM) is utilized for accurate estimation of SoC together with lookup table parameters, which in turn is taken as an input for the SoP model. The DP_ECM is coupled to the SoP model and the desired power output is estimated. Finally, both the SoP and the DP_ECM are validated using dynamic Worldwide harmonized Light vehicles Test Cycles (WLTC) and static current profiles, and promising results are found.

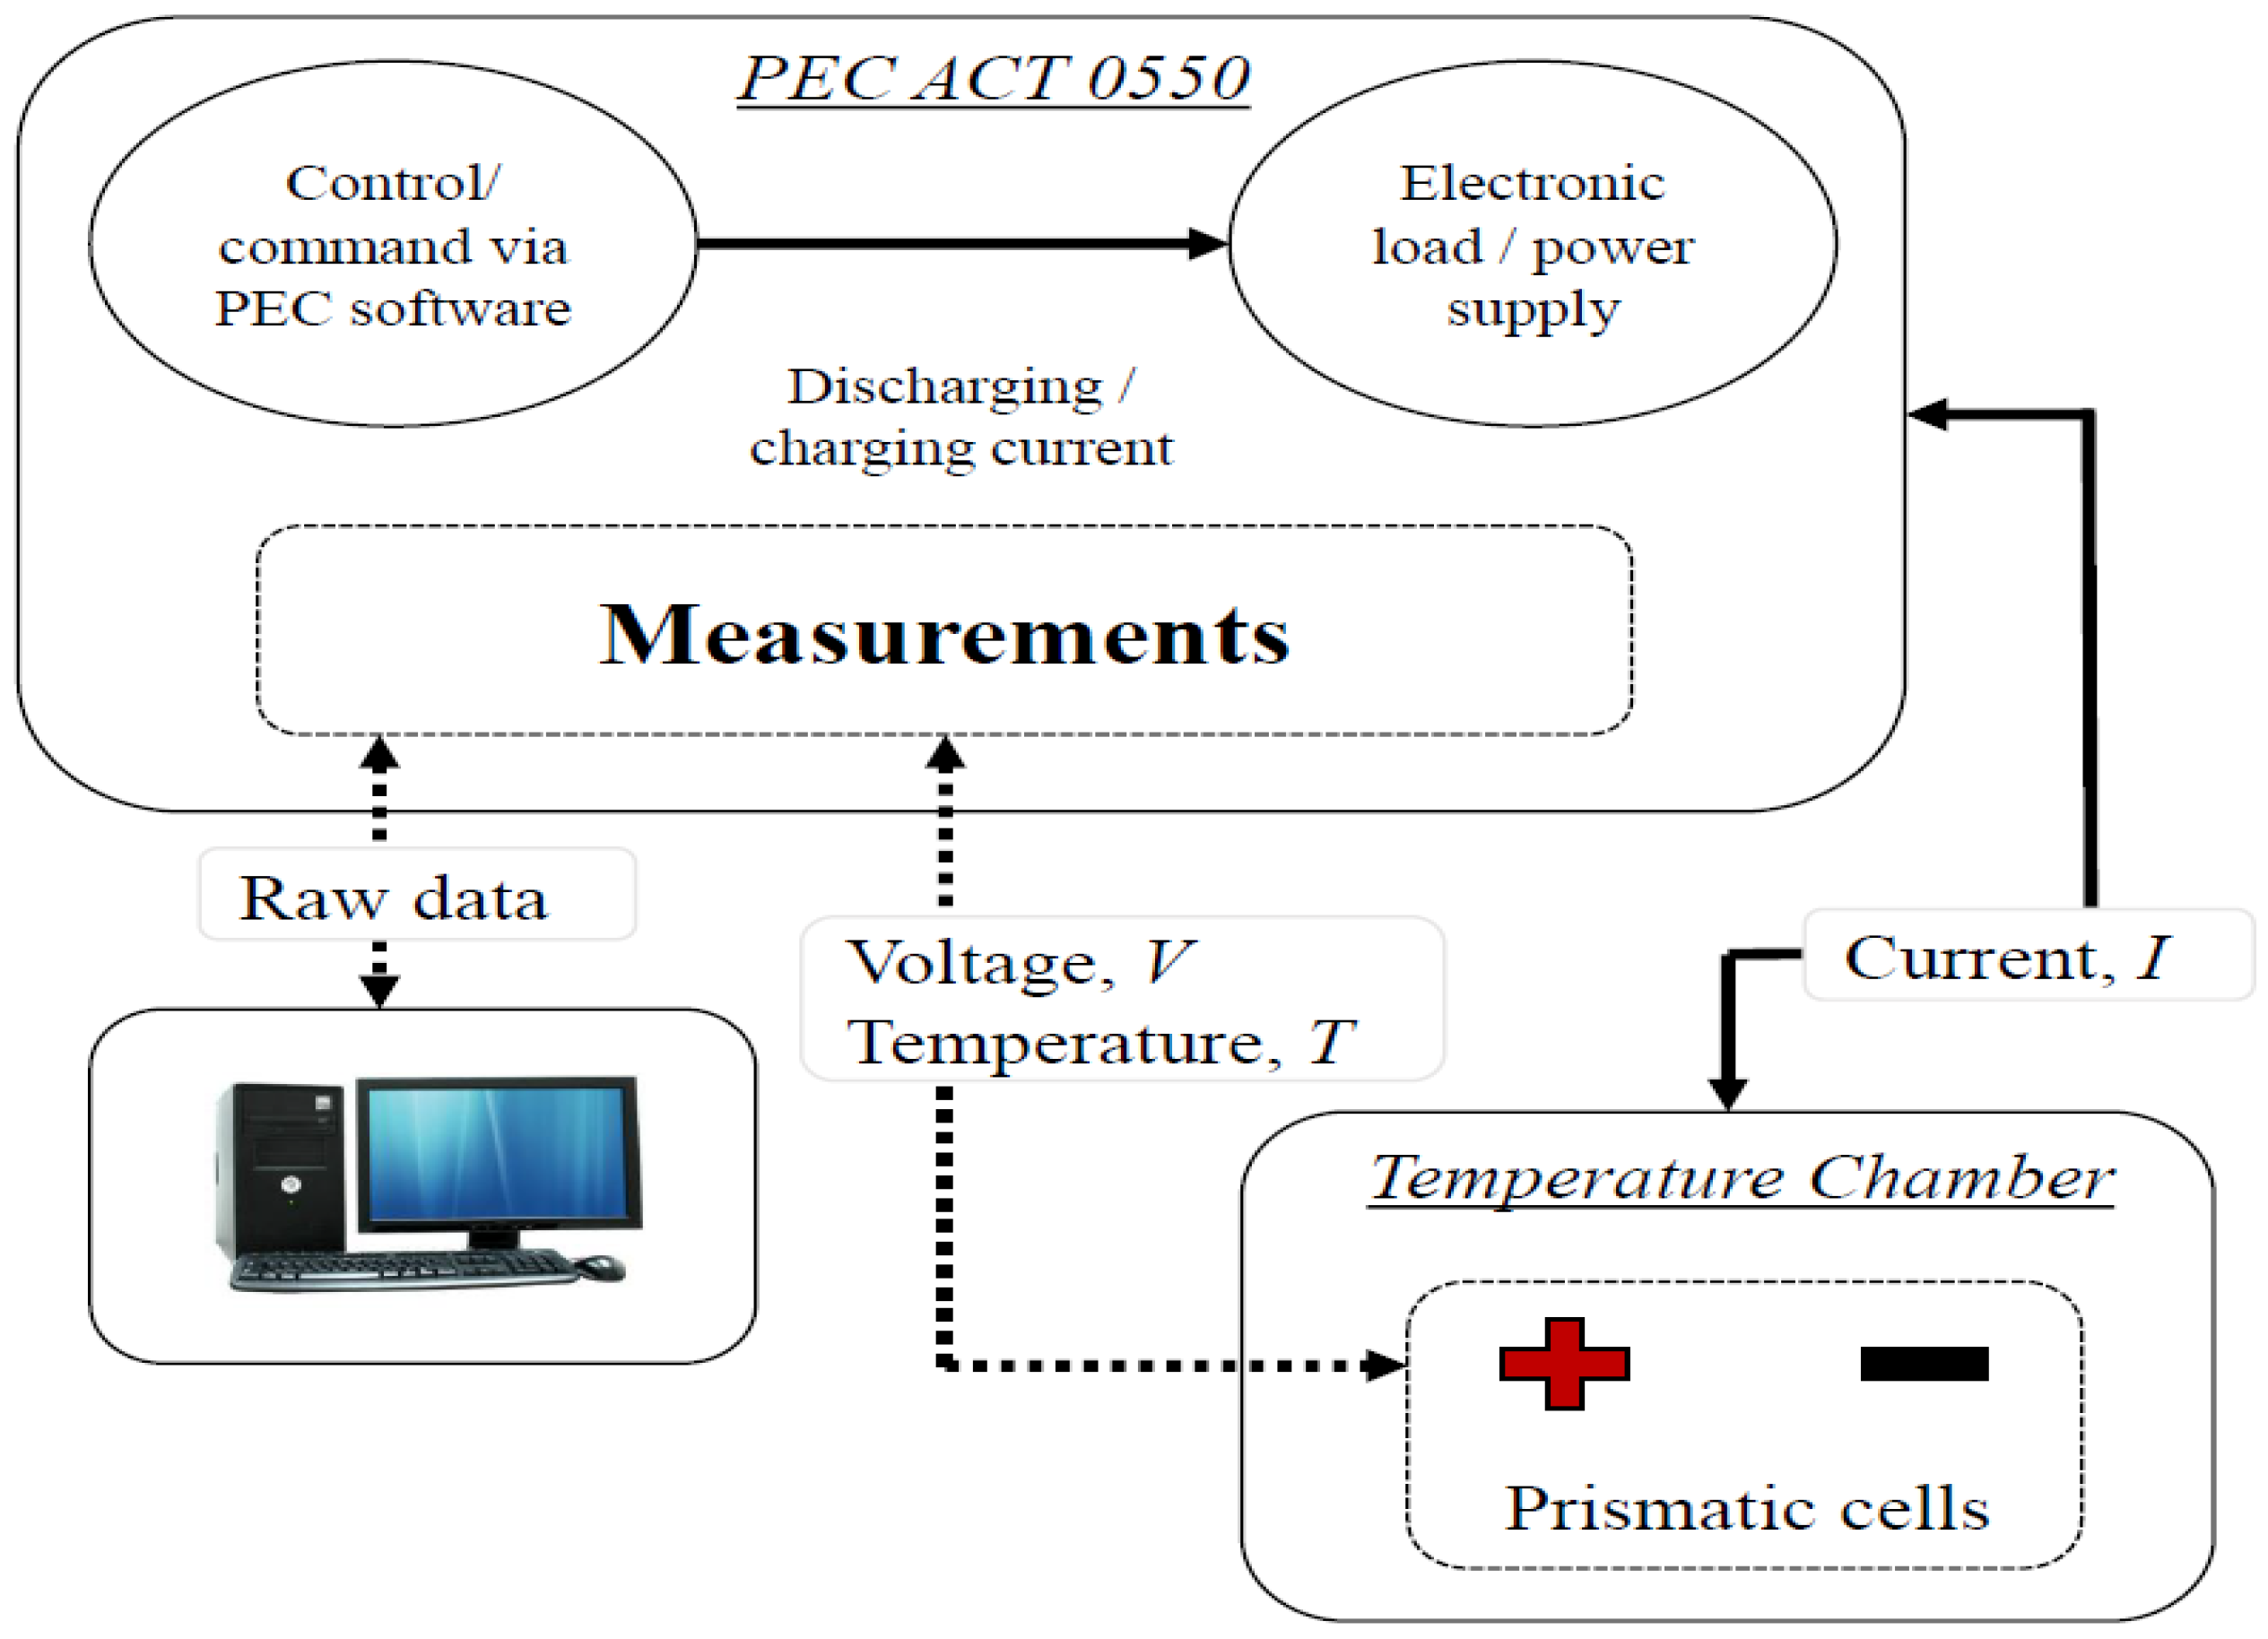
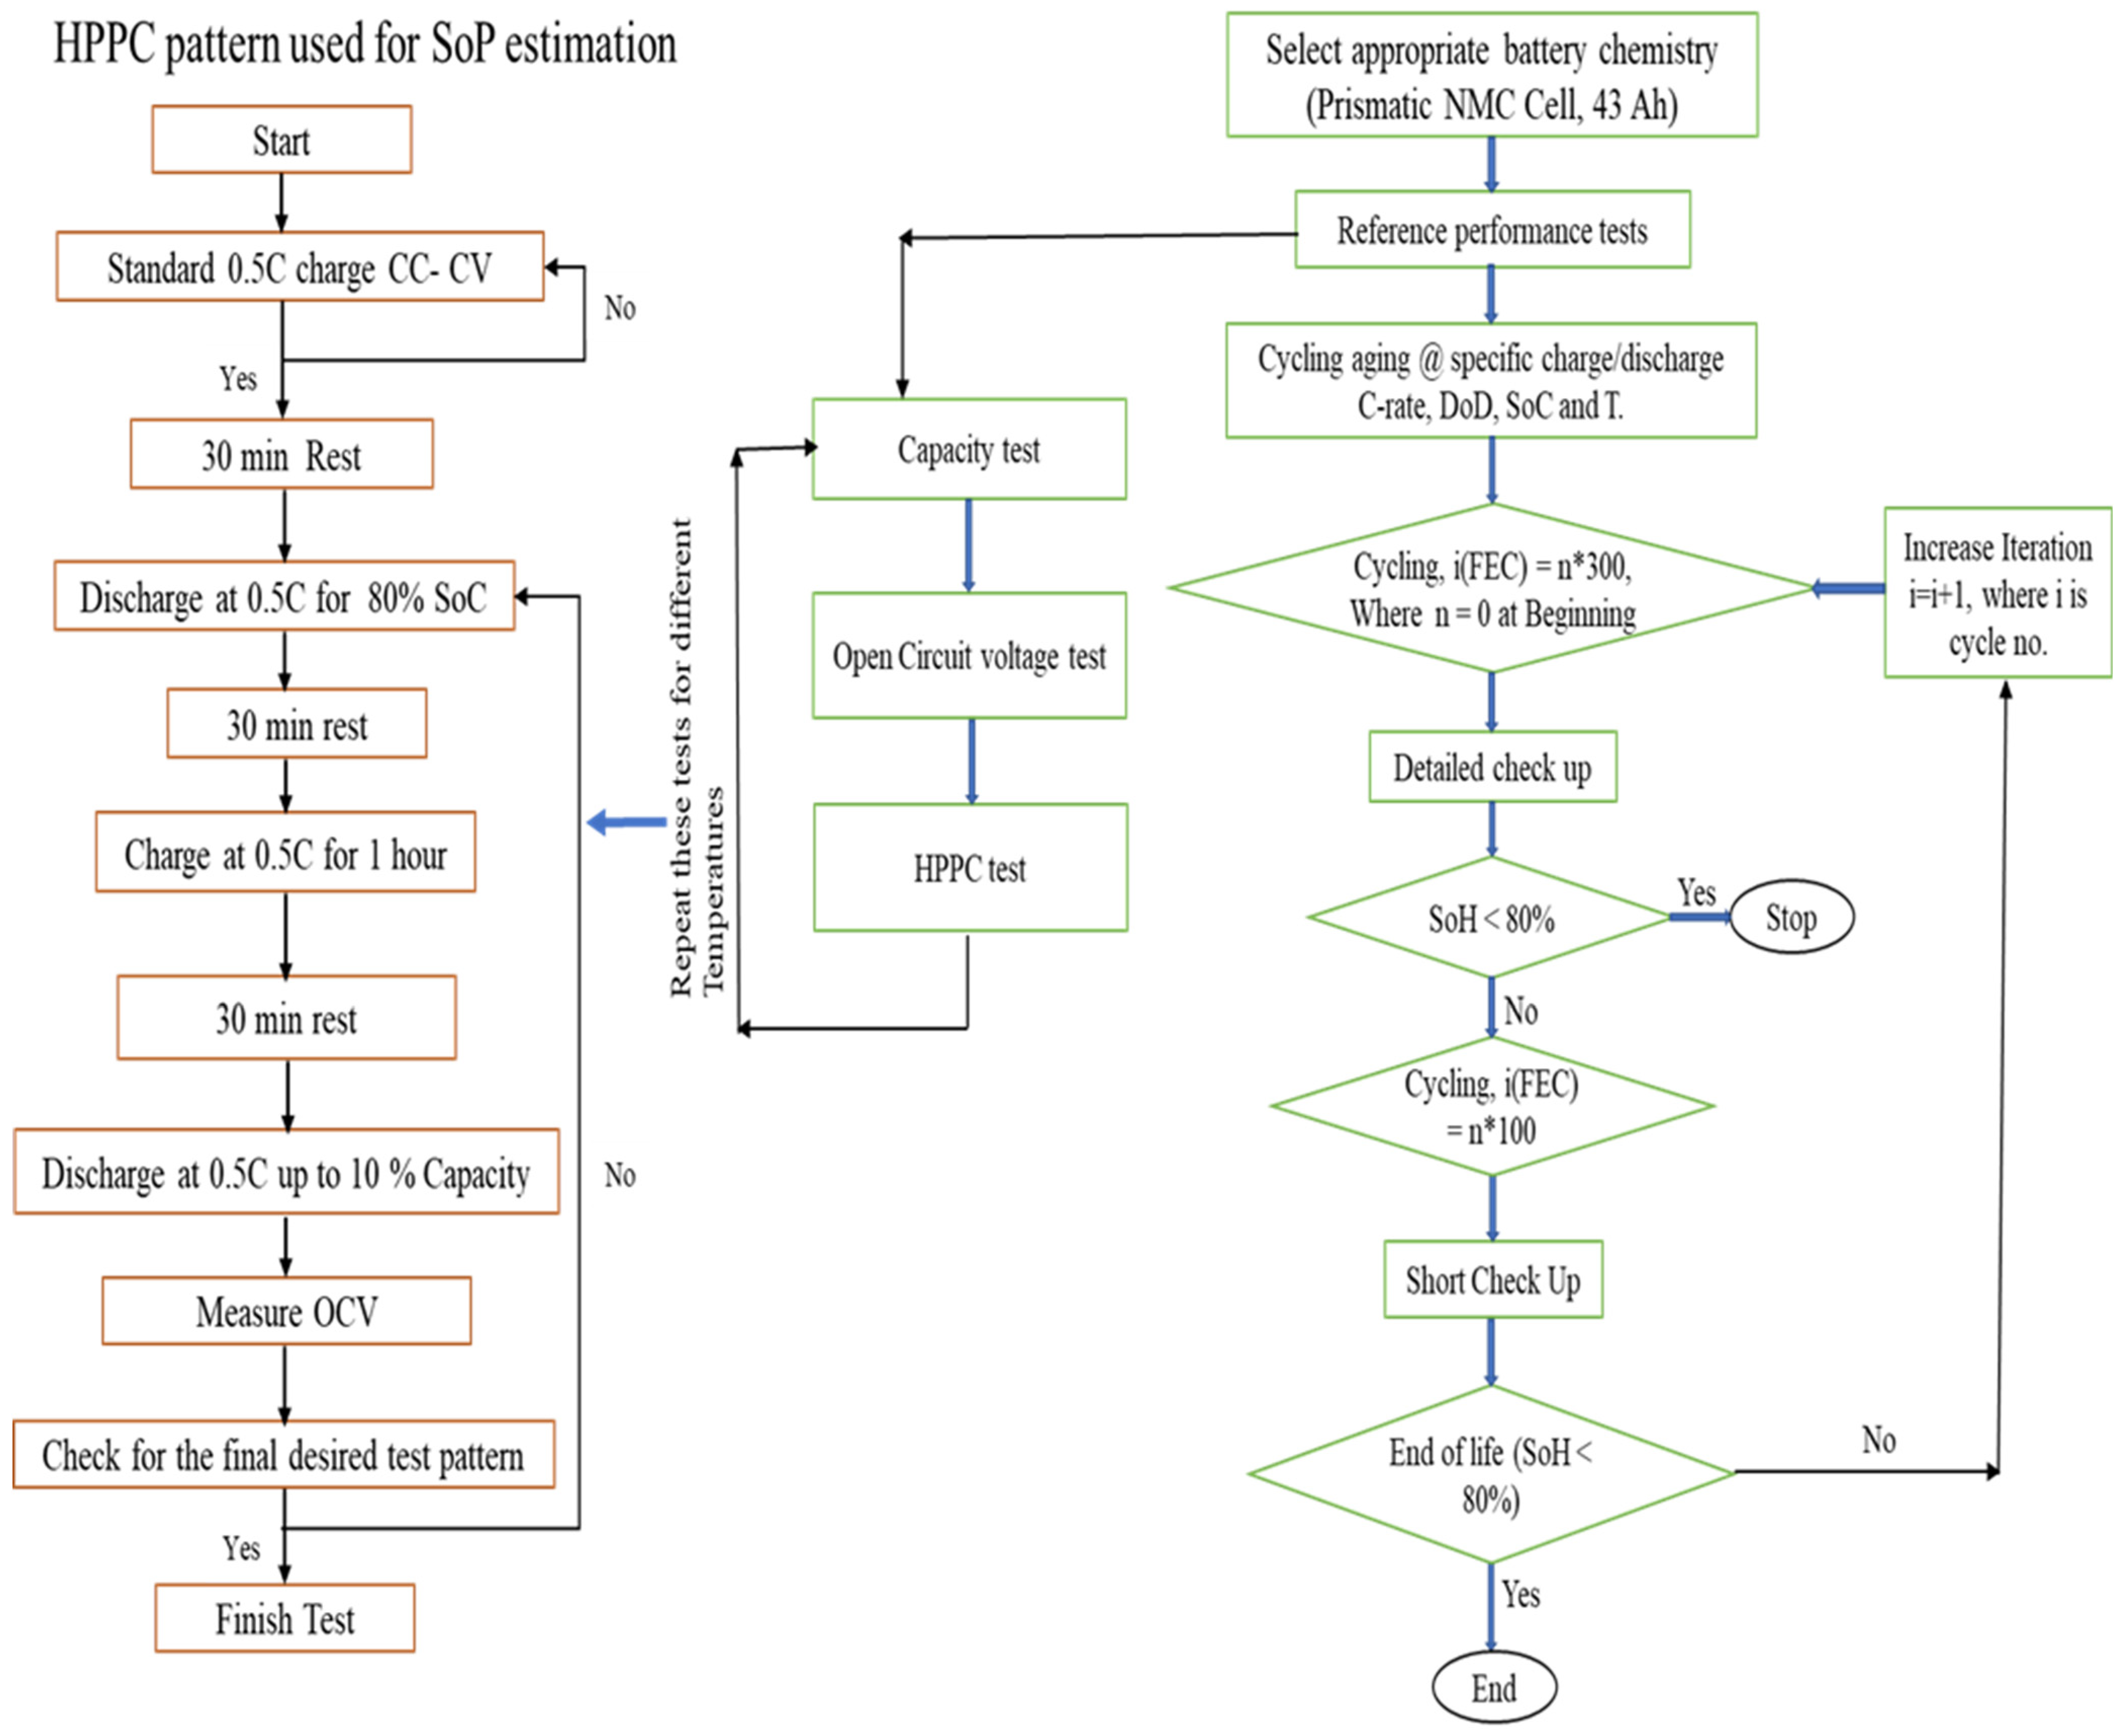
2. Experimental Setup

The remaining sections of the manuscript are organized as follows: Section 2 describes the experimental setup and parameter extraction. Section 3 discusses the model description, mathematical representation, and SoP model development. Section 4 presents the SoC and SoP estimation results and model validation; and finally, the conclusion is presented in Section 5.
The overall battery test was performed using an efficient characterization methodology for nickel-manganese-cobalt oxide (NMC)-based lithium-ion cells. The type of battery cell used for testing is a 43 Ah large-capacity cell made up of NMC/C-based cathode material and graphite anode. The battery cell under study is categorized as preferable for vehicular services as it retains the properties of high-power density of 1200 W/kg, 840 g weight, and nominal voltage of 3.6 V. Moreover, the operating voltage of the cell ranges from 3 to 4.2 V, dimensions of 27.5 mm × 148 mm × 91 mm, and internal resistance of ≤2 mΩ. During the test campaign, CTS custom climate chambers for controlling the temperature and PEC manufactured testers were used.
An average of eight HPPC tests with duration of 800 full equivalent cycles (FECs) were accomplished for all the four representative cells considered for the SoP estimation. The characterization of batteries at various environmental and battery state conditions, such as at different temperatures, state-of-charge, and current rates, were performed. The battery model development procedure consists of a series of standard testing procedures used to capture the electrical and thermal behaviors efficiently. The electrothermal characterization procedure mainly incorporates the capacity, open-circuit voltage (OCV), quasi-open-circuit voltage (qOCV), HPPC, and validation tests. Based on these characterization results, an electrothermal model is parametrized and developed for the determination of the cells’ dynamic behaviors.
In Figure 1, it can be seen that the battery tester performs the charge/discharge process and monitors the cell’s voltage, current, and temperature, and the climate chamber used to control the environmental temperature. The voltage, current, power, energy, cycle, and temperature are presented through the user interface.
This paper mainly deals with the development of the SoP estimation model, and therefore covers the SoP estimation and model validation based on the internal resistance increase. The proposed methodology incorporates the effect of resistance increase throughout the lifetime of the cells during the SoP estimation. The hybrid pulse power characterization (HPPC) test pattern used to find the resistance (R) and capacitance (C) parameters was analyzed. The internal resistance of the battery cells was extracted from the HPPC test conducted according to the defined test conditions of three different SoC points of 80%, 50%, and 20% with three different C-rates of 0.33 C, 0.5 C and 1 C [20]. The charge and discharge cycles were performed using predetermined current rate (C-rate) values with constant current–constant voltage (CC-CV) standard charging of cells. The summary of the overall electrothermal and aging characterization procedure is presented in Figure 2. In addition to the electrical characterization procedure, the standard aging test protocols were followed by checkup tests performed from BoL to EoL of the cells to find the internal resistance and capacity fade results throughout the life of the cells.
From Figure 2, it can be seen that two types of check-ups were performed during aging of the cells. The first check-up is the short check-up (SCU), which is performed every 100 cycles; and the second one is detailed check-up (DCU), performed every 300 FECs. The HPPC test is intended to measure the battery impedance using a test profile that incorporates both discharge and charge pulses. The primary objective of this test is to establish the internal resistance of the tested cell as a function of SoC. A representative figure showing the current pulses is presented in Figure S2 of the Supplementary Material provided separately. During the 10 s charge and discharge pulses, extended voltage limits were used. A preliminary simulation was performed using the different pulses and the electrical parameters needed for the model (R0, R1, C1, R2, and C2) were extracted. The methodology for the parameter extraction is explained in Section 2.2.
In addition to the HPPC test, OCV test is another important characterization test performed to provide the open-circuit voltage level of the cell. In this characterization test, the cell is first fully charged at 100% SoC with a C/2 current rate. During the test, the cell is resting for 3 h and the OCV is measured from the last voltage point. Then, it is discharged with C/2 for a 5% decrement of its total discharged capacity, rested for 3 h, and the OCV is measured for the new SoC. This process continues until the safety limit of the cell is reached (Vmin = 3 V). The last value is considered as the first point of charging the OCV, by which estimation starts with a similar way but with positive current until the upper safety limit of the battery cell (Vmax) is reached. An experimental result for 25 °C is shown in Figure S3 of the Supplementary Material.

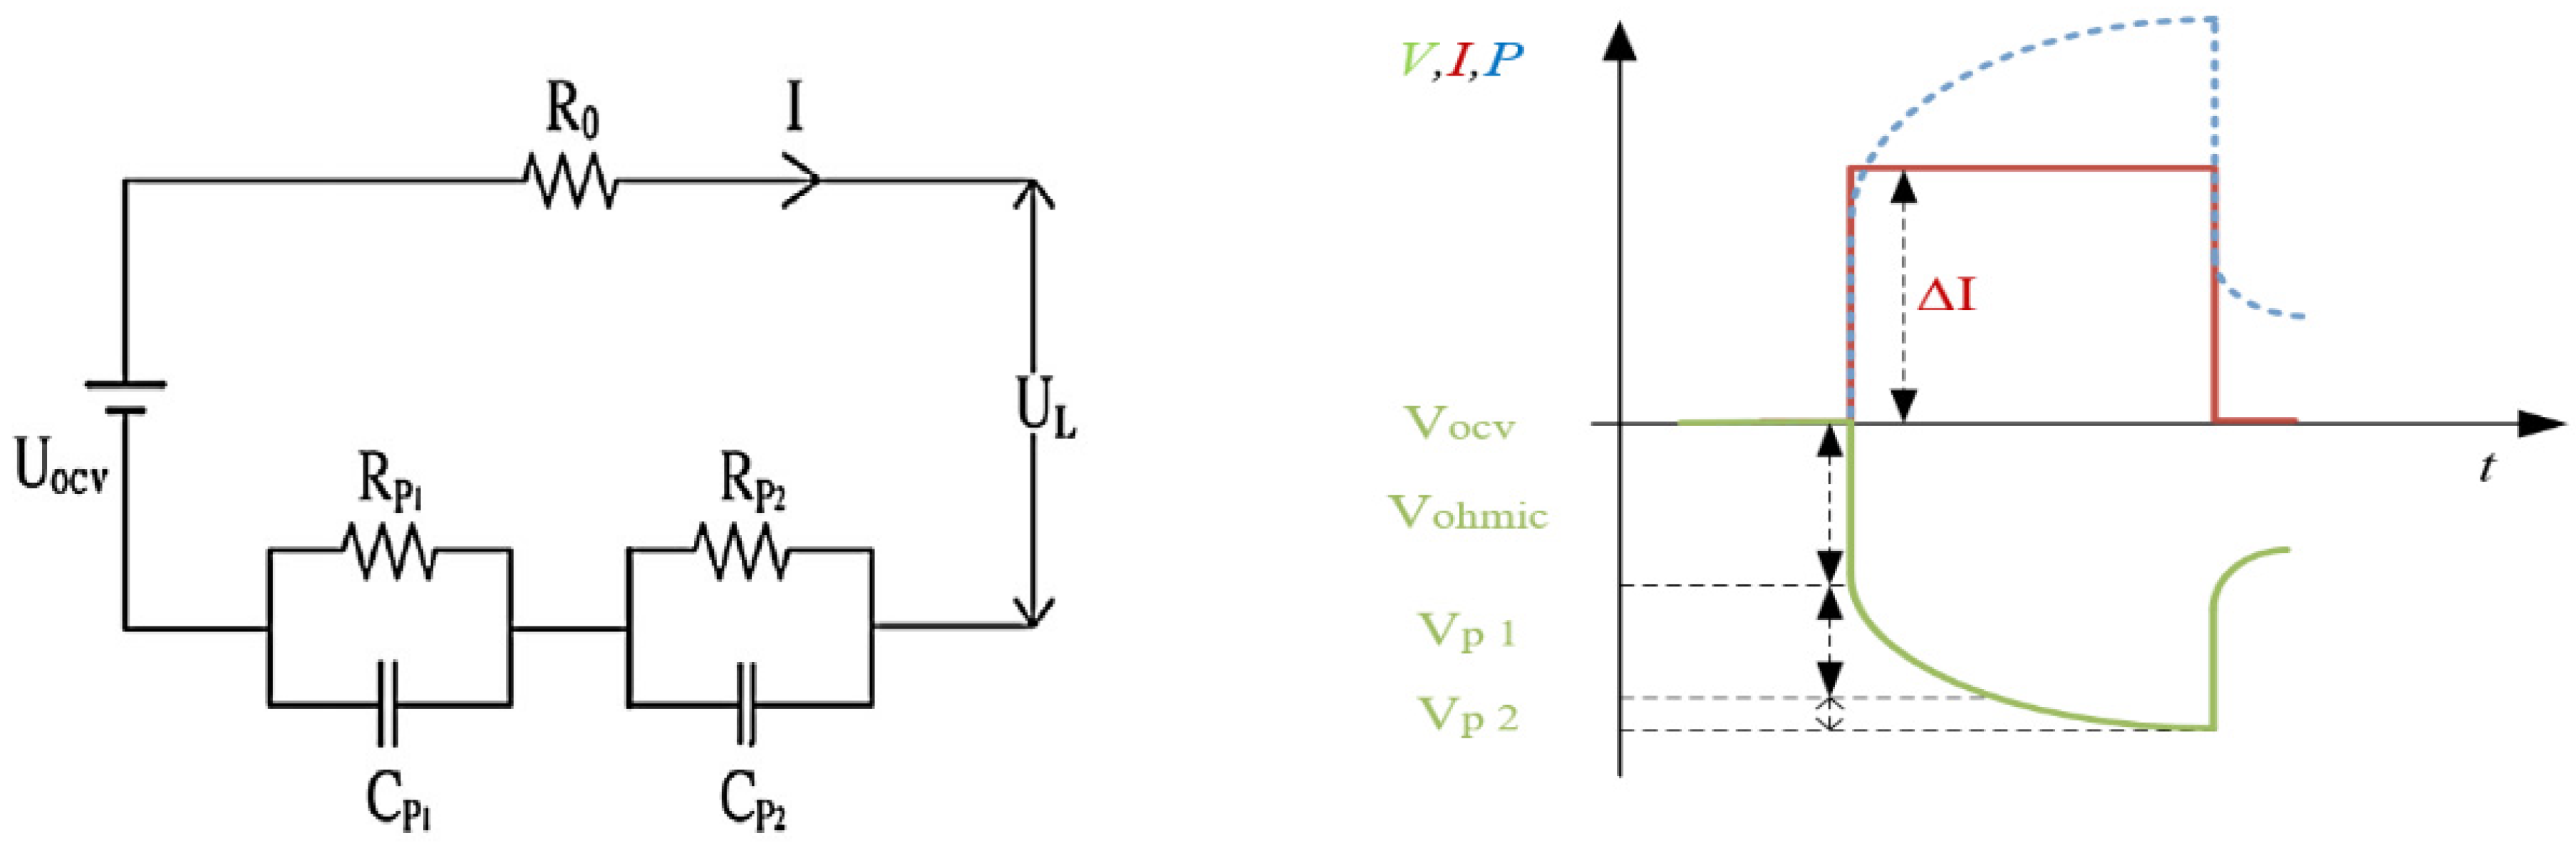
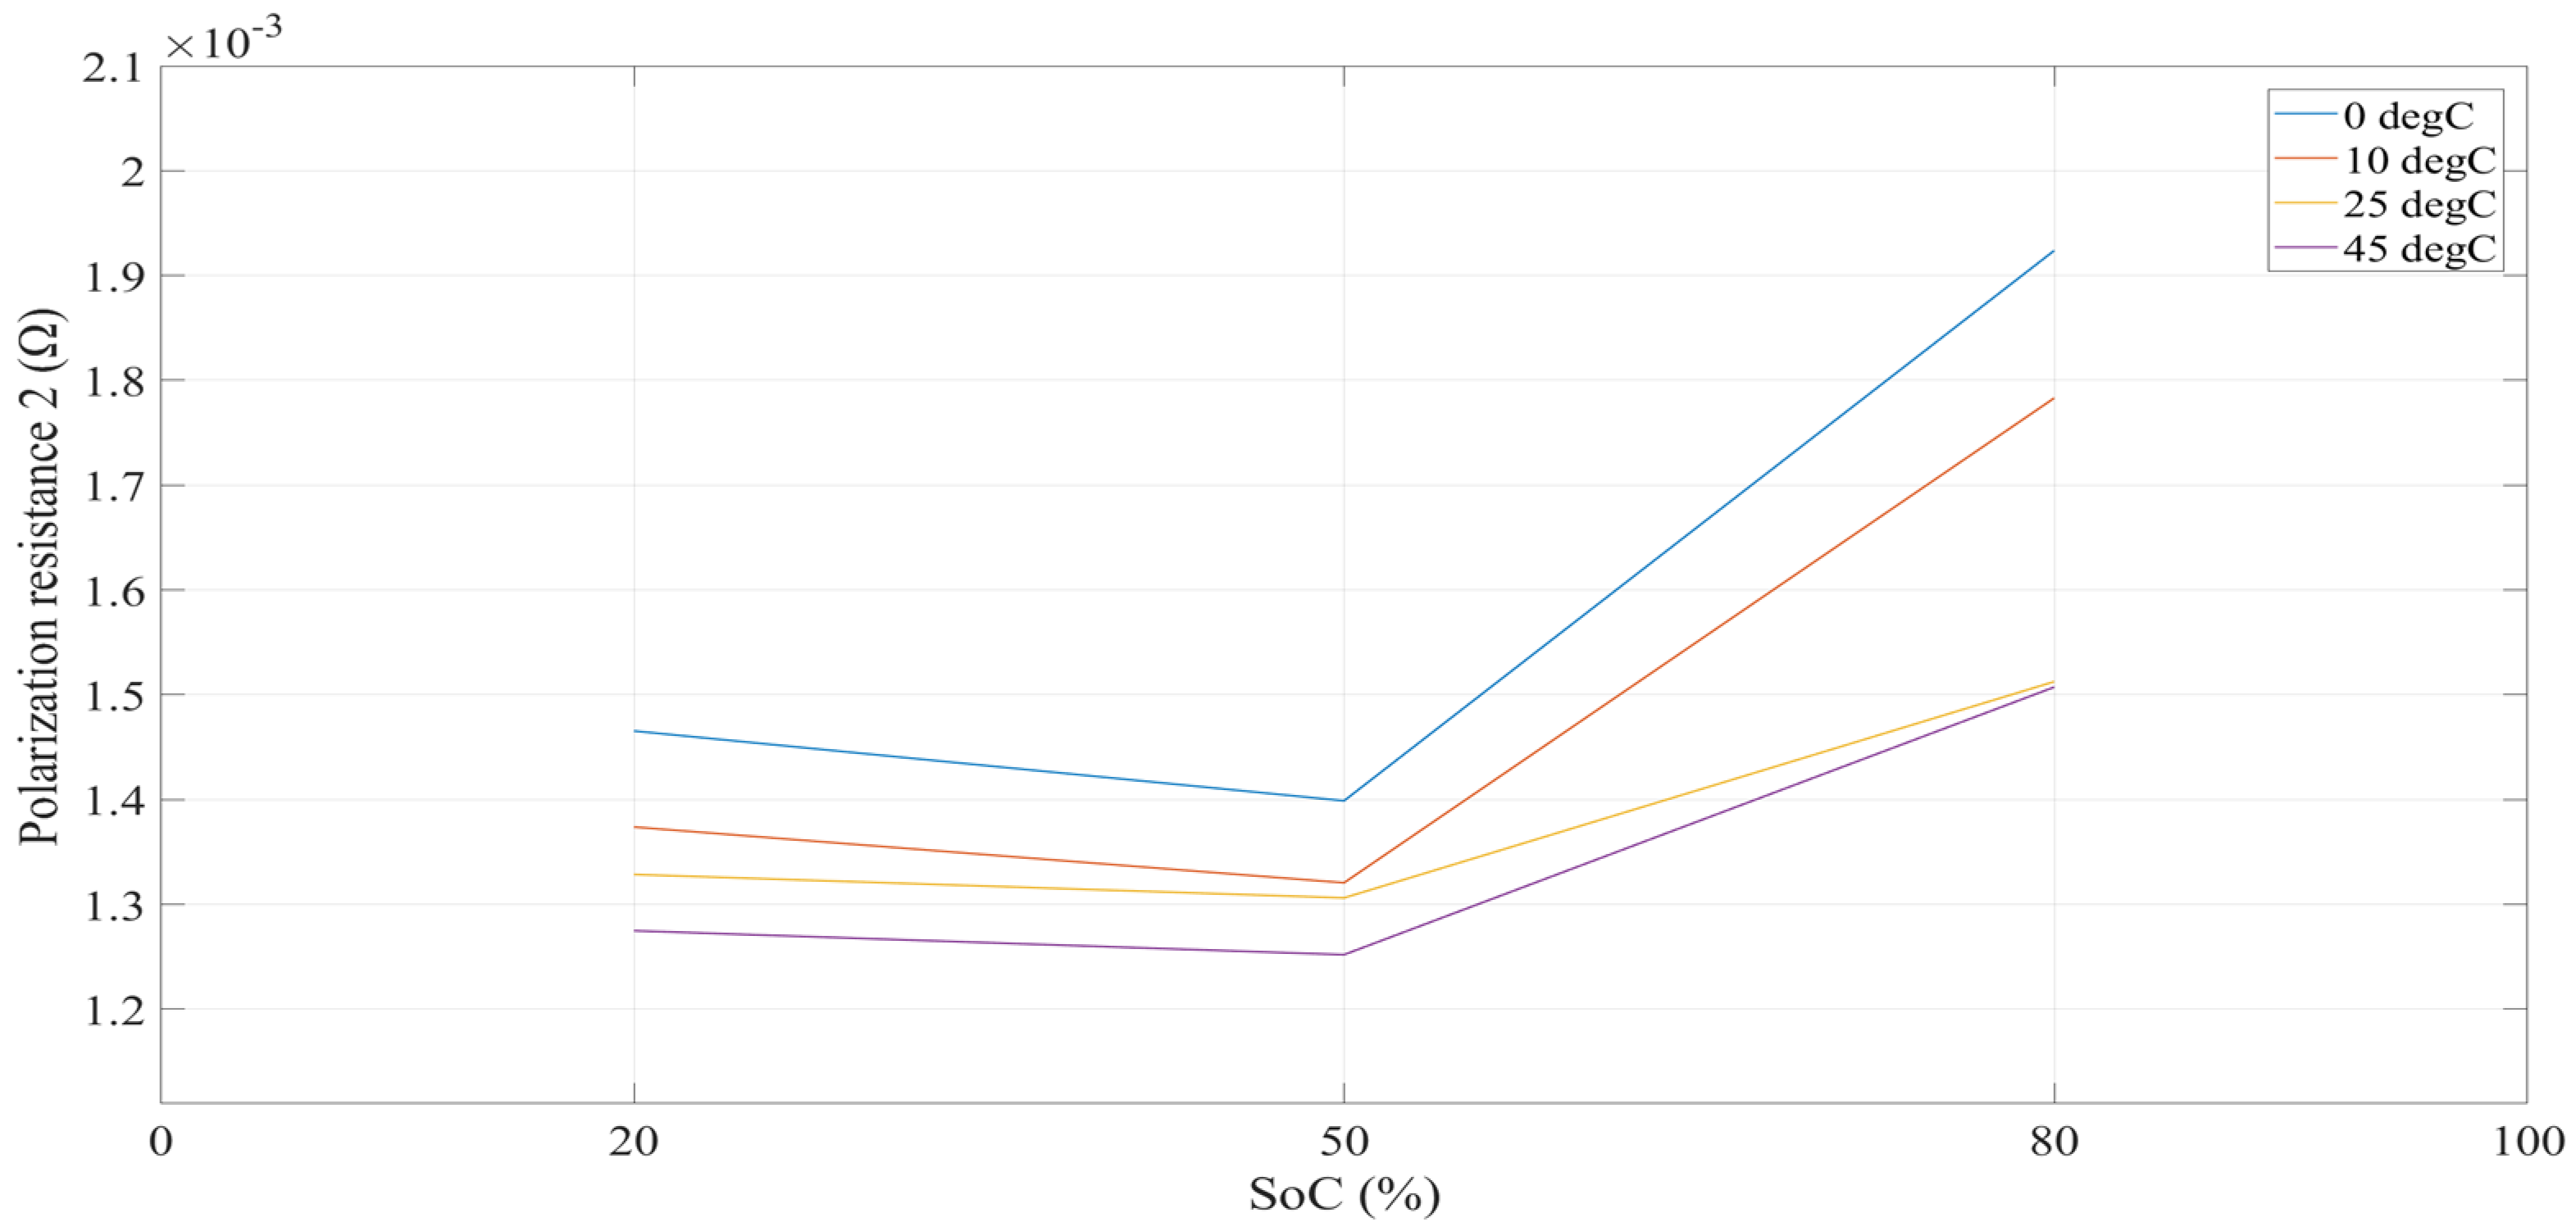
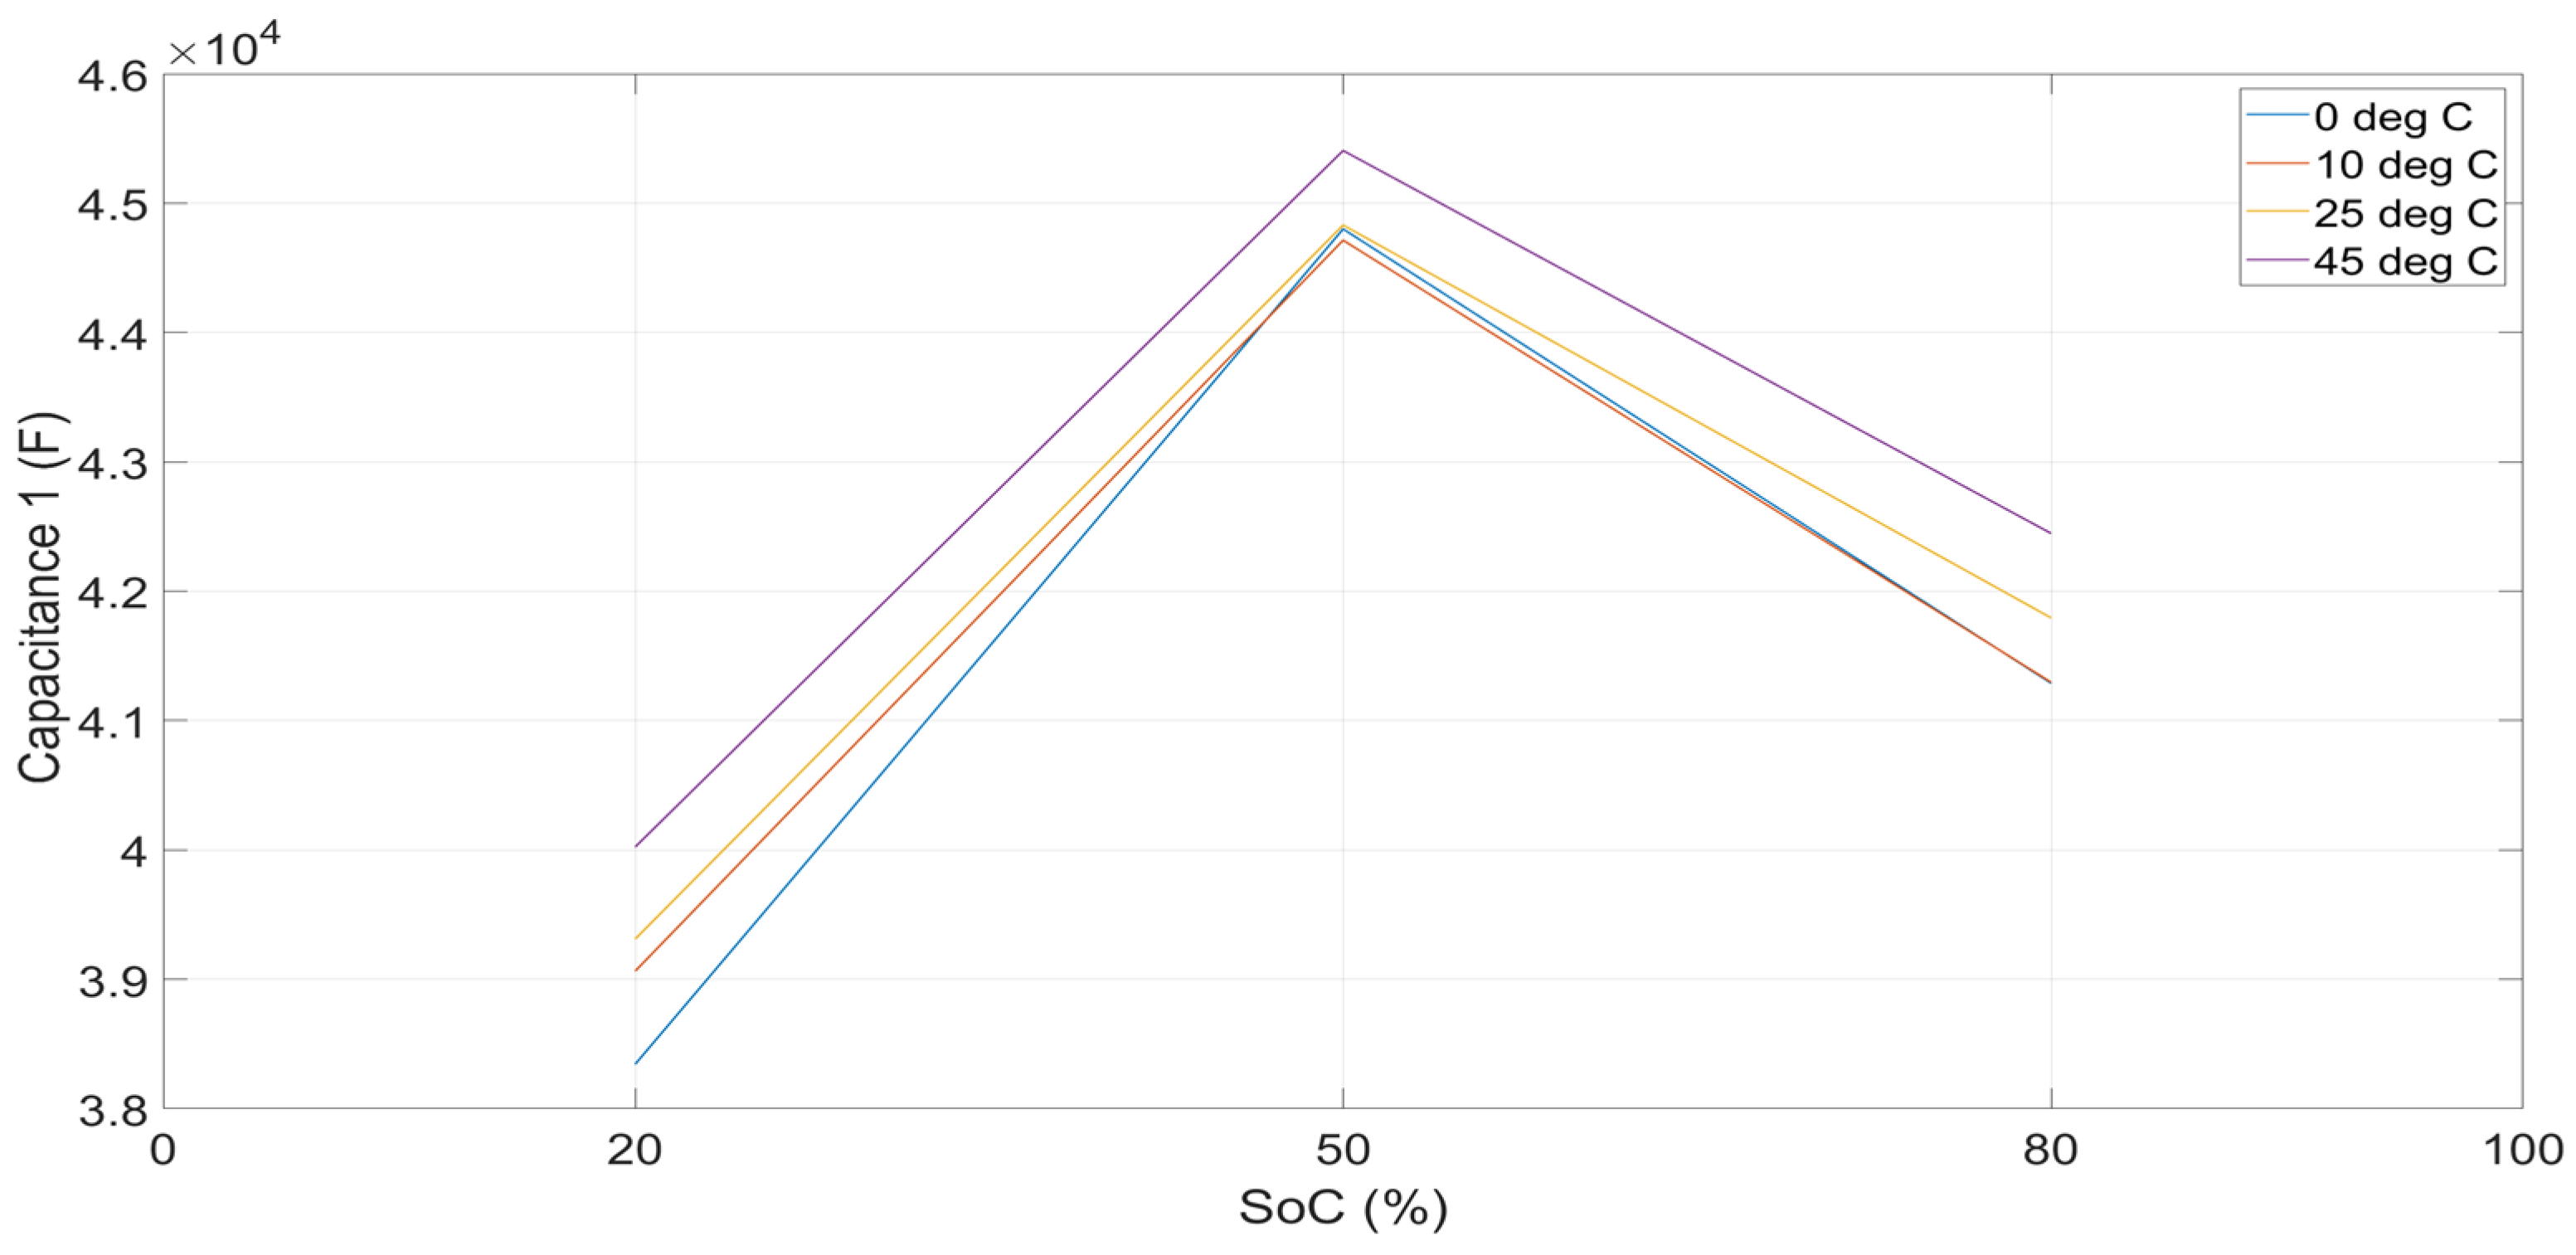
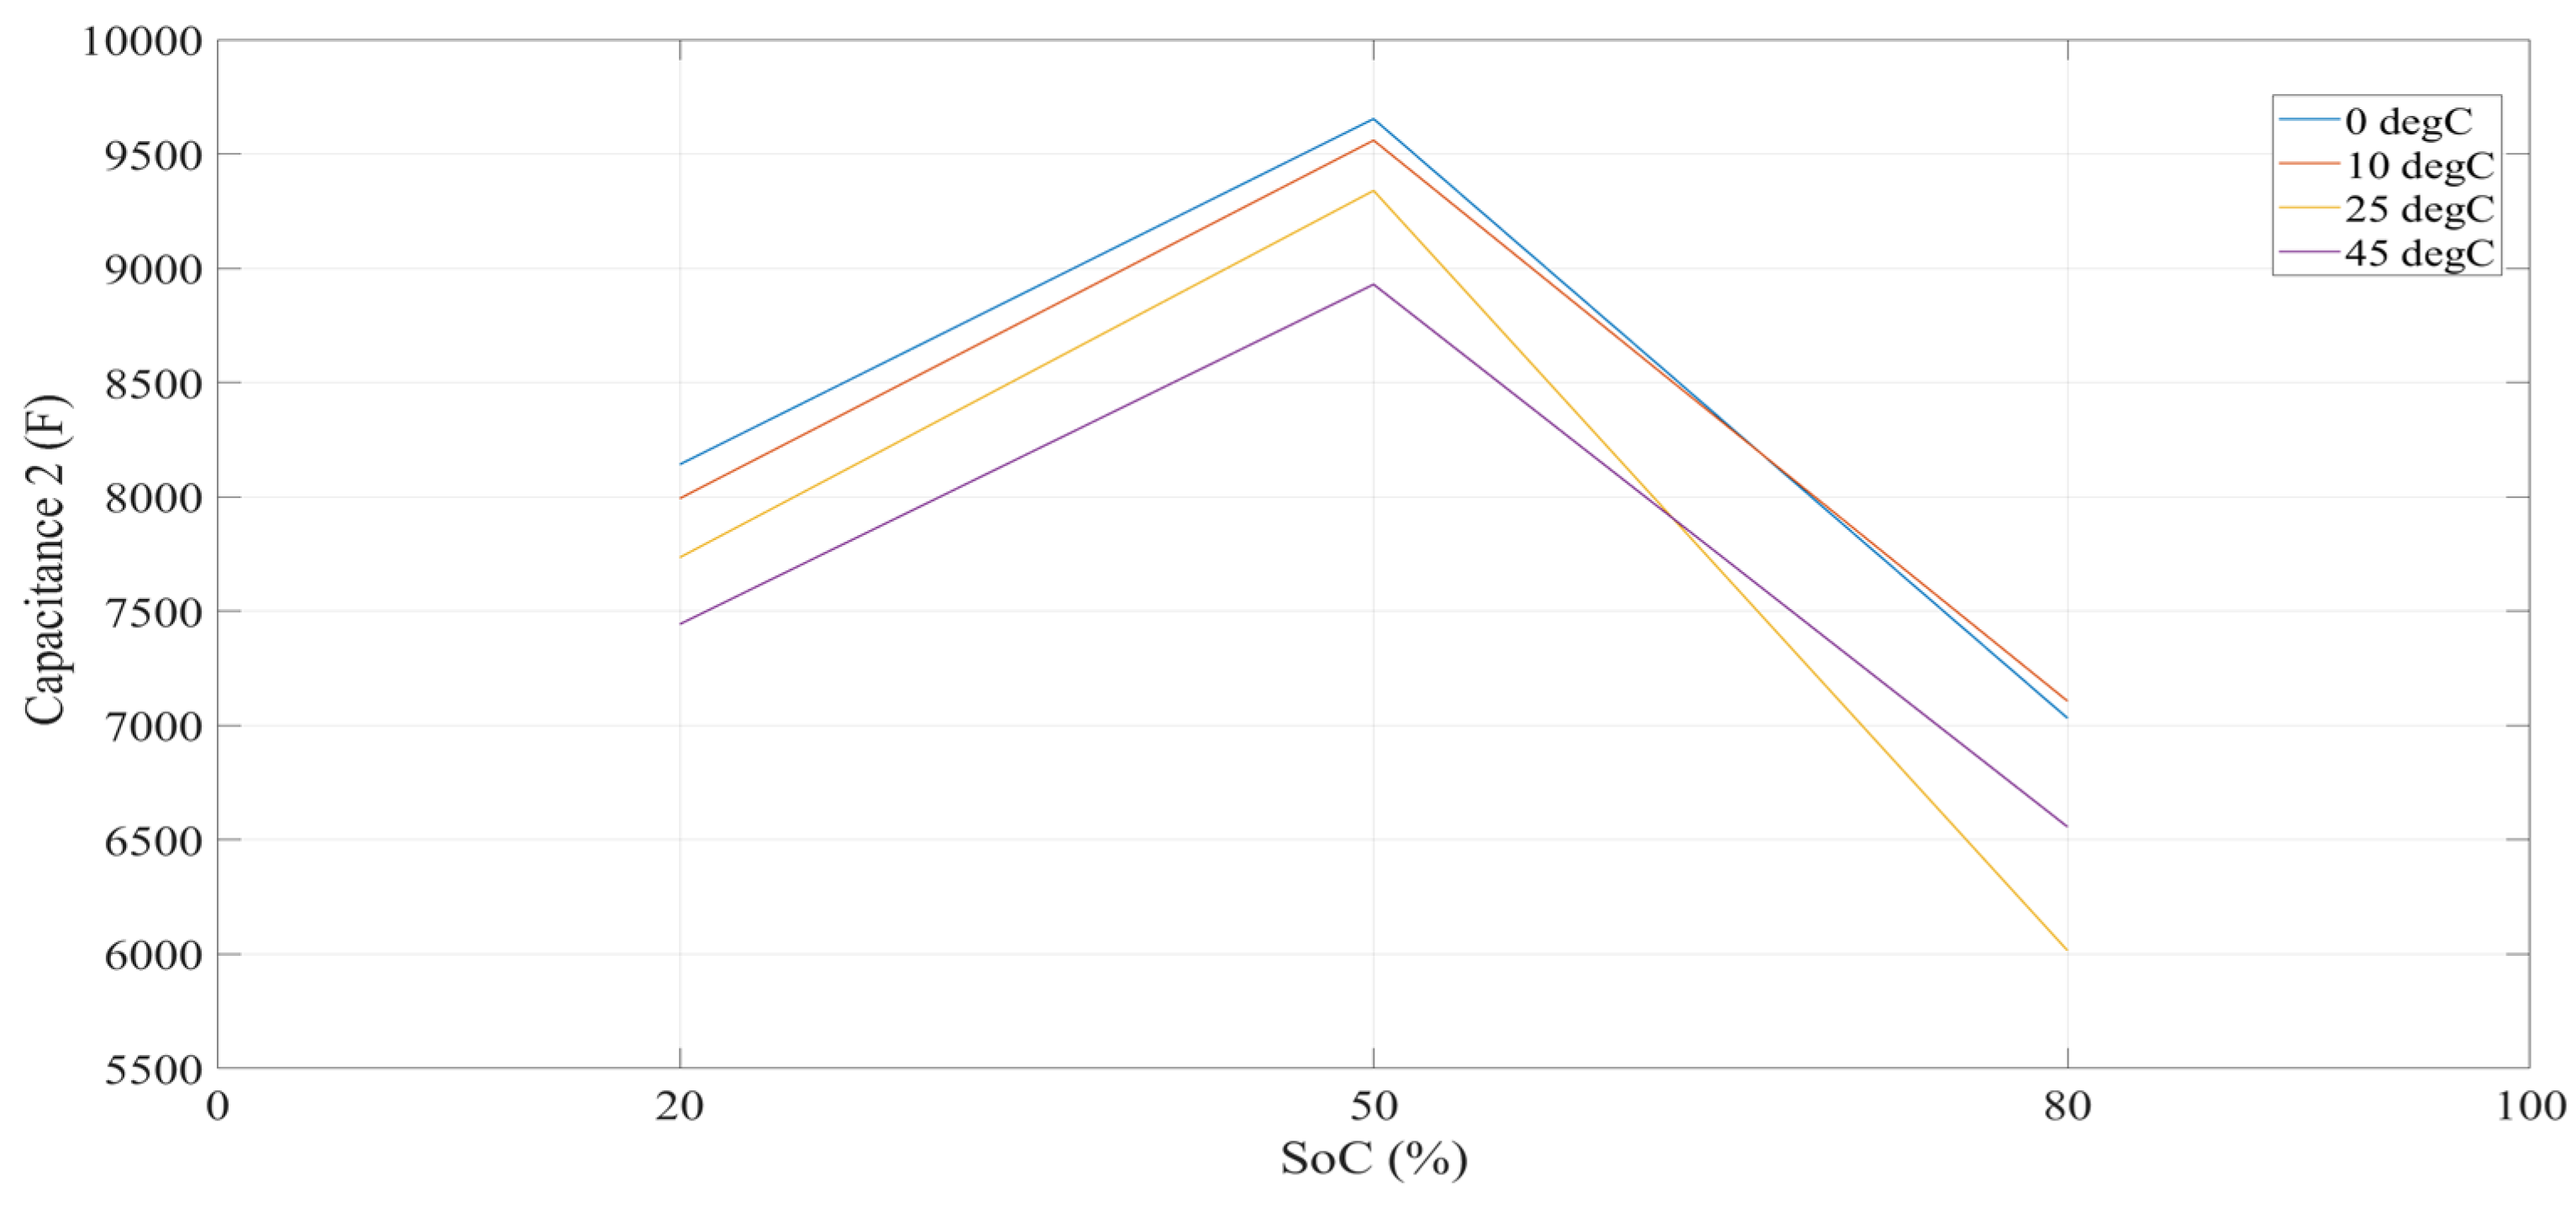
2.1. ECM Parameter Extraction

It is well-known that the SoC and SoH of the battery cells are the most crucial parameters needing accurate determination for effective operation and control of the BMS on the overall power system [21,22,23,24]. However, in this paper, the scope of the SoP model development is mainly dependent on accurate determination of SoC parameters, and therefore, the aspects related to SoH parameters will not be addressed. The total SoC is the sum of the state of charge due to both voltage and current effect. Primarily, the SoC can also be determined by using the coulomb-counting method defined by [25]:
SoC = SoC 0 1 C init I batt dt
where SoC0 is the initial state of charge of the cell and Ibatt is the battery current.
With the combined use of the coulomb counting and EKF methods, the total SoC can be estimated by considering the sum of SoC with voltage and current inputs. Both algorithms consider the current input, with the EKF considering both voltage and current as input. Therefore, total SoC at Kth time step is given by:
SoC k = SoC I , k + SoC V , k
where k stands for the time step, I stands for the current in (A), and V stands for the voltage in (V).

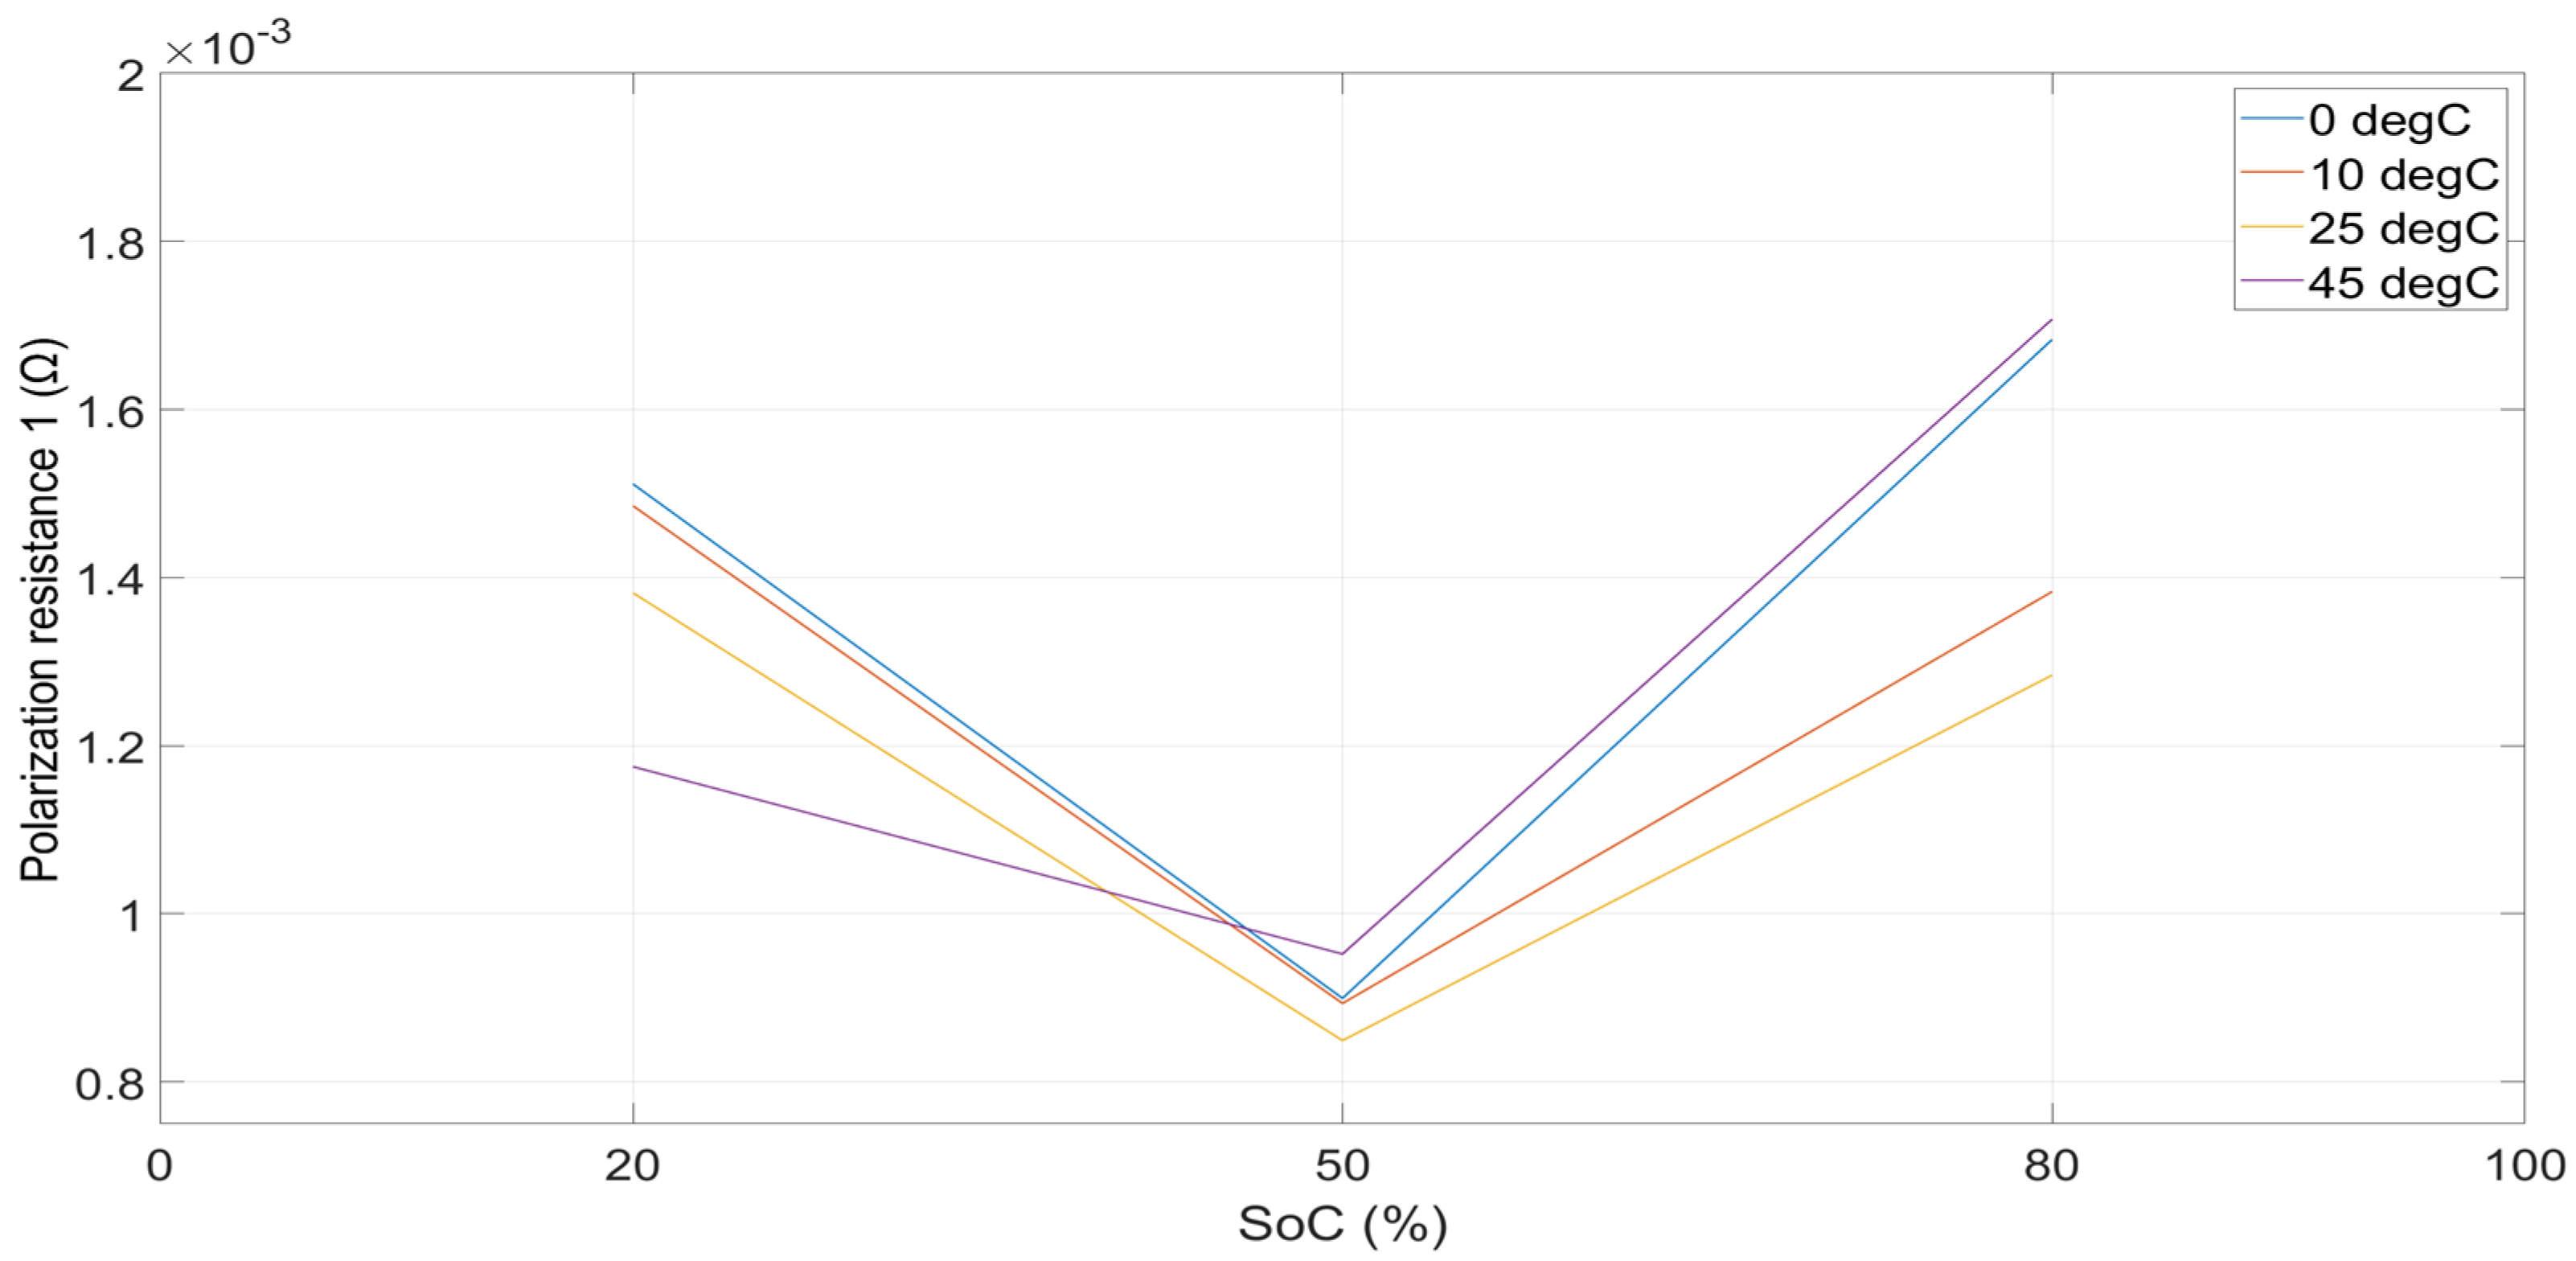
2.2. Table-Based Linear Interpolation (TBLI) Parameter Extraction

The ECM parameters, including R0, R1, C1, R2, and C2, are extracted at SoC_HPPC points of 20%, 50%, and 80% intervals using table-based linear interpolation (TBLI) method in account of the varying SoC values and C-rates. The temperature considered for this scenario is limited to 0 °C, 10 °C, 25 °C, and 45 °C. The electrochemical reaction responses during a current pulse are shown in Figure 3.
The HPPC characterization results with the values of R0, R1, C1, R2, C2 versus HPPC_SoC points at different temperatures are analyzed and presented below.
Figure 4, Figure 5, Figure 6, Figure 7 and Figure 8 show the HPPC characterization results with the values of R and C parameters at different temperature ranges. As shown in the figures, the ohmic resistance is higher at lower SoC levels and decreases with the increase in SoC level. Moreover, the result shows that in most of the cases, at a lower temperature, resistance is higher; and at higher temperature, resistance is found to be lower, which is coherent with the previous reports in [26,27].

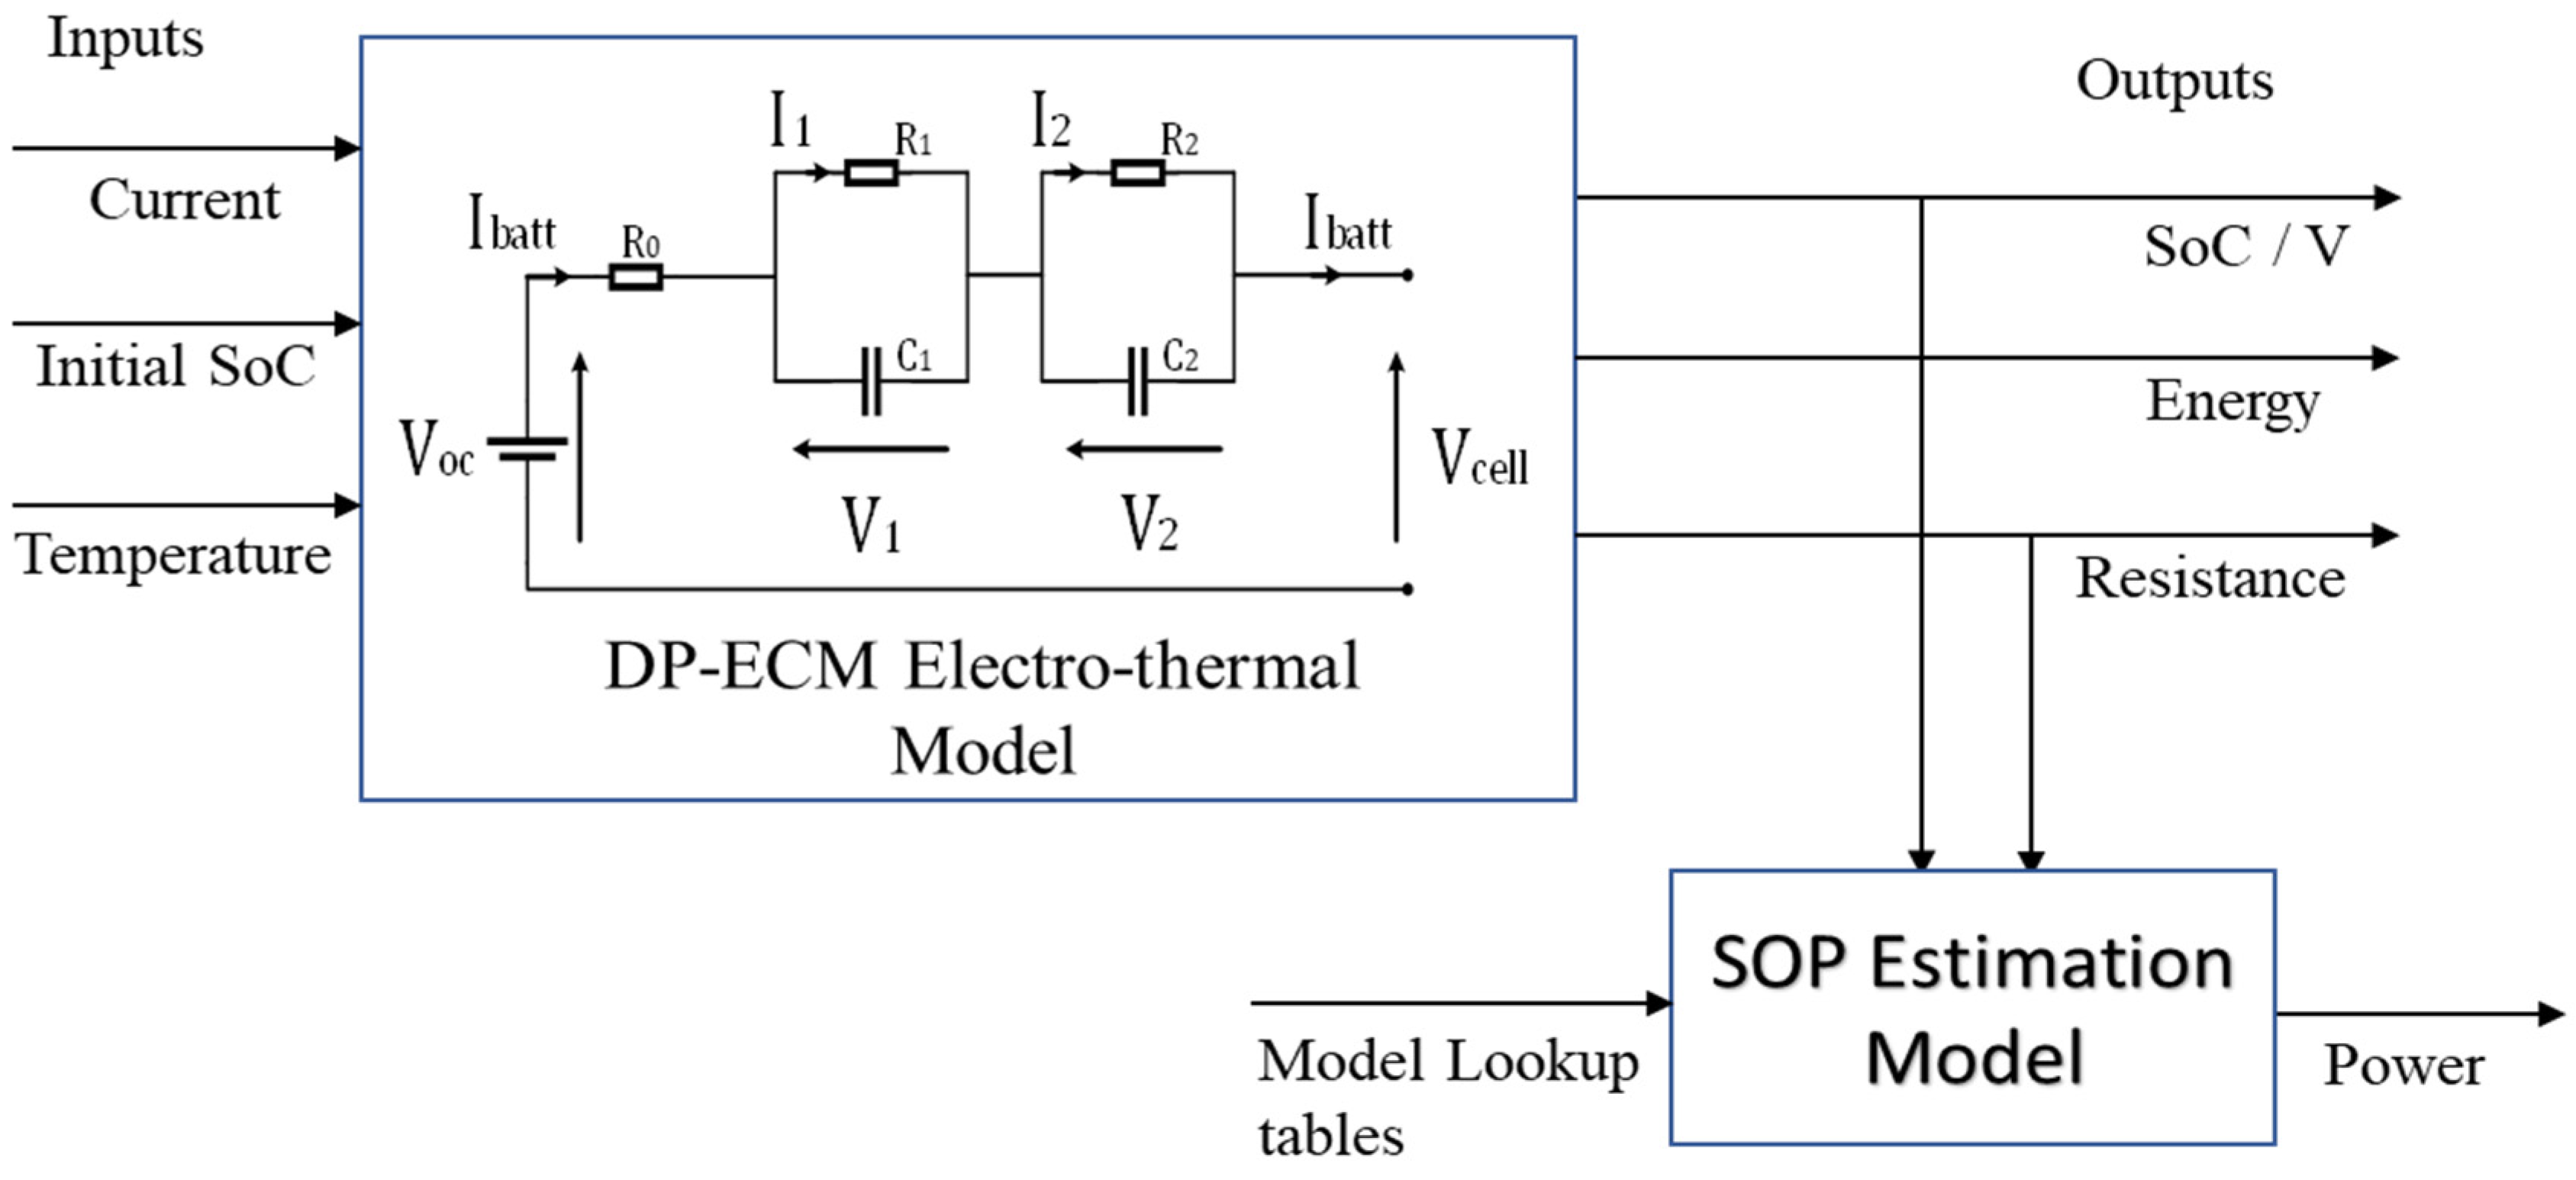
3. Model Description and Mathematical Representations

In addition to the SoP model, to identify the behaviors of the battery cell and find the electrical response, an electrothermal model is developed based on the Thevenin model [28] (Figure 3), which consists of a voltage source with an ohmic resistance and two parallel RC circuits. Based on the equivalent-circuit model, the battery output voltage of the Li-ion cell is the voltage drop resulting from the battery open-circuit voltage (OCV), the battery ohmic resistance (R0), and battery polarization impedances (R1C1, R2C2 circuits). The output voltage of the cell is given by [28,29]:
V cell = V oc   R 1 I 1   R 2 I 2 R 0 I batt
where Ibatt is the flowing current in the battery (A), I1 is the current passing in the polarization resistance (A), and I2 is the current flowing through the charge transfer resistance (A).
As shown in Figure 9, the current, initial SoC, and temperature are the inputs for the DP_ECM and its outputs are SoC, resistance, and energy. The resistance and SoC outputs are fed as an input to the SoP model together with lookup table parameters (cycling resistances and cycle numbers) and power is the output of the SoP model.

3.1. SoC Estimation

The total SoC at time t, which is described in Equations (1) and (2) of Section 2.1, can also be expressed as z(t), which can be expressed in terms of battery capacity as shown in Equation (4):
z t =   Q init + ƞ i 0 t Q norm t
where Q init is the initial battery capacity (Ah), ƞ is battery efficiency, Q norm is the current battery capacity (Ah), and i 0 is the load current passing through the ohmic resistor.

3.2. Proposed SoP Estimation Logic

To find out the SoP, the maximum discharge current first has to be defined, which is given by:
i max dis =   C rate Q norm
where C-rate is the current rate of the cell and Qnorm stands for the cell nominal capacity in Ah.
The maximum discharge current due to SoC at kth time step can be expressed as:
i max , k dis , SoC = ƞ C rate Q norm SoC k SoC min
where ƞ is cell efficiency, commonly taken as 1 at BoL.
On the other hand, the maximum discharge current due to voltage is given as:
i max , k dis ,   volt = i 0 , k V ocv V min 1 V ocv V min + 1 V max V ocv V min
where Vocv is the open-circuit voltage (V) at the SoC value of the Kth time step, Vmin is the minimum cell voltage and Vmax is the maximum cell voltage, and i0,k is the load current at the Kth time step. For the battery cell under study, the following parameter values are considered.
Here, Vmax = 4.2 V and Vmin = 3 V, SoCmin = 0.1, SoCmax = 1, Qnorm = 43 Ah, Crate = 1 C.
i max , k dis = min i max dis , i max , k dis , SoC , i max , k dis ,   volt
The maximum power where the cell could perform is also defined as:
P max dis = V max i max dis
Finally, the maximum discharge power P max , k   dis is defined as the function of the discharge current, voltage, and discharge resistance parameters.
P max , k   dis = min P max dis ,   i max , k dis V ocv i max , k dis R dis

3.3. SoP Estimation Model Development

The overall model is developed based on MATLAB/Simulink environment. The objective of the model development is to determine the SoP of the cell in relation to the internal resistance increase not only at BoL, but also throughout its lifetime for consideration of the aging effects. The model is a coupled model combined with electrothermal and SoP models. The electrothermal is used to reproduce the cell’s electrical performances/behaviors, whereas the SoP model is used for the estimation of the SoP parameter crucial for the BMS. The SoP estimation model is developed based on Equations (5)–(10), parameterized using SoC, voltage, temperature, and current experimental data found from the test result. Using the electrothermal model output of these parameters, input of lookup table is provided to the SoP model and then maximum discharge current and discharge resistances are calculated. Finally, the SoP throughout the lifetime of the cell condition is estimated.
The estimation of SoP through lifetime until EoL condition is estimated by defining the range of equivalent cycles and internal resistance increase parameters. The reference resistance increase at EoL is estimated using the rate of internal resistance (Ri) increase at 50% SoC. The total Ri increase rate is estimated by using the combined effect of the FECs, the resistance cycle (estimated using the difference between two consecutive Ri values), and the cycle test resistance values. To find out the total Ri, and hence estimate SoP at EoL condition, first the rate of Ri increase is multiplied with Ri value at BoL condition. Finally, using the respective current rate and total resistance increase, the SoP output of the cell is estimated until its EoL.

4. Results, Validations, and Discussions

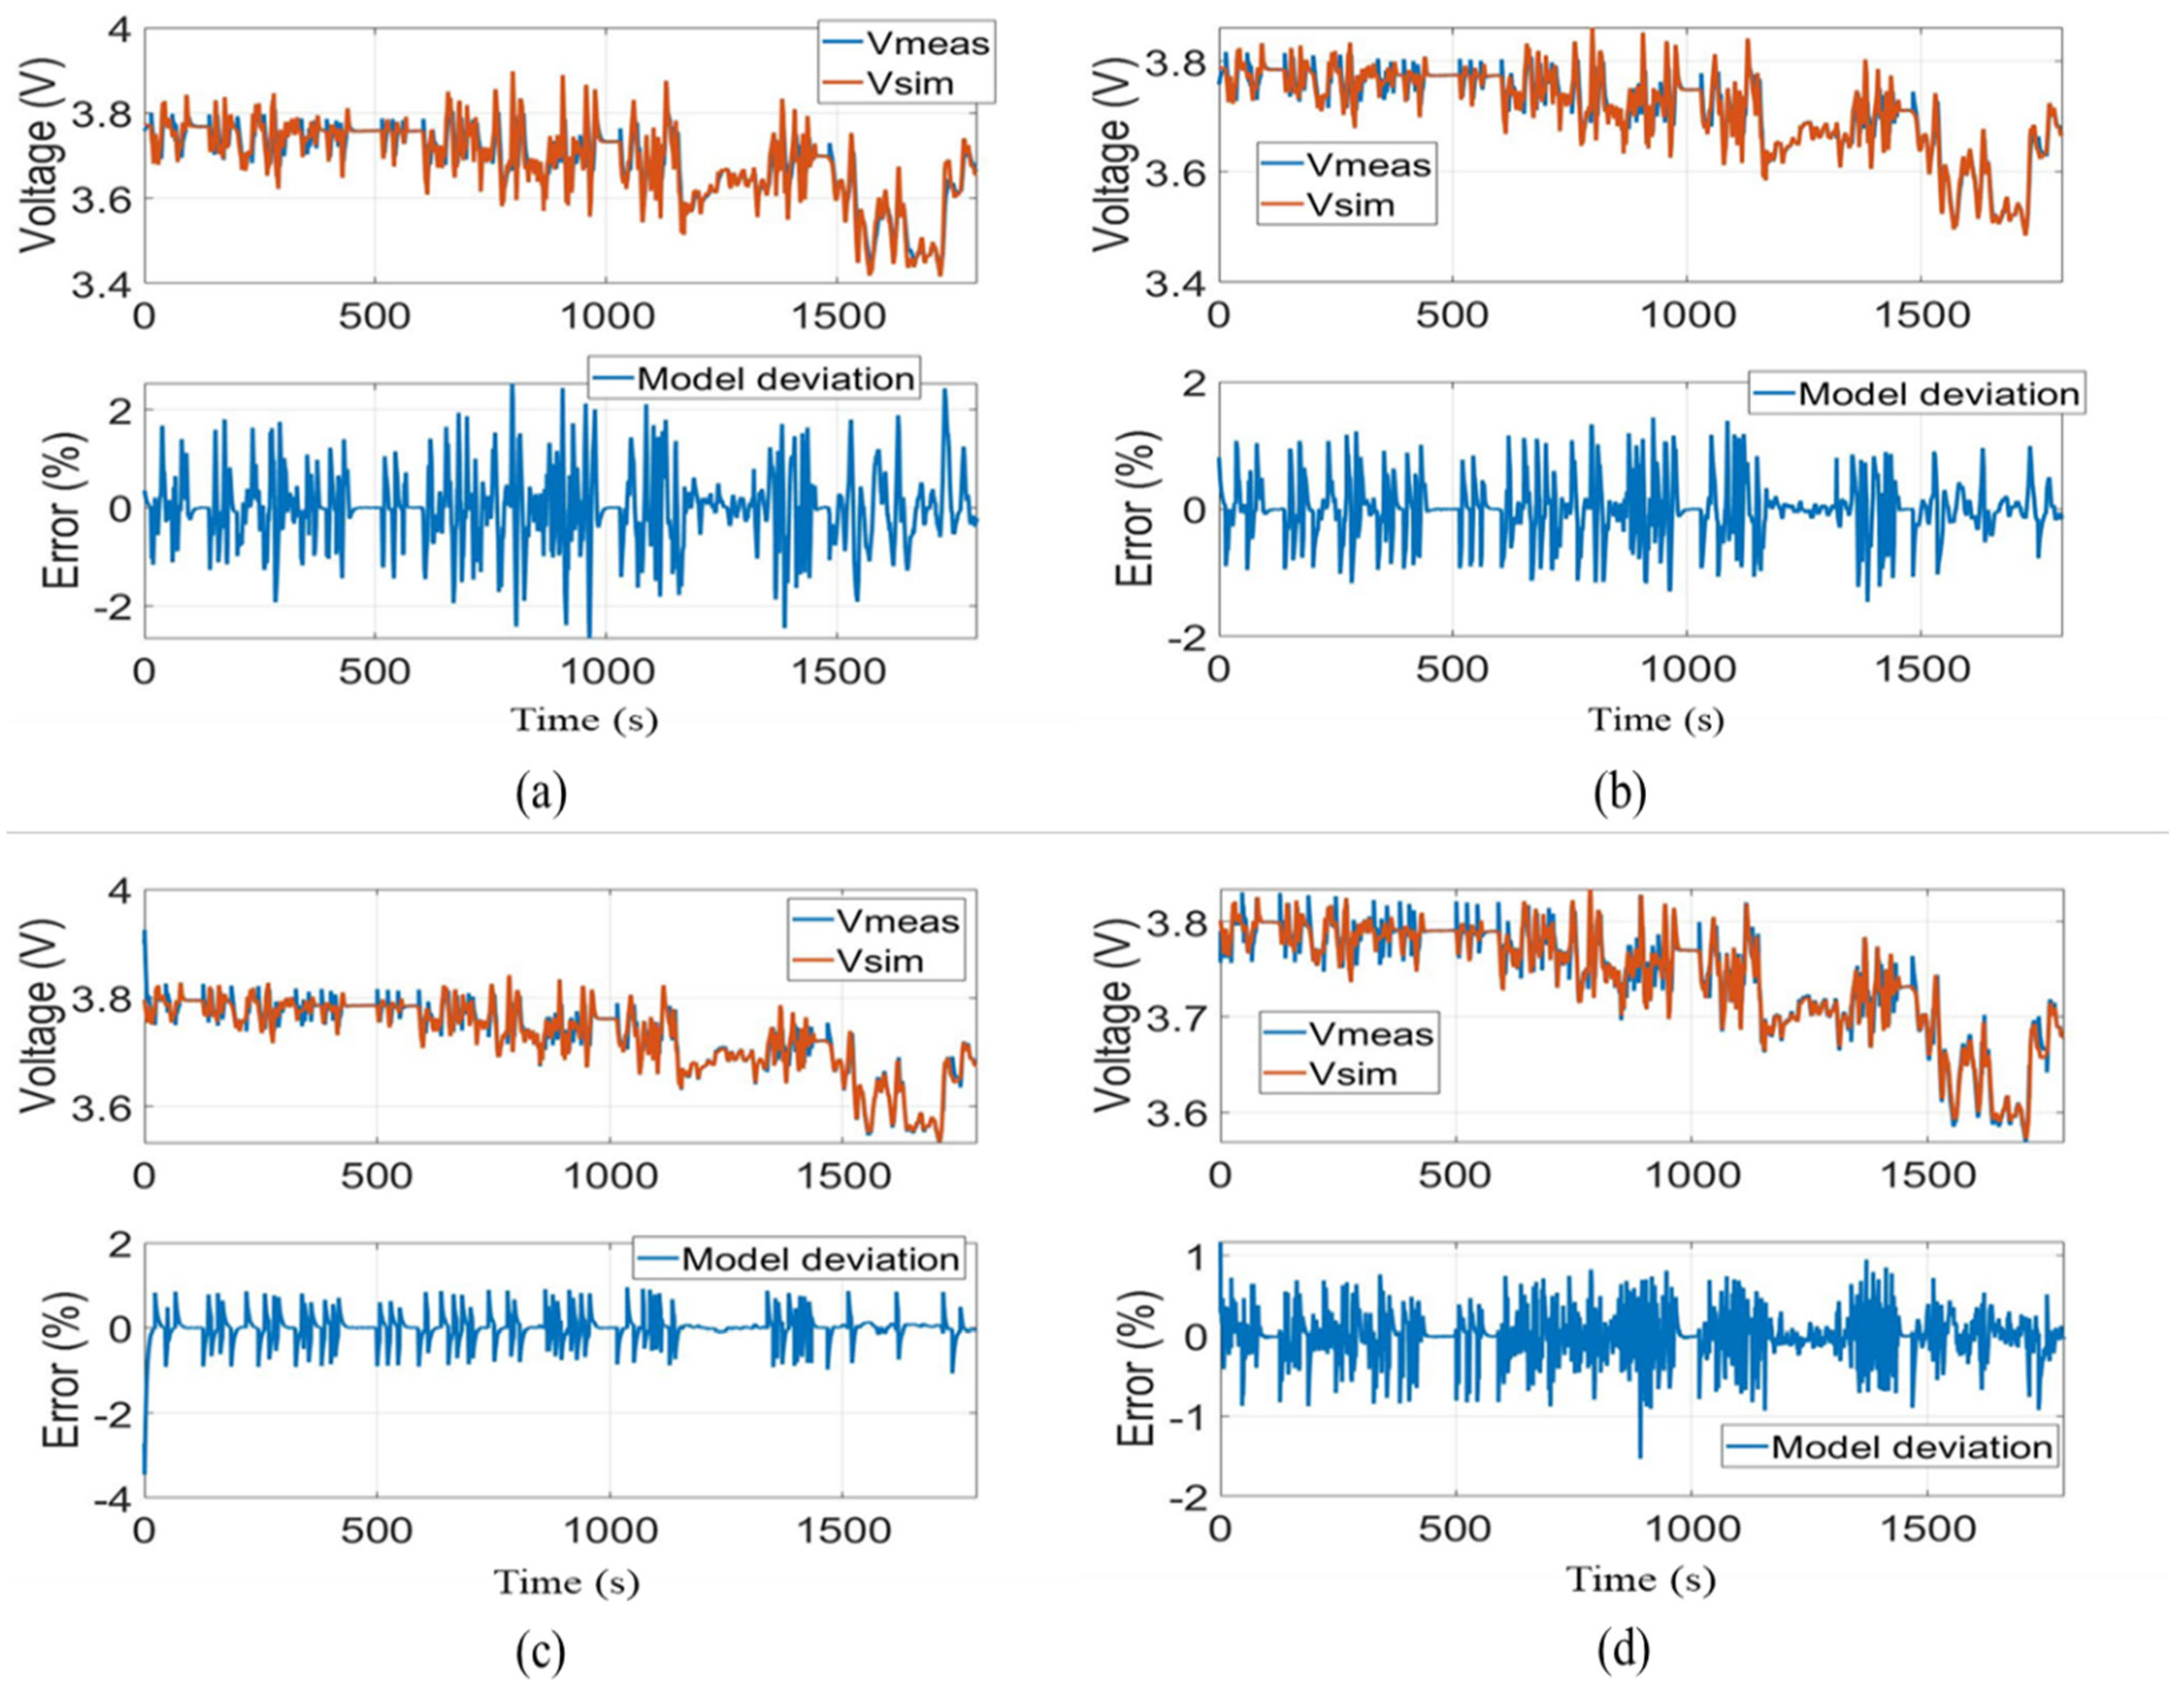
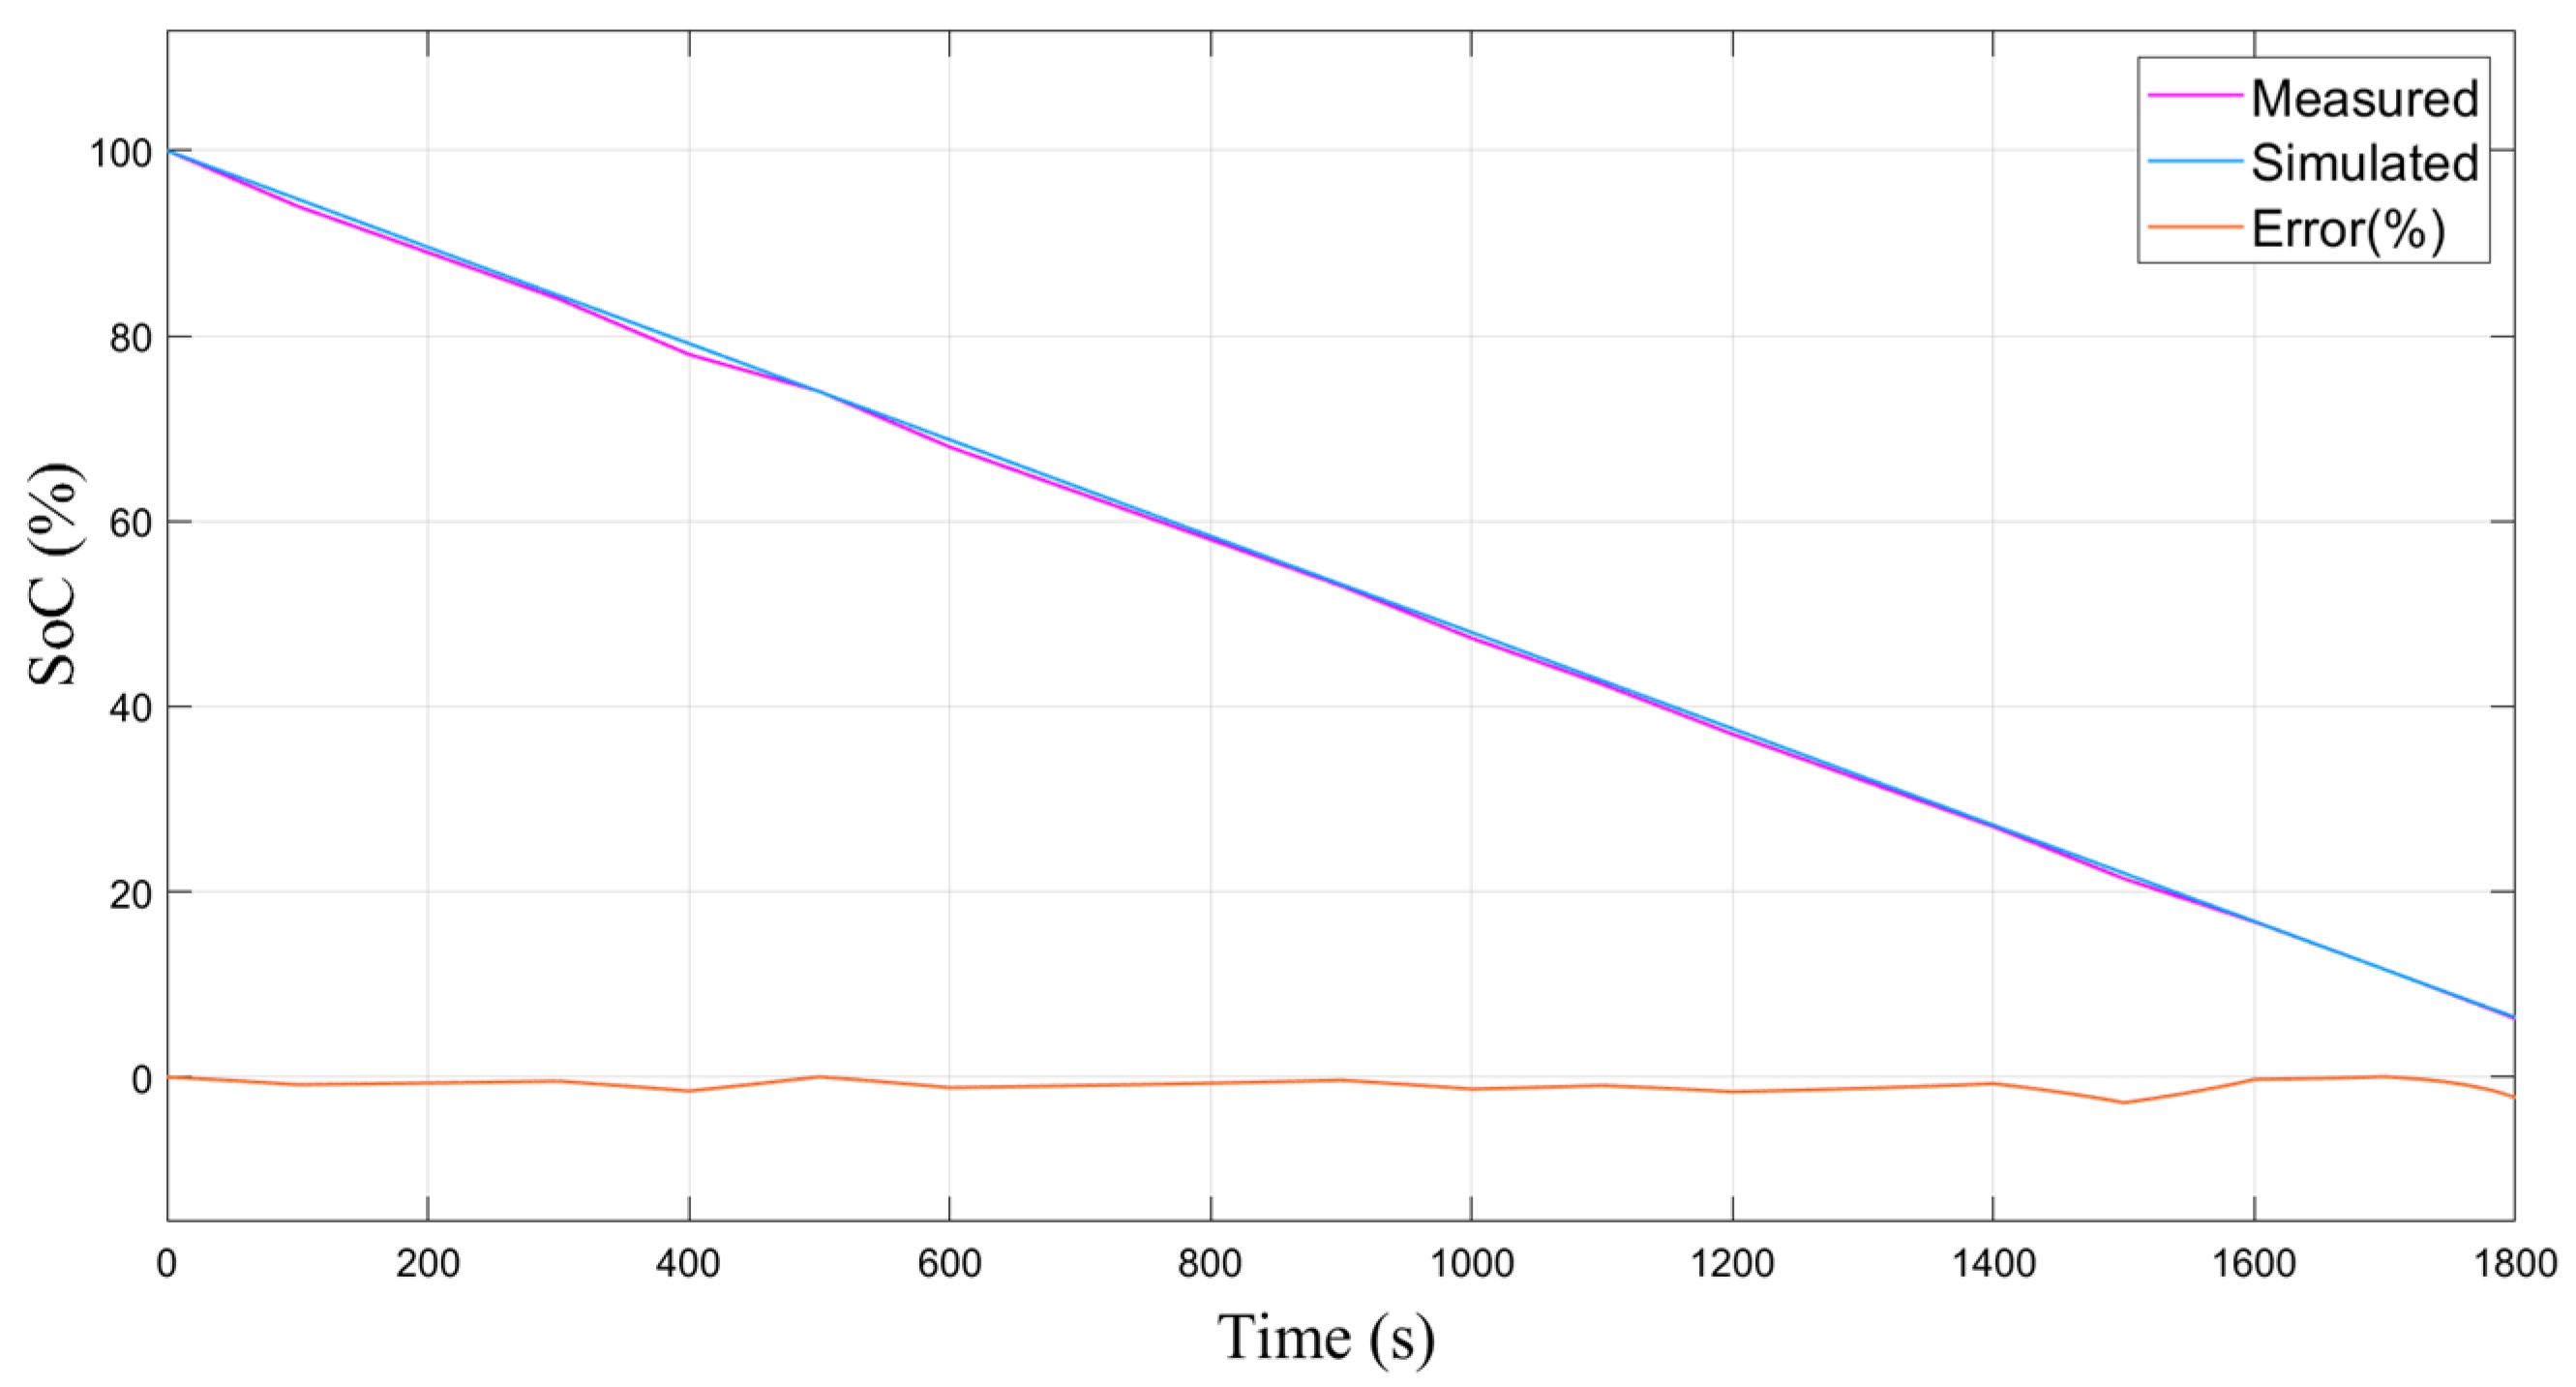
4.1. SoC Estimation and Model Validation

It is recalled that while estimating the SoP of the battery cell, the consideration and verification of the SoC result is essential for the safe operation and efficient control of the BMS. The SoC estimation and verification are accomplished through the DP_ECM coupled with the SoP model. Using the WLTC as the input current validation profile, the estimation and validation of the DP_ECM are performed and the output voltage with respective time is provided. The root-mean-square error (RMSE) of the output is also found according to the variation of the predefined SoC values. The summary of the validation result for the electro-thermal model is shown in Table 1.
In addition to the voltage validation results shown in Figure 10, the SoC estimation result is provided in Figure 11. The estimation output shows a comparison between the measured and simulated results and a respective RMSE of 1% is found, which is in line with the voltage validation output ranging from 1% to 1.9% for different temperature values.
As the accurate result of SoC is among the determinant parameter fed as an input to the SoP model, the estimation and validation of the SoP model is dependent on the results found from the DP_ECM illustrated in Figure 10 and Figure 11. The validation result of the SoP model is presented in the below section.

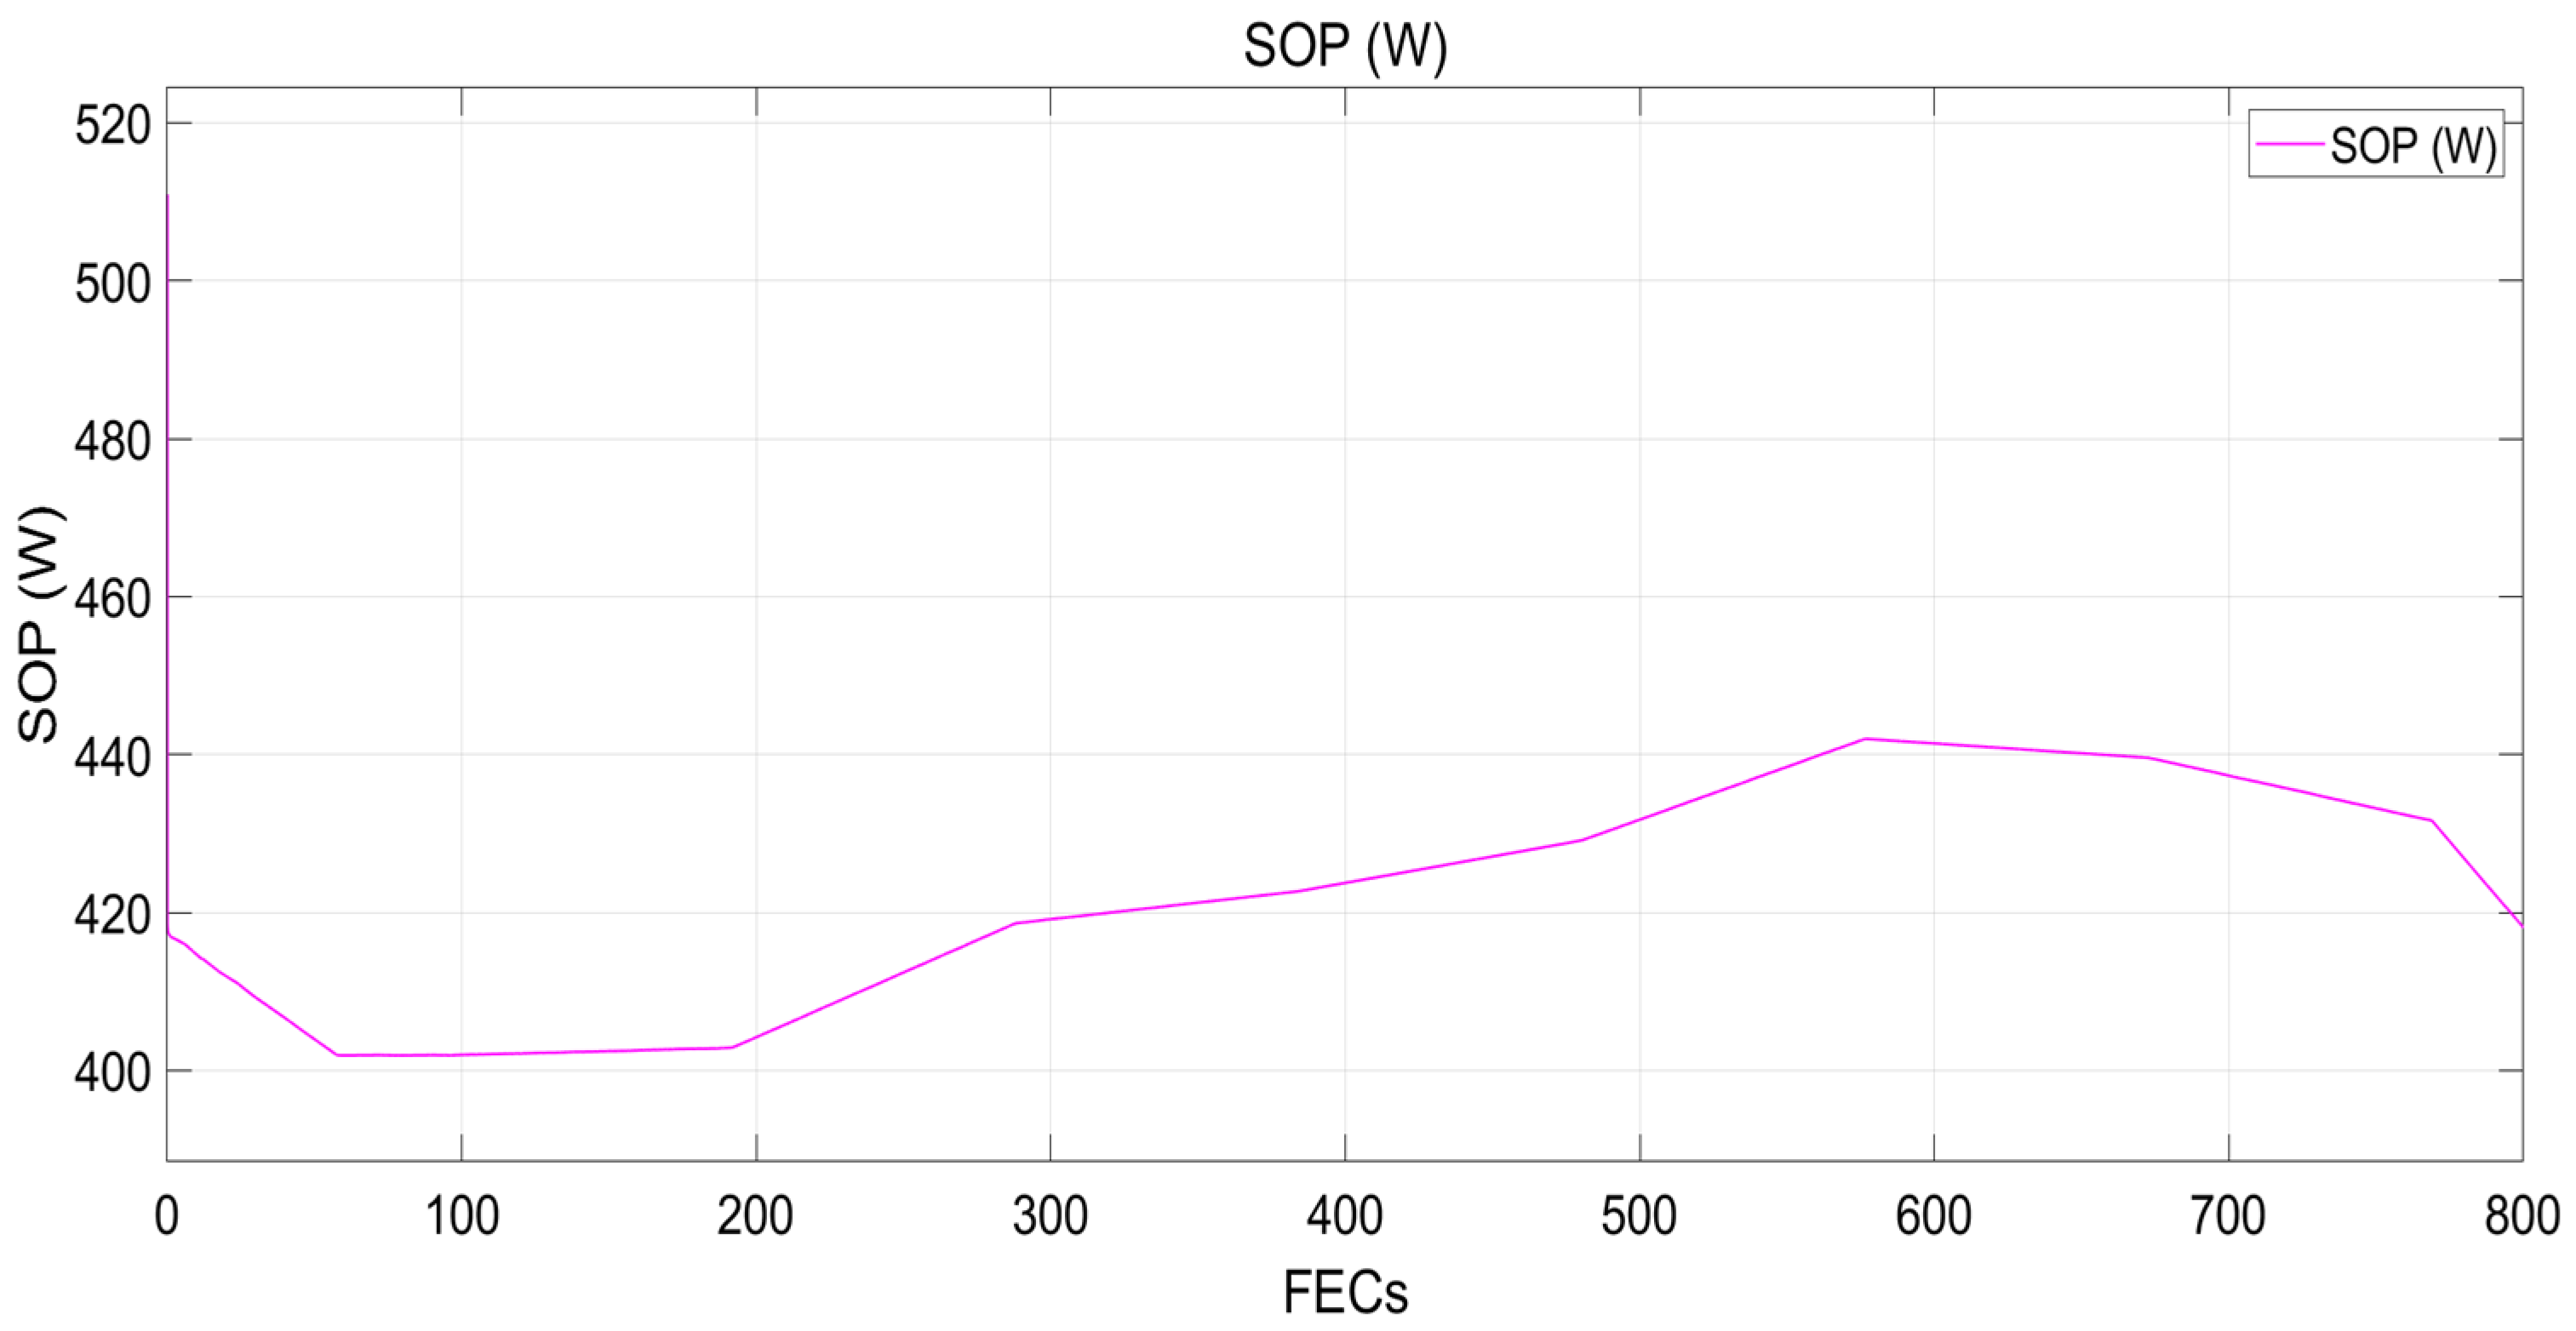
4.2. SoP Estimation Results and Model Validation

Before the analysis of the SoP of the battery cell, the response of Ri as a function of the respective SoC of the cells was illustrated throughout the total FECs. Based on the measured data of the cell, the relation between the SoC, FECs, and Ri was presented with a 3D surface fitting curve, shown in Figure 12. Typically, a 100% internal resistance increase is considered as the first life EoL of the cell.
Applying varying values of SoC between 0.1 and 1 as input, the SoP output from BoL to EoL of a representative single cell is shown in Figure 13, where the SoP output is dependent on the internal resistance [26,27]. The SoP result follows the magnitude of the Ri increase throughout the total FECs.
From Figure 13, it can be seen that the SoP did not follow a uniform trend. This is because the measured internal resistance did not increase monotonically, which is a result of the dynamic current profile used; and the inconsistent Ri measured data show that the resistance change is not dominant for these cells.

4.3. Validation of the SoP Model

The validation of the SoP model was performed using two types of current profiles. The dynamic WLTC and static load current profiles were used for evaluation of the model performance and its accuracy. From Figure 14a, it can be seen that the estimated Ri output follows a similar trend to the measured Ri. However, there is some deviation observed between the two curves. The resulting RMSE is found to be around 2%, which is almost comparable with the values reported by previous studies [9,15]. However, this error resulted mainly from the inconsistency of the measured internal resistance, where it was not constantly increasing in line with the respective FECs. Obviously, in the process of battery aging, the change of internal resistance contains a complex electrochemical mechanism evolution process, which could also result in inconsistent output. The SoP model validation expressed in terms of internal resistance is shown in Figure 14.
From Figure 14b, it is shown that the estimated output follows the measured value with better accuracy, showing that the static profile provides a better validation result compared to the dynamic profile. In this case, the RMSE is found to be around 1%, which seems better compared to the results found in previous reports [16,27].

5. Conclusions

In addition to the accurate SoC parameter estimation, the development of the SoP estimation logic used in this study enables the evaluation of the cells’ behaviors in terms of their SoP output, which is considered an essential parameter in the safe operation of the battery and BMS system. In this paper, an efficient method was used to estimate the SoC and to define the maximum discharge current, which is crucial for estimation of the SoP. Therefore, it is identified that an accurate estimation of the SoC is essential for precise estimation of battery cells’ SoP. The result of the analysis show that high accuracy of SoC estimation from the DP_ECM is found with an error of 1%. In addition, the maximum RMSE of SoP is found with the dynamic WLTC profile, whereas a relatively lower RMSE is found with the static validation profile. The RMSE result of the model validation with the dynamic and static profile is found to be 2% and 1%, respectively. The resulting error is mainly caused by the inconsistency of the measured internal resistance value where the resistance change is found as not dominant for the cells under study. In the future, the aspects of module-level SoP estimation model development and validation can be further investigated.

Supplementary Materials

The following supporting information can be downloaded at: https://www.mdpi.com/article/10.3390/en15186497/s1, Figure S1: Cycling profile of cell 001 (100% DoD, 50% Mid-SoC, 1C charge-discharge rate; Figure S2: HPPC pulse train at 25°C with current profile and voltage output response; Figure S3: Results of the OCV test at 25°C with the current profile and output voltage; Figure S4: Single WLTC cycle current profile; Table S1: Lifetime check-up description.

Author Contributions

A.A.K. performed the formal result analysis, methodology, and writing; M.S.H. and T.K. conducted the investigation and review; H.A.B., T.J., J.V.M. and T.C. provided visualizations and guidance; M.B. performed supervision. All authors have read and agreed to the published version of the manuscript.

Funding

This research was funded by the research project GEIRI-EUROPE. This research is part of the GEIRI project with fund number SGRIKXJSKF [2017]632.

Acknowledgments

This research has been made possible thanks to the research project GEIRI. Furthermore, we acknowledge the Vrije Universiteit Brussel (VUB) and Jimma University (JU) for allowing this research to be performed under the context of NASCERE joint Ph.D. study program.

Conflicts of Interest

The authors declare no conflict of interest.

References

  1. Vikström, H.; Davidsson, S.; Höök, M. Lithium availability and future production outlooks. Appl. Energy 2013, 110, 252–266. [Google Scholar] [CrossRef]
  2. Akhil, A.A.; Huff, G.; Currier, A.B.; Kaun, B.C.; Rastler, D.M.; Chen, S.B.; Cotter, A.L.; Bradshaw, D.T.; Gauntlett, W.D. DOE/EPRI 2013 Electricity Storage Handbook in Collaboration with NRECA; Sandia National Laboratories: Albuquerque, NM, USA, 2013. [Google Scholar]
  3. Kalogiannis, T.; Hosen, S.; Sokkeh, M.; Goutam, S.; Jaguemont, J.; Jin, L.; Qiao, G.; Berecibar, M.; Van Mierlo, J. Comparative Study on Parameter Identification Methods for Dual-Polarization Lithium-Ion Equivalent Circuit Model. Energies 2019, 12, 4031. [Google Scholar] [CrossRef]
  4. Xiong, R.; Sun, F.; He, H.; Nguyen, T.D. A data-driven adaptive state of charge and power capability joint estimator of lithium-ion polymer battery used in electric vehicles. Energy 2013, 63, 295–308. [Google Scholar] [CrossRef]
  5. Feng, T.; Yang, L.; Zhao, X.; Zhang, H.; Qiang, J. Online identification of lithium-ion battery parameters based on an improved equivalent-circuit model and its implementation on battery state-of-power prediction. J. Power Sources 2015, 281, 192–203. [Google Scholar] [CrossRef]
  6. Jiang, W.-J.; Zhang, N.; Li, P.-C.; Chen, N. A Temperature-Based Peak Power Capability Estimation Method for Lithium-Ion Batteries. Procedia Eng. 2017, 187, 249–256. [Google Scholar] [CrossRef]
  7. Liu, X.; He, Y.; Zeng, G.; Zhang, J.; Zheng, X. State-of-Power Estimation of Li-Ion Batteries Considering the Battery Surface Temperature. Energy Technol. 2018, 6, 1352–1360. [Google Scholar] [CrossRef]
  8. Gao, Z.; Chin, C.S.; Woo, W.L.; Jia, J. Integrated Equivalent Circuit and Thermal Model for Simulation of Temperature-Dependent LiFePO4 Battery in Actual Embedded Application. Energies 2017, 10, 85. [Google Scholar] [CrossRef]
  9. Jia, J.; Lin, P.; Chin, C.S.; Toh, W.D.; Gao, Z.; Lyu, H.; Cham, Y.T.; Mesbahi, E. Multirate strong tracking extended Kalman filter and its implementation on lithium iron phosphate (LiFePO4) battery system. In Proceedings of the 2015 IEEE 11th International Conference on Power Electronics and Drive Systems, Sydney, Australia, 9–12 June 2015; pp. 640–645. [Google Scholar]
  10. Xiang, S.; Hu, G.; Huang, R.; Guo, F.; Zhou, P. Lithium-Ion Battery Online Rapid State-of-Power Estimation under Multiple Constraints. Energies 2018, 11, 283. [Google Scholar] [CrossRef]
  11. Yang, J.; Xia, B.; Huang, W.; Fu, Y.; Mi, C. Online state-of-health estimation for lithium-ion batteries using constant-voltage charging current analysis. Appl. Energy 2018, 212, 1589–1600. [Google Scholar] [CrossRef]
  12. Jiang, B.; Dai, H.; Wei, X.; Zhu, L.; Sun, Z. Online Reliable Peak Charge/Discharge Power Estimation of Series-Connected Lithium-Ion Battery Packs. Energies 2017, 10, 390. [Google Scholar] [CrossRef] [Green Version]
  13. Malysz, P.; Ye, J.; Gu, R.; Yang, H.; Emadi, A. Battery State-of-Power Peak Current Calculation and Verification Using an Asymmetric Parameter Equivalent Circuit Model. IEEE Trans. Veh. Technol. 2016, 65, 4512–4522. [Google Scholar] [CrossRef]
  14. Wei, C.; Benosman, M.; Kim, T. Online Parameter Identification for State of Power Prediction of Lithium-ion Batteries in Electric Vehicles Using Extremum Seeking. Int. J. Control. Autom. Syst. 2019, 17, 2906–2916. [Google Scholar] [CrossRef]
  15. Esfandyari, M.; Esfahanian, V.; Yazdi, M.H.; Nehzati, H.; Shekoofa, O. A new approach to consider the influence of aging state on Lithium-ion battery state of power estimation for hybrid electric vehicle. Energy 2019, 176, 505–520. [Google Scholar] [CrossRef]
  16. Sun, F.; Xiong, R.; He, H. Estimation of state-of-charge and state-of-power capability of lithium-ion battery considering varying health conditions. J. Power Sources 2014, 259, 166–176. [Google Scholar] [CrossRef]
  17. Wang, X.; Dai, H.; Wei, X. On-Line Lithium-Ion Battery State-of-Power Prediction by Twice Recursive Method Based on Dynamic Model; SAE Technical Paper 2019-01-1311; SAE International: Warrendale, PA, USA, 2019. [Google Scholar] [CrossRef]
  18. Dong, G.; Zhang, X.; Zhang, C.; Chen, Z. A method for state of energy estimation of lithium-ion batteries based on neural network model. Energy 2015, 90, 879–888. [Google Scholar] [CrossRef]
  19. Jaguemont, J.; Omar, N.; Abdel-Monem, M.; Bossche, P.V.D.; Van Mierlo, J. Fast-charging investigation on high-power and high-energy density pouch cells with 3D-thermal model development. Appl. Therm. Eng. 2018, 128, 1282–1296. [Google Scholar] [CrossRef]
  20. Hosen, S.; Kalogiannis, T.; Youssef, R.; Karimi, D.; Behi, H.; Jin, L.; Van Mierlo, J.; Berecibar, M. Twin-model framework development for a comprehensive battery lifetime prediction validated with a realistic driving profile. Energy Sci. Eng. 2021, 9, 2191–2201. [Google Scholar] [CrossRef]
  21. Hosen, S.; Karimi, D.; Kalogiannis, T.; Pirooz, A.; Jaguemont, J.; Berecibar, M.; Van Mierlo, J. Electro-aging model development of nickel-manganese-cobalt lithium-ion technology validated with light and heavy-duty real-life profiles. J. Energy Storage 2020, 28, 101265. [Google Scholar] [CrossRef]
  22. Berecibar, M.; Garmendia, M.; Gandiaga, I.; Crego, J.; Villarreal, I. State of health estimation algorithm of LiFePO4 battery packs based on differential voltage curves for battery management system application. Energy 2016, 103, 784–796. [Google Scholar] [CrossRef]
  23. Berecibar, M.; Devriendt, F.; Dubarry, M.; Villarreal, I.; Omar, N.; Verbeke, W.; Van Mierlo, J. Online state of health estimation on NMC cells based on predictive analytics. J. Power Sources 2016, 320, 239–250. [Google Scholar] [CrossRef]
  24. Li, Y.; Abdel-Monem, M.; Gopalakrishnan, R.; Berecibar, M.; Nanini-Maury, E.; Omar, N.; van den Bossche, P.; Van Mierlo, J. A quick on-line state of health estimation method for Li-ion battery with incremental capacity curves processed by Gaussian filter. J. Power Sources 2018, 373, 40–53. [Google Scholar] [CrossRef]
  25. Boulon, L.; Hissel, D.; Péra, M.-C. Multi Physics Model of a Nickel Based Battery Suitable for Hybrid Electric Vehicle Simulation. J. Asian Electr. Veh. 2008, 6, 1175–1179. [Google Scholar] [CrossRef]
  26. Mathew, M.; Janhunen, S.; Rashid, M.; Long, F.; Fowler, M. Comparative Analysis of Lithium-Ion Battery Resistance Estimation Techniques for Battery Management Systems. Energies 2018, 11, 1490. [Google Scholar] [CrossRef]
  27. Chen, L.; Zhang, M.; Ding, Y.; Wu, S.; Li, Y.; Liang, G.; Li, H.; Pan, H. Estimation the internal resistance of lithium-ion-battery using a multi-factor dynamic internal resistance model with an error compensation strategy. Energy Rep. 2021, 7, 3050–3059. [Google Scholar] [CrossRef]
  28. Huria, T.; Ceraolo, M.; Gazzarri, J.; Jackey, R. High fidelity electrical model with thermal dependence for characterization and simulation of high-power lithium battery cells. In Proceedings of the 2012 IEEE International Electric Vehicle Conference, Greenville, SC, USA, 4–8 March 2012. [Google Scholar] [CrossRef]
  29. Nikolian, A.; Firouz, Y.; Gopalakrishnan, R.; Timmermans, J.-M.; Omar, N.; Van den Bossche, P.; Van Mierlo, J. Lithium Ion Batteries—Development of Advanced Electrical Equivalent Circuit Models for Nickel Manganese Cobalt Lithium-Ion. Energies 2016, 9, 360. [Google Scholar] [CrossRef] [Green Version]
Figure 1. Block representation of test bench topology during cell experiment [19].
Energies 15 06497 g001
Figure 2. Flowchart of the overall characterization procedure.
Energies 15 06497 g002
Figure 3. The corresponding region of the pulse and the schematics of the electrical model.
Energies 15 06497 g003
Figure 4. Ohmic resistance as a function of temperature and state of charge.
Energies 15 06497 g004
Figure 5. Polarization resistance 1 as a function of temperature and state of charge.
Energies 15 06497 g005
Figure 6. Polarization resistance 2 as a function of temperature and state of charge.
Energies 15 06497 g006
Figure 7. Capacitance 1 as a function of temperature and state of charge.
Energies 15 06497 g007
Figure 8. Capacitance 2 as a function of temperature and state of charge.
Energies 15 06497 g008
Figure 9. Schematic representation of DP_ECM coupled SoP battery model.
Energies 15 06497 g009
Figure 10. Validation of the DP_ECM at 0 °C (a), 10 °C (b), 25 °C (c), and 45 °C (d).
Energies 15 06497 g010
Figure 11. SoC estimation and validation result of the DP_ECM.
Energies 15 06497 g011
Figure 12. Internal resistance versus SoC relationship with 3D surface fitting.
Energies 15 06497 g012
Figure 13. SoP output of the cell through 800 FECs.
Energies 15 06497 g013
Figure 14. SoP validation as function of internal resistance using (a) WLTC profile; (b) static current profile.
Energies 15 06497 g014
Table 1. Summary of RMSE deviation of DP_ECM electrical model.
DP_ECM Validation Deviation
Temperature (°C)0102545
RMSE (%)1.91.811
Current profileWLTCWLTCWLTCWLTC
Publisher’s Note: MDPI stays neutral with regard to jurisdictional claims in published maps and institutional affiliations.

