Abstract
In response to the future net zero emissions plan in Taiwan, the campus shoulders the university’s social responsibility and educational significance. Recently, energy conservation and carbon reduction have become common goals for every campus. However, there is a common problem to be addressed in terms of how to take into account the economic benefits and the continuous improvement strategy regarding actual demands. In this study, a systematic design of energy-saving action plans for a Taiwan campus by considering economic benefits and actual demands is demonstrated. By taking National Taiwan University of Science and Technology in Taiwan as an example, eight energy-saving action plans during the period from 2016 to 2020 are introduced, and the effectiveness of these topologies is verified by real implementations. Action plans contain the installation of a smart energy management system, elevator power recovery devices, circulating fans, and lighting delay switches; the replacement of old air-conditioners, fluorescent lamps, and high-sodium streetlights; and load consolidation and low-efficiency transformers replacement. Upon evaluation, the estimated electricity savings can achieve up to 16% of annual electricity consumption, and the payback period is about 5.22 years. Upon application, the actual power saving amounts to about 3,076,260 kWh for approximately 15.5% of the power consumption of Taiwan Tech in 2020.
1. Introduction
The IEA Global Energy Review [1] mentioned that global CO2 emissions have grown gradually from 1900 to 2020. The issue of global climate change and warming has become an issue of urgent concern to countries all over the world. The Paris Agreement, an international carbon reduction agreement that regulates CO2 emissions in various countries, has proposed and updated new energy-saving goals at sequent meetings, and government departments have also introduced relative action plans in response to related consequences. In the past, energy-saving work had become an international trend in this international atmosphere.
Universities and higher education institutions play an important role in achieving a sustainable future by combatting climate change. Sen et al. [2] reviewed the sustainability strategies of numerous universities in Australia and identified six universities as study cases. The fundamental difficulty for universities is to determine how to reduce their own carbon footprint. Generally speaking, electricity consumption accounts for more than 80% of the CO2 emissions of universities in Taiwan. Thus, the main purpose of this research is to take inventory of major electricity usage on campus by considering the amount of electricity consumption, service life, technology maturity, and funding requirements and set energy-saving targets for later continuous improvement with the plan–do–check–act (PDCA) procedure.
The specific scope and practical implications of this study are summarized as follows: (1) to determine the major contributing factors of power consumption in a case study university; (2) to examine ways to reduce these major contributing elements; (3) to set energy-saving targets according to self-requirement or policy enforcement; (4) to evaluate possible energy-saving potentials and draw up the corresponding action plans; (5) to implement action plans in practice and benefit verification; (6) to create common guidelines or directions regarding strategies and initiatives that other universities can follow.
This study is mainly organized into six sections. Following the introduction, the review of literature is discussed in Section 2. In Section 3, the description of the research subject and energy distribution is presented. In Section 4, eight energy-saving action plans are investigated based on the systematic design of the proposed energy-saving procedure. In Section 5, the results are presented and a discussion is carried out to demonstrate the effectiveness of the proposed framework. Finally, some conclusions are drawn in Section 6.
2. Literature Review
In recent years, some researchers have tried to ascertain the impact of education intervention for the issue of energy-saving. Lee et al. [3] studied response patterns related to student background and factors determining energy consumption behaviors from a sample of 2400 secondary students involved in a national energy education program in Taiwan. It indicated that energy literacy was high and positive with greater impact, as expected, by grade, i.e., senior high school students outscored junior high school ones. On the other hand, Black et al. [4] presented three intervention strategies with the provision of real-time feedback provided by an in-house energy consumption display unit in facilitating energy-saving behavior among resident undergraduate university students. It showed that the rate of reduced electricity consumption for the interventions ranged from an average of 17% to 28%, and the facilitation of intrinsically motivated behaviors resulted in reduced energy use. From the reports in Refs. [3,4], the energy-saving effect indeed can be enhanced by appropriated education strategies. Therefore, this study takes university campuses as the main research object of energy-saving action plans.
For specific areas in the campus, Khalid et al. [5] determined the energy efficiency of a public university library, including mechanical and electrical systems, by conducting energy-saving measures (ESM) in the context of Malaysia’s tropical setting. Han et al. [6] proposed systematically how to implement subjects of actual measurement and simulation of energy consumption and the energy-saving analysis for the energy consumption of campus. In Ref. [6], the illumination, noise, and formaldehyde concentration of the library in North China University of Science and Technology were used for a detailed analysis of the measurement data, and it provided the basis for energy-saving transformation, operation management, and updating equipment. However, in Refs. [5,6], only a small part of the campus buildings (i.e., the library) is considered, and there are no experimental comparisons. Song et al. [7] summarized the impact on the power consumption of buildings based on different variables, including the lighting power density, indoor personnel density, summer indoor design temperature, and summer air supply temperature, to be simulated by appropriate software. Unfortunately, only the effects of four single variables on the power consumption are investigated without using multiple variable simulation to explore the influence of matches among the variables on building electricity consumption. In order to relax the area limitation, this study will survey all the buildings in the campus for energy-saving reconstruction.
For searching the potential of energy-saving in the campus, Hong et al. [8] focused on the characteristics of campus buildings by surveying the energy consumption patterns identified in accordance with the number of users and the period of use and established an optimized limitation of future energy consumption by forecasting the trend of growing consumption after examining the kinds and quantities of energy installations being utilized in campus buildings. However, the economic benefit issue regarding energy-saving is not considered. Moreover, Elmuradov et al. [9] researched the energy use of chillers and the wrong setting of luminous flux in a Malaysian university campus to maximize potential energy savings. Although two projects are demonstrated to save approximately 53,000 kWh of electricity within the research duration, long-term energy-saving data are not provided, and the economic benefit issue is also not discussed. In addition, Oyedepo et al. [10] surveyed the energy consumption in Covenant University from 2014 to 2018 to provide some suggestions for the energy-saving of 18 selected buildings by using a quick energy simulation tool. Although energy-saving costs can be saved annually with a payback time of less than 6 years, the issue of replacing old air-conditioners with higher power consumption is not considered in Ref. [10]. Furthermore, Litardo et al. [11] compared the potential for building energy-saving of various passive and active strategies and on-site power generation through a grid-connected solar photovoltaic system (SPVS) and aimed to identify the most effective energy-saving strategy for building retrofitting in this climate. However, the proposed building model may not be suitable for cities in a non-tropical climate. According to the aforementioned drawbacks, this study will select possible combinations of energy-saving strategies according to economic benefits before real applications.
By relying on the definition of energy-saving indicators and the aid of modelling tools, Rewthong et al. [12] studied the total electric energy consumption, specific energy consumption (SEC), and energy utilization index (EUI) in a Thailand university from 2012 to 2014, and it was concluded that mostly electric energy consumption was used for the air conditioner system, the lighting system, and the elevator system, increasing by about 10% each year. However, there are no related action plans to present in Ref. [12] for saving energy in the future. Moreover, Latif et al. [13] improved the energy performance in an existing university building with the adaptation of building information modelling (BIM) to gain more accurate energy usage during maintenance work. It is a pity that no actual implementation improvement plan is provided to prove the effectiveness of related energy-saving strategies. In addition, Yildiz and Koçyiğit [14] investigated energy savings in four buildings from the Balıkesir University campus by applying different energy-efficient measures with simulation-based analysis. However, the result of an energy reduction of over 60% in selected buildings is not verified by real implementations. Testi et al. [15] presented an innovative configuration for smart multi-energy microgrids serving clusters of buildings, and it was tested in a university campus located in Trieste (Italy). However, only the energy system in a reference-year scenario was simulated, and the optimal sizing of the whole system was not discussed. Alavijeh et al. [16] introduced cost-effectiveness of carbon emission abatement strategies for a local multi-energy system in the Chalmers University of Technology campus. The results in Ref. [16] still lack experimental verification for the proposed strategies. For relaxing the problem of only numerical simulations without real implementation, this study will follow the energy-saving evaluation results to implement action plans for double-checking actual benefits.
3. Description of Research Subject and Energy Distribution
National Taiwan Institute of Technology (NTIT) was founded on 1 August 1974 and was the first higher technical and vocational education institution in Taiwan. On 1 August 1997, NTIT was upgraded to university status and changed its name to “National Taiwan University of Science and Technology”, also known as “Taiwan Tech”. The main campus, situated in a district of Taipei with convenient transportation and beautiful surroundings, covers an area of about 10 hectares, as shown in Figure 1. Current enrollment includes 5605 undergraduates and 4902 graduate students, with 415 full-time faculty. Taiwan Tech, which is the top university of science and technology in Taiwan, is the major research subject to reconstruct its energy use efficiency in this study.
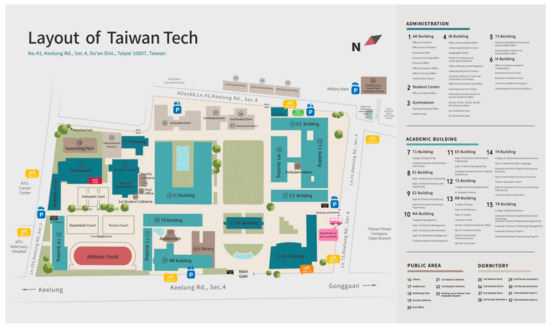
Figure 1.
Main campus map of Taiwan Tech.
The power consumption of Taiwan Tech in 2015 was 23,650,720 kWh/year and was over its campus power consumption target announced by the Ministry of Education in Taiwan. In 2015, the power contract capacity was 5566 kW, signed with the Taipower company, which is the largest and top utility power supplier in Taiwan. In Taiwan Tech, the air-conditioning system accounts for about 60% of the total electricity consumption yearly, the lighting system accounts for about 15%, the elevator system accounts for about 7%, and other sub-systems account for about 18%. Before 2021, Taiwan Tech at least needs to save 15% total power consumption for satisfying the government request yearly. According to this requirement, one should analyze the energy distribution in the campus to find potential energy-saving for formulating related action plans to achieve the objective during the period from 2016 to 2020.
The first stage of systematic planning and design for saving energy and carbon reduction is to build a smart energy management system (EMS), which is mainly to install related energy use sensors, such as electricity meters or electronic water meters, to understand real-time energy use information in various areas of the campus. More importantly, the data collected from the EMS should be used for analysis for calculating the areas with major power consumption and judging their rationality of energy use. Generally speaking, air conditioning, lighting system, and elevator system power consumption values are the top three of the campus. Thus, the efficiency of air conditioners and lighting lamps should be checked to evaluate whether high-efficiency equipment is replaced or not, and the issue of elevator power recovery can be discussed. At the beginning of the construction of campus buildings, it is usually estimated that the power demand is high, resulting in a low transformer load utilization rate. For Taiwan universities and colleges, the transformer load utilization rate is generally between 10% and 20%, but no-load losses will be significantly increased in this situation. Thus, the issue of load consolidation and transformer replacement should be considered for energy-saving action plans.
Clark et al. [17] used a systems thinking approach to explore the possibilities and potential need for an 18th sustainable development goal (SDG). The method in Ref. [17] allows for understanding of reciprocal relationships, interactions, and differing perspectives of a system, including its boundaries. The systematic design of the proposed energy-saving procedure in this study is depicted in Figure 2, and the corresponding steps are expressed as follows.
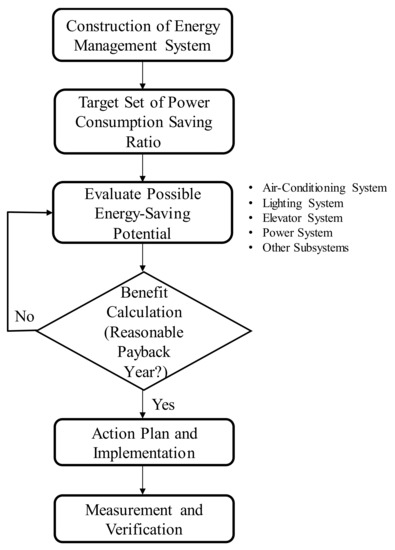
Figure 2.
Systematic design of energy-saving procedure.
- Step 1:
- The construction of an energy management system (EMS) to monitor and control major energy-consuming equipment;
- Step 2:
- The determination of a power consumption saving ratio according to self-requirement or policy enforcement;
- Step 3:
- The evaluation of possible energy-saving potentials, including air-conditioning systems, lighting systems, elevator systems, power systems, and other subsystems according to the record of the EMS;
- Step 4:
- The calculation of economic benefit for each energy-saving potential to check whether it satisfies a reasonable payback year or not;
- Step 5:
- If the payback year is longer than the equipment life cycle, go to Step 4; otherwise, go to the following steps;
- Step 6:
- The fabrication and implementation of action plans;
- Step 7:
- The measurement and verification of each action plan to check whether it satisfies the preset energy-saving benefit or not.
4. Energy-Saving Action Plans
After survey of the power consumption situation, eight major energy-saving action plans during the period from 2016 to 2020 in Taiwan Tech are described in this section. All action plans will be evaluated based on the power saving, payback period, and economic benefits.
4.1. Construction of Smart Energy Management System
In Ref. [18], the current study emphasized the crucial role that IoT-based smart campus adoption can play in the development of a sustainable campus environment. The highlight of the design concept of an IoT-based smart energy management system (EMS) is to think about why not to install a large number of sensing devices (e.g., electricity meters and water meters) at one time to reduce initial investment costs and to focus on exploring energy-saving potential through experiments and data analysis to continuously improve and gradually expand related sensors as needed. It is expected that the energy-saving benefits will gradually expand by following the installation of measuring instruments. Related improvement items and effects are described as follows:
- Adjustment of reasonable power contract capacity: Since the university must sign a power contract capacity with the Taipower company to meet the campus electricity demands, how to plan a suitable contract capacity for reducing the basic electricity bill inside a reasonable range while pursuing a lower extra surcharge is one of the design concepts.
- Suppression of peak power demand: In order to reduce power over-contract surcharges, the EMS implements the load-forecasting demand control [19] by unloading related equipment with large power consumption before it is predicted that the total power demand will exceed the power contract capacity. Note that necessary equipment should be uncontrolled.
- Reduction in power consumption: The establishment of the EMS can monitor the power consumption status of the campus, record the power consumption data of various equipment completely, and control the power demand control. Through the data collection, automatic meter reading, trend recording and statistics, and database management, it can provide complete power system operation and facility management analysis tools, which can be used as an important basis for management units to make decisions and improve management efficiency.
- Increase in power factor: With the reactive power compensation of the power factor correction, it can improve the power factor to further reduce transmission loss. Increasing the power factor in Taiwan can obtain related electricity fee reductions and exemptions from Taipower, but the maximum power factor increase is only up to 95%.
- Monitoring of water use: The EMS can assist the management department to observe the leakage flow of the water pipe in the building during unmanned water use time and observe whether the water use pattern of the building is abnormal. Moreover, it can also provide relevant data for the management department to deal with effective water resources dispatch.
- Monitoring of solar photovoltaic (PV) power generation: The EMS can assist the management department to observe whether there is a difference between the daily solar PV power generation and the regional average power generation and provide a basis for cleaning the solar PV panel or the troubleshooting of the power converter.
- Monitoring of electric energy recovery and electric vehicle (EV) charging: The EMS can assist the management department as the basis for the normality of the electric energy recovery device and the billing base of EV charging and provide the follow-up basis for the expansion evaluation.
The investment cost of the EMS is mainly composed of the cost of sensors and their installation and wiring, monitoring communication piping wiring, monitoring settings, and connection test wires. Moreover, the programming and system integration, including a server, an uninterruptible power system, graphic control package software, the controller programming, the server database, website system development, and system integration testing need to be taken into account. The total investment cost of the EMS is about TWD 5,896,988. By considering the energy-saving percentage 3% and the unit power price TWD 2.8/kWh in Taiwan Tech, the payback period is about 3.5 years.
4.2. Replacement of Air-Cconditioning Hosts with Review of Efficiency and Capacity
In order to effectively improve energy-saving, the design concept is to examine the equipment with higher energy consumption, where the air conditioning system usually consumes about 50~55% of the total electricity consumption in the campus. If a high-efficiency ice-water host is selected, the average energy-saving efficiency can reach more than 20%. Therefore, the energy-saving improvement in the air-conditioning system will be one of the most important steps to promote energy conservation. Proper planning and improvement of equipment will be a way to quickly increase the energy-saving rate.
The planning criteria for the replacement of air-conditioning hosts is to first check the service life of each building’s air-conditioning host and whether the current energy efficiency exceeds the legal requirements. In addition to the replacement of the host, a focus is also the possibility of host capacity reduction and consolidation, and, more importantly, the unloading control strategy planning. As for the air-conditioning hosts in the international building (IB) to be used for more than 15 years, the ones in the research building (RB) to be used for more than 15 years, and the ones in the auditorium to be used for more than 35 years, the mainframe replacement and optimization planning should be carried out because the energy efficiency of the corresponding air-conditioning hosts exceeds the value of 1.0 kW/RT. Since two 150 RT hosts in the IB are mainly used in classrooms, the energy monitoring system shows that the capacity of the host is relatively small. Therefore, under the condition of the same capacity, the fixed-frequency host is changed to a variable-frequency host, and the number of classes in the classroom is controlled in real time. The host is set up on site with a frequency converter to control the unloading procedure according to the return ice-water temperature, and the upper energy monitoring system executes the host group opening and closing control and alternates unloading.
In the RB, it had four ice-water main engines with different capacities, each of which was used in different fields. Obviously, it is possible to reduce and consolidate the main machine capacity. Therefore, two ice-water machines with smaller capacity (15 RT × 2) and poor energy efficiency can be removed. According to the air-conditioning demand estimation based on the operation record of the energy monitoring system, only the 60 RT reciprocating ice-water host is replaced with a frequency conversion spiral ice-water host, and it is cooperated with the existing 80 RT fixed-frequency spiral ice-water host. The frequency converter is used to control the unloading procedure according to the return ice-water temperature, and the upper energy monitoring system implements the fixed-frequency/variable-frequency control, as well as the opening and closing control with other units and the unloading in turn.
In the auditorium, it originally had a 20 RT reciprocating ice-water host with only one compressor and had a service life of more than 35 years. Most of the air exchange in the auditorium is operated by this ice-water host, and the air-conditioning demand for large-scale events is high. However, the demand for daily loads without events is very low. Thus, it can be replaced with a scroll ice-water host with three compressors so that only one or two compressors can be started when the air-conditioning load is low. In order to enhance the compressor performance, the ice-water pump, cooling water pump, and cooling tower fan are installed with frequency converters, and the upper energy monitoring system performs the unloading control.
The investment cost for the replacement of air-conditioning hosts and related equipment in the RB and auditorium, as shown in Figure 3 and Figure 4, is TWD 4.12 million, and the ones in the IB, as shown in Figure 5, is TWD 4.533 million. According to the electricity cost being TWD 2.8/kWh and the estimated total power saving of 395,453 kWh/year, the annual electricity cost can be reduced by TWD 1,107,268/year, and the payback period is about 7.8 years. The electricity consumption before and after the air-conditioning improvement and the cumulative energy-saving rate are depicted in Figure 6.
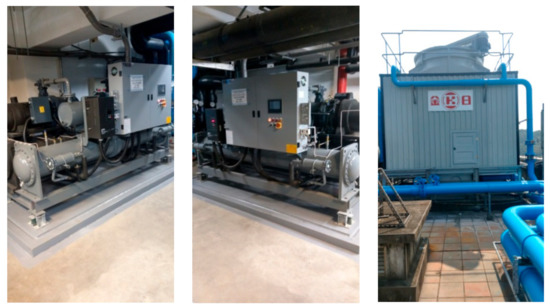
Figure 3.
Replacement of IB air-conditioner and related equipment.
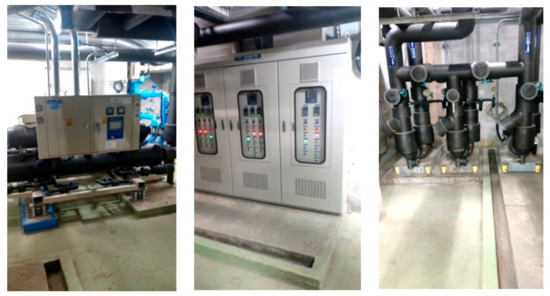
Figure 4.
Replacement of RB air-conditioner and related equipment.
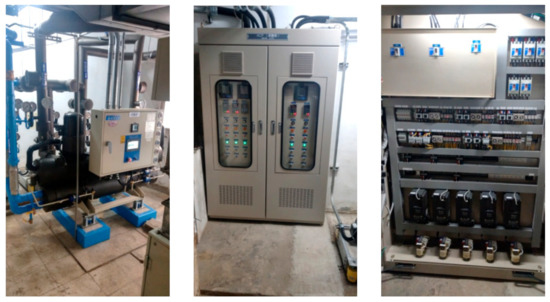
Figure 5.
Replacement of air-conditioner and related equipment in auditorium.
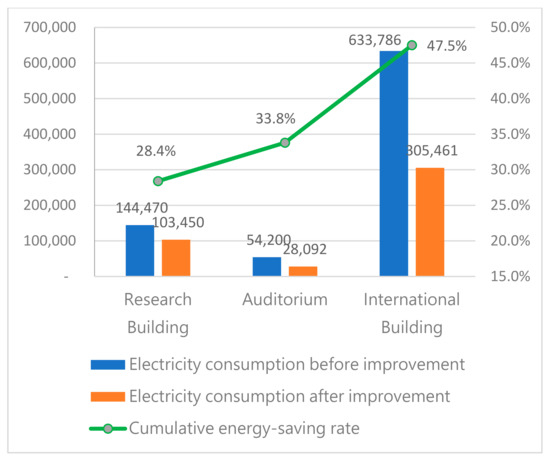
Figure 6.
Electricity consumption before and after air-conditioning improvement, and cumulative energy-saving rate.
4.3. Replacement of High-Efficiency Lamps with Ambient Lighting Analysis
At the beginning, the installed lamps in all buildings are surveyed in a total of 19 areas on the campus. In summary, T8-type fluorescent lamps use a total of 7607 lamps, T5-type fluorescent lamps use a total of 9637 lamps, high energy-consumption lamps use a total of 1160 lamps, and other low energy-consumption lamps use a total of 1714 lamps. It can be found in various areas that the number of T8-type fluorescent lamps accounted for 35% of the total number of lamps in the campus. Because the number of replaceable lamps in the campus is too large, a three-stage replacement schedule is proposed. In the first stage, in accordance with the official requirements by the Ministry of Education in Taiwan, the replacement of T8-type fluorescent lamps by LED lamps in the campus was completed before 31 December 2018. In the second stage, traditional lamps in five areas, including the student center, the IB, the RB, the student dormitory, and campus streetlights, were replaced by LED lamps, and the replacement was completed before 31 December 2019. The third stage is to replace traditional lamps in the remaining areas of Taiwan Tech, and this was completed before 31 December 2020.
In this study, the major advantage in comparison with traditional 1:1 lamps replacement is the use of the DIALux software to implement the scene-lighting diagnosis analysis for providing the results comparisons before and after improvement and proving the practicality of the suggested plan in order to alleviate users’ doubts [20]. The lighting improvement case study of the TR-214 classroom is explained in detail as follows.
The TR-214 classroom originally uses 25 sets of T8-type fluorescent lamps with the size of four feet and two tubes, and the average illuminance measured on site is about 465.1 Lx, which is slightly lower than the recommended illuminance standard by the Chinese National Standards (CNS). It reconstructs the environment of the TR-214 classroom in the DIALux. The actual photo and the reconstructed environment of the TR-214 classroom are depicted in Figure 7 and Figure 8, respectively. Moreover, the layout of the TR-214 classroom is depicted in Figure 9, and the simulation environment does not include the ceiling fan. The height of the working surface is set to 0.85 m from the floor. The spatial illuminance distribution and the work surface illuminance before improvement are depicted in Figure 10 and Figure 11, respectively. It can be seen from Figure 10 that the illuminance of the desktop does not reach the CNS recommended illuminance standard of 500 Lx or more. From Figure 11, it can be found that the maximum illuminance of the desktop is only about 471 Lx, and the spatial illuminance is quite uneven. It is recommended that the TR-214 classroom replaces the LED panel lights and reconfigures the lights to increase the space illuminance.
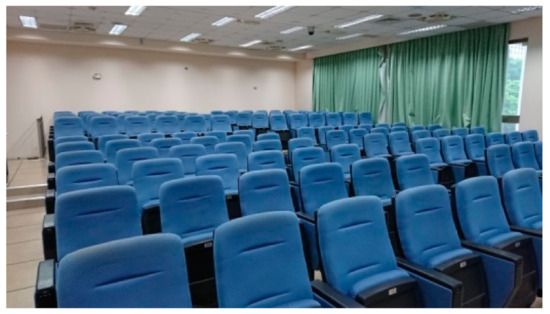
Figure 7.
Actual photo of TR-214 classroom.
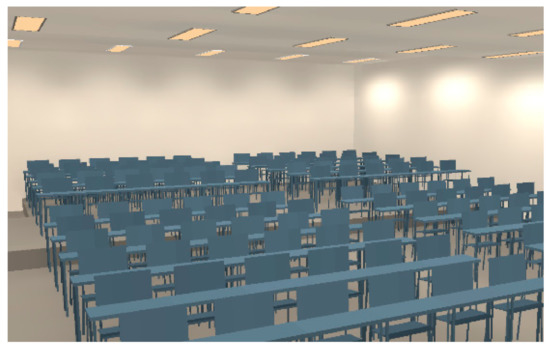
Figure 8.
Reconstructed environment of TR-214 classroom.
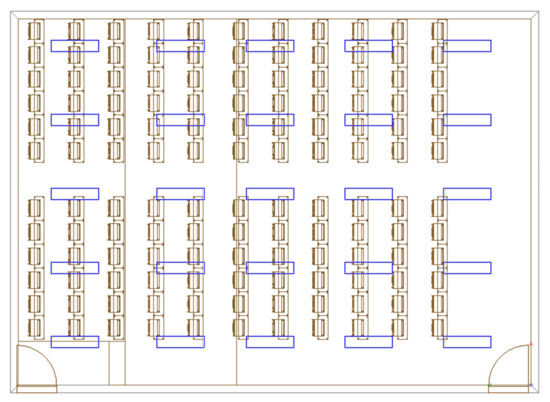
Figure 9.
Layout of TR-214 classroom.
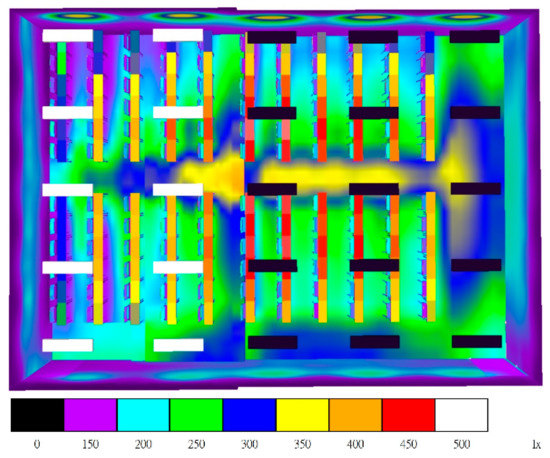
Figure 10.
Color rendering of TR-214 classroom before lighting improvement.
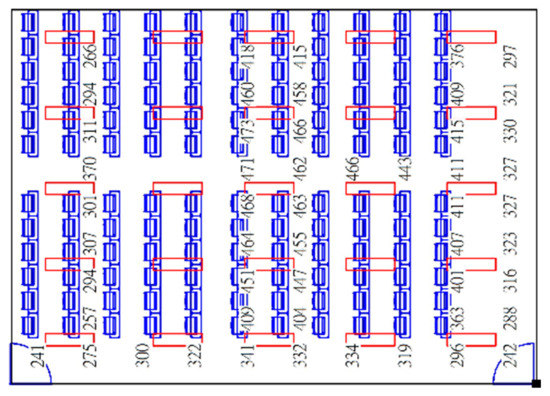
Figure 11.
Illuminance distribution before lighting improvement.
According to Figure 10 and Figure 11, it is suggested to replace T8-type fluorescent lamps with LED plate lamps and reconfigure the lamp locations, as shown in Figure 12. The spatial illuminance distribution and the work surface illuminance after improvement are depicted in Figure 13 and Figure 14, respectively. As can be seen from Figure 14, the illumination of all work desks is larger than 500 Lx, and the average illuminance after improvement is increased from 465.1 Lx to 568.2 Lx.
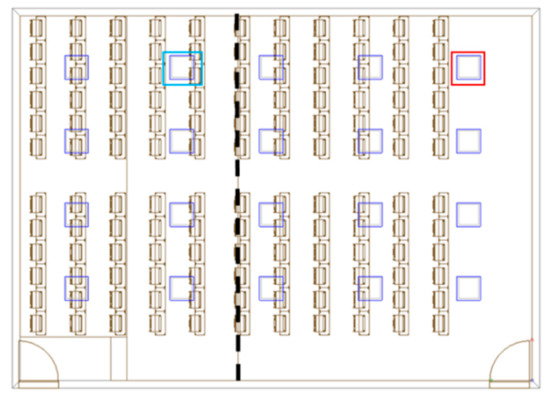
Figure 12.
Reconfiguration of lamp location in TR-214 classroom.
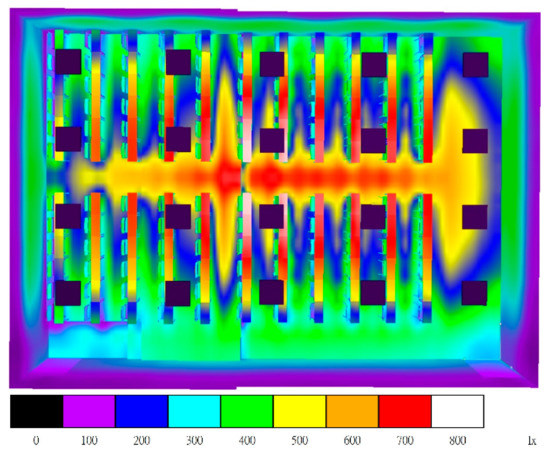
Figure 13.
Color rendering of TR-214 classroom after lighting improvement.
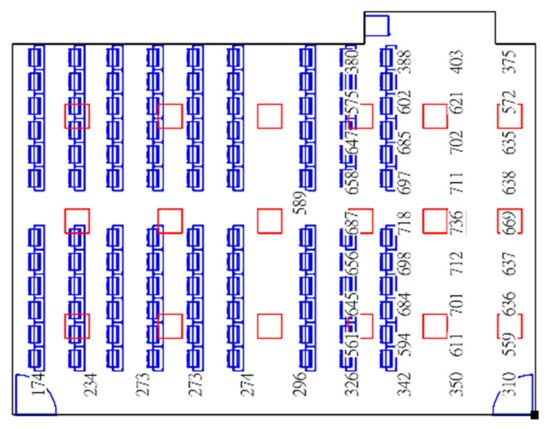
Figure 14.
Illuminance distribution after lighting improvement.
The total investment cost for the lighting replacement, including the first stage TWD 6,619,690, the second stage TWD 5,783,597, and the third stage TWD 6,628,876, is TWD 19,032,163. According to the electricity cost being TWD 2.8/kWh and the estimated total power saving being 1,550,555.7 kWh/year, the annual electricity cost can be reduced by TWD 4,341,556.072/year, and the payback period is about 4.38 years.
4.4. Elevator Power Recovery with Efficiency Evaluation
An elevator system in the building always adopts an AC three-phase motor (or hoist) to be responsible for the lifting of the elevator car, and the elevator car hoists counterweights to balance the elevator operation. When the elevator car is fully loaded and descends from a high floor to a low floor, the motor is operated in a braking state to balance the operation of the elevator because the weight of the car is larger than the counterweight. On the other hand, when the elevator car is empty and ascends from a low floor to a high floor, the motor is also operated in a braking state to balance the elevator operation because the counterweight iron is greater than the weight of the car. When the motor is braked, it will turn into a generator to generate excess power. However, most elevator systems use resistive loads to consume excess power, which causes the engine room to operate at a high temperature. Thus, an air-conditioning system is always used to reduce the operational temperature of the elevator environment such that extra energy consumption is inevitable. The major design concept of this project is to check the operating hours of each elevator in the campus and give priority to the selection of high-floor and high-frequency-used elevators for recovering excess power and sending it back to the power grid. Not only can the power use be reduced but the operating temperature of the engine room can also be lowered.
Through the records of elevator operating hours, the selection of suitable targets for implementation will effectively shorten the payback period of investment costs after estimating the energy-saving benefits of each elevator. According to the operating hours records of elevators in Taiwan Tech, the average operating hours per day of elevators in the second and third student dorms are greater than twelve hours. Thus, elevator power recovery systems via three-phase inverters are used in these dorms to convert the power back to the power grid [21], and digital meters are used on the grid-connected side to obtain the electric energy recovery rate. The electricity consumption and recycle power of elevators in the second and third student dorms from January 2020 to July 2020 are depicted in Figure 15 and Figure 16, respectively.
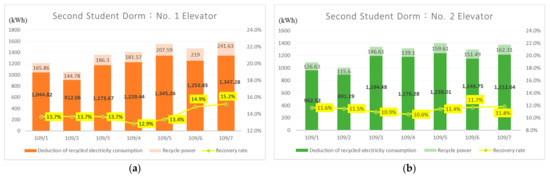
Figure 15.
Electricity consumption and recycle power of elevator in second student dorm: (a) no. 1 elevator; (b) no. 2 elevator.
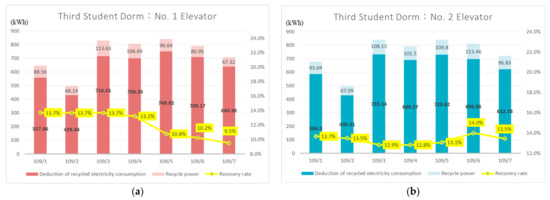
Figure 16.
Electricity consumption and recycle power of elevator in third student dorm: (a) no. 1 elevator; (b) no. 2 elevator.
The total investment cost for the elevator power recovery system is TWD 800,000. According to the electricity cost of TWD 2.8/kWh and the estimated total power saving being 49,656 kWh/year, the annual electricity cost can be decreased by TWD 139,037/year, and the payback period is about 5.75 years.
4.5. Load Consolidation and Replacement of Transformers
Generally speaking, the optimal load utilization of transformers is between 40% and 60%. If the load utilization rate of a transformer is too low, the corresponding no-load loss will increase. If the load utilization rate of a transformer is too high, it is easy to cause the internal temperature of the transformer to be too high. In Taiwan campus, the number of transformers is gradually increased with the increase in buildings. However, the increase in substation transformers leads to the average load utilization rate of all transformers to be lower than 20%, and the corresponding no-load loss is relatively increased. With the increase in the service year and the age of the transformer, load consolidation and review of suitable transformer capacity are urgent energy-saving measures.
In Taiwan Tech, the power capacity of the original high-voltage transformer in the library is 600KVA, and it has been used for 26 years, as shown in Figure 17a. In Figure 17b, the power capacity of the original high-voltage transformers in T3 building is 750KVA, and it has been used for 28 years. In general, the transformer life evaluation is based on the principle of 20 years. These transformers in Figure 17 have exceeded the evaluation operating life, and the early transformer conversion efficiency is low and has declined over time. This energy-saving measure evaluates the load rate and unit energy consumption and plans the transformer load consolidation. It has the following effects: (1) the substation space is re-planned to beautify and release some space for other utilization; (2) amorphous transformers are used to reduce losses and improve conversion efficiency; (3) the load consolidation is helpful for reducing the transformer power capacity.
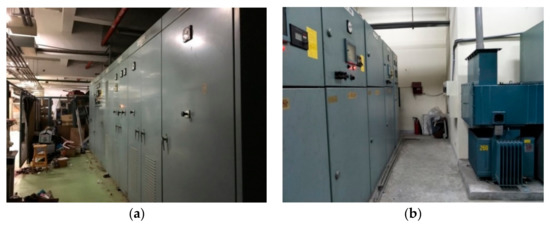
Figure 17.
Original power substation in Taiwan Tech: (a) library; (b) T3 building.
After measurement during one month, the load rate of the old 600 KVA transformer in the library is 20.9~34.7%, and it can be replaced by a 400 KVA transformer to increase the load rate over 40%, as shown in Figure 18a. On the other hand, the load rate of the old 750 KVA transformer in T3 building is 10.67~15%, and it also can be replaced by a 400 KVA transformer to increase the load rate over 40%, as shown in Figure 18b. The total investment cost for load consolidation and transformers replacement is TWD 10,300,000. According to the electricity cost being TWD 2.8/kWh and the estimated total power saving of 308,519 kWh/year, the annual electricity cost can be decreased by TWD 863,853/year, and the payback period is about 11.92 years.
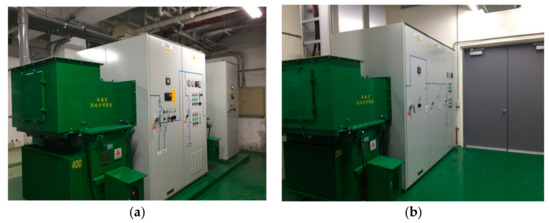
Figure 18.
New power substation in Taiwan Tech: (a) library; (b) T3 building.
4.6. Energy-Saving Lighting Delay Switch
Electric lights are one of the most commonly used electrical appliances in daily life. According to usage practices, not everyone will turn off the lights when they leave, which often results in energy waste in public areas when no one is using them at night. In Taiwan Tech, some buildings are connected to each other. In the corridor on the first floor of the building, the corridor lights are often turned on due to the need of passers-by to walk at night. However, when leaving the corridor, the user often forgets to turn off the lights. Similarly, this will happen in the toilets, staircase halls, and corridors in each building. To address this scenario, it is proposed to install energy-saving lighting delay switches in public areas, which can effectively solve the problem of energy waste caused by forgetting to turn off the lights.
In general, inductive light switches are usually installed in infrequently used places. If the sensor-based light is frequently turned on and off, it will easily cause damage to the lamp and sensor. If there is no need to turn on the light for a long time, the sensor is operated in a standby state, which will result in wasted energy. The lighting delay switch installed in Taiwan Tech must be manually pressed to turn on the light, as shown in Figure 19. The user can manually turn it off in advance when leaving, but, if the user forgets to turn it off, the controller will automatically turn it off after a preset time. After the construction of light delay switches, it will effectively reduce the energy waste due to standby of the controller and forgetting to turn off the light. The total investment cost for energy-saving lighting delay switches is TWD 648,347. According to the electricity cost being TWD 2.8/kWh and the estimated total power saving being 117,849.6 kWh/year, the annual electricity cost can be reduced by TWD 329,978.9/year, and the payback period is about 1.96 years.
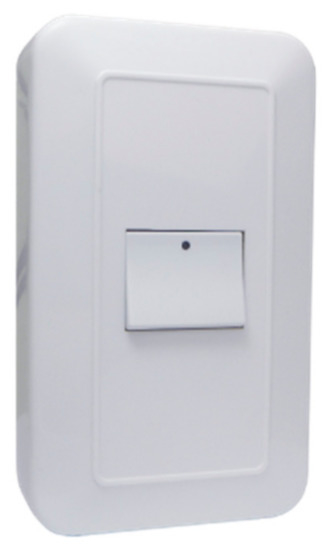
Figure 19.
Lighting delay switch.
4.7. Streetlight Replacement and Lighting Control System
In order to improve energy use efficiency and continuously improve energy performance, the high-sodium streetlights in the campus can be upgraded to LED lights. Compared with traditional high-pressure sodium streetlights, LED lighting has the following advantages: (1) the service life is relatively long; (2) they have a dimming function; (3) the loss of luminous flux is smaller; (4) the power consumption is low; (5) the light-emitting position is more concentrated. After perfect planning and setting, it will effectively improve the poor lighting efficiency, glare, and ambient light pollution, etc., and combine the control system for streetlights to effectively operate the lighting period.
Most of the streetlights in Taiwan Tech are high-pressure sodium lamps and have poor lighting efficiency at night. Besides, old lamps can easily cause glare, ambient light pollution, and waste of energy. This project plans to replace a total of 56 streetlights with 150 W and a total of 51 streetlights with 400 W, and a total of 107 high-sodium streetlights will be replaced by 60 W LED streetlights, as shown in Figure 20. The total investment cost for energy-saving light delay switches is TWD 1,794,340. According to the electricity cost of TWD 2.8/kWh and the estimated total power saving of 147,671.7 kWh/year, the annual electricity cost can be reduced by TWD 413,480.8/year, and the payback period is about 4.34 years.
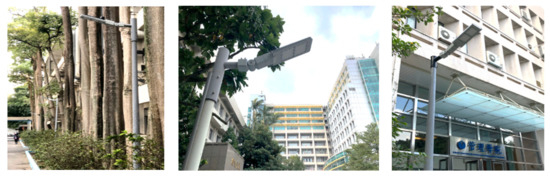
Figure 20.
Streetlight replacement.
4.8. Circulating Fans in Classrooms
In response to the impact of global warming and the greenhouse effect, the average high temperature in Taiwan in summer has been rising year by year, and the electricity consumption of air-conditioning has relatively increased throughout the campus. In midsummer, a lack of air-conditioning in indoor public areas can easily lead to complaints from teachers and students and an uncomfortable learning environment. By installing a circulating fan, the wind is concentrated into a columnar wind beam, creating a tight turbine airflow, blowing the cold air wider, reducing the dead angle of the indoor temperature difference, effectively accelerating the cooling of the indoor space, and achieving the effect of energy-saving.
In Taiwan Tech, it was planned to install 128 circulating fans in IB building, with an estimated energy-saving of 90,580 kWh/year, and it was planned to install 152 circulating fans in IA building, with an estimated energy-saving of 4,552 kWh/year, as shown in Figure 21. As can be seen from Figure 21c, an indoor temperature difference of over 1 °C can be achieved with and without circulating fans. The total investment cost for energy-saving light delay switches is TWD 642,606. According to the electricity cost of TWD 2.8/kWh and the estimated total power saving of 95,132 kWh/year, the annual electricity cost can be reduced by TWD 226,369.6/year, and the payback period is about 2.84 years.
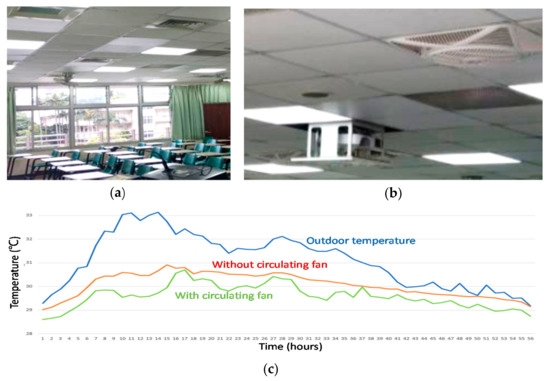
Figure 21.
Circulating fans: (a) before improvement; (b) after improvement; (c) comparison of indoor and outdoor temperature difference.
5. Results and Discussion
Raj and Soni [22] determined the exact or very near temperature required for the selected room in which air-conditioners are installed. Although the work in Ref. [22] is potentially tremendously significant for developing new technologies pertaining to saving energy, the evaluation of air-conditioner efficiency and capacity in the proposed strategy (Section 4.2) to increase the air-conditioning energy efficiency is not considered in Ref. [22].
Byun and Shin [23] investigated an intelligent lighting control system with movement detecting sensors and LED lamps that replaced the fluorescent lights and reduced by 43% the energy consumption of the lighting. However, the illuminance uniformity was only about 0.7, and external sensors required periodic maintenance and calibration. Although the method in Ref. [23] considered external sunlight, the illumination required for different spaces, and the placed spatial objects, its equipment cost is higher than the one of the proposed scene-lighting diagnosis in Section 4.3.
Kermani et al. [24] implemented a hybrid energy storage system, including an ultra-capacitor energy storage and a battery energy storage system, in order to reduce the amount of power and energy consumed by elevators in residential buildings. Although the control strategy in Ref. [24] includes the benefit of the regenerative energy received from the elevator’s motor, the operating hours of each elevator in the proposed evaluation process (Section 4.4) are not considered in Ref. [24], so the benefit will be decreased if power recovery systems are installed in every elevator.
Liang et al. [25] proposed a transformer replacement decision method based on the probability assessment of a transformer failure rate (FR). Unfortunately, a threshold value, which may be varied in different areas, should be pre-defined. Although the method in Ref. [25] can replace the transformer when the FR is higher than a pre-defined threshold value, the transformer capacity with the load consolidation in the proposed framework (Section 4.5) is not considered in Ref. [25] to further increase the load rate for alleviating the no-load loss.
According to the aforementioned descriptions in Section 4, eight energy-saving action plans and the corresponding evaluation results are summarized in Table 1. Note that the payback year is calculated according to the electricity unit price TWD 2.8/kWh in Taiwan Tech. Moreover, the carbon reduction is estimated with the power emission coefficient of 0.502 kgCO2e/kWh announced in 2020 in Taiwan. In practice, there was 1,174,880 kWh (−4.82%) less electricity consumption in 2017 than in 2016, and 182,880 kWh (−0.79%) less electricity consumption in 2018 than in 2017. Moreover, there was 1,003,329 kWh (−4.36%) less electricity consumption in 2019 than in 2018, and 715,171 kWh (−3.24%) less electricity consumption in 2020 than in 2019. Through the year-by-year power saving analysis, it can be found that the installation of the smart energy management system had a large power-saving ratio at the beginning (2017: −4.82). After that, the power saving potential was explored through data analyses, and it takes time to implement the improvement project, resulting in a low power saving ratio (2018: −0.79%). After related action plans were gradually implemented, the annual power saving performance can exceed 3% (2019: −4.36%; 2020: −3.24%). The actual power saving amounts to about 3,076,260 kWh for approximately 15.5% of the power consumption of Taiwan Tech in 2020. It can achieve the goal of saving at least 15% total power consumption in comparison with the one in 2015 for satisfying the government request yearly for Taiwan Tech before 2021.

Table 1.
Summary of energy-saving action plans and evaluation results.
Note that the power amount of 3,076,260 kWh is only 94.2% of the estimated power saving in Table 1. It is mainly due to the construction of two new buildings in 2019 and 2020, including the reconstruction of the first student dormitory and IA building. In general, the baseline analysis is usually used to judge the rationality of power consumption. The baseline analyses of the power consumption from 2017 to 2020 in Taiwan Tech are depicted in Figure 22, where the grey dotted line is the baseline analysis based on the data from 2015 to 2018 and the yellow dotted line is the baseline analysis based on the data from 2015 to 2020. As can be seen from Figure 22, it is obvious that the monthly actual electricity consumption is less than the baseline electricity consumption in 2019 and 2020. All the action plans indeed yield energy-saving benefits.
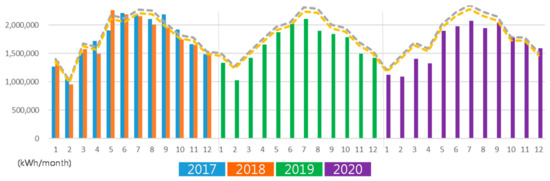
Figure 22.
Baseline analyses of power consumption from 2017 to 2020.
6. Conclusions
This study has successfully demonstrated eight energy-saving action plans for a university campus in Taiwan and taken National Taiwan University of Science and Technology (Taiwan Tech) as an example to illustrate the corresponding economic benefits. According to eight specific action plans during the period from 2016 to 2020, the estimated electricity savings can achieve up to 16% of the annual electricity consumption. After real-world application, the actual power saving amounts to around 3,076,260 kWh for approximately 15.5% of the power consumption of Taiwan Tech in 2020. As a result, the actual power saving rate is near the preset one after the implementation of qualified action plans.
The major contributions of this study are as follows: (1) the data analyses from the smart energy management system to search for energy-saving potential and not only energy visualization; (2) the update of air conditioners by considering host efficiency and the required cooling capacity and not only one-on-one replacement; (3) the exchange of high-efficiency LED lamps by scenario simulations to reduce the required amount of lamps; (4) the installation of electric energy recovery devices in elevators on high floors and floors with high usage frequency (not installed on all elevators); (5) load consolidation and transformers replacement to increase the load rate and decrease no-load loss; (6) the usage of light delay switches to reduce manpower waste for patrolling to turn off lights; (7) installation of circulating fans in classrooms to speed up air cooling for alleviating the conditioner load. Through the case analysis in this study, it is believed that related energy managers on campus can refer to these action plans to implement effective energy-saving and carbon reduction strategies in the future.
Funding
This research was funded in part by Ministry of Science and Technology of Taiwan grant number [111-2221-E-011-063-MY3].
Conflicts of Interest
The author declares no conflict of interest.
References
- International Energy Agency. Global Energy Review; International Energy Agency: Paris, France, 2020. [Google Scholar]
- Sen, G.; Chau, H.W.; Tariq, M.A.U.R.; Muttil, N.; Ng, A.W.M. Achieving sustainability and carbon neutrality in higher education institutions: A review. Sustainability 2022, 14, 222. [Google Scholar] [CrossRef]
- Lee, L.S.; Lee, Y.F.; Altschuldb, J.W.; Pan, Y.J. Energy literacy: Evaluating knowledge, affect, and behavior of students in Taiwan. Energy Policy 2015, 76, 98–106. [Google Scholar] [CrossRef]
- Black, R.; Davidson, P.; Retra, K. Intrinsic changes: Energy saving behavior among resident university students. Aust. J. Environ. Educ. 2010, 26, 85–99. [Google Scholar] [CrossRef]
- Khalid, A.; Manshoor, B.; Rahim, E.A.; Siswanto, W.A.; Abdullah, K. Energy saving measures for university public library: A case study of UTHM library. Appl. Mech. Mater. 2014, 660, 1072–1075. [Google Scholar]
- Han, Y.; Zhou, X.; Luo, R. Analysis on campus energy consumption and energy saving measures in cold region of China. Procedia Eng. 2015, 121, 801–808. [Google Scholar] [CrossRef]
- Song, J.; Zhang, X.; Meng, X. Simulation and analysis of a university library energy consumption based on EQUEST. Procedia Eng. 2015, 121, 1382–1388. [Google Scholar] [CrossRef]
- Hong, W.H.; Kim, J.Y.; Lee, C.M.; Jeon, G.Y. Energy consumption and the power saving potential of a university in Korea: Using a field survey. J. Asian Archit. Build. Eng. 2011, 10, 445–452. [Google Scholar] [CrossRef]
- Elmuradov, D.; Zali, S.M.; Hanafi, N.H.; Zain, Z.M.; Zaaba, S.K.; Jusoh, M.S. Energy efficiency in a new university campus: Preliminary findings. J. Sustain. Dev. 2015, 8, 184–193. [Google Scholar] [CrossRef]
- Oyedepo, S.O.; Anifowose, E.G.; Obembe, E.; Khanmohamadi, S. Energy-saving strategies on university campus buildings: Covenant University as case study. In Energy Services Fundamentals and Financing; Elsevier: Amsterdam, The Netherlands, 2021; pp. 131–154. [Google Scholar]
- Litardo, J.; Palme, M.; Hidalgo-León, R.; Amoroso, F.; Soriano, G. Energy saving strategies and on-site power generation in a university building from a tropical climate. Appl. Sci. 2021, 11, 542. [Google Scholar] [CrossRef]
- Rewthong, O.; Eamthanakul, B.; Chuarung, S.; Sansiribhan, S.; Luewarasirikul, N. Status of total electric energy consumption in university. Procedia-Soc. Behav. Sci. 2015, 197, 1166–1173. [Google Scholar] [CrossRef]
- Latif, A.F.; Ahmad2, N.A.; Abdullah, M.R.; Ismail, A.; Ghani, A.A.A. A review on energy performance in Malaysian universities through building information modelling (BIM) adaptation. Earth Environ. Sci. 2019, 291, 012033. [Google Scholar] [CrossRef]
- Yildiz, Y.; Koçyiğit, M. A study on the energy-saving potential of university campuses in Turkey. Eng. Sustain. 2020, 173, 379–396. [Google Scholar] [CrossRef]
- Testi, D.; Conti, P.; Schito, E.; Urbanucci, L.; D’Ettorre, F. Synthesis and optimal operation of smart microgrids serving a cluster of buildings on a campus with centralized and distributed hybrid renewable energy Units. Energies 2019, 12, 745. [Google Scholar] [CrossRef]
- Alavijeh, N.M.; Steen, D.; Norwood, Z.; Tuan, L.A.; Agathokleous, C. Cost-effectiveness of carbon emission abatement strategies for a local multi-energy system-A case study of Chalmers university of technology campus. Energies 2020, 13, 1626. [Google Scholar] [CrossRef]
- Clark, S.; MacLachlan, M.; Marshall, K.; Morahan, N.; Carroll, C.; Hand, K.; Boyle, N.; O’Sullivan, K. Including digital connection in the united nations sustainable development goals: A systems thinking approach for achieving the SDGs. Sustainability 2022, 14, 1883. [Google Scholar] [CrossRef]
- Sneesl, R.; Jusoh, Y.Y.; Jabar, M.A.; Abdullah, S. Revising technology adoption factors for IoT-based smart campuses: A systematic review. Sustainability 2022, 14, 4840. [Google Scholar] [CrossRef]
- Wai, R.J.; Huang, Y.C.; Chen, Y.C.; Lin, Y.W. Performance comparisons of intelligent load forecasting structures and its application to energy-saving load regulation. Soft Comput. 2013, 17, 1797–1815. [Google Scholar] [CrossRef]
- Lin, C.P.; Wai, R.J.; Shen, Y.L. Newly-design energy-saving diagnosis method of user-side scene lighting. Environ. Prog. Sustain. Energy 2019, 38, e13058. [Google Scholar] [CrossRef]
- Jabbour, N.; Mademlis, C. Supercapacitor-based energy recovery system with improved power control and energy management for elevator applications. IEEE Trans. Power Electron. 2017, 32, 9389–9399. [Google Scholar] [CrossRef]
- Raj, A.; Soni, N. Review of design of air conditioning system for commercial and domestic applications. Int. Res. J. Eng. Technol. 2017, 4, 3124–3128. [Google Scholar]
- Byun, J.; Shin, T. Design and implementation of an energy-saving lighting control system considering user satisfaction. IEEE Trans. Consum. Electron. 2018, 64, 61–68. [Google Scholar] [CrossRef]
- Kermani, M.; Shirdare, E.; Abbasi, S.; Parise, G.; Martirano, L. Elevator regenerative energy applications with ultracapacitor and battery energy storage systems in complex buildings. Energies 2021, 14, 3259. [Google Scholar] [CrossRef]
- Liang, G.; Li, S.; Qi, Y.; Cao, J.; Hao, Y.; Chen, W. A transformer replacement decision method based on probability assessment of failure rate. Energy Power Eng. 2017, 9, 748–755. [Google Scholar] [CrossRef]


Publisher’s Note: MDPI stays neutral with regard to jurisdictional claims in published maps and institutional affiliations. |
© 2022 by the author. Licensee MDPI, Basel, Switzerland. This article is an open access article distributed under the terms and conditions of the Creative Commons Attribution (CC BY) license (https://creativecommons.org/licenses/by/4.0/).