Article

A Study on the Train Brake Position-Based Control Method for Regenerative Inverters

1
Department of Transportation Engineering, Korea University of Science & Technology, 217 Gajeong-ro, Yuseong-gu, Daejeon 34113, Korea
2
Smart Electrical & Signaling Division, Korea Railroad Research Institute, 176 Cheoldobangmulgwan-ro, Uiwang-si 16105, Korea
*
Author to whom correspondence should be addressed.
Energies 2022, 15(18), 6572; https://doi.org/10.3390/en15186572
Submission received: 3 August 2022 / Revised: 5 September 2022 / Accepted: 6 September 2022 / Published: 8 September 2022
(This article belongs to the Topic Transportation in Sustainable Energy Systems)

Abstract

:
The use an inverter is one of the representative ways to utilize regenerative braking energy in railway systems. Due to the nature of urban railways that generate a large amount of regenerative energy, the economic advantages are clear. However, in the case of the existing inverter operation method, a method of operating the inverter using the threshold voltage is used, which has a disadvantage in that power cannot be utilized between the no-load voltage and the threshold voltage. Therefore, in this paper, we propose an optimal location selection method and capacity calculation method for installing a regenerative inverter in an urban rail system, and a control method according to the train brake position to increase the regenerative energy utilization rate. First, the inverter capacity and location were selected by selecting the maximum regenerative energy generation for each substation section through the train performance simulation (TPS) based DC power simulation (DCPS). An inverter control method based on train brake position (BP method) is introduced. Finally, PSCAD/EMTDC, a power analysis program, was used to verify the proposed method. As a result, the use of regenerative energy by an inverter increased by about 62.6%, and more energy was saved at nearby substations through the BP method.

1. Introduction

Many efforts are being made to reduce carbon emissions in response to climate change around the world [1,2,3]. In particular, Korea aims to reduce carbon emissions by 24.4% compared to 2017 levels by 2030. In the railway system field, many studies are being conducted to utilize the energy generated by regenerative braking using the short distance between stations of urban railways and frequent accelerating and braking of trains. However, when a train is braking, a large amount of energy is generated for a short time, so it is necessary to use the regenerative energy in a timely manner [4,5,6,7].
The regenerative energy utilization facilities typically used in DC electric railways are the energy storage system (ESS), regenerative resistors (ReR), and regenerative inverters. First, in the case of ESS, energy is supplied through charging and discharging. Although it has the advantages of reducing peak and power consumption and stabilizing the catenary voltage, it is uneconomical as the capacity of ESS increases, and charging is impossible when ESS is fully charged [8,9,10]. For ReR, surplus regenerative power is consumed as joule heat, and regenerative energy is usually consumed by installing a resistor inside the train. It is economical compared to other methods, but it requires management of the heat generated by the resistor and has the biggest disadvantage in terms of energy efficiency because regenerative power cannot be used [11].
The regenerative inverter is designed to convert direct current into alternating current and supply it to the station load. Like ESS, the regenerative inverter can reduce the peak and power consumption of the station load. Compared to energy storage devices, it occupies a smaller space, and the cost is lower due to the development of high-power IGBT semiconductors. In addition, unlike ESS, it has a low risk of fire and has been evaluated as a stable system. Additionally, it does not have limitations like ESS capacity, which cannot be used when it is fully charged [12,13].
With the increasing use of inverters, various studies have been conducted to increase their regenerative energy utilization rates. Location optimization was derived by simulating changes in parameters according to the physical location of the inverter [14]. Accordingly, a method of selecting an inverter installation position using a genetic algorithm has also been studied. In order to increase the energy efficiency of the inverter, research has also been conducted to minimize energy loss and arrange the inverter [15]. Most of the previous studies have increased the utilization rate of the inverter in consideration of the physical arrangement of the inverter. This paper shows the differences in control over the behavior of inverters from previous papers.
In the conventional inverter control method, when the catenary voltage is higher than the threshold voltage ( V t h ), the inverter performs its operation. In this method, since the inverter does not operate in the voltage range between the no-load voltage and the V t h , energy is not utilized even if regenerative energy is generated by the actual train braking. To increase the energy utilization, this paper proposes a method to select a substation where the highest regenerative energy is generated through the power-flow of the electric railway system and combine the inverter operation method with the existing method.
Power-flow analysis and system analysis of DC feed systems must precede the application of regenerative inverters to railway traction systems. In order to improve energy efficiency, various analytical models were derived based on the optimal train control method using the Pontryagin Maximum Principle [16,17,18,19,20]. However, several interpretation methods lack an interpretation of the entire traction system, and power-flow analysis is essential to analyze the improvement of overall system efficiency [21,22]. Power-flow analysis of the power supply system can find regions where regenerative braking occurs the most for each substation section. That is, an inverter is installed based on a place where the maximum regenerative power is generated, and the capacity thereof is calculated according to the peak power value.
This paper describes the train brake position-based operation control method (BP method) to be used together with conventional inverter operation. The BP method should be additionally considered as the loss increases with distance in terms of track loss even if there is an accelerating train ahead due to the short headway time. The longer the headway time, the greater the loss over distance, so it is necessary to consider where the train is braking. For the verification of this paper, it was modeled on the power supply system of Incheon Line 2, which is actually operated in Korea, and its authenticity was verified through PSCAD/EMTDC, a power analysis program. The comparison of the methodology obtained by adding the operation method according to the existing V t h and the train braking position-based operation method was shown by comparing the regenerative energy utilization rate.

2. Selecting Optimal Location and Capacity of Inverter

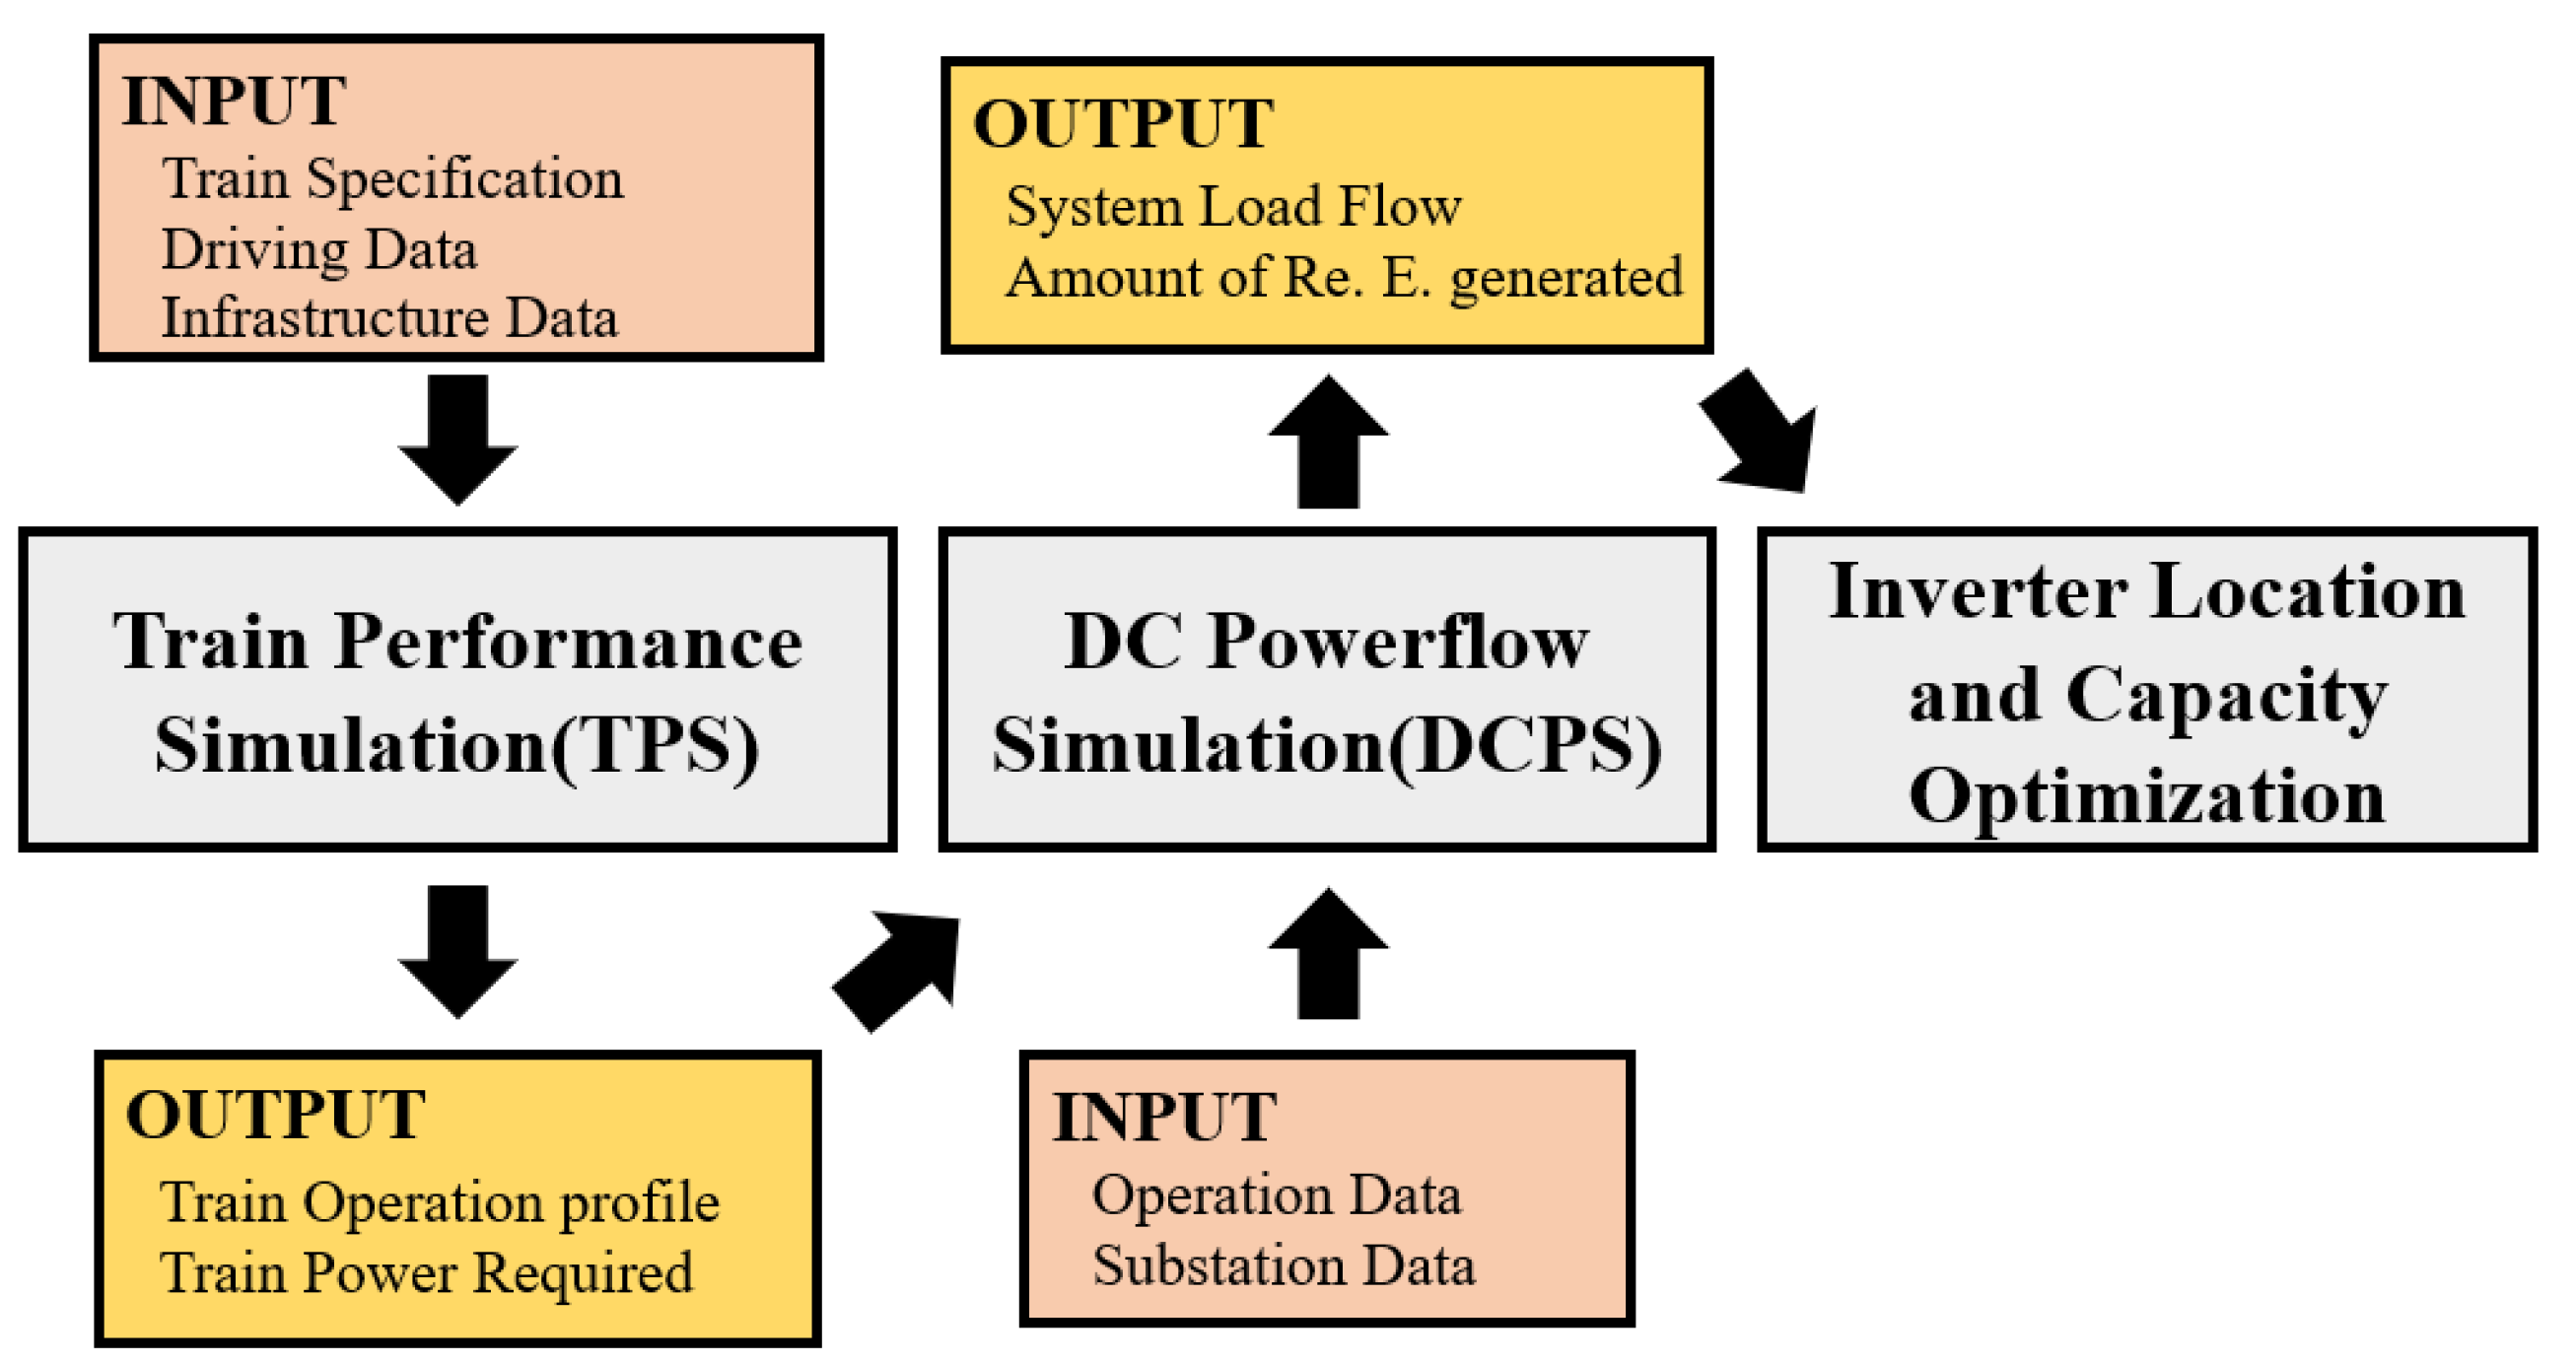
2.1. Overview of Inverter Installation and DC Power Simulation

Before designing an inverter, an analysis of the system is required. As regenerative energy generated by the gradient and curve of tracks is different throughout a rail line, it is possible to find the maximum regenerative energy generation region in the system through analysis of the power supply system. The power analysis of the DC traction system is performed in two stages. TPS can be used to derive the speed profile of the train and the amount of power required for each section required to operate the train, and DCPS can be used to derive the results of power-flow analysis and regenerative generation for the entire system. Figure 1 shows the flow chart for the analysis of the entire system.

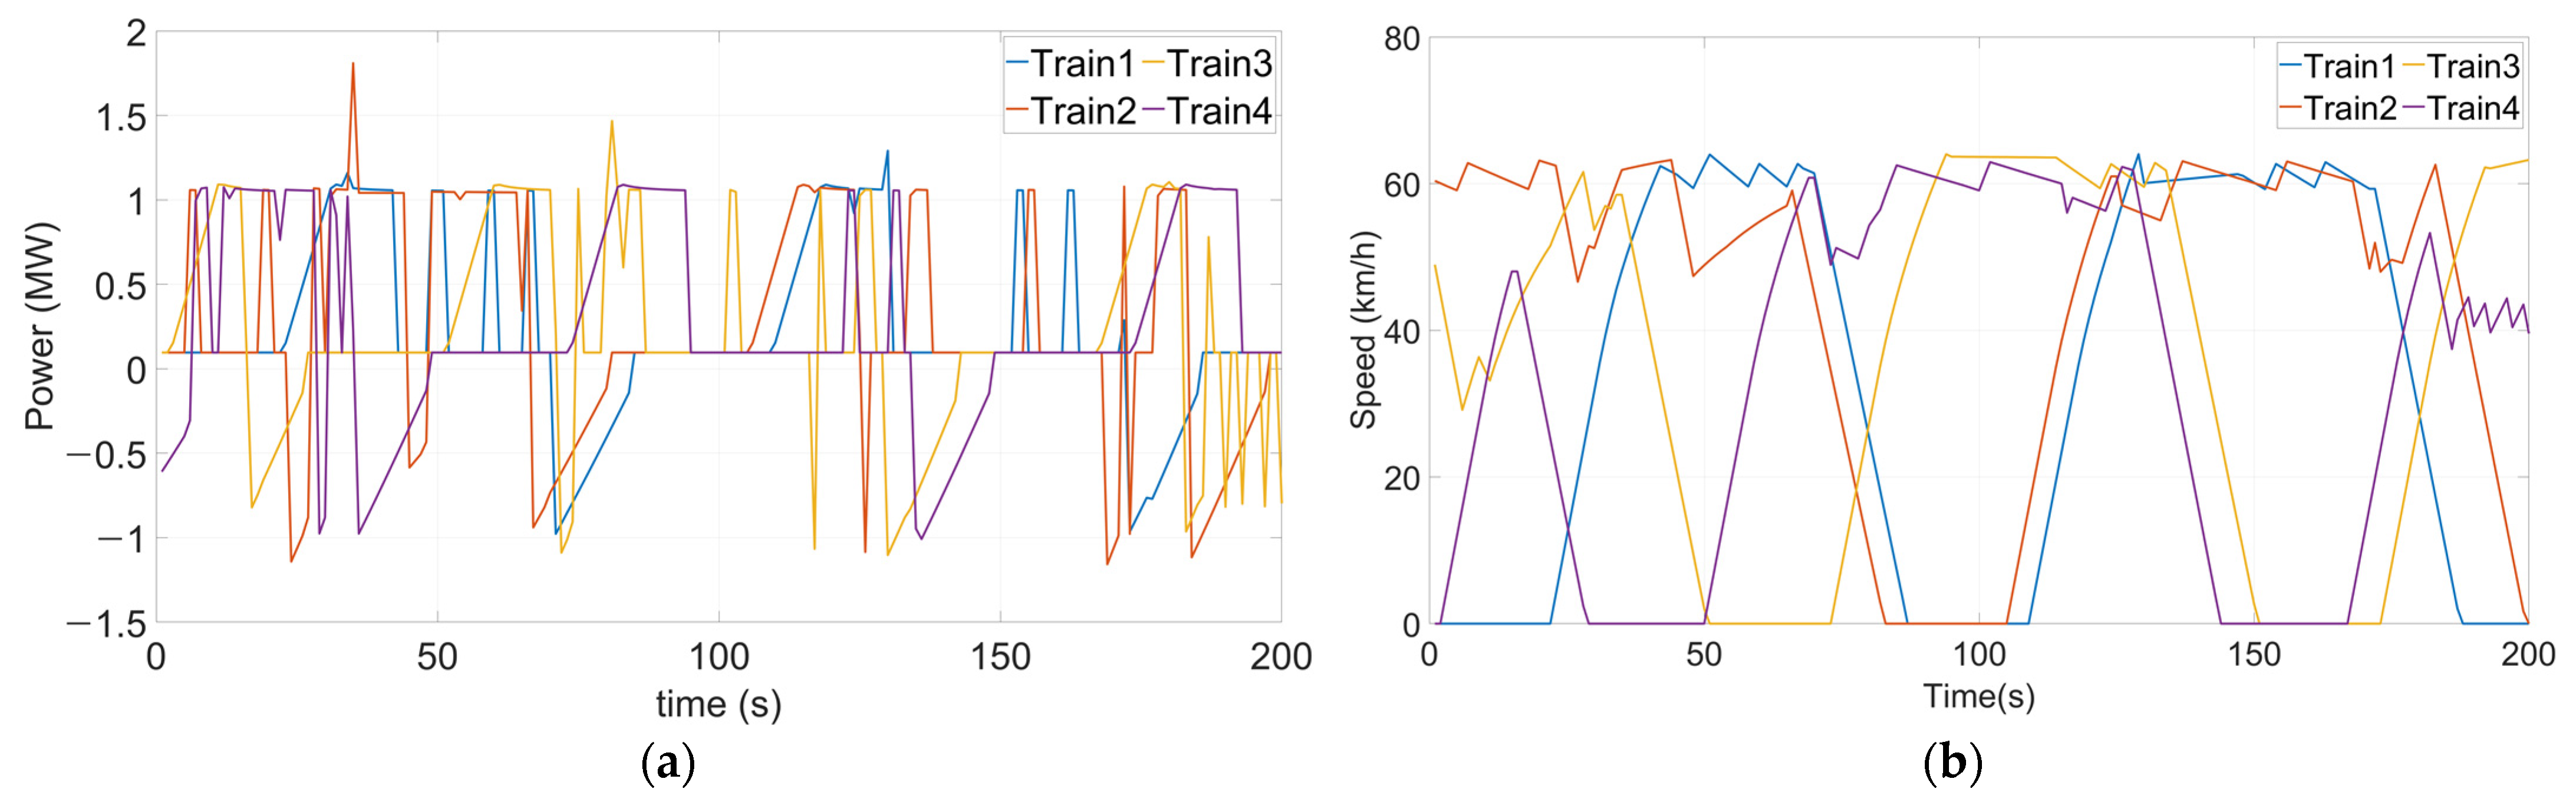
2.2. Train Performance Simulation

The TPS outputs driving power and train operation patterns necessary for train operation on the corresponding track based on various integers of the electric railway track. As one train moves, the speed and required power are calculated according to each position of the route and used as the input value of the DCPS. The input value of the TPS requires operation data including information on tracks, such as gradients and curves, train specifications, speed width, and dwell time. TPS is derived based on Newton’s law of motion to calculate driving power.
F E T F ( t ) = m d y n a ( t )
F E T F ( t ) = F M T F ( t ) R T ( t )
R T ( t ) = R R ( t ) + R C ( t ) + R G ( t )
where F E T F is the effective traction force, m d y n is the dynamic mass, F M T F is the motor traction force, and R T is the total resistance of the train. R T includes a driving resistance R R , a curve resistance R C , and a gradient resistance R G . For R R , it is defined as Equation (4) by the Davis Equation. The coefficients A, B, and C of R R are values obtained by experiments that change depending on the characteristics of the train, road surface, and rail [22,23,24].
R R = A + B v + C v 2
When F E T F is calculated, mechanical power can be calculated according to the speed of the train. Electrical power can be obtained by multiplying or dividing mechanical power by the total efficiency of inverters, motors, and gears to obtain traction power ( P t ) or braking power ( P b ). If the mechanical power is less than zero, it is classified as P b , and if it is greater than zero, it is classified as P t . Here, the traction power efficiency is expressed as T e f f , and the braking power efficiency is expressed as B e f f . Since the power required for air conditioners or lighting in the train itself is constant, it is fixed as a constant value and defined as auxiliary power ( P a u x ). The power required for a train ( P t r a i n ) considering all of the P t , P b , and P a u x is as shown in Equation (7).
P t ( t ) = F E T F ( t ) × v ( t ) T e f f
P b ( t ) = F E T F ( t ) × v ( t ) × B e f f
P t r a i n ( t ) = P t ( t ) P b ( t ) + P a u x
If the information on the acceleration is known, the position and speed of the train can be calculated by the equation of motion.
v ( t ) = v 0 + a t
x ( t ) = x 0 + v 0 t + 0.5 a t 2

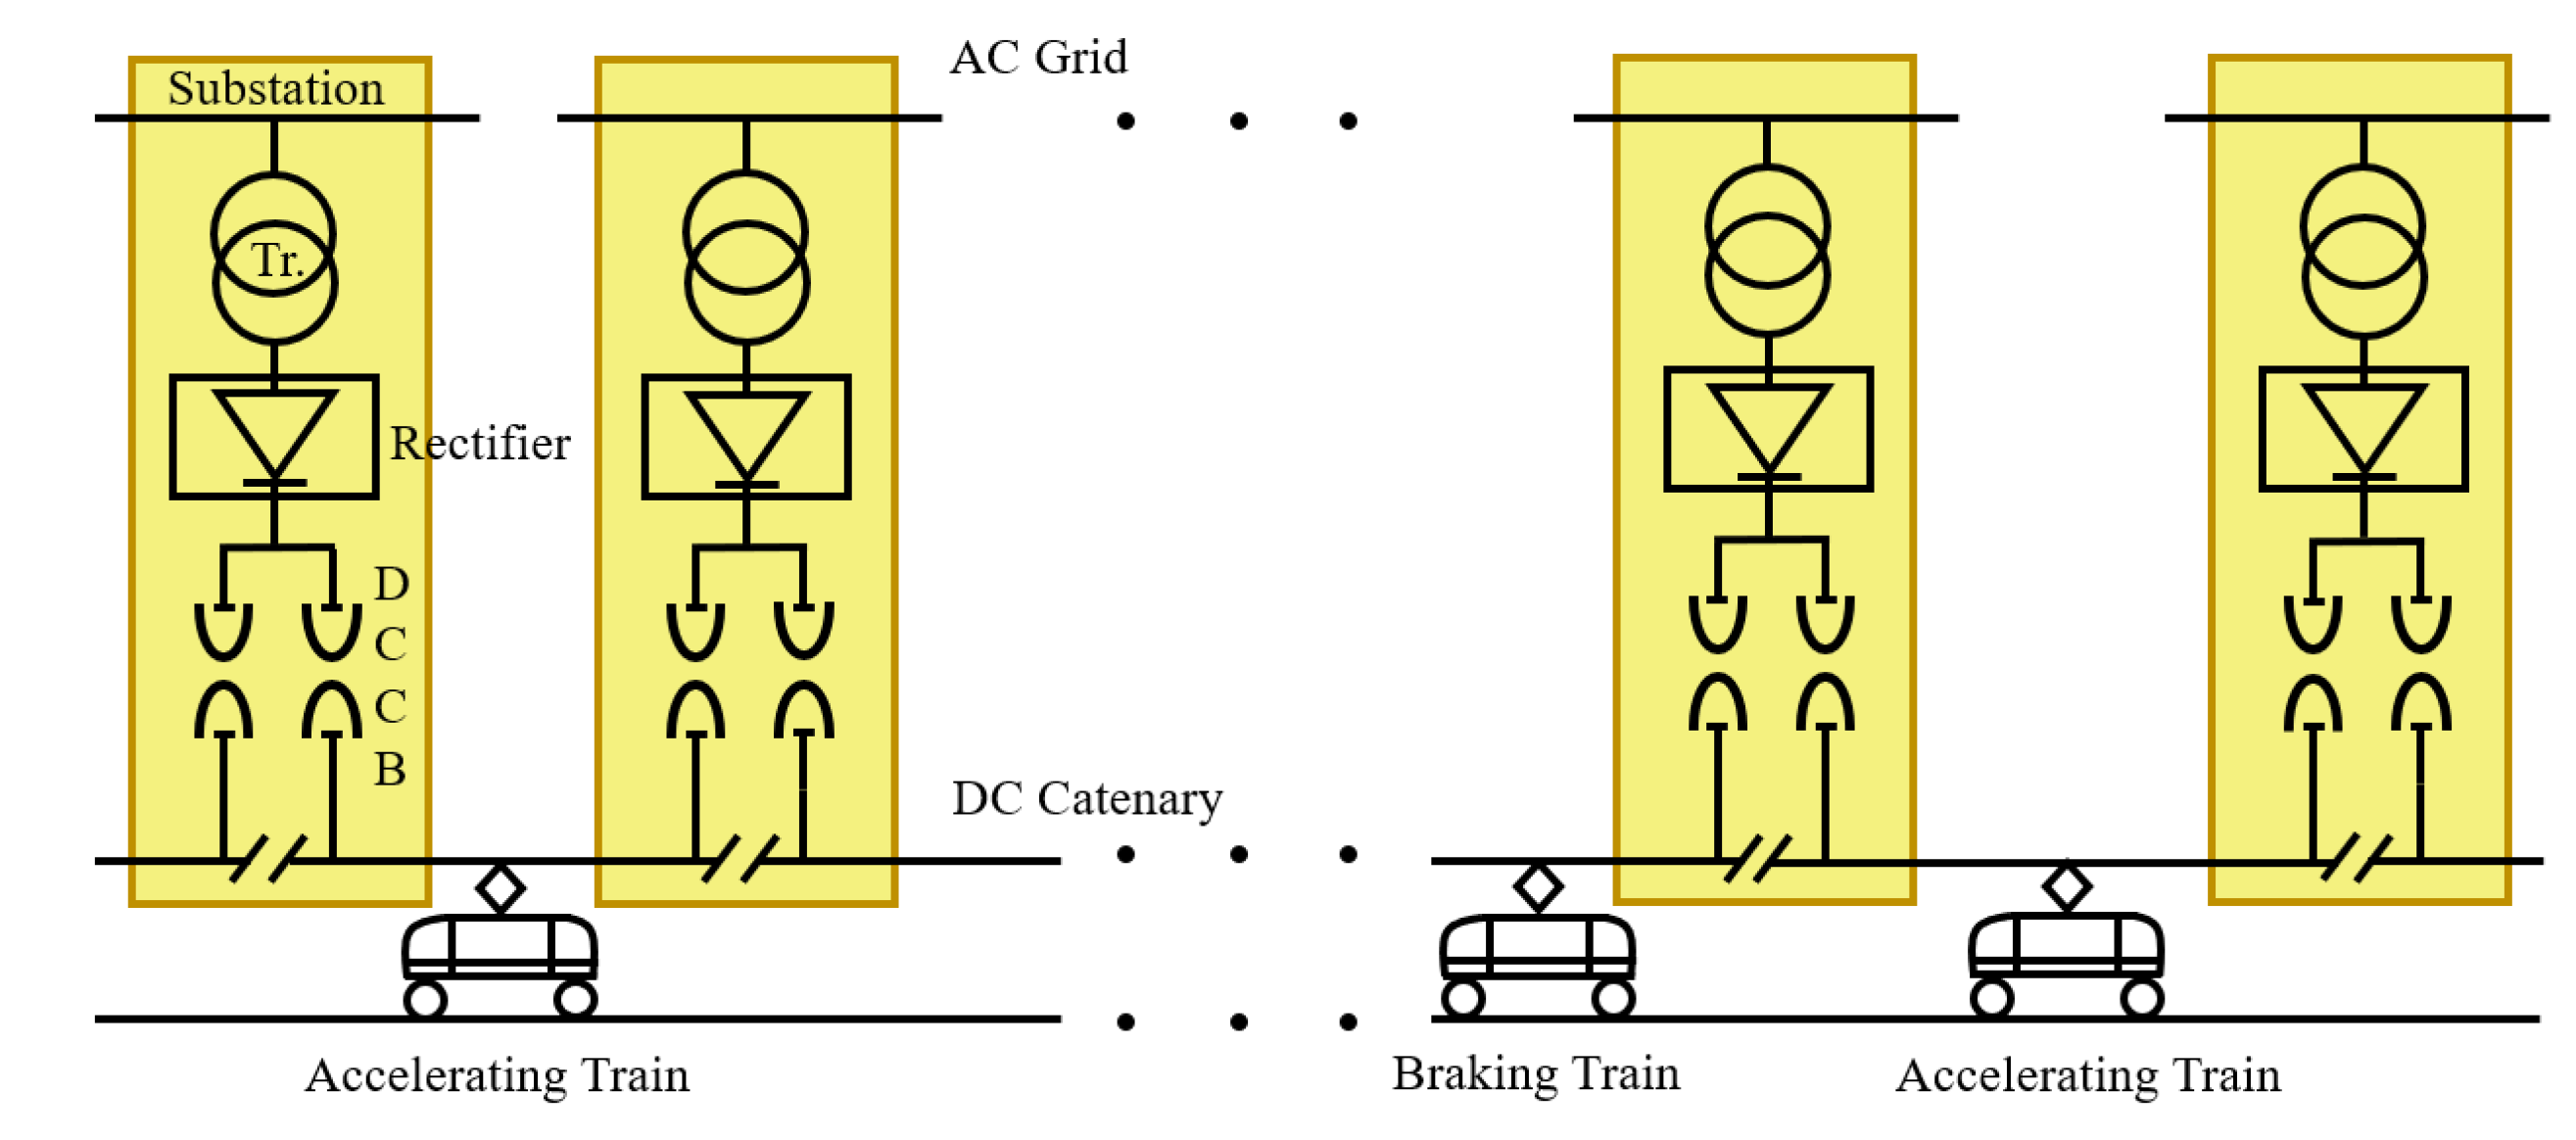
2.3. DC Power Simulation

If the required power is calculated according to the location of the train on the route derived from the TPS, power-flow will be possible through DCPS when several trains are operated in line with the headway. Unlike general power systems, an electric railway power supply system differs in the characteristics of loads, in which the loads always change in time and space, and operates as a power source during regenerative braking. The DC traction system can be expressed as a Norton equivalent circuit and interpreted through nodal analysis. Conductance and voltage for nodal analysis are expressed as follows.
g f i , j :   Feeder   conductance   between   node   i   and   j
g r i , j :   Rail   conductance   between   node   i   and   j
V i :   Voltage   at   node   i
Train load has nonlinearity due to its characteristics that are expressed as a nonlinear equation when solving the node equation. For this reason, the method of obtaining a voltage after setting an assumed current for a train load through the repetition method using iteration is applied, and where a voltage falls within an error, the iteration is completed. Train load modeling can be divided into the current vector iteration (CVI) method using ideal current source, and the conductance iteration (CI) method, which is modeled as conductance. The CI method repeats matrix formation and matrix factorization every time the conductance of a modeled train is updated during iteration, but the CVI method simplifies the operation because the train load is represented by the current [21,25]. The simplified general DC feed system is shown in Figure 2, and the equivalent circuit for it is shown in Figure 3. I s , i is substation current, and G s , i is the internal conductance of each substation.
As the train moves, the conductance and the amount of power required by the train are repeatedly derived through the input value, and the nodes of the equivalent circuit are arranged based on the distance to form a matrix. The node voltage V i is calculated by putting an assumption into load current I t , i of the train, and if the voltage meets the error range, the iteration method moves on to the next time step.

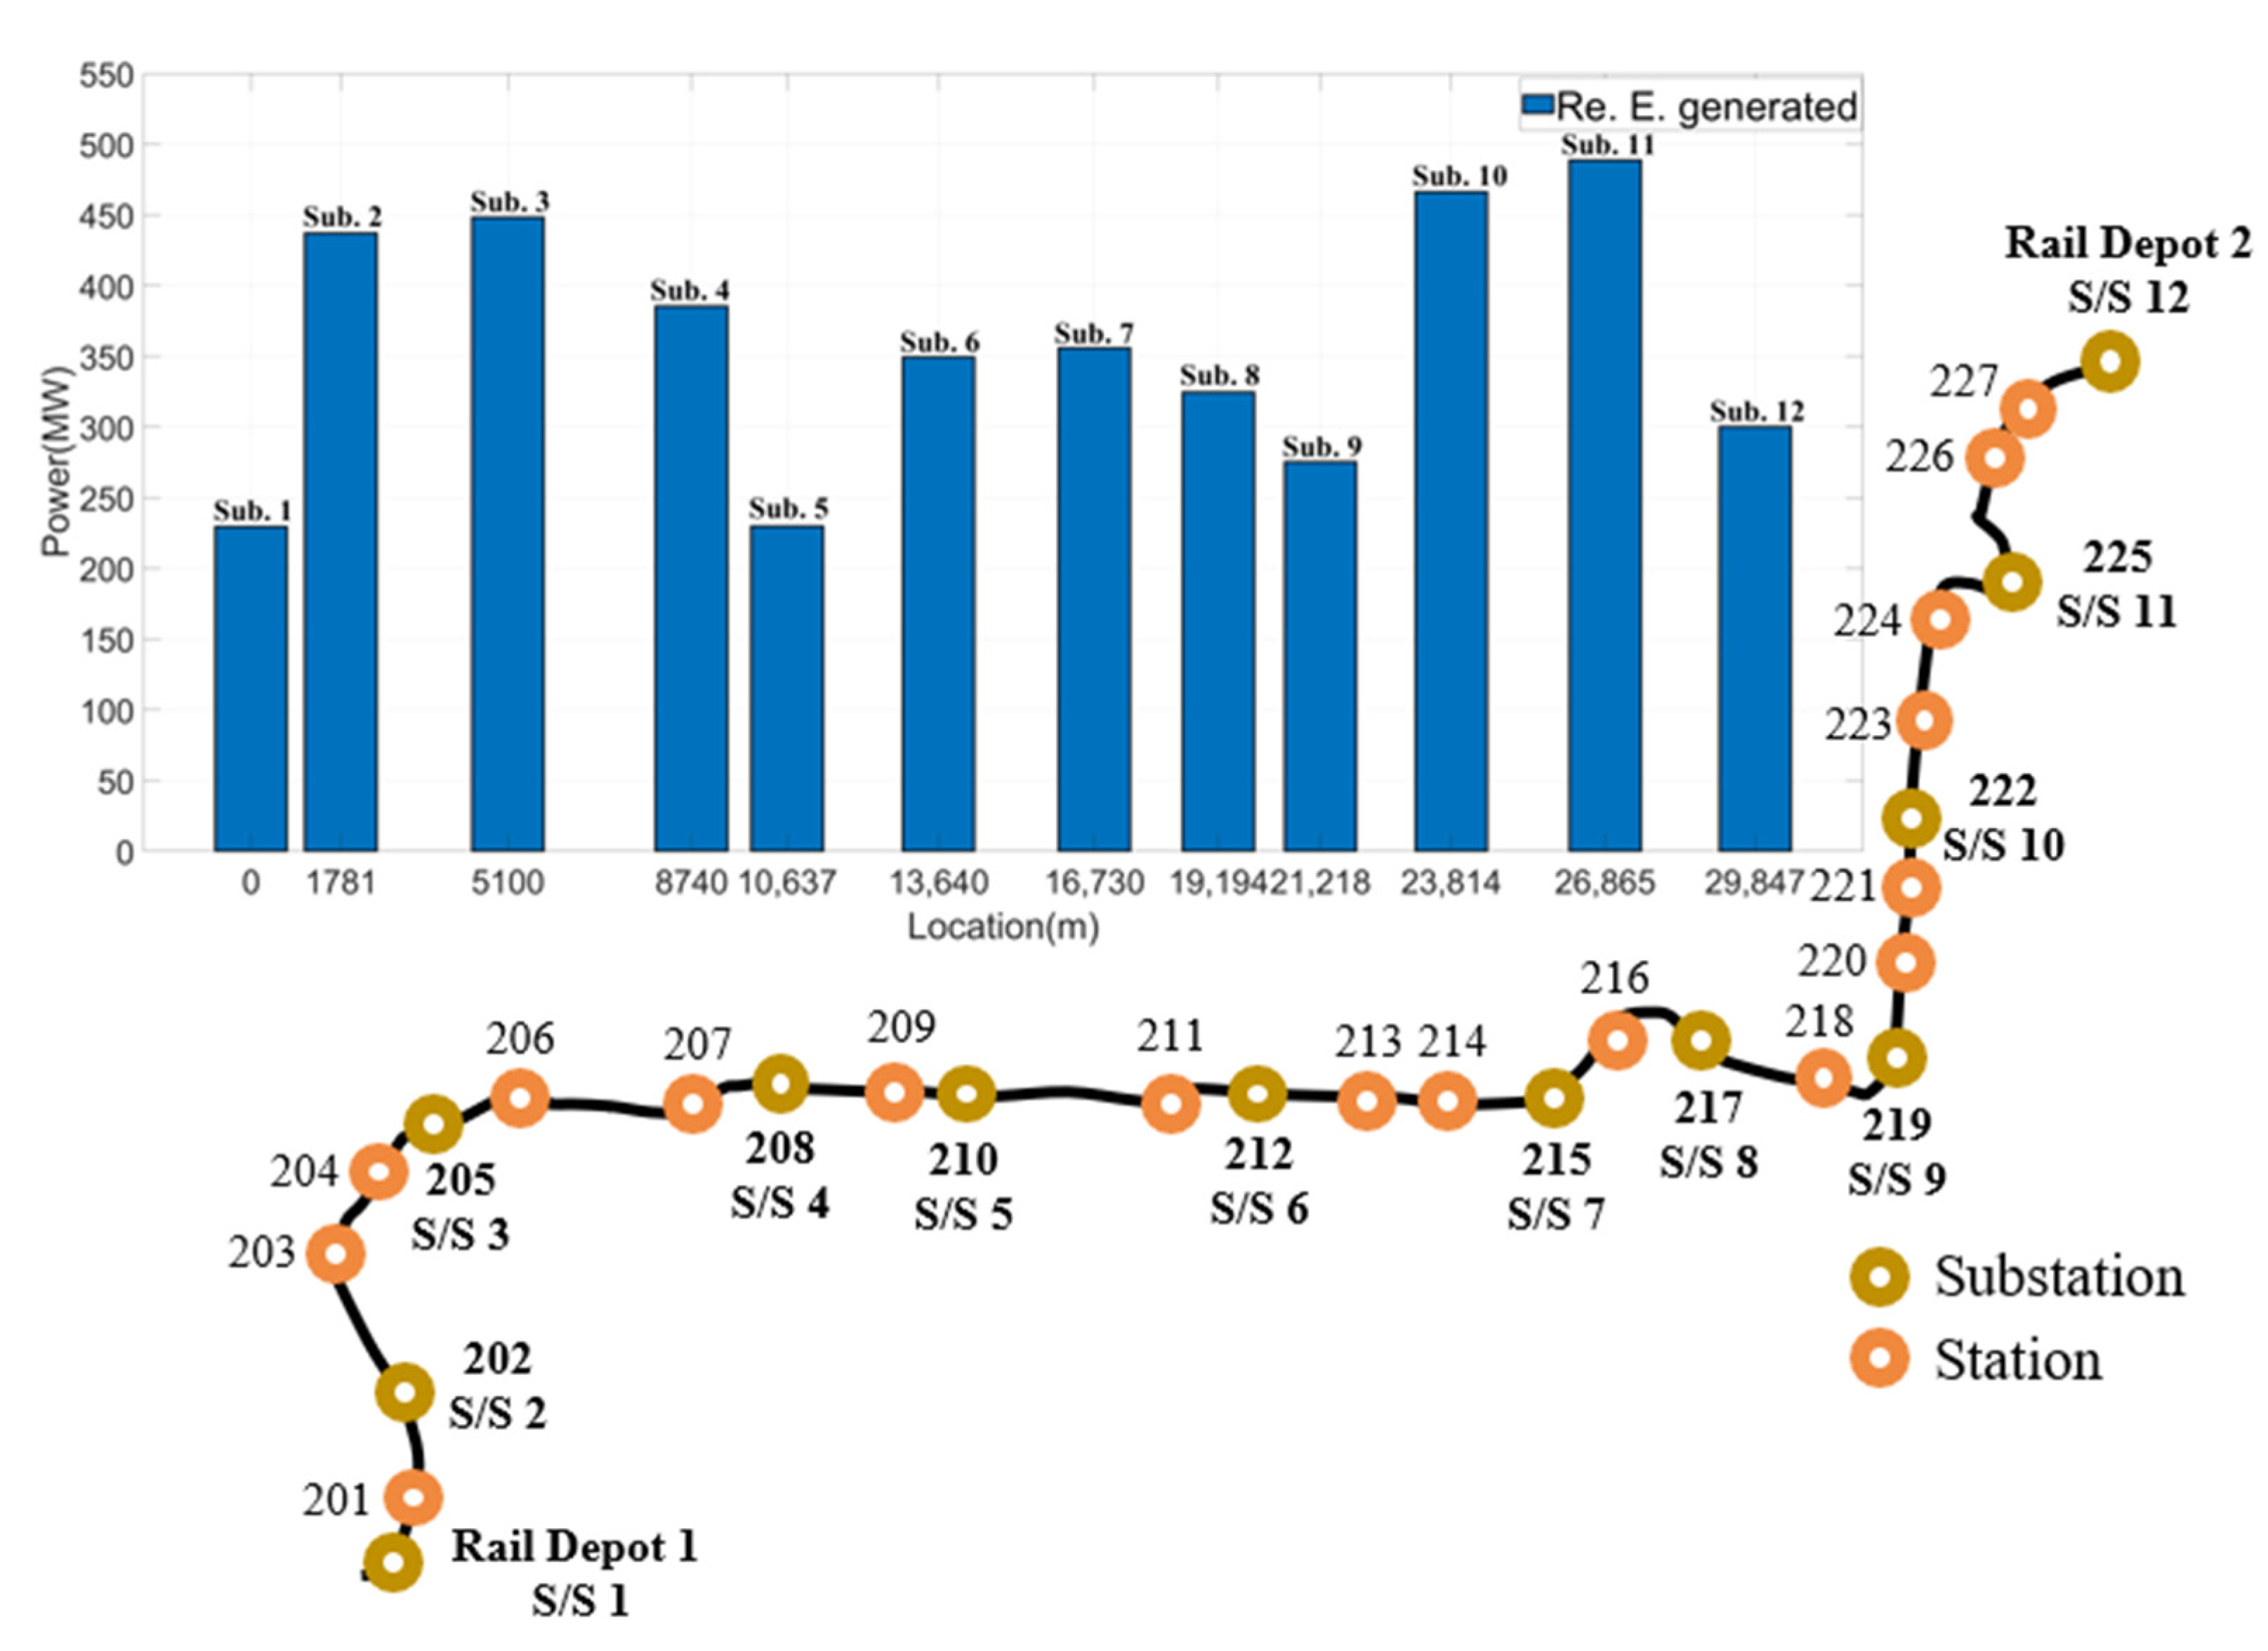
2.4. DCPS Based Inverter Location and Capacity Selection

The conventional inverter control method is closely related to voltage because it operates depending on V t h . Since the DC traction system in Korea uses a parallel power supply, a change in catenary voltage will occur similarly at all substations. Figure 4a shows 700 s out of the DCPS results for 1 h. In fact, data on Incheon Line 2 operated in Korea were used, and the voltage profile of the 12 substations was shown. Nominal voltage of the system is 750 V DC. Comparing the maximum voltage generated by each substation, each has a different maximum voltage as shown in Figure 4b. Substations 1 and 12 located at both ends have a relatively low maximum voltage compared to other substations.
However, apart from the inverter operation method, it is necessary to review the amount of regenerative energy generated for each substation. Depending on the rail route, the speed limit of the train is formed by the total length, slope, and curve for each substation section, and the amount of regenerative power generated is different. The amount of regenerative power generated in each substation section is calculated as in Equation (10).
P r e g , n = 0 T { V s u b , n t ( d t ) × I r e g , n t ( d t ) }
where V s u b is substation feeder voltage and I r e g is current flowing into the substation. During the simulation time T, it is possible to derive the amount of regenerative power generated for each section using Equation (10). During the one-hour period represented using the DCPS results, the amount of regenerative energy generated by substations is as shown in Figure 5. The x-axis of the graph represents the location of each substation.
The correlation between the amount of regenerative power generated for each substation and the maximum voltage was represented by the Pearson correlation coefficient, and it was confirmed that there was no correlation at about 0.057. In other words, in order to increase the utilization rate of regenerative energy, the most reasonable approach is to install it in the substation where the most regenerative energy occurs. If multiple inverters are installed, the optimal capacity can be calculated by considering the loss rate for the capacity of each inverter, which is the ratio of regenerative energy generated by the actual train and regenerative energy consumed by the inverter [26]. This paper calculated the capacity with a margin of 10% based on the peak power at the point where the maximum regenerative energy is generated.

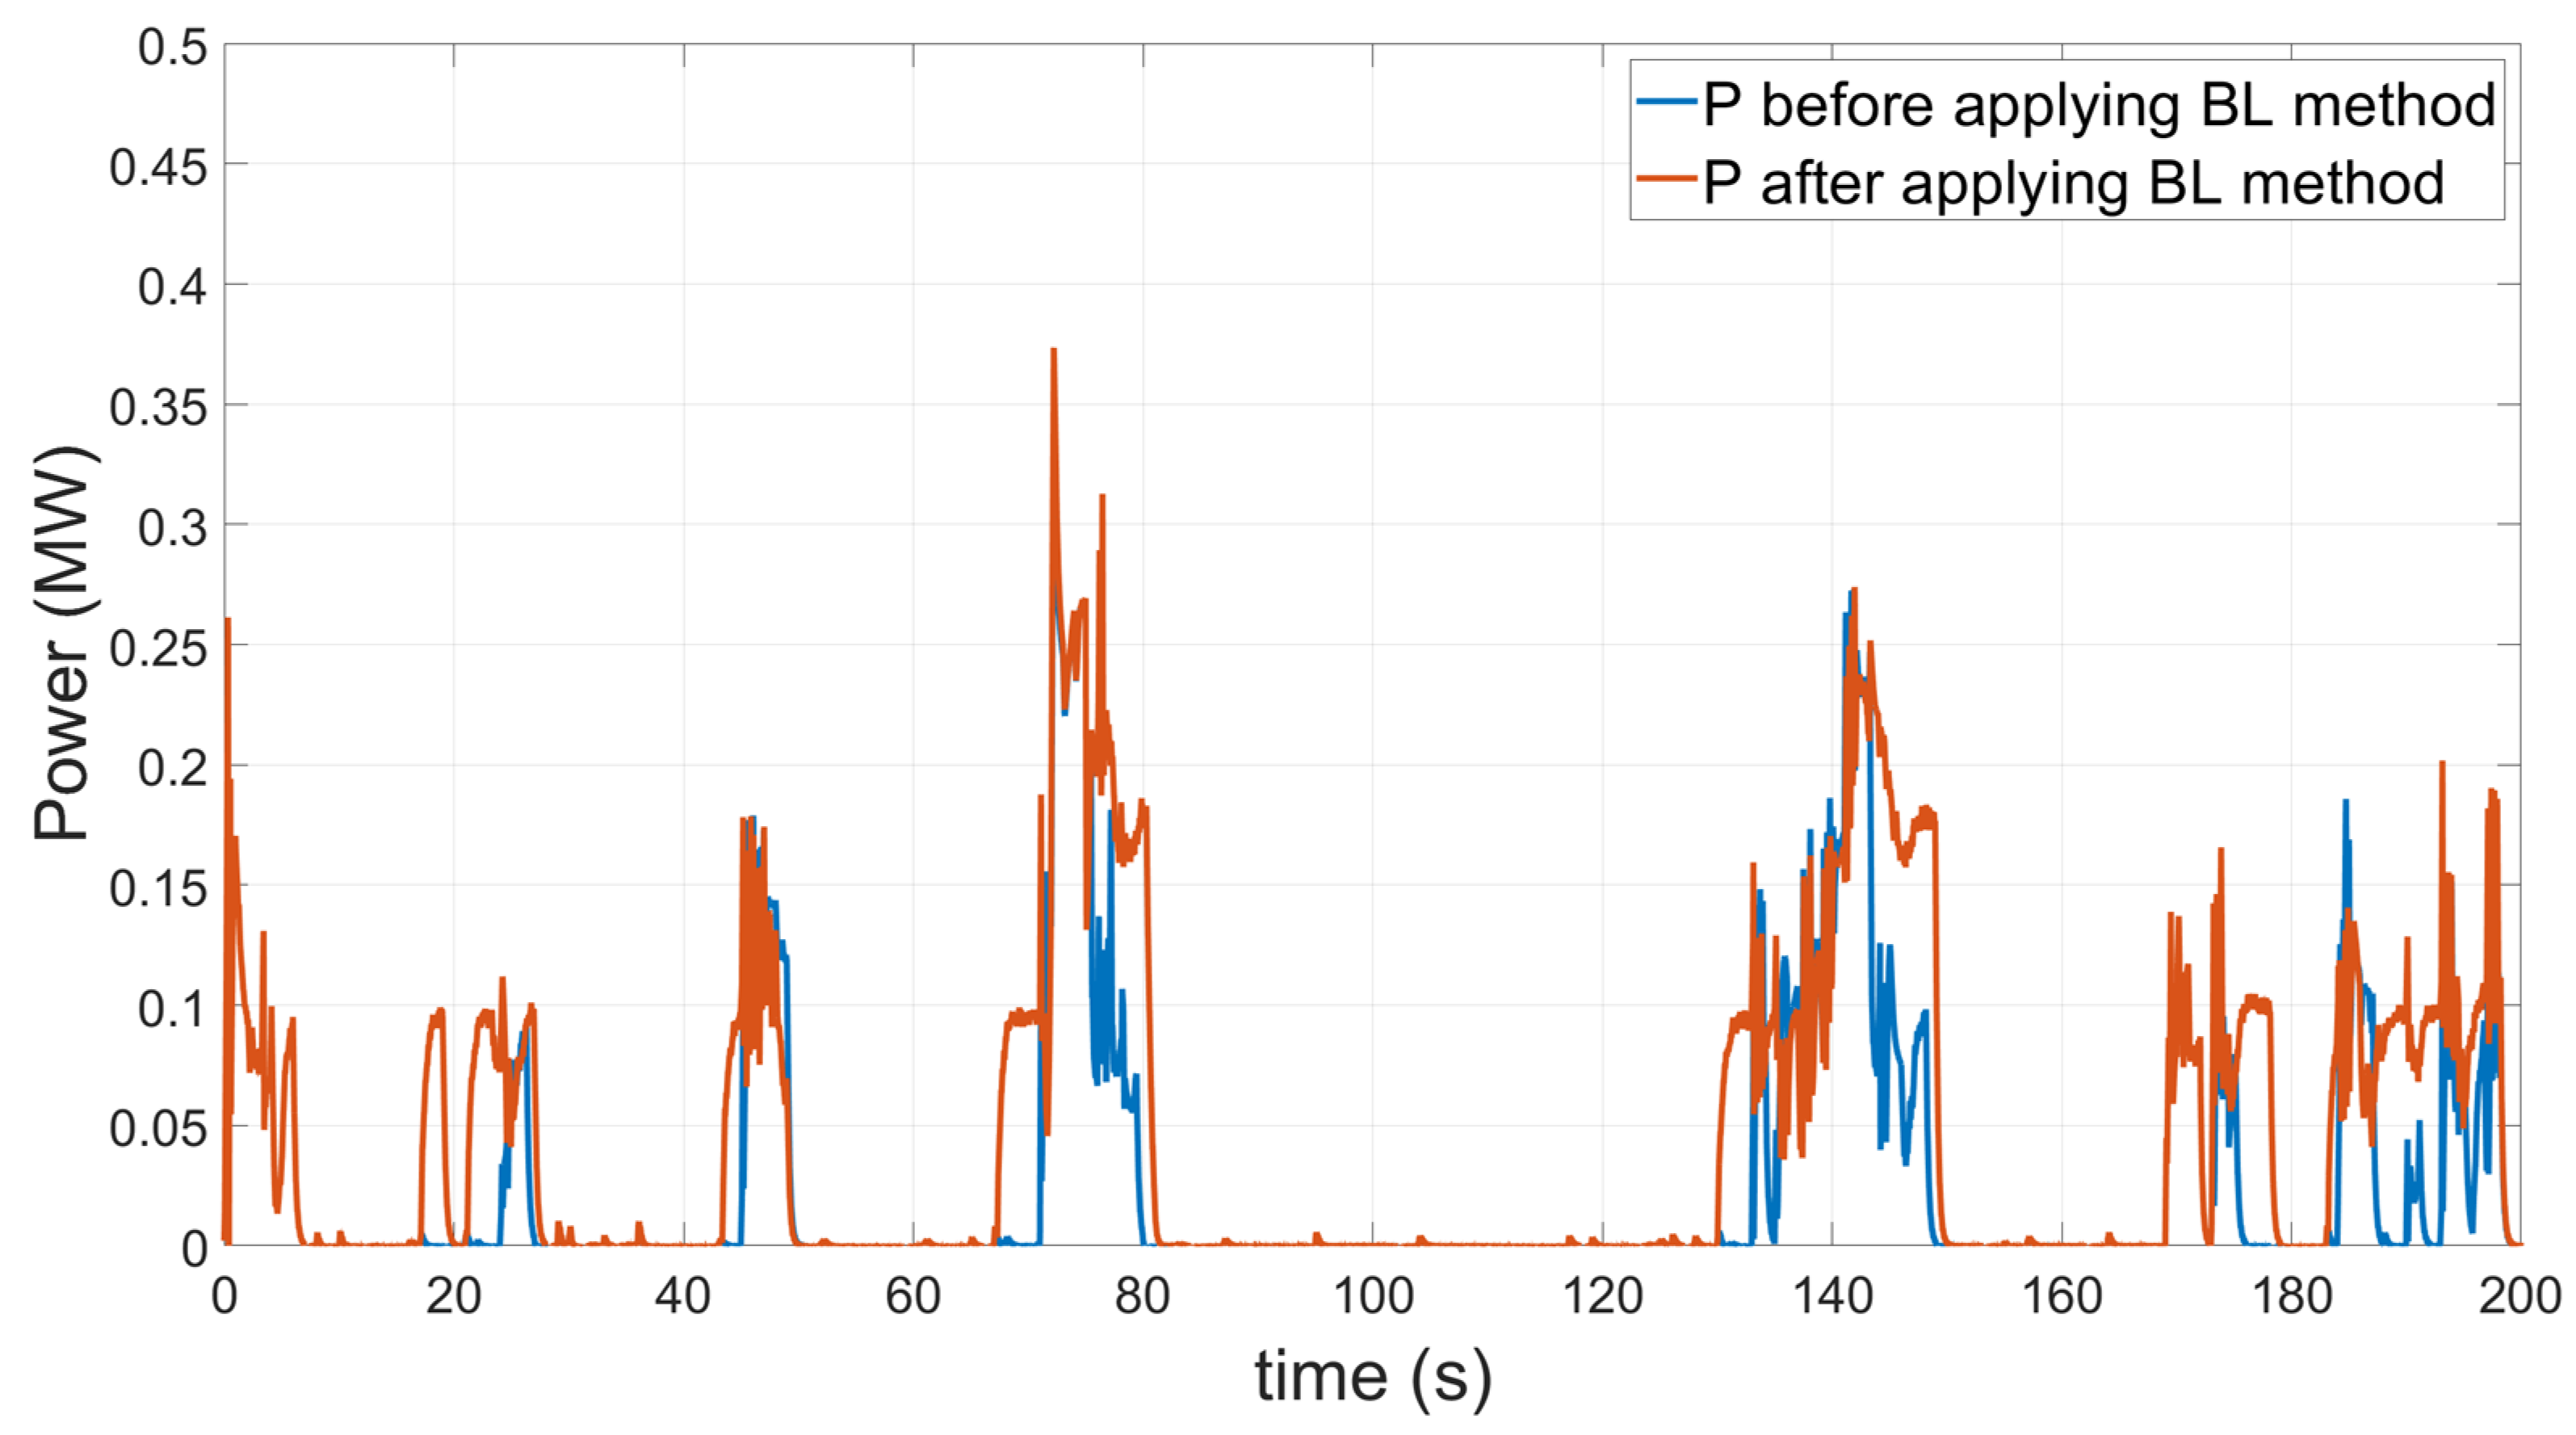
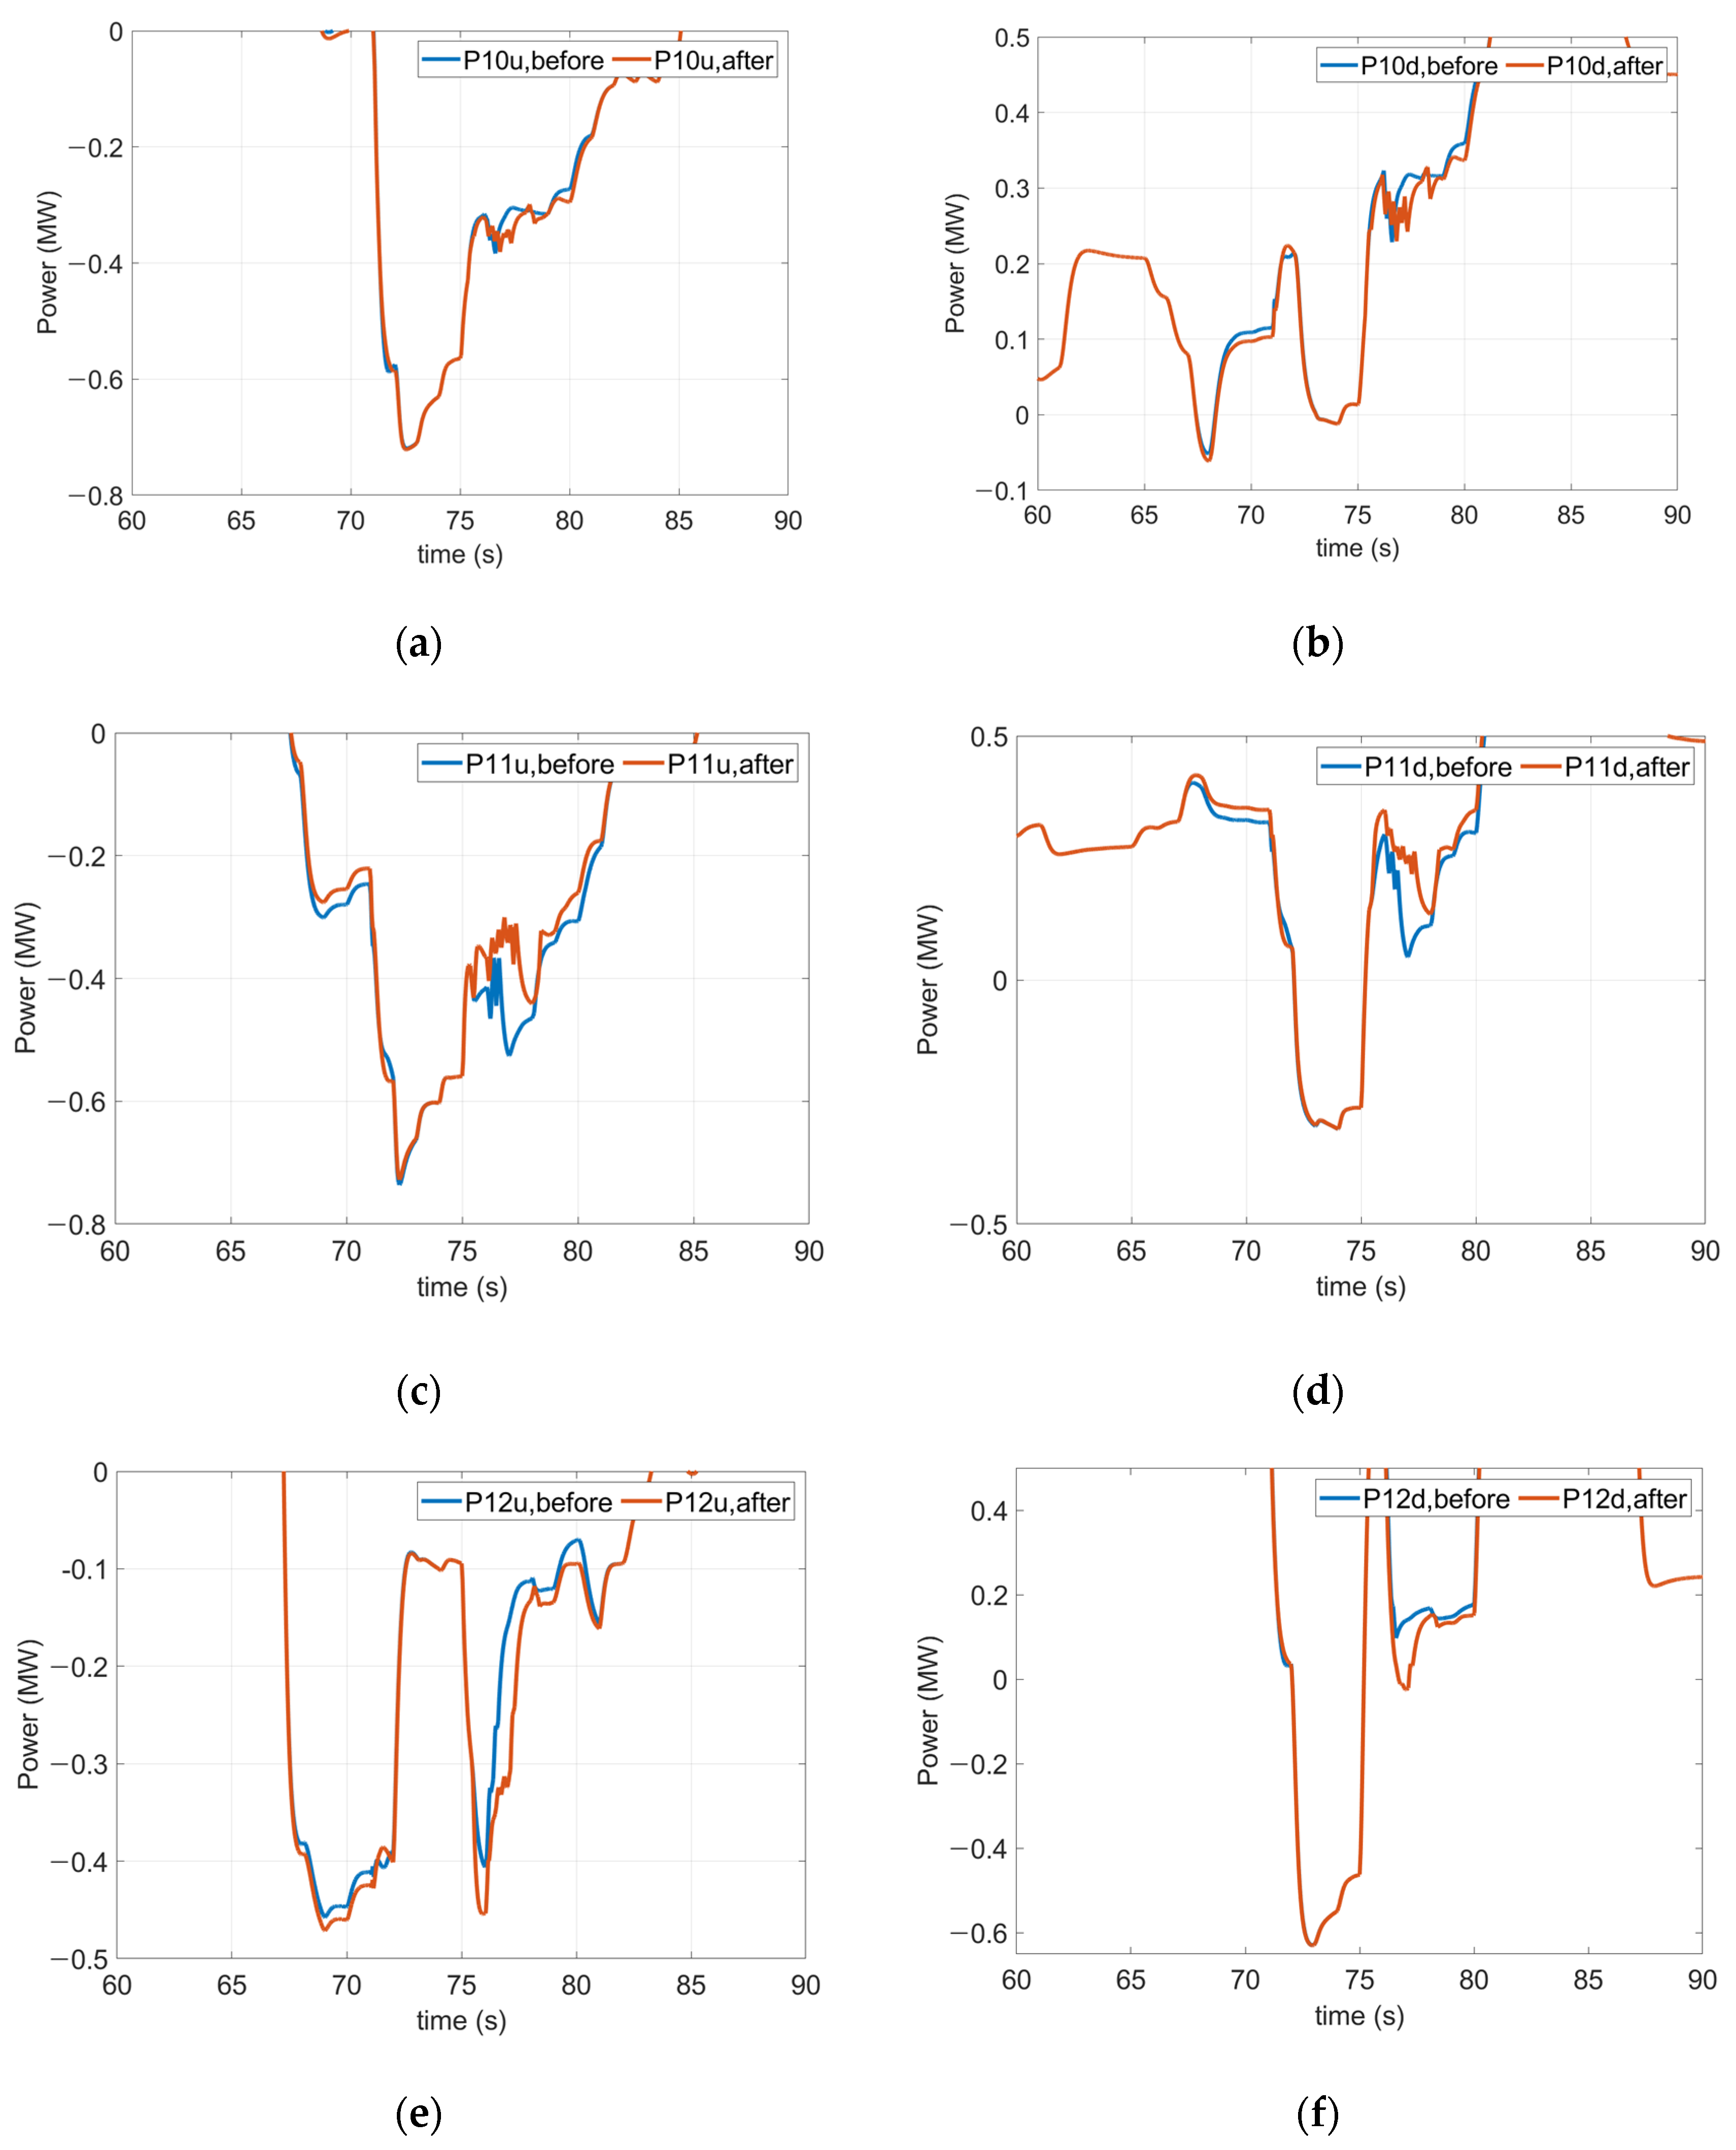
3. Train Braking Time Based Inverter Control and Operation Method

The conventional inverter operation method using V t h can be defined as in Equation (11).
V n o l o a d < V t h < V m a x
where V m a x is system maximum allowable voltage. For the regenerative inverter to operate, it should be determined whether regenerative energy is generated, which is why V t h is set higher than the no-load voltage. If other regenerative energy utilization facilities are already installed in the system where the inverter is installed, it is operated by maximizing energy utilization by setting V t h according to each facility. Therefore, V t h of the regenerative inverter is usually set to a value much higher than the no-load voltage. However, there is a possibility that all of the regenerative braking energy of the train cannot be accommodated. Except for the case where the headway is short, considering the impedance of the track, the method in which the regenerative inverter of the substation directly accommodates is the least loss compared to the accelerating train ahead.
The line loss ( R c a t ) generated on the catenary voltage according to the distance is calculated as shown in Equation (12). Where r 0 is the resistance per unit length, L s is the distance from the braking train to the substation, and L s t is the distance from the substation to the leading accelerating train. Figure 6 shows the resistance between braking train and accelerating train according to headway time using the TPS result.
R c a t = r 0 · ( L s + L s t )
It can be seen that as the headway interval increases, the distance and resistance between trains increase. If the preceding train is stopped at the station, the remaining surplus power except for the auxiliary power supply is more likely to be used for other trains at a longer distance or consumed as heat through the regenerative resistor. Therefore, it is advantageous to utilize regenerative energy as much as possible in an inverter that is relatively close to the distance.
Figure 7a shows the limitations of conventional inverter control methods. When the inverter is operated based on the V t h , energy can be used only in the red area. When operating based on the vehicle braking position, the energy in the blue area can be utilized as shown in Figure 7b, thus increasing the regenerative energy utilization rate.
It is also necessary to analyze the current flow between two substations when a train brakes. Figure 8 shows the current distribution where the train is moving from substation 1 to substation 2. The train load can be modeled as a current source when it brakes, and the current flow calculated by the current distribution law. As a result, it can be seen that the current flows almost equally to both substations at the start of braking, and then most of the current flows to the nearest substation 2 from the point when braking is finished. When the inverter is operated from the position where the train starts to brake, the regenerative current generated from the vehicle can be used with a small loss.
There are points at each station where braking must be started ( x b r k ) independently of the driving method. When the train reaches the corresponding position, catenary voltage ( V c a t ) is checked to operate the inverter when the voltage is higher than V n o l o a d . If V c a t   is lower than V n o l o a d , the inverter does not operate because it is determined that energy is required for the system. When the train arrives at the station, compare V c a t with V t h . If V c a t is greater than V t h , operate the inverter until V c a t is less than inverter stopping voltage ( V s t o p ) . If V c a t is less than V t h , terminate inverter operation. Figure 9 shows the flow chart of the described BP method of inverter operation.

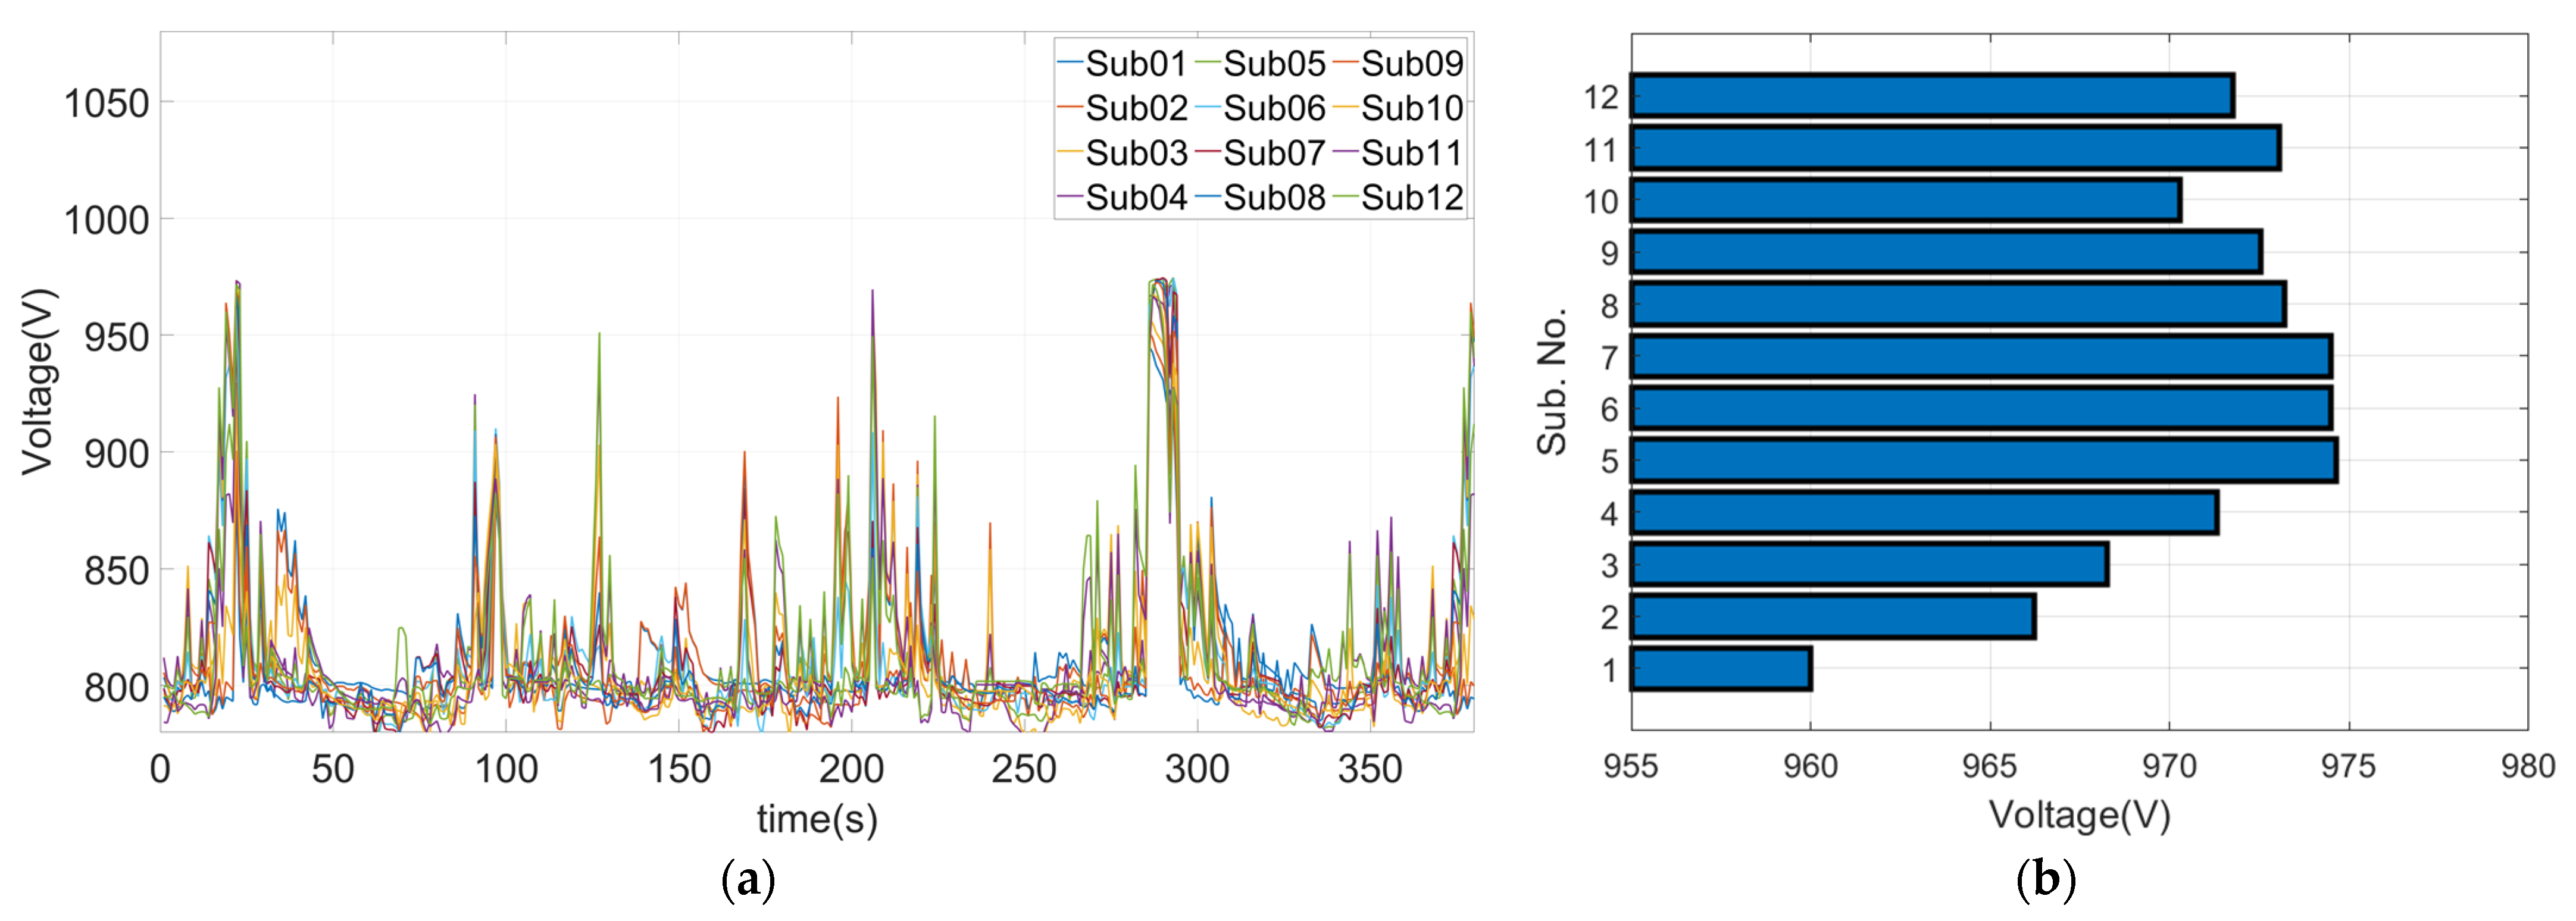
4. Simulation Analysis

The simulation target system was Korea’s Incheon Line 2, with a total of 12 substations and 27 stations. Regenerative energy utilization facilities consist of eight facilities including ESS and ReR. The simulation parameters used in TPS and DCPS are shown in Table 1. The maximum voltage and regenerative energy generated for each substation shown using the parameters were derived as shown in Figure 4 and Figure 5. The highest regenerative energy was generated in substation 11. Therefore, power analysis on substation 11 including the substations on both sides was performed through PSCAD.
Using the results for the TPS, the power required and speed according to the location of the trains were derived as shown in Figure 10. Trains 1 and 2 are running on the up line and 3 and 4 on the down line. Trains 1 and 3 are moving between substations 10 and 11, and trains 2 and 4 are moving between substations 11 and 12. As explained earlier, the change in the amount of power of the train is largely divided into three stages and shows a repeating pattern. In addition, the reason why the power consumption during coasting is not zero is that power is consumed by auxiliary power of the train. Simulation for 200 s was performed using the corresponding load data and the power analysis parameters of Table 2.
Figure 11 shows the change in inverter regenerative energy usage before and after applying the BL method as a result of simulation.
As a result of applying the BL method, approx. 62.6% more regenerative energy was used compared to the conventional method. Since the inverter is operated directly at the braking position, the regenerative energy is used for a longer time, and as a result, a larger amount of energy is used. Therefore, compared to the conventional method, power transfer to the inverter occurred for a longer time back and forth than before. As shown in Table 3, while about 1800 MW of power was used using the conventional method, about 2900 MW of power could be further utilized by applying the BL method. The power changes in the up and down lines of each substation are shown in Figure 12. Checking the amount of power at substation 11 where the inverter is installed, one can confirm that more power moves than when using the existing method at the time of recovery.

5. Conclusions

This paper proposed a method to increase regenerative energy utilization with the BL method to operate an inverter from the position where a train brakes to use unused regenerative energy in a voltage range between the no-load voltage and threshold voltage. As a result, the use of regenerative energy by the inverter increased by about 62.6%. The main content of this paper is summarized as follows.
  • Optimal installation location and capacity calculation method of regenerative inverter using TPS and DCPS.
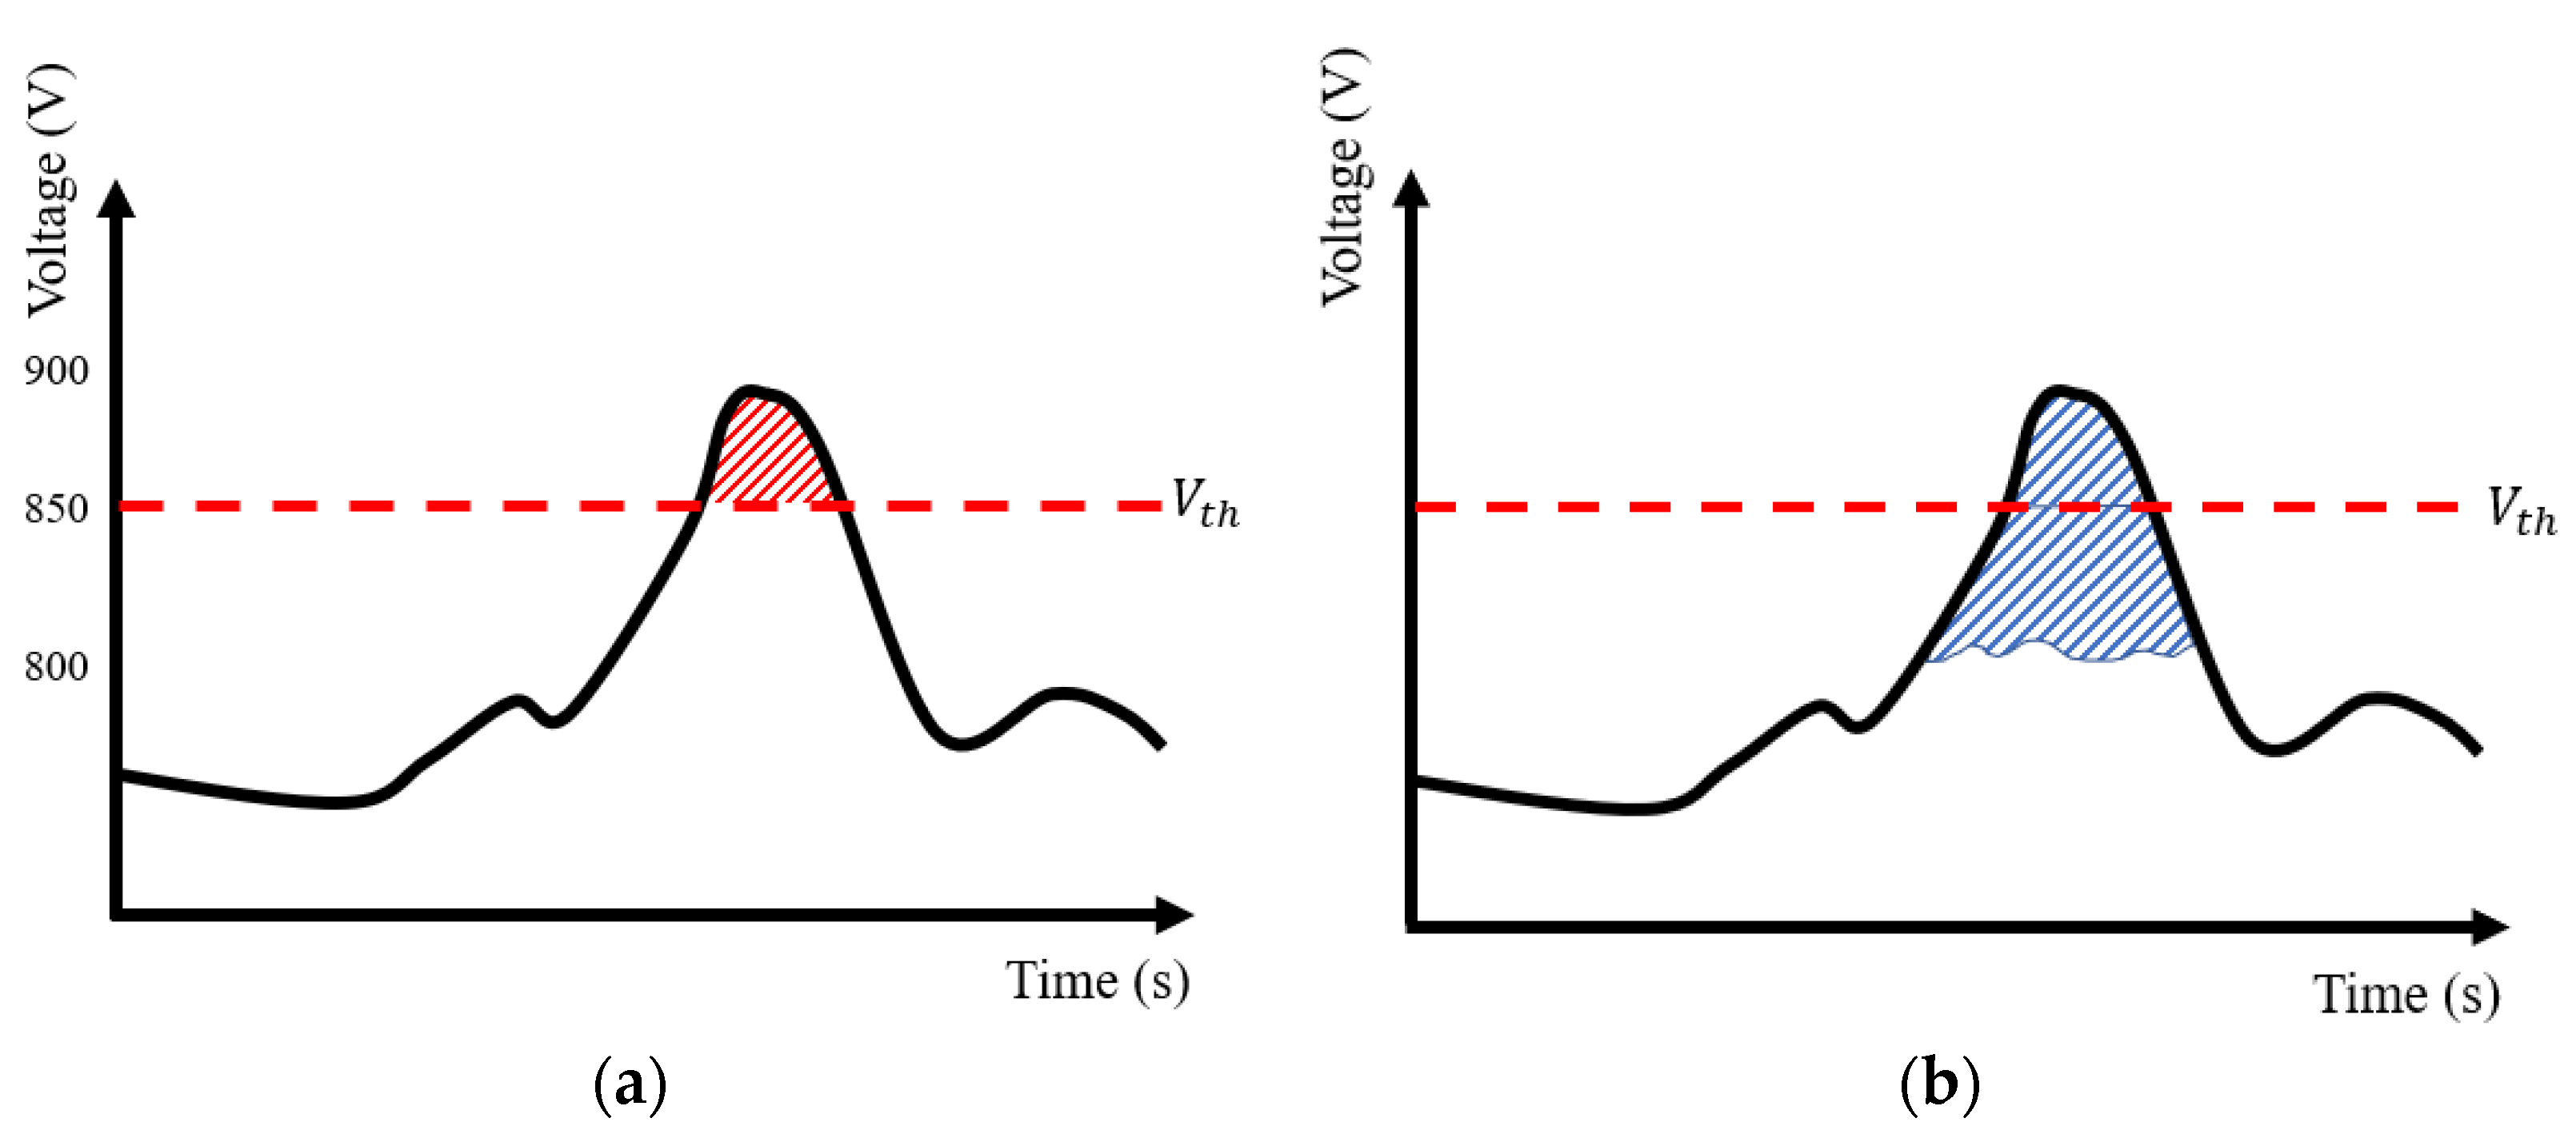
  • Explanation of limitations of conventional inverter control method according to threshold voltage.
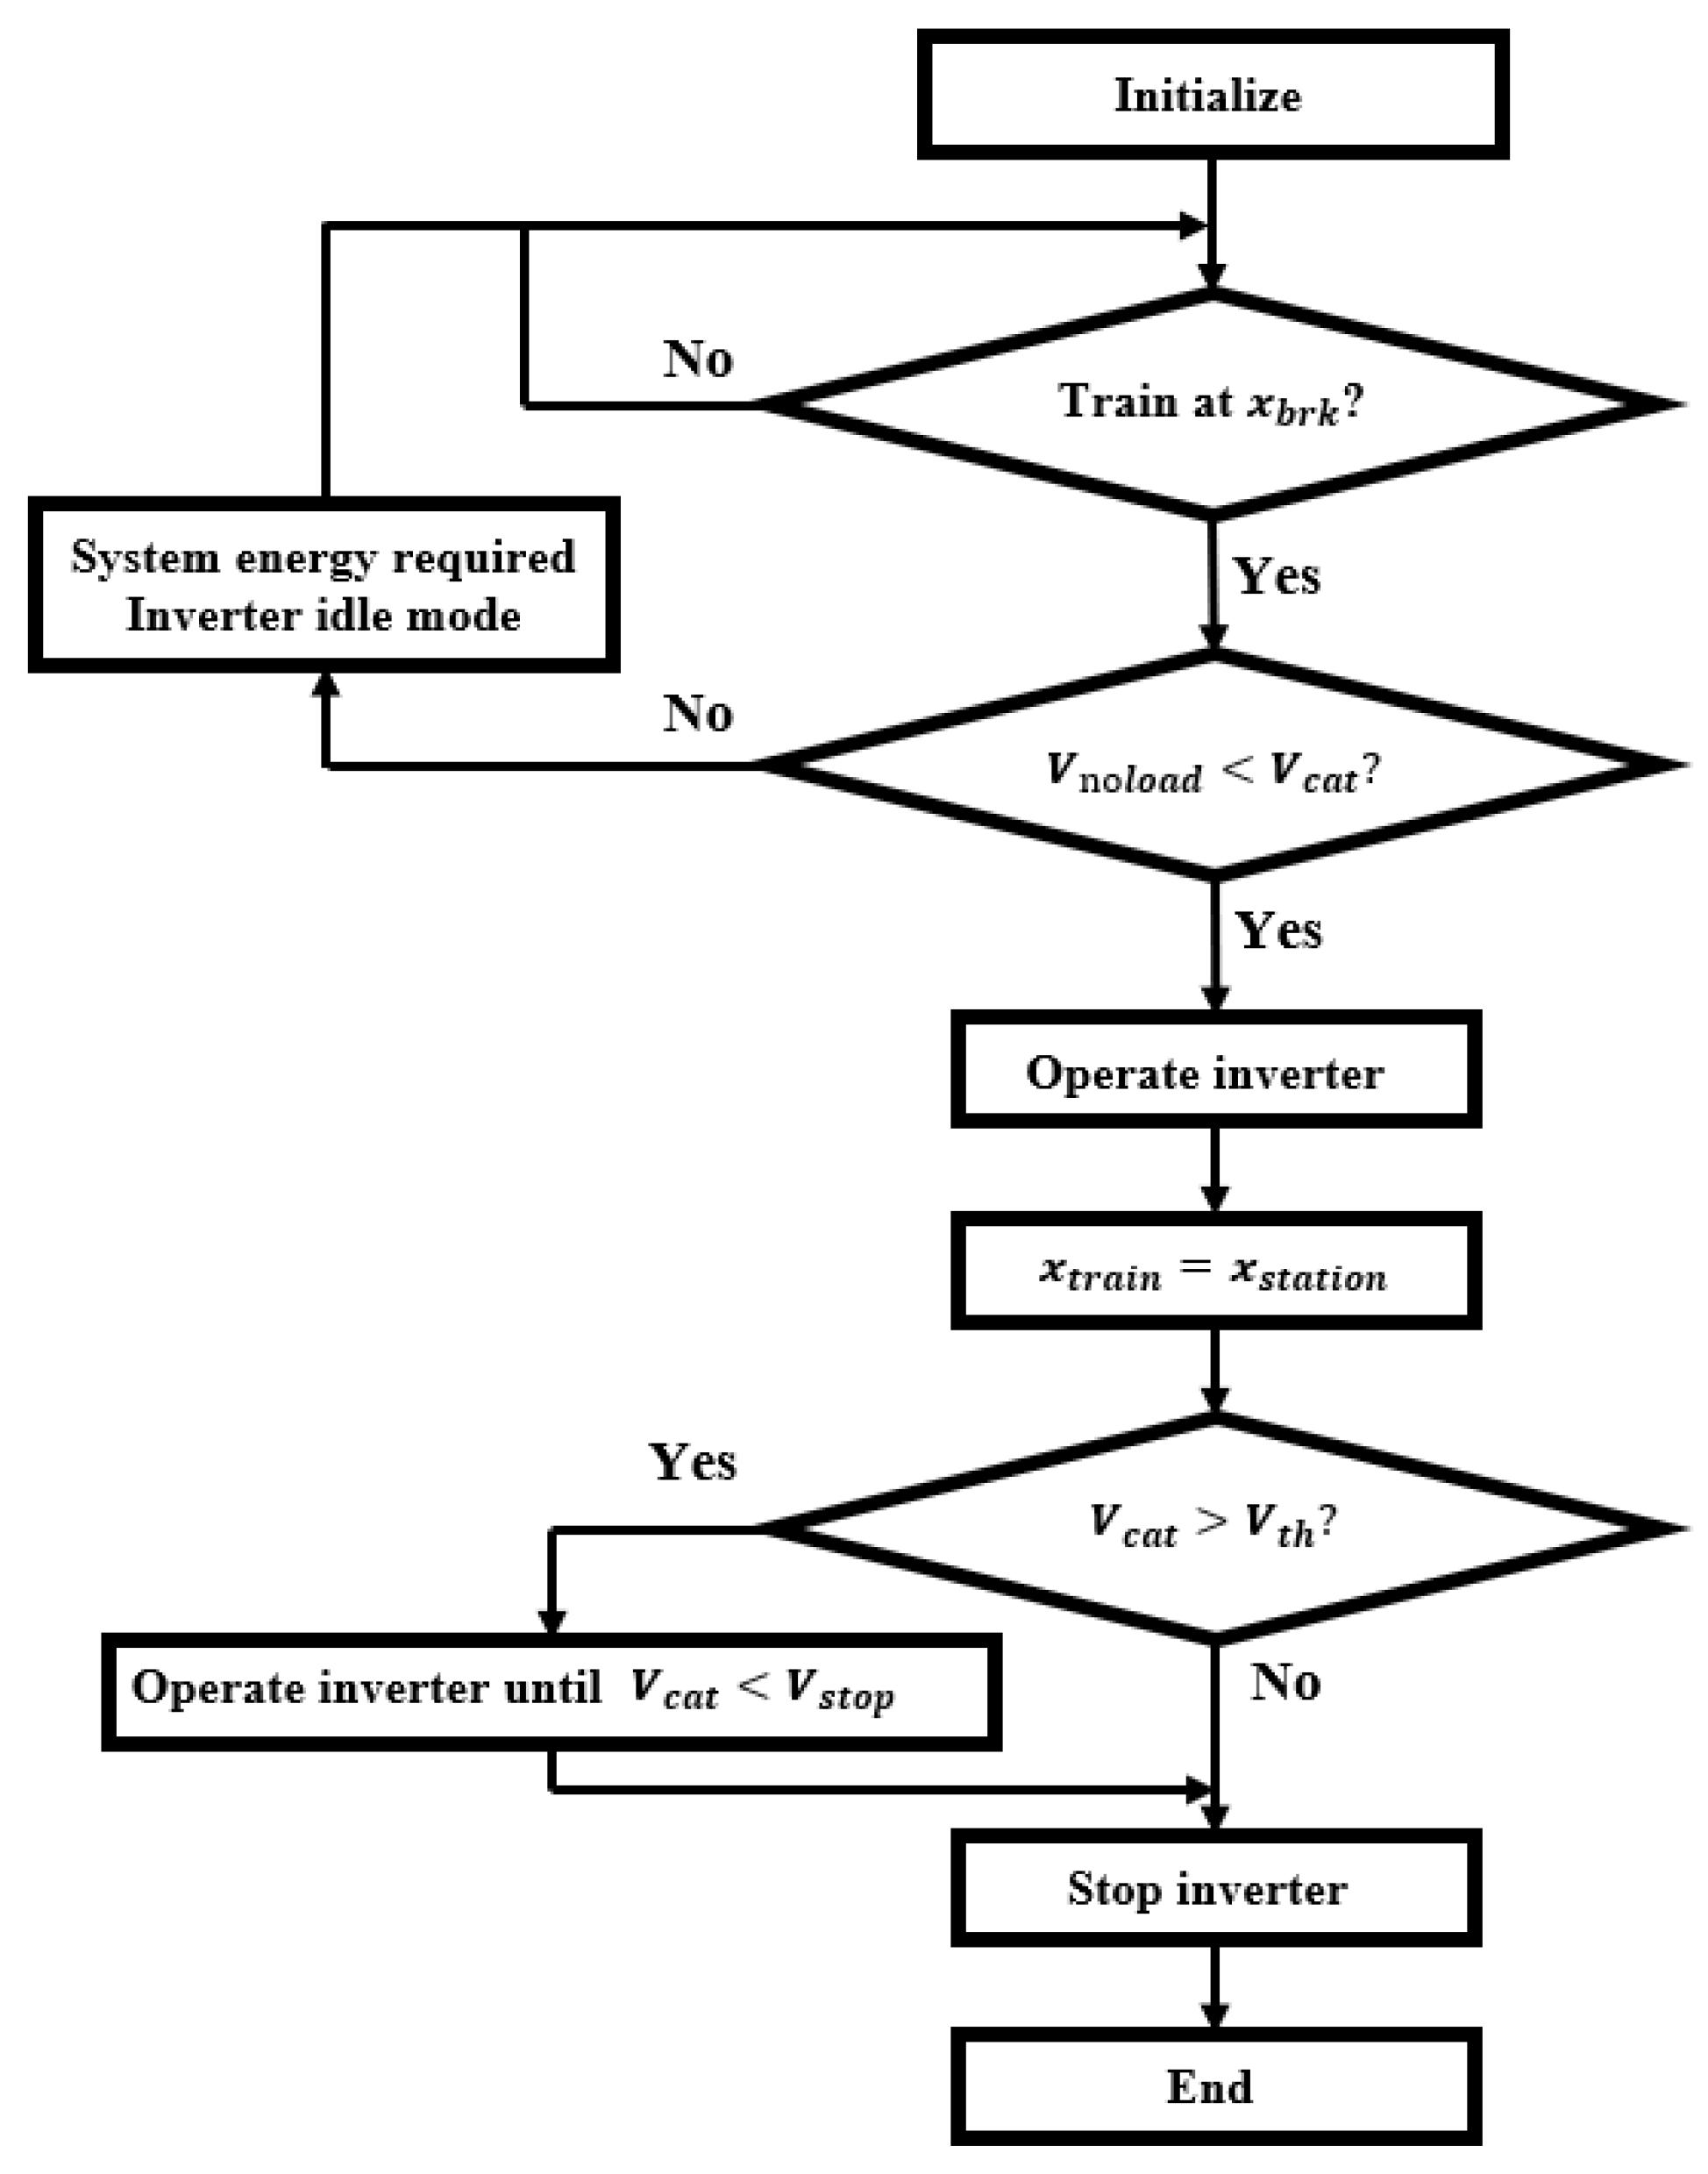
  • Proposal of a plan to increase the utilization rate of regenerative energy using the braking position-based inverter operation method.
Future research will be conducted on how to increase the regenerative energy utilization rate by flexibly changing the inverter’s threshold voltage considering the voltage drop between each substation when multiple inverters are installed.

Author Contributions

Conceptualization, C.-M.Y. and H.J.; methodology, G.-J.C.; software, G.-J.C.; investigation, H.K.; data curation, H.J.; writing—original draft preparation, C.-M.Y.; writing—review and editing, C.-M.Y.; supervision, H.K.; project administration, H.J.; funding acquisition, H.K. All authors have read and agreed to the published version of the manuscript.

Funding

This work is supported by the Korea Agency for Infrastructure Technology Advancement (KAIA) grant funded by the Ministry of Land, Infrastructure and Transport (Grant RS-2022-00142883).

Conflicts of Interest

The authors declare no conflict of interest.

References

  1. Kim, H.J.; Jung, H.; Ko, Y.J.; Chae, E.S.; Kim, H.J.; Hwang, I.S.; Heo, J.H.; Park, J.Y. Cooperative Operation Schedules of Energy Storage System and Demand Response Resources Considering Urban Railway Load Characteristic under a Time-of-Use Tariff. J. Electr. Eng. Technol. 2021, 16, 1273–1284. [Google Scholar] [CrossRef]
  2. Jung, H. An Optimal Charging and Discharging Scheduling Algorithm of Energy Storage System to Save Electricity Pricing Using Reinforcement Learning in Urban Railway System. J. Electr. Eng. Technol. 2022, 17, 727–735. [Google Scholar] [CrossRef]
  3. Lee, H.; Kim, J.; Lee, C.; Kim, J. Correction to: Novel Cooperative Controller Design of Heterogeneous Energy Storages for Economic Applications in Electric Railway Systems. J. Electr. Eng. Technol. 2020, 15, 979–987. [Google Scholar] [CrossRef]
  4. Sparavigna, L. Control Algorithms for the Optimization of Energy Storage Systems Management in Urban Transport Systems. Int. J. Appl. Eng. Res. 2018, 13, 6177–6182. [Google Scholar]
  5. Popescu, M.; Bitoleanu, A. A Review of the Energy Efficiency Improvement in DC Railway Systems. Energies 2019, 12, 1092. [Google Scholar] [CrossRef]
  6. Lin, S.; Huang, D.; Wang, A.; Huang, Y.; Zhao, L.; Luo, R.; Lu, G. Research on the Regeneration Braking Energy Feedback System of Urban Rail Transit. IEEE Trans. Veh. Technol. 2019, 68, 7329–7339. [Google Scholar] [CrossRef]
  7. Li, S.; Wu, S.; Xiang, S.; Zhang, Y.; Guerrero, J.M.; Vasquez, J.C. Research on Synchronverter-Based Regenerative Braking Energy Feedback System of Urban Rail Transit. Energies 2020, 13, 4418. [Google Scholar] [CrossRef]
  8. Meishner, F.; Sauer, D.U. Wayside energy recovery systems in DC urban railway grids. eTransportation 2019, 1, 100001. [Google Scholar] [CrossRef]
  9. Ghaviha, N.; Campillo, J.; Bohlin, M.; Dahlquist, E. Review of application of energy storage devices in railway transportation. Energy Procedia 2017, 105, 4561–4568. [Google Scholar] [CrossRef]
  10. Gee, A.M.; Dunn, R.W. Analysis of trackside flywheel energy storage in light rail systems. IEEE Trans. Veh. Technol. 2015, 64, 3858–3869. [Google Scholar] [CrossRef]
  11. Gonzalez-Gil, A.; Palacin, R.; Batty, P. Sustainable urban rail systems: Strategies and technologies for optimal management of regenerative braking energy. Energy Convers. Manag. 2013, 75, 374–388. [Google Scholar] [CrossRef] [Green Version]
  12. Zhang, G.; Tian, Z.; Tricoli, P.; Hillmansen, S.; Wang, Y.; Liu, Z. Inverter Operating Characteristics Optimization for DC Traction Power Supply Systems. IEEE Trans. Veh. Technol. 2019, 68, 3400–3410. [Google Scholar] [CrossRef]
  13. Włodzimierz, J.; Adam, S. The multi-criteria optimization method for implementation of a regenerative inverter in a 3kV DC traction system. Electr. Power Syst. Res. 2018, 161, 61–73. [Google Scholar]
  14. Mellitt, B.; Mouneimne, Z.S.; Goodman, C.J. Simulation study of DC transit systems with inverting substations. IEE Proc. B Electr. Power Appl. 1984, 131, 38–50. [Google Scholar] [CrossRef]
  15. Pereira, F.H.; Pires, C.L.; Nabeta, S.I. Optimal placement of rectifier substations on DC traction systems. IET Electr. Syst. Transp. 2014, 4, 62–69. [Google Scholar] [CrossRef]
  16. Milroy, I.P. Aspects of Automatic Train Control. Ph.D. Thesis, Loughborough University, Leicestershire, UK, 1980. [Google Scholar]
  17. Howlett, P.G. Optimal driving strategies for a train journey with speed limits. J. Aust. Math. Soc. 1994, 36, 38–49. [Google Scholar]
  18. Su, S.; Li, X.; Tang, T. A subway train timetable optimization approach based on energy-efficient operation strategy. IEEE Trans. Intell. Transp. Syst. 2013, 14, 883–893. [Google Scholar] [CrossRef]
  19. Lu, S.; Weston, P.; Hillmansen, S.; Gooi, H.B.; Roberts, C. Increasing the regenerative braking energy for railway vehicles. IEEE Trans. Intell. Transp. Syst. 2014, 15, 2506–2515. [Google Scholar] [CrossRef]
  20. Yang, X.; Li, X.; Gao, Z.; Wang, H.; Tang, T. A cooperative scheduling model for timetable optimization in subway systems. IEEE Trans. Intell. Transp. Syst. 2013, 14, 438–447. [Google Scholar] [CrossRef]
  21. Cai, Y.; Irving, M.R.; Case, S.H. Iterative techniques for the solution of complex DC-rail-traction systems including regenerative braking. IEEE Proc.-Gener. Transm. Distrib. 1995, 142, 445–452. [Google Scholar] [CrossRef]
  22. Lee, H.S. Development of a Novel Powerflow Algorithm for Energy Storage Optimization in DC Electric Railway Systems. Ph.D. Thesis, Korea University, Seoul, Korea, 2010. [Google Scholar]
  23. Rochard, B.P.; Schmid, F. A review of methods to measure and calculate train resistances. Proc. Inst. Mech. Eng. 2000, 214, 185–199. [Google Scholar] [CrossRef]
  24. Tian, Z.; Weston, P.; Zhao, N.; Hillmansen, S.; Roberts, C.; Chen, L. System energy optimisation strategies for metros with regeneration. Transp. Res. Part C Emerg. Technol. 2017, 75, 120–135. [Google Scholar] [CrossRef]
  25. Chung, S.G.; Lee, S.J. The computer algorithm for DC traction power supply system analysis including regenerative braking vehicles. Trans. Korean Inst. Electr. Eng. 2003, 52, 639–646. [Google Scholar]
  26. Bae, C.H. A simulation study of installation locations and capacity of regenerative absorption inverters in DC1500V electric railways system. Simul. Model. Pract. Theory 2009, 17, 829–838. [Google Scholar] [CrossRef]
Figure 1. Flowchart of TPS and DCPS.
Energies 15 06572 g001
Figure 2. Schematics of simple DC power traction system.
Energies 15 06572 g002
Figure 3. Equivalent circuit diagram of DC power supply system.
Energies 15 06572 g003
Figure 4. (a) Voltage profile of Incheon 2nd line’s parallel power supply system using DCPS. (b) Maximum voltage by each substation of Incheon 2nd line.
Energies 15 06572 g004
Figure 5. Regenerative energy generated by each substation per hour in 2nd Incheon line and its station and substation locations.
Energies 15 06572 g005
Figure 6. Resistance–time diagram of the case study of 2nd Incheon line using TPS with varying headway.
Energies 15 06572 g006
Figure 7. (a) Energy utilization area according to the conventional inverter operation method. (b) Energy utilization area according to BP method.
Energies 15 06572 g007
Figure 8. Simulation results for current distribution during train operation.
Energies 15 06572 g008
Figure 9. Brake location based regenerative inverter operation flowchart.
Energies 15 06572 g009
Figure 10. (a) TPS results for train power consumption between substation 10 and 12. (b) Speed data for Trains 1 to 4 between substation 10 and 12.
Energies 15 06572 g010
Figure 11. Comparison of changes in regenerative energy utilization by inverter before and after BL method application.
Energies 15 06572 g011
Figure 12. Power consumption of substations (a) 10 up (b) 10 down, (c) 11 up (d) 11 down, (e) 12 up (f) 12 down.
Energies 15 06572 g012
Table 1. Simulation parameters for TPS and DCPS.
Simulation ParametersValues
Headway [s]360
Dwell time [s]20
Train mass [ton]75.78
Auxiliary power of train [kW]96
No-load voltage [V]804
Motion resistance [kN]18.2966 + 1.2666 v + 0.09462 v 2
Maximum train speed [km/h]80
Train speed width [km/s]5
Simulation time [s]3600
Table 2. Simulation parameters for power analysis.
Simulation ParametersValues
Inverter threshold voltage [V]850
Inverter stopping voltage [V]820
Power supply side resistance [mΩ]1.841
Rectifier resistance [mΩ]13.5
Catenary resistance per unit length [mΩ]/km6.8
Rail resistance per unit length [mΩ]/km7.65
Simulation time [s]200
Table 3. Comparison of energy used by inverter before and after BL method application for 200 s.
Power Used by Inverter before BL
Application [MW]
Power Used by Inverter after BL
Application [MW]
1808.0382940.129
Publisher’s Note: MDPI stays neutral with regard to jurisdictional claims in published maps and institutional affiliations.

