Article

Modelling and Performance Analysis of Cyclic Hydro-Pneumatic Energy Storage System Considering the Thermodynamic Characteristics

1
School of Mechanical Engineering, University of Science and Technology Beijing, Beijing 100083, China
2
Shunde Graduate School, University of Science and Technology Beijing, Foshan 528399, China
3
Jiangsu Advanced Construction Machinery Innovation Center Ltd., Xuzhou 221004, China
*
Author to whom correspondence should be addressed.
Energies 2022, 15(18), 6672; https://doi.org/10.3390/en15186672
Submission received: 8 August 2022 / Revised: 6 September 2022 / Accepted: 8 September 2022 / Published: 13 September 2022

Abstract

:
The energy storage system of electric-drive heavy mining trucks takes on a critical significance in the characteristics including excellent load capacity, economy, and high efficiency. However, the existing battery-based system does not apply to harsh cold environments, which is the common working condition for the above trucks. A type of cycle hydro-pneumatic energy storage system for the trucks was proposed in this study. The dynamic model of the system, including the dynamic and thermodynamic models of hydraulic and pneumatic parts, was built to analyze the performance of the system. Subsequently, the thermodynamic characteristics were clarified during the energy storage and released through the real test condition-based simulation. The power and energy performances of the system were studied in practice based on the above characteristics. The analysis of the results showed that the system reduced 22.03% driving power at the optimal braking energy recovery rate, the energy density was nearly 12.6 MJ/m3, the maximum input power was higher than 230 kW, and the cycle efficiency was about 40.6%. The results of this study will be conducive to the application of the hydro-pneumatic energy storage system for the electric-drive mining trucks and reducing the resulting carbon emission.

1. Introduction

With the advance of society, the problems of energy crisis and environmental pollution have been progressively highlighted, and the resulting global warming and natural disasters have been increasingly concerning. To solve the above problems the energy mix should be changed, and more clean and renewable energy should be stored and used (e.g., solar, wind, and tidal energy). A considerable amount of industrial equipment (e.g., mobile vehicles and fixed equipment) has also been studied for energy storage and utilization [1]. The electric-drive heavy mining dump trucks (HMDT), typical mobile equipment, have been extensively applied in the mining, water conservancy, and construction industries due to their excellent load capacity, economy, and high efficiency [2] (as presented in Figure 1). During the application of the HMDT, the fuel consumption is a major component of the total cost [3], and it is also the source of carbon oxide emission and environmental pollution. The energy storage and use of the HMDT are of crucial significance to reduce fuel consumption and pollution.
The electric-drive HMDT and different power train systems have been designed to reduce fuel consumption and carbon emissions [4,5]. For the hybrid electric HMDT, internal combustion engine (ICE) and ESS serve as the energy source, and different structures have been developed in accordance with the relationship of ICE, ESS, and other components of powertrain such as series, parallel, and mix structures [5,6]. In addition, the fuel cell system can also be used to replace the ICE, and hybrid structure of fuel cell systems, and battery packages would bring high efficiency and extremely low emission characteristics [7]. Feng et al. [4] built a model of a diesel-electric series hybrid HMDT, including the diesel-generator, ESS, and vehicles dynamic models, to investigate the fuel consumption and economy. Their results suggested that the battery-based ESS can reduce 4.8% of the operational cost. They also investigated the lifecycle cost of a fuel cell hybrid structure for the HMDT, where the ESS stores the excess energy during the low power, idle, or braking conditions, and the energy is used in the high-power conditions. The power and energy should all be satisfied in the working process, such that the ESS takes on a critical significance to the hybrid powertrain system of the HMDT [8].
The ESS can be divided into electric-based and pressure-based according to the vital component of the ESS. For the electric-based ESS, the lithium battery [9] or fuel cell [7] is the energy storage component, and energy can be stored and used with the charging and discharging of battery. After decades of research, the battery technology can basically ensure the energy and power requirements of a hybrid powertrain [4]. However, the conditions of heavy-duty vehicles always exhibit the high power and frequently charge and discharge characteristics [10]. To avoid the lift decay caused by the frequent charge and discharge, the ultra-capacitor has been employed as the auxiliary component of energy storage [11], thus exhibiting the high power and long cycle life characteristics [5,12]. Besides, the performance attenuation of battery in low-temperature environments, which is inevitable for HMDT, also diminishes the advantage of the hybrid HMDT.
For the pressure-based ESS, the gas is compressed directly or indirectly into a closed or open cavity during the energy charging process, and it expands to drive the hydraulic/gas motor in the discharging process. For the open cavity, the gas is compressed with a gas motor, the energy is stored by the pressured gas, and the gas is usually combined with air because of the convenience of air, such as compressed air energy storage (CAES) systems [1,13]. For the closed cavity, pressure fluid is used to compress the gas, such as the hydraulic accumulator. Therefore, the energy density is the obvious advantage for the former system, and the power density of the later system is excellent, which is suitable for the high-power condition in the downhill process of HMDT. However, the energy of this ESS is dependent on the volume of the system [14] and a lot of extra volume is needed to store the pressurized fluid. Thus, the high-power performance is considered the most significant advantage, and the poor energy density performance is also significant. Numerous studies have been conducted to increase the energy density. Li [15] proposed an open accumulator structure to increase the energy density, in which the pressure gas is compressed and expanded from and to atmosphere, and the energy density can be improved by 20 times [16]. For ESS systems, the power is dependent on the pressure of the system, then some research focused on the system pressure to improve the performance of CAES. Kim et al. [17] proposed a constant-pressure CAESS combined with a pumped hydro storage. This approach not only overcomes the limitation of a water pressure compensation method to the geographical conditions, but also avoids the energy consumption of the hydraulic pump. Since the compression and expansion of the gas play a certain role in the process of energy storage and release, the thermodynamic states of the gas and system components change significantly, thus directly affecting the work done in the expansion [1]. The gas property and thermal insulation of hydro-pneumatic accumulators have also been studied to enhance the energy and efficiency of performance [18,19]. In accordance with reference [20], the CAES are classified into three different types: diabatic, adiabatic [21], and isothermal. For the diabatic ESS, the air is cooled down in the compressing process and heated during the expansion, while no thermal storage device is involved. Moreover, this type CAES has also been the only scheme applied to industry. The energy density and power range of diabatic CAES can be 2~15 kW h/m3, and 5 MW~1 GW, respectively, and the cycle efficiency can reach 54%. For the adiabatic ESS, the thermal heat is stored during the compression, and it is reused during the expansion such that the thermal energy storage device is used in the system. Furthermore, the corresponding energy density and power range reach 0.5~20 kWh/m3, 1 MW~1 GW, respectively. The thermal heat would bring high temperature and pressure of CAES, which is bad for the control of the system. Then the low-temperature of this system is presented to solve this problem [reference-low temperature], and the maximum roundtrip efficiency can be 60%. Unlike the other two schemes, the isothermal ESS is used in some devices and methods to keep the temperature constant during the charging and discharging processes. Furthermore, the corresponding energy density and power range are 1~25 kWh/m3, 5 kW~1 GW, respectively. Besides, the cycle efficiency is nearly 38%.
The data of different schemes suggest that the above CAES are used in the large-scale fixed energy storage equipment, the energy capacity and power range are very large, and the cycle time is also very long [22,23]. While the typical working cycle of the HMDT is approximately 1 h, the charging and discharging of energy are all involved. The time of thermodynamic change is significantly short compared with the above large energy scale ESS. With the change in device dimension, the thermal characteristics will be different, and the above structure cannot be applied in the HMDT directly. We had proceeded some research of the energy density and power performance of different structures of CAES [13,24]. Besides, the application, economy and feasibility of the above structure in HMDT are also presented [5]. However, the ideal isothermal process is assumed, and the loss of key components, thermodynamic characteristics, and efficiency of pump/motor are neglected. According to the above research, the thermodynamic characteristics of the system are critical during the discharging and charging processes, thus determining the energy, power and cycle efficiency performance directly. In this study, the focus was placed on the performance of cycle hydro-pneumatic ESS considering the thermodynamic and dynamic characteristics of the components in the ESS, and the effects of thermal parameters on energy, power, and efficiency performance were revealed based on the real test conditions. The main contributions of this paper are given as follows:
(1)
A cycle hydro-pneumatic ESS, with the high power and energy density of hydraulic and pneumatic ESS, respectively, is proposed to recover the braking energy of HMDT;
(2)
The dynamic model of the system, including dynamic and thermodynamic model of hydraulic and pneumatic components, is established to analyze the performance;
(3)
The power and energy performance of system are presented based on a real test condition-based simulation, and the resulting additional benefits are discussed according to the analysis results.
The rest of this study is organized as follows. In Section 2, the dynamic model of the cycle hydro-pneumatic ESS is built, including the thermodynamic and dynamic models of hydraulic and pneumatic components. In Section 3, the actual condition-based simulation is conducted, and the compared results for power, energy, and cycle efficiency are analyzed and presented. Section 4 draws the conclusions.

2. Materials and Methods

For the hydro-pneumatic ESS, the hydraulic fluid was adopted to drive the device to compress the gas and the energy was stored in the gas. The changing volume of the gas indicated the amount of energy. The changing volume of the gas was always the volume of the hydraulic fluid pumped into the system. For the cycle hydro-pneumatic ESS, the gas was divided into some volumes with piston accumulators, and some hydraulic and pneumatic valves were employed to control the compression process; less hydraulic fluid was used throughout the operation. The typical structure of the cycle of hydro-pneumatic ESS is illustrated in Figure 2. In the charging process, the pump/motor (P/M) was employed as a hydraulic pump, and the hydraulic fluid was pumped from tank (T) to piston accumulator 1 (C1) through valves V8 and V5. The gas was compressed through V1. When the piston of C1 reached the limited position, the V1 switched off the connection between C1 and high-pressure gas tank (H-AT); V5 switched the connection of C1 to the suck port of P/M, and V8 turned off the connection. Subsequently, the hydraulic fluid was pumped from C1 into C2 through V5 and V6 till the piston of C2 reached the limited position. When the piston of C3 reached the upper limited position, all pneumatics turned off and the charging process was achieved. Moreover, low pressure gas tank (L-AT) was used to cover the resistance force of the piston in the charging process. In the discharging process, the P/M was employed as a motor, and the hydraulic fluid was pressed by the pressurized gas to drive the motor. The whole process was contrary to the charging process. The temperature of the gas and hydraulic oil increased or decreased significantly at different stages owing to the compressibility of the gas, heat exchange between cylinder and ambient, as well as the power loss of components and pipelines.
In accordance with the above description, the cycle hydro-pneumatic ESS comprised a hydraulic system and a pneumatic system. Moreover, the thermodynamics of hydraulic and pneumatic components should be considered. The dynamic models of the above systems are presented in the following sections, respectively.

2.1. Hydraulic System Modelling

The hydraulic P/M is the key part throughout the process, and the flow, torque, and power of P/M are expressed as follows:
{ q P = V ω η V , T P = ( V Δ P 1 ) / η m P u m p q M = ( V ω ) / η V , T P = V Δ P 1 η m M o t o r
{ P p = Δ p 1 ω V 600 η M P u m p P m = Δ p 1 ω V η M 600 M o t o r
where qP, TP, Pp, qM, TM, and PM are the flow, torque, and power in pump and motor model, respectively. V and ω are the displacement and speed of revolution, respectively. The pressure difference between input and output port of P/M is ΔP1, and ηV, ηm are the volumetric and mechanical efficiency, respectively.
The piston accumulator is used to compress gas, and the work principle is similar to the hydraulic cylinder. According to Newton’s second law, the dynamic model of the piston in C1~C3 can be expressed as:
m i x ¨ i = p h _ i A 1 p g _ i A 2 c v x ˙ i
where index i = C1, C2, and C3 corresponding to the three piston accumulators; mi is the mass of the piston; xi is the displacement of the piston; ph_i, pg_i, A1, A2 are the pressure and action area of the hydraulic and gas sides of the piston, respectively; and cv is the viscous friction coefficient. For the hydraulic side of the accumulator, the input flow and pressure can be obtained with:
{ q h _ i = A 1 x ˙ i A 1 x i d p h _ i K d t d p h _ i d t = K q h _ i A 1 x h _ i
where qh_i is the input flow, K is the bulk modulus of the hydraulic fluid. According to the structure of hydraulic components in Figure 2, the input flow is controlled by valves, which could be expressed as:
q h _ i = C d A ( x I ) 2 Δ p h _ i ρ h
where Cd is the coefficient of flow, xI is the control current of the valve, Δph_i is the pressure difference between the input and output of valve, and ρh is the density of the hydraulic fluid.

2.2. Pneumatic System Modelling

The input/output mass flow is controlled by the pneumatic valve V1~V3. According to the orifice flow formula, the mass flow can be given by:
q m - i = C q A p C m p g _ i T g _ i
where Cq denotes the flow coefficient; Ap represents the cross area is control valve; Cm is the flow parameter, and the value is determined by the pressure states of the flow, i.e., subsonic or sonic state.
For the piston accumulator, the total volume contains hydraulic and pneumatic parts, and volume variation in the two parts is contrary. The volume of pneumatic parts can be expressed as:
v ˙ i = q h _ i  
And the pressure of the pneumatic can be given by:
p ˙ g i = q m _ i ρ 0 v i + p g _ i q h _ i v i  
where ρ0 is the density of the pneumatic part.

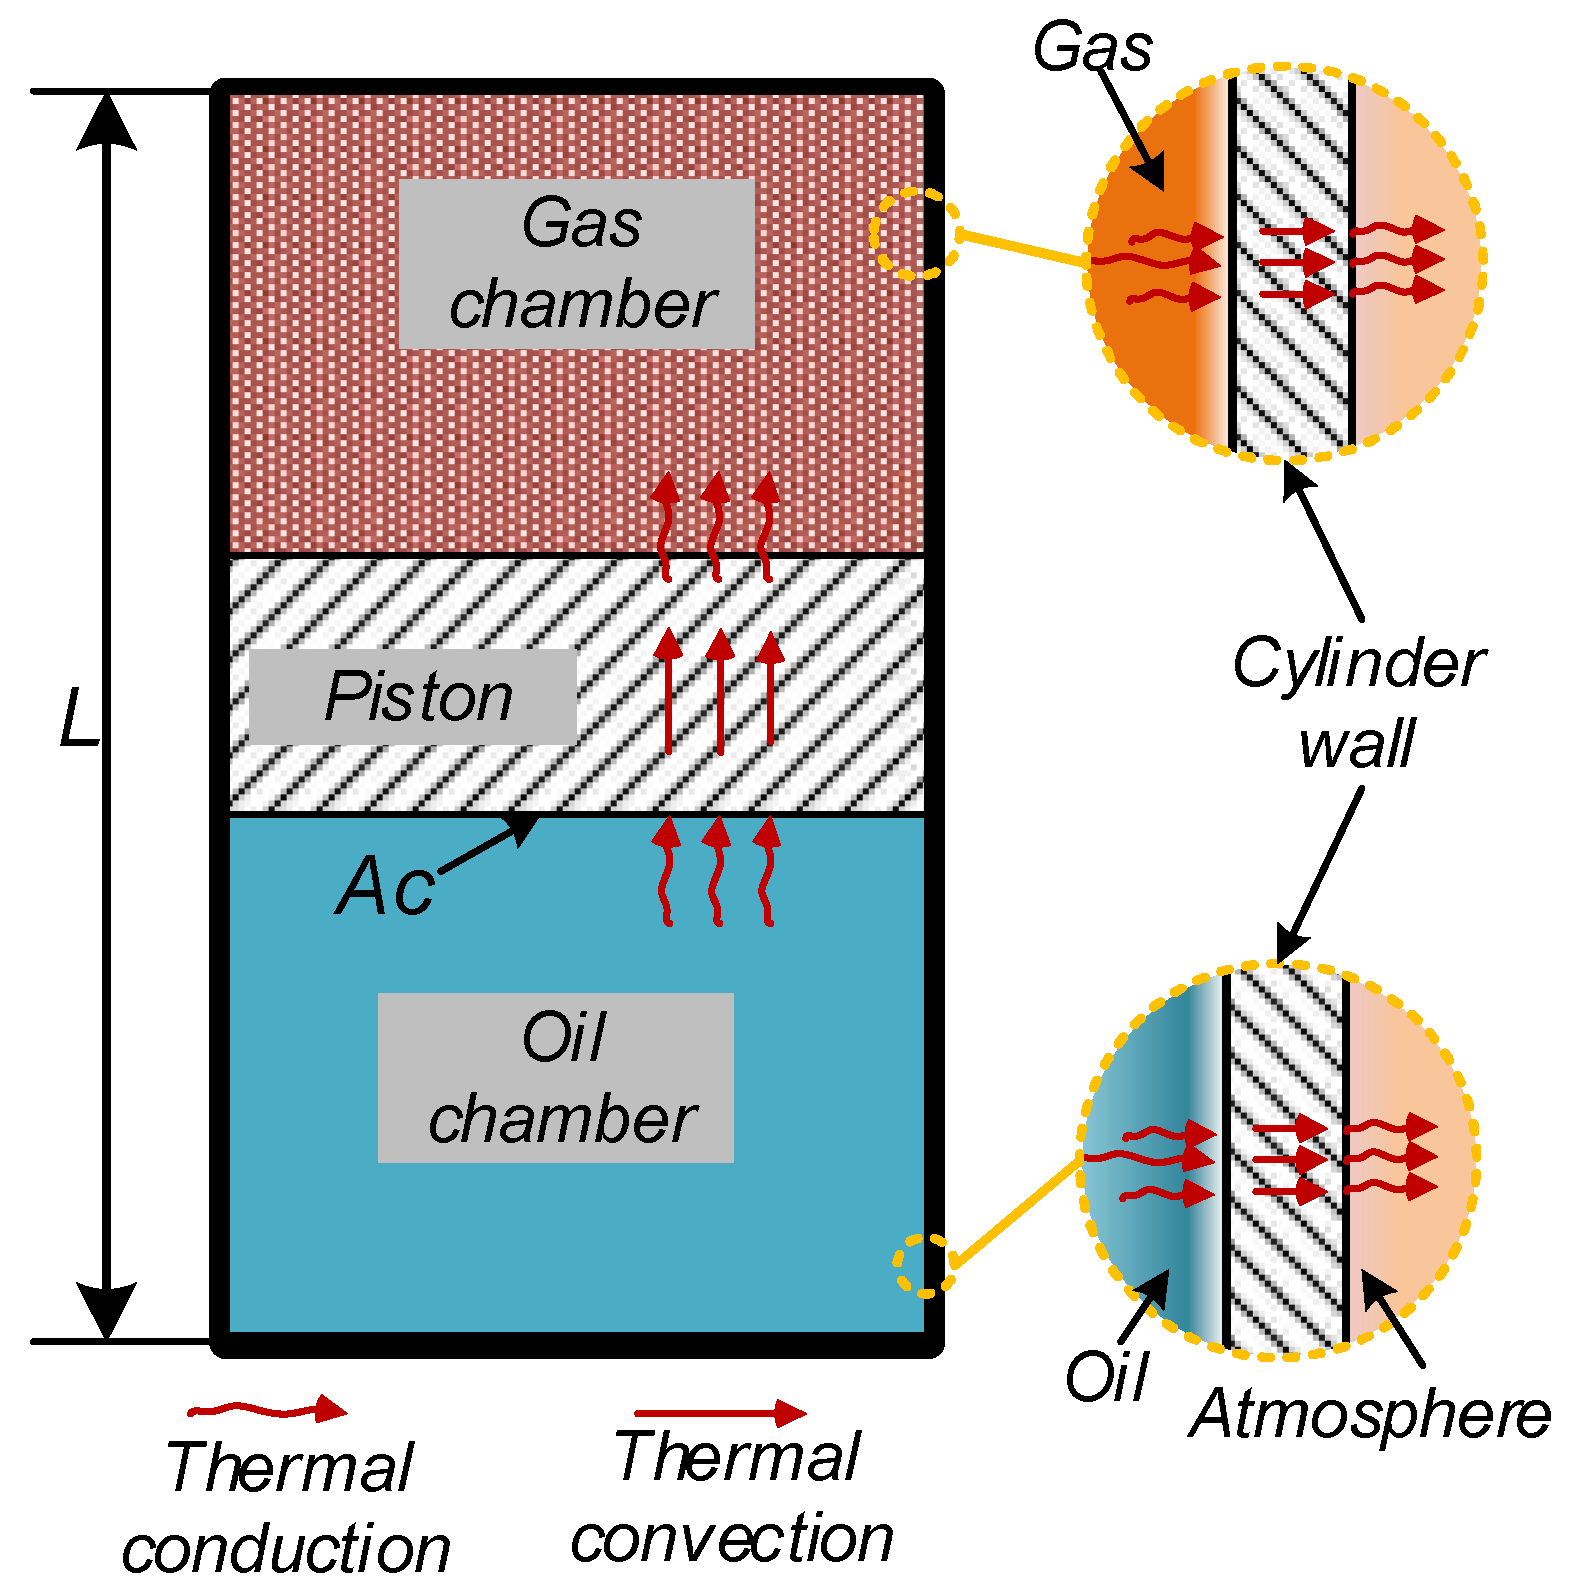
2.3. Thermodynamic Modelling

During the charging and discharging processes, the changes in volume of the gas medium would cause changes in temperature and pressure such as in the charging process of C1, where the temperature and pressure of the C1 gas chamber would increase, and the gas would flow out of C1 and into the other gas chamber, i.e., C2, C3, and H_AT. The temperature and pressure of the other gas chamber also increase. In the charging process of C2, the gas would flow into C3 and H-AT, and all the temperature and pressure states would increase; C3 would bring similar effects. In the discharging process of C3, the pressurized gas in H-AT would flow into the gas chamber of C3, the temperature and pressure states would decrease, and the pressurized gas in H-AT and C3 would flow into the gas chamber of C2 in the discharging process. Heat exchanges between the gas, wall of the accumulator, wall of the gas tank, and ambient gas. The same process also occurs in hydraulic fluid, where the heat also comes from the power loss of P/M and pipelines.
Accordingly, we focused on the thermodynamic models of the piston accumulator C1~C3, gas tank (H-AT), gas medium, and hydraulic fluid medium. The above involved models would be given separately.
For the accumulator, as presented in Figure 3, the thermal convection occurs at the contact face of the medium and inner wall, ambient and outer wall. The thermal conduction occurs between the inner and outer wall. The thermal convection resistance would be different for the gas medium and hydraulic fluid medium, which is decided by the displacement of the piston. In addition, the structure of the accumulator is with the capacity characteristics and can absorb heat.
During the charging and discharging processes, the gas flows into or out of the gas chamber of different piston accumulators and high-pressure gas tanks at different stages. For the separated chambers, it can be seen as the open system; the variation in internal energy includes the enthalpy flow, heat flow between different areas, and the work of pressure gas. According the first law of thermodynamics, the variation in internal energy can be expressed as:
U ˙ g _ i = m ˙ g _ i h g _ i + q ˙ g _ i + W ˙ g _ i
where mg_i is the into and out gas mass, hg_i is the enthalpy of the gas, qg_i and Wg_i indicate the heat flow between the gas and wall of cylinder, work brought by the pressure gas. They can be given by [18]:
q ˙ T _ i = ( T c _ i T g _ i ) R g _ w
W ˙ i = p g i d V g i d t
where Tc_i, Tg_i are the temperature of cylinder wall and gas; Vg_i is the corresponding volume of the gas chamber; Rg_w is the thermal resistance between gas and cylinder wall. The piston of the cylinder moves between the limited displacement, and the contact length of the gas and cylinder wall changes as a result. Thus, the thermal resistance is related to the displacement of the piston, and it can be expressed as:
{ 1 R g _ w = 1 R g _ w e + 1 R g _ w c R g _ w e = 1 2 π r h g ( L i s i ) + ln ( r m / r ) 2 π K c ( L i s i ) R g _ w c = 1 2 π r 2 h g + r m r 2 π K c r 2
where r, rm denote the inner and mean radius of cylinder wall, respectively; hg represents the coefficient of convective heat transfer; Li and si are limit and displacement of the piston; Kc expresses the thermal conductivity of cylinder wall.
Considering the variation in the gas mass, the internal energy is expressed as follows:
U g _ i = u g _ i m g _ i
Next, the variation in internal energy is expressed as follows:
U ˙ g _ i = u ˙ g _ i m g _ i + u g _ i m ˙ g _ i
The internal energy per unit mass is defined as follows:
d u g _ i = c v d T g _ i + [ T g _ i ( p g _ i T g _ i ) v p g _ i ] d v g _ i
The pressure of the gas chamber is the gas pressure, and it can be obtained using the BWR equation [25]:
p g _ i = R T g _ i v + ( B 0 R T g _ i A 0 C 0 T g _ i 2 ) / v 2 + ( b R T g _ i a ) / v 3 + a α / v 6 + ( c ( 1 + γ / v 2 ) e γ / v 2 ) / v 3 T g _ i
where A0, B0, C0, a, b, c, and γ are the characteristic parameters.
Subsequently, the key item in Equation (14) can be obtained by differentiating Equation (15):
p g _ i T g _ i = R v ( 1 + b v 2 ) + 1 v 2 ( B 0 R + 2 C 0 T g _ i 3 ) 2 c v 3 T g _ i 3 ( 1 + γ v 2 ) e γ v 2
In accordance with Equations (6)–(16), the states of different gas chambers in different charging and discharging processes can be obtained. The index i is replaced for different chambers.
The hydraulic fluid can be considered incompressibility and integrally; the thermodynamics model is expressed as follows:
Δ U h = Q h
where QHh denotes the total heat transfer of the hydraulic fluid; Uh represents the inner energy of the hydraulic fluid. Moreover, the inner energy of the hydraulic fluid at time t is expressed as follows:
U h = ρ h c h V h T h ( 0 ) Q h d t
where ch denotes the heat capacity of the hydraulic fluid; Vh is the total volume of the hydraulic fluid. Next, the temperature of the hydraulic fluid is obtained as follows:
T h = U h ρ h c h V h
The total heat transfer of the hydraulic fluid comprises the heat transfer between hydraulic oil and cylinder wall, as well as the power loss of pump and pipelines. Although the hydraulic pipe and other components also transfer heat with the ambient environment, it accounts for a small part. The focus of this study was placed on the heat flow between the cylinder and ambient environment, which is expressed as follows:
q ˙ h _ i = ( T c _ i T h _ i ) R h _ w
where the thermal resistance is related to the displacement of the piston, which is expressed as follows:
{ 1 R h _ w = 1 R h _ w e + 1 R h _ w c R h _ w e = 1 2 π r h h s i + ln ( r m / r ) 2 π K c s i R h _ w c = 1 2 π r 2 h h + r m r 2 π K c r 2
where hh denotes the coefficient of convective heat transfer between cylinder wall and hydraulic oil; K is the thermal conductivity of cylinder wall.
Moreover, the thermal resistance between cylinder wall and the ambient is expressed as follows:
{ 1 R w _ a = 1 R w _ a e + 1 R w _ a c R w _ a e = 1 2 π r o h a _ i s i + ln ( r o / r m ) 2 π K c s i R w _ a c = 1 2 π r o 2 h a _ i + r o r m 2 π K c r o 2
where ha is the coefficient of convective heat transfer between cylinder wall and ambient environment, ro is the out radius of cylinder wall.
For the loss of pump, it can be expressed as:
W P / M l = 1 η V η M η V η M p 1 q P / M
Similarly, the loss of pipeline can be given by:
W c l = Δ p c q p / M
where Δpc is the pressure difference between the in and out port of pipeline, which can be given by:
Δ p h = λ h L p d c ρ ( q 1 / A c ) 2 2 + 2 κ h ρ ( q 1 / A c ) 2
where λ and κ is the resistance coefficient and local resistance coefficient, respectively, Lp, dc, and Ac are the length, diameter, and cross area of pipelines, respectively. Where λ is determined by the state of flow:
λ = { 75 / Re Re 2000 0.332 Re 0.25 2000 < Re < 100000
Similarly, the pressure difference between the in and out port of the gas pipeline can be described as:
Δ p g = λ g L g d g ρ g ( q g / A g ) 2 2
We defined different pressure nodes in the hydraulic and gas pipelines, as presented in Figure 2. The pressure phh, plh, phg denote the high and low pressure nodes in the hydraulic pipeline and pressure node in the gas pipeline, respectively. The pressure differences between the above nodes and different chambers are focused.
As mentioned above, we focused on the energy, power, and cycle performance of the system in this study. We defined the energy density as:
ρ J = J o u t Q e x t r a V t o t a l
where Jout is the effective output energy after the discharging process, Vtotal is the total volume of the system, and Qextra is the total heat recovering the state of the gas after discharge to initial state. The cycle efficiency is defined as:
η = J o u t p u t Q e x t r a J i n p u t
where Jinput denotes the total input energy of the ESS, which is expressed as follows:
J t o t a l = t 0 t 2 W i n d t
where Win represents the input power of the ESS, i.e., the power of hydraulic pump.

3. Results and Discussion

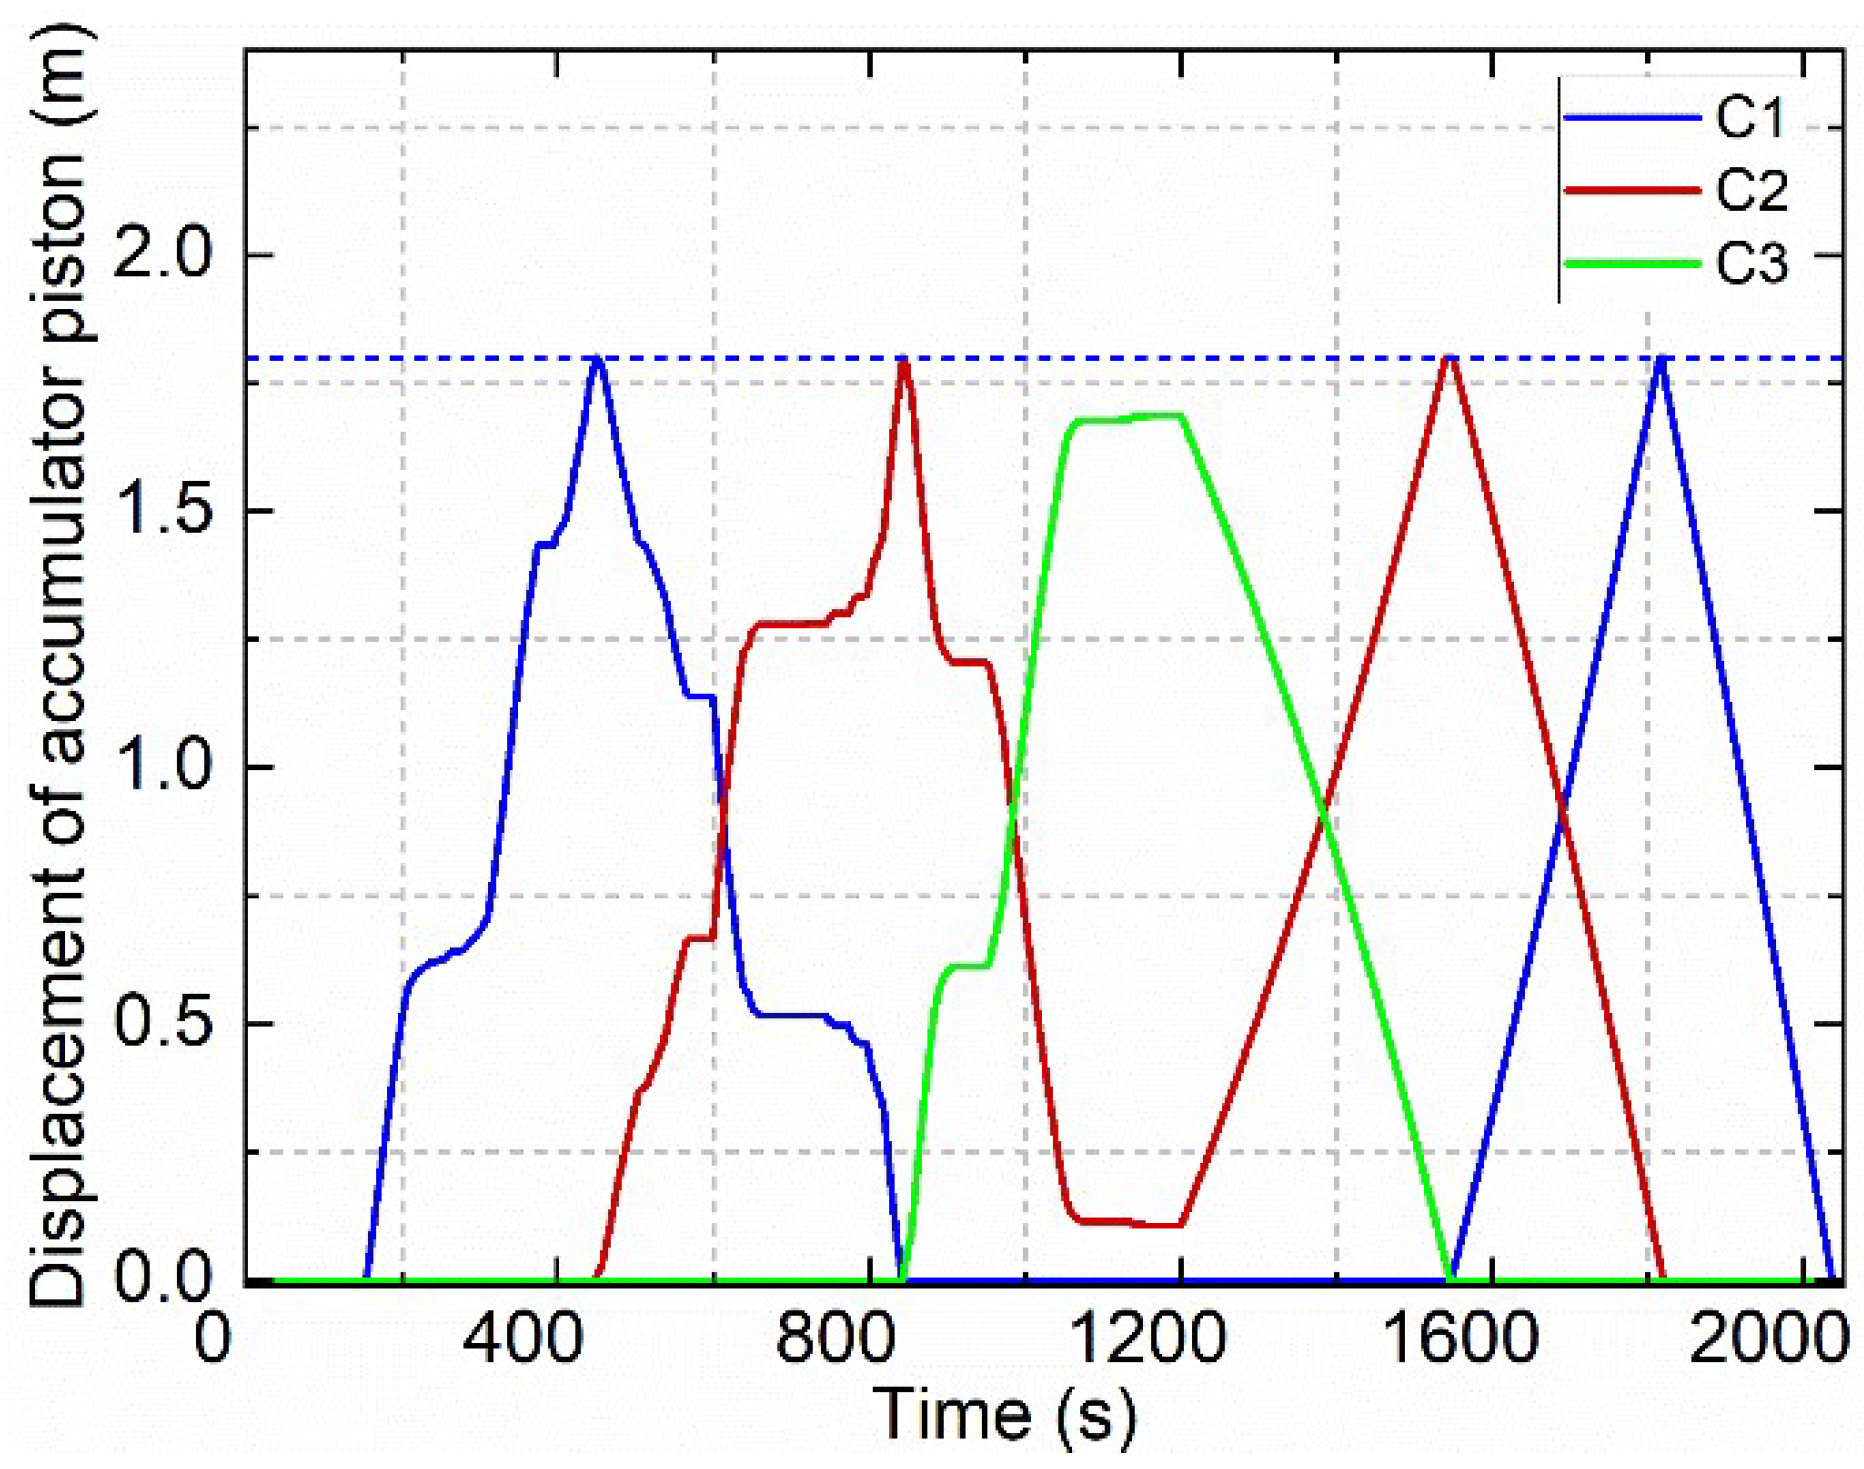
3.1. Real Condition-Based Simulation

After the dynamic modelling of the ESS, the simulation was conducted to analyze the performance of the system where the involved parameters were referred to [24]. The proposed system is modelled based on the real parameters of 110 t HMDT. Different payloads of the trucks would lead to different amounts of recoverable energy, because the recoverable energy originates from the potential energy. For different amounts of energy, the system should be designed appropriately and some key parameters should be adjusted. The real condition-based simulation was conducted, in which the real velocity, load, and slope information in the real mining environment were adopted to obtain the input power of the system as presented in Figure 4.
As depicted in Figure 4, the condition lasted for nearly 2100 s. The climbing condition with heavy load occurred between 0~924 s, then the materials load was dumped between 925~1108 s. The downhill condition occurred between 1109~2200 s. The velocity during the process changes between 0~30 km/h, and the slope varied between 0~8%. During the downhill condition, the component of gravity along the slope would drive the HMDT to accelerate and extra braking force was needed to maintain or decelerate the velocity of the HMDT. The involved energy is consumed by the braking resistance in the normal electric-driven HMDT [10].
We calculated the braking power during downhill conditions according to the dynamics of the HMDT [4]. The velocity was used to calculate the revolution velocity of the hydraulic pump with the aid of the ratio of wheel reducer. Figure 5 presents the driving and braking power in the uphill and downhill conditions. As depicted in Figure 5a,b, the maximum driving and braking power are about 615.1 kW and 243.7 kW, respectively; the average power is nearly 132.8 and 53.4 kW, respectively. After the charging condition, the system is controlled to discharge in a constant output power in the simulation. According to the results in [13], the initial temperature and pressure of the gas were set as 20 °C and 150 bar.

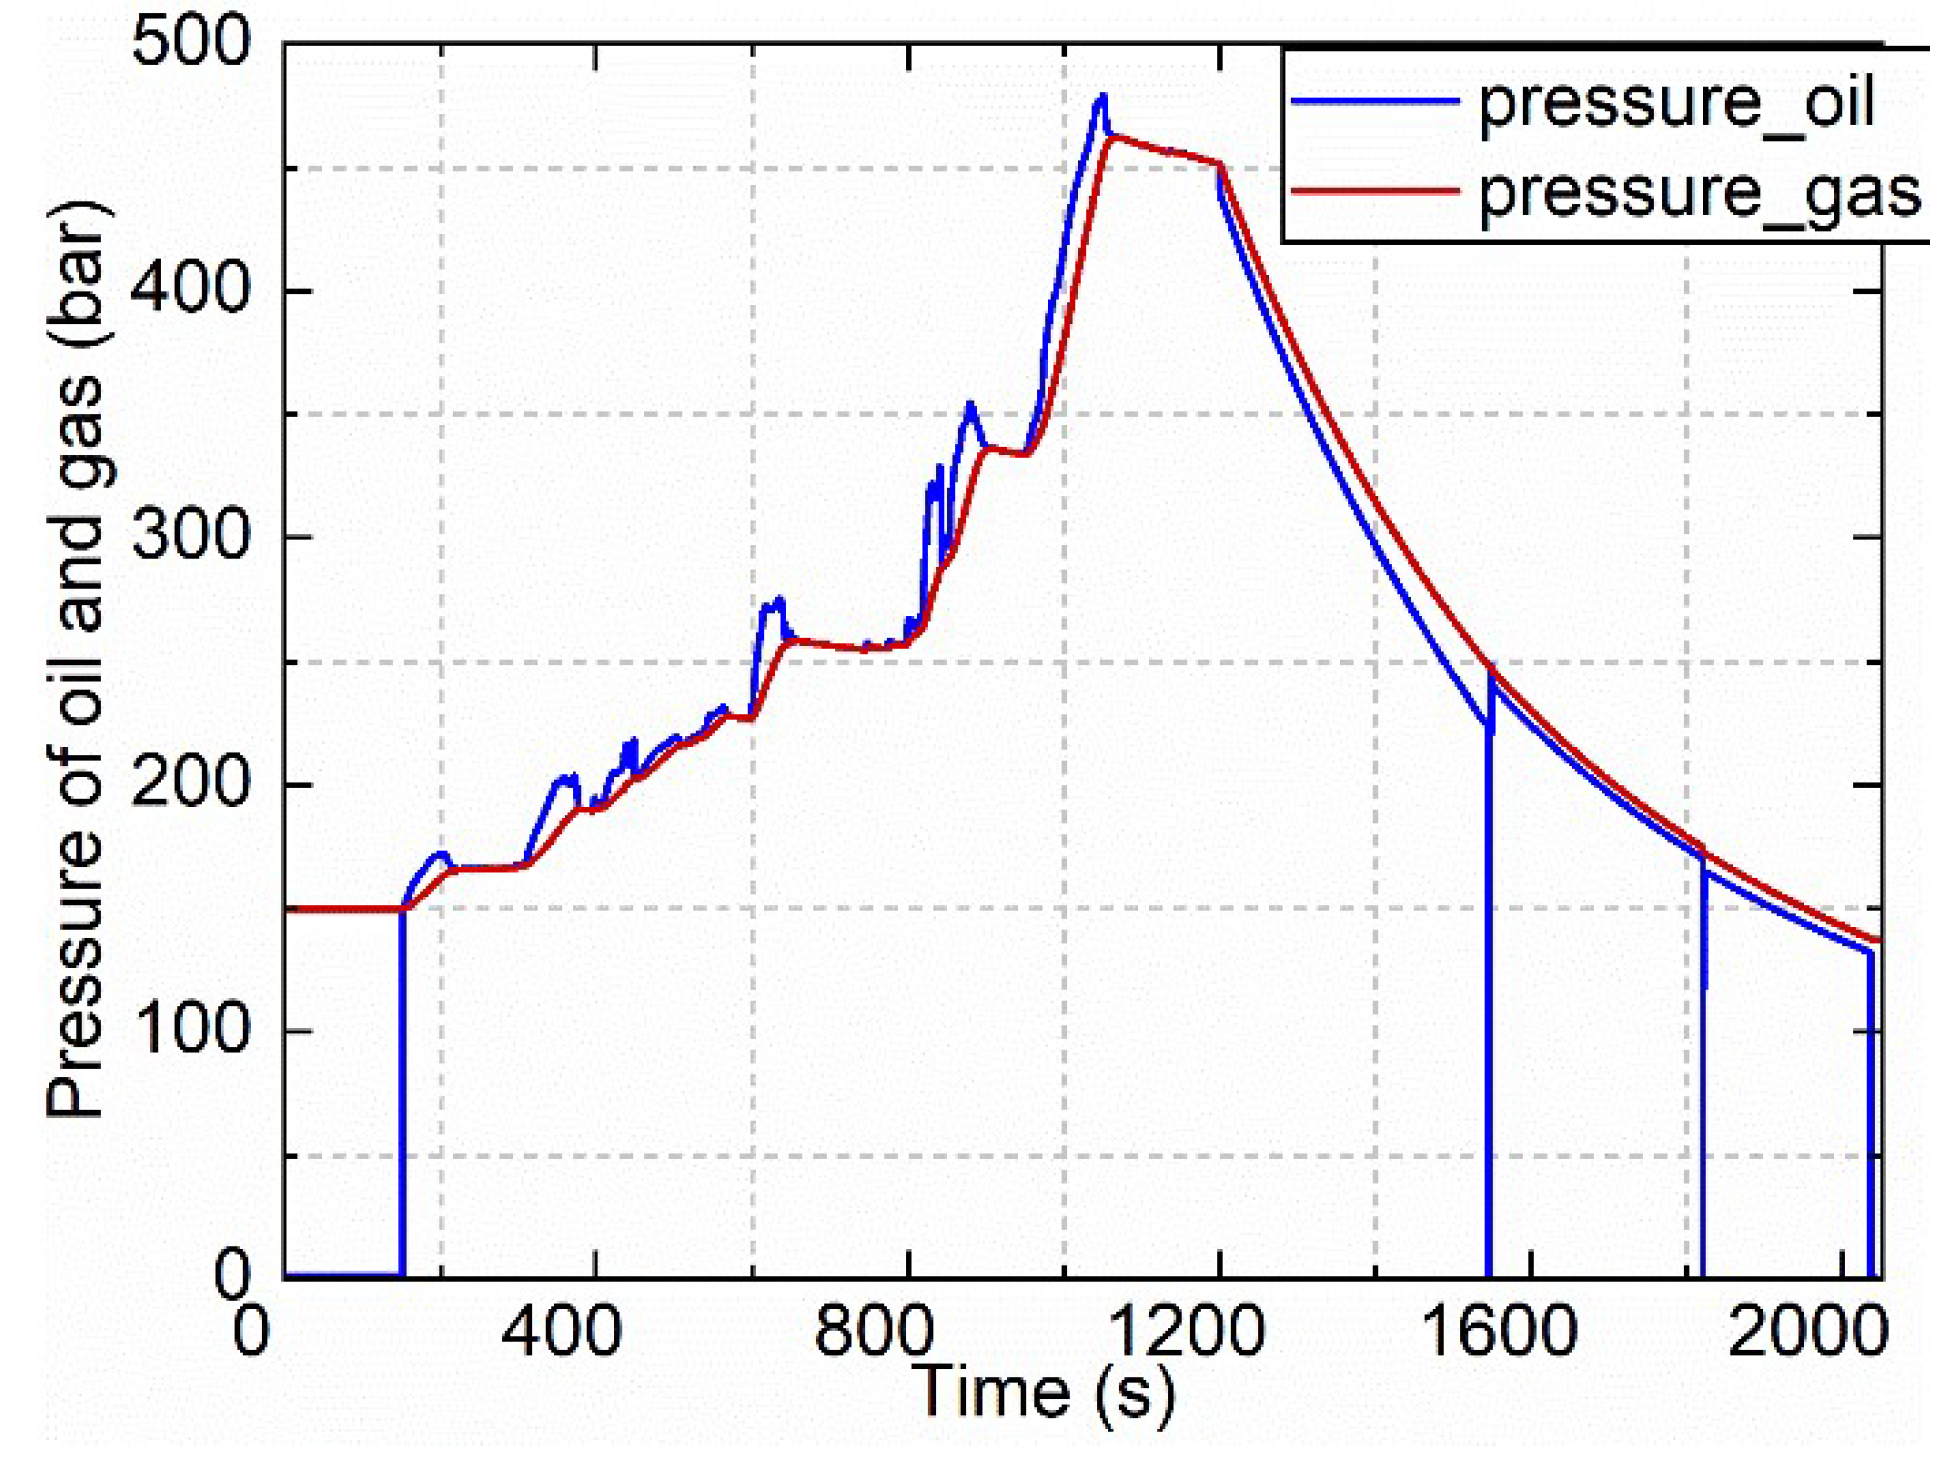
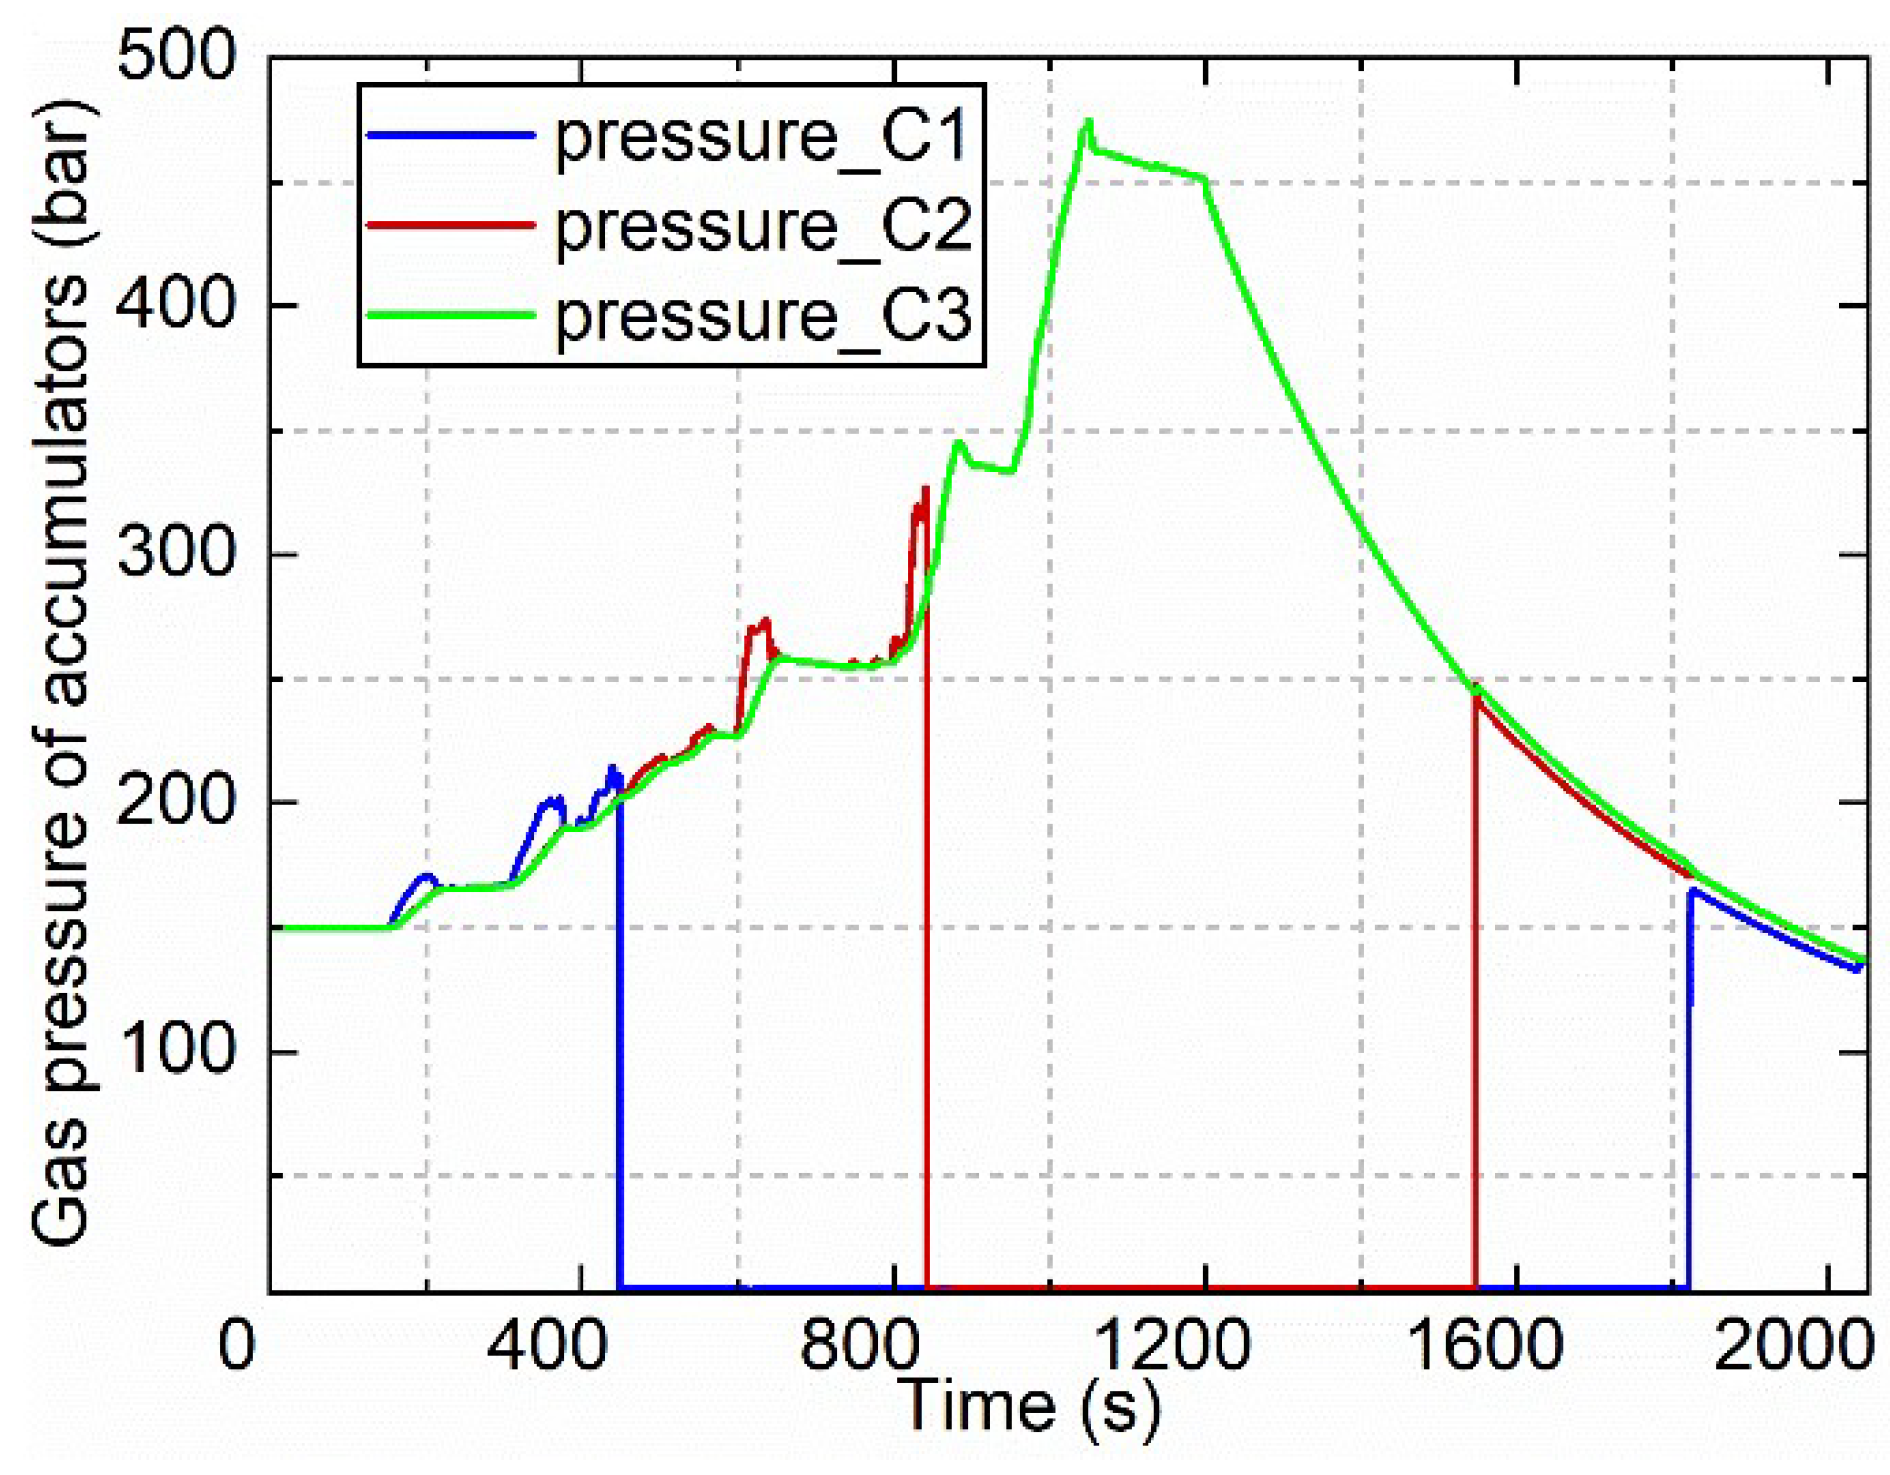
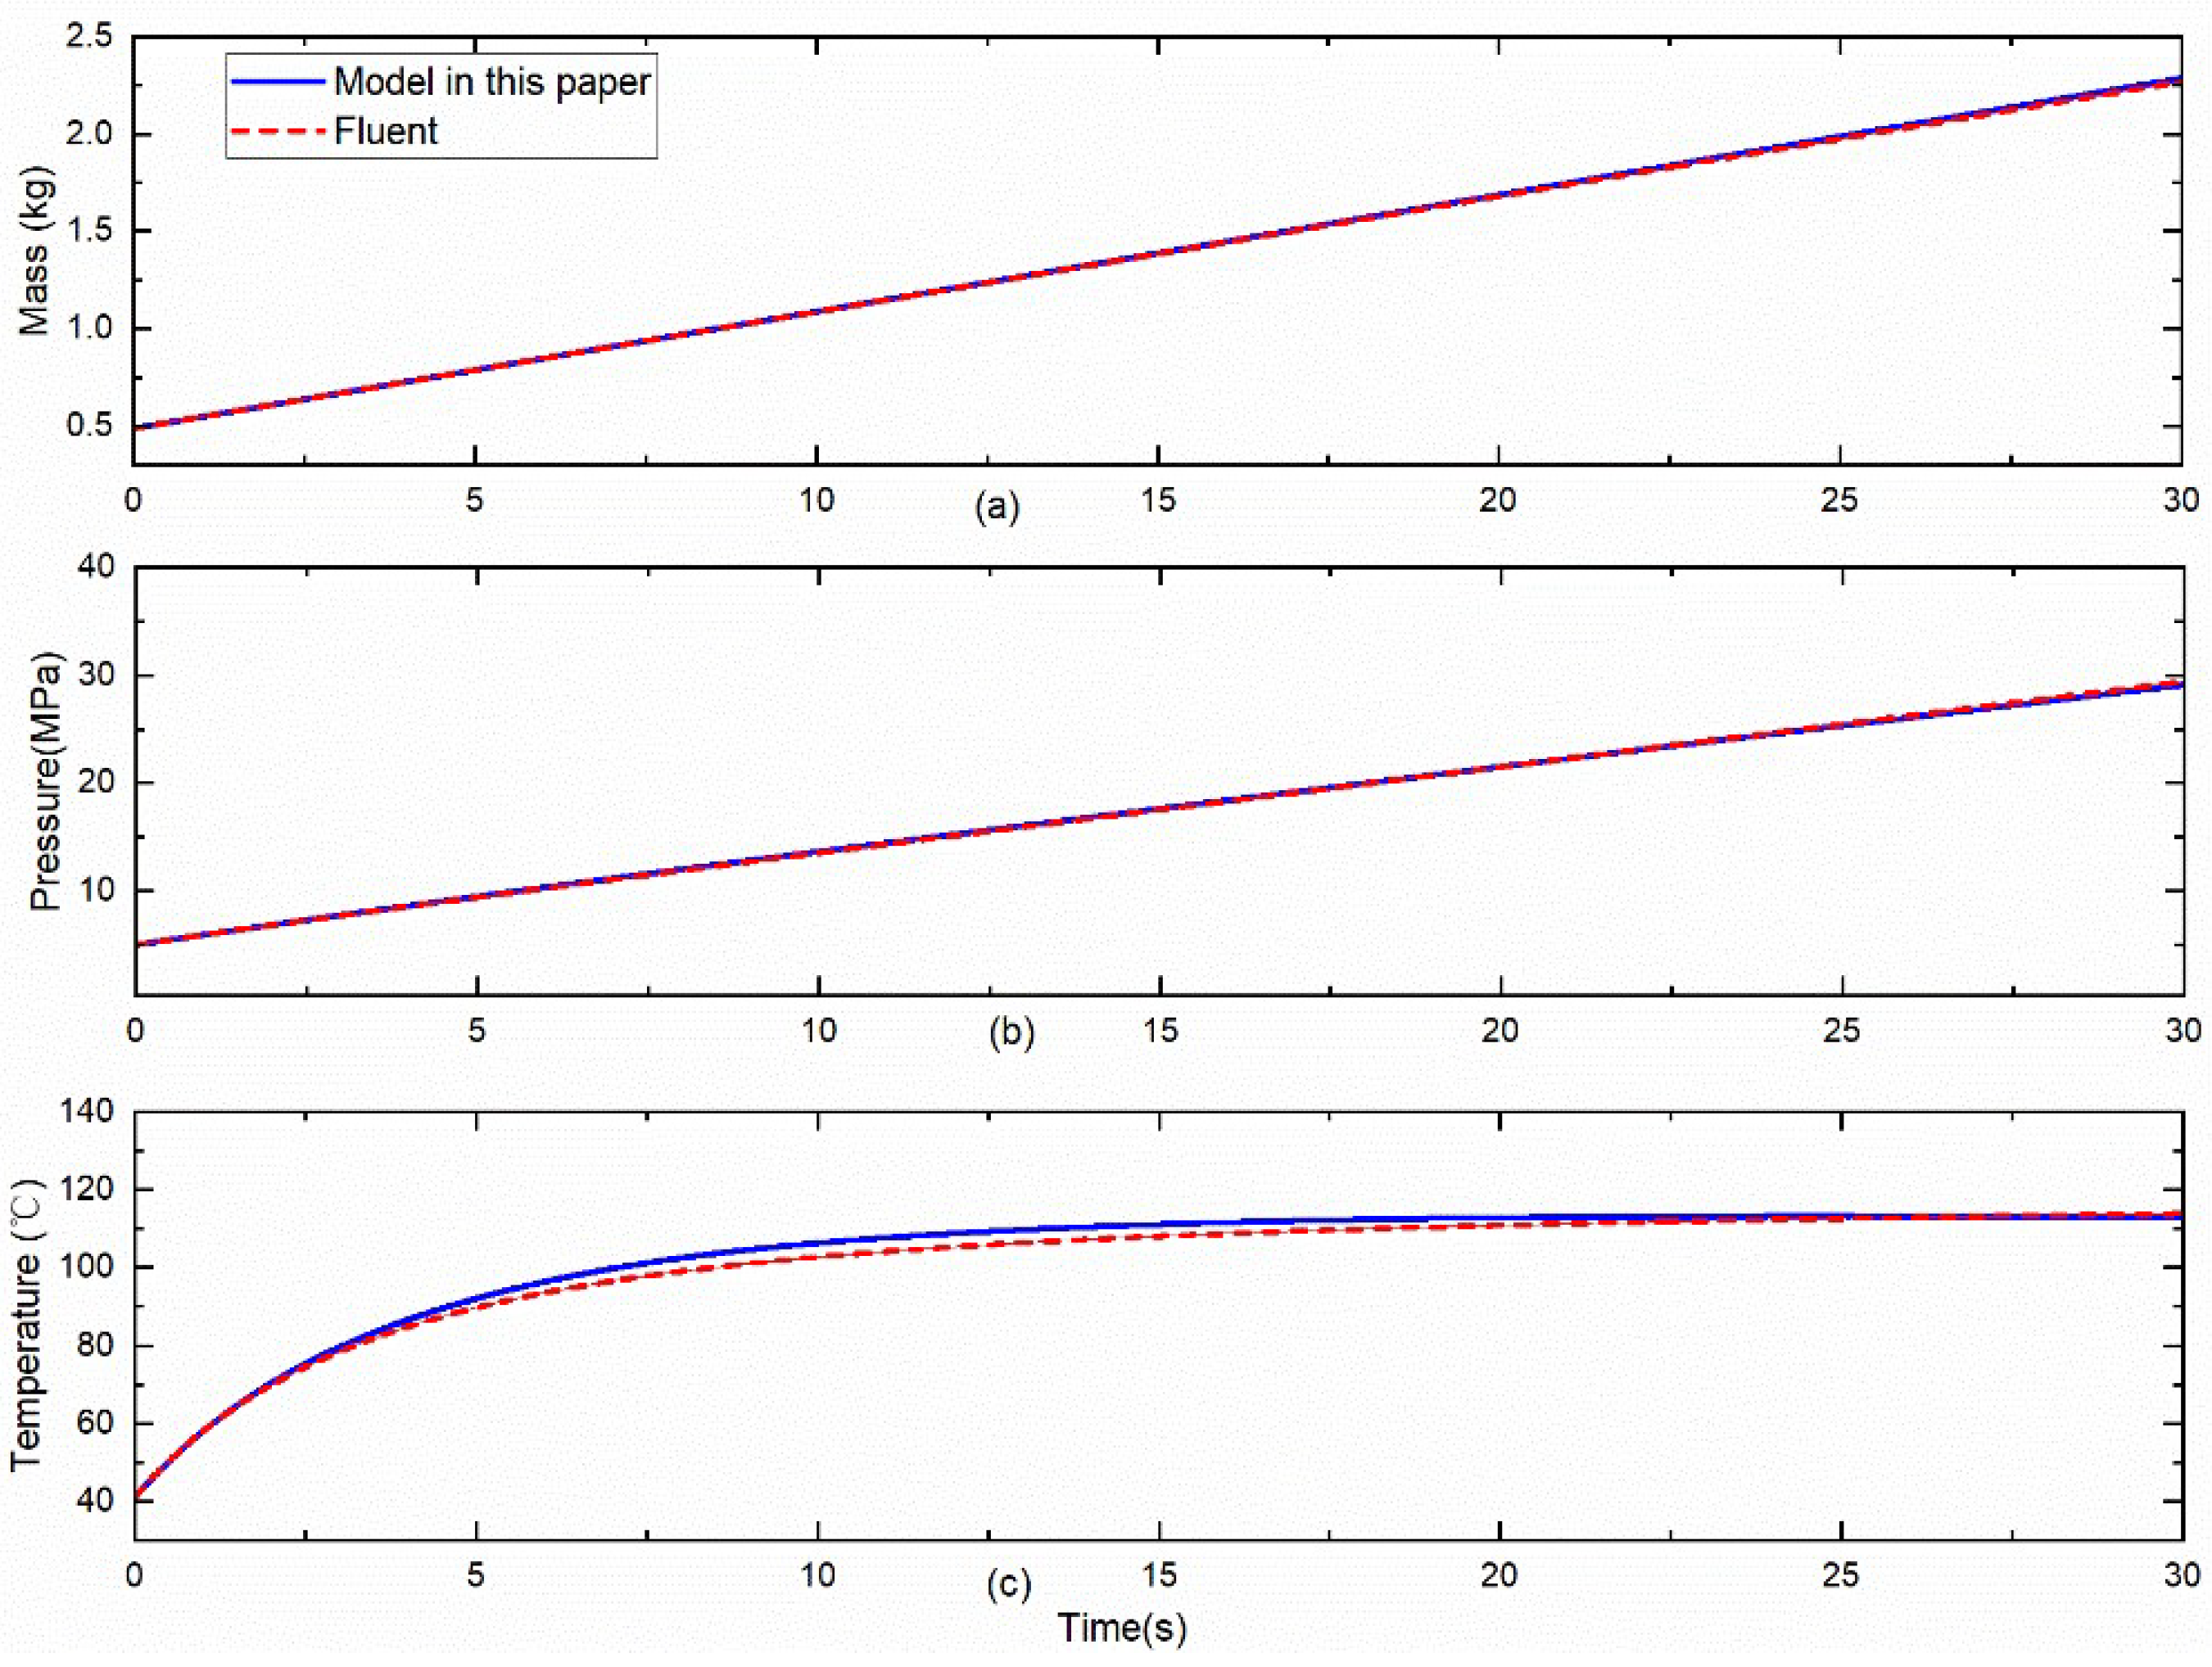
3.2. Pressure Results Analysis

Figure 6 presents the results of the accumulator piston displacement. As depicted in Figure 6, the charging process began at 137.5 s and the first accumulator piston was driven to press gas till 452.2 s, i.e., the piston displacement of C1 reached the limit, 1.8 m, and then the hydraulic side of C1 filled up with hydraulic oil. Subsequently, the hydraulic valve controlled the pump to suck oil from C1, and the piston of C2 was controlled to press gas. The piston displacement of C1 and C2 changed inversely between 452.2~845 s, and C3 and C2 changed similarly till 1150.2 s. The piston displacement of C3 was 1.6 m, and that of C2 reached 0.2 m after the charging process. The displacement of the piston changed with the braking power, as indicated in the results depicted in Figure 5 and Figure 6. When the braking power was large, the displacement changed rapidly; when the braking power was zero, the displacement was kept constant. This is because the input power is transferred as the volume work of the gas, and the power is directly determined by the flow by Equation (2).
The pressure of hydraulic oil and gas are presented in Figure 7. As depicted in this figure, the initial pressure of the gas was 150 bar, and the pressure increased in the charging process till the maximum pressure 462.1 bar. The hydraulic pressure was slightly higher than the gas pressure, which was caused by the loss of the piston resistance and pipeline. In the discharging process, the pressure of the gas was slightly higher than the hydraulic since the pressured gas drives the piston and overcomes the resistance of the pipeline. The gas pressure was about 137.2 bar after the discharging process though the total mass of the gas was not changed. The temperature of the gas decreased in the discharging process, the final pressure state was lower than the initial pressure, 150 bar. In addition, the hydraulic pressure fluctuated in the discharging process due to the switch of valves.
The gas pressure results of different accumulators are illustrated in Figure 8. The comparison results showed that the pressure was 150 bar when the charging process began; after the first accumulator finished the pressed work, the pressure was nearly 207.8 bar. Moreover, the pressure of C1 was slightly higher than C2 and C3 during the charging process; the steeper the curve, the greater the difference, due to the pressure loss in the pipeline. When the C2 and C3 finished the pressed work, the pressures were about 319.7 bar and 462.1 bar, respectively. After the charging process the pressure was nearly 462.1 bar; it also decreased slowly since the heat dissipation of the gas tank causes the temperature to drop, and the pressure also decreases. In the discharging process, the pressure of the above accumulator dropped slowly. When the C2 began to discharge the pressure was about 244.5 bar, lower than the pressure of finished charging (318.7 bar), and the pressure of C1 (165.2 bar) was also lower than the charging process.

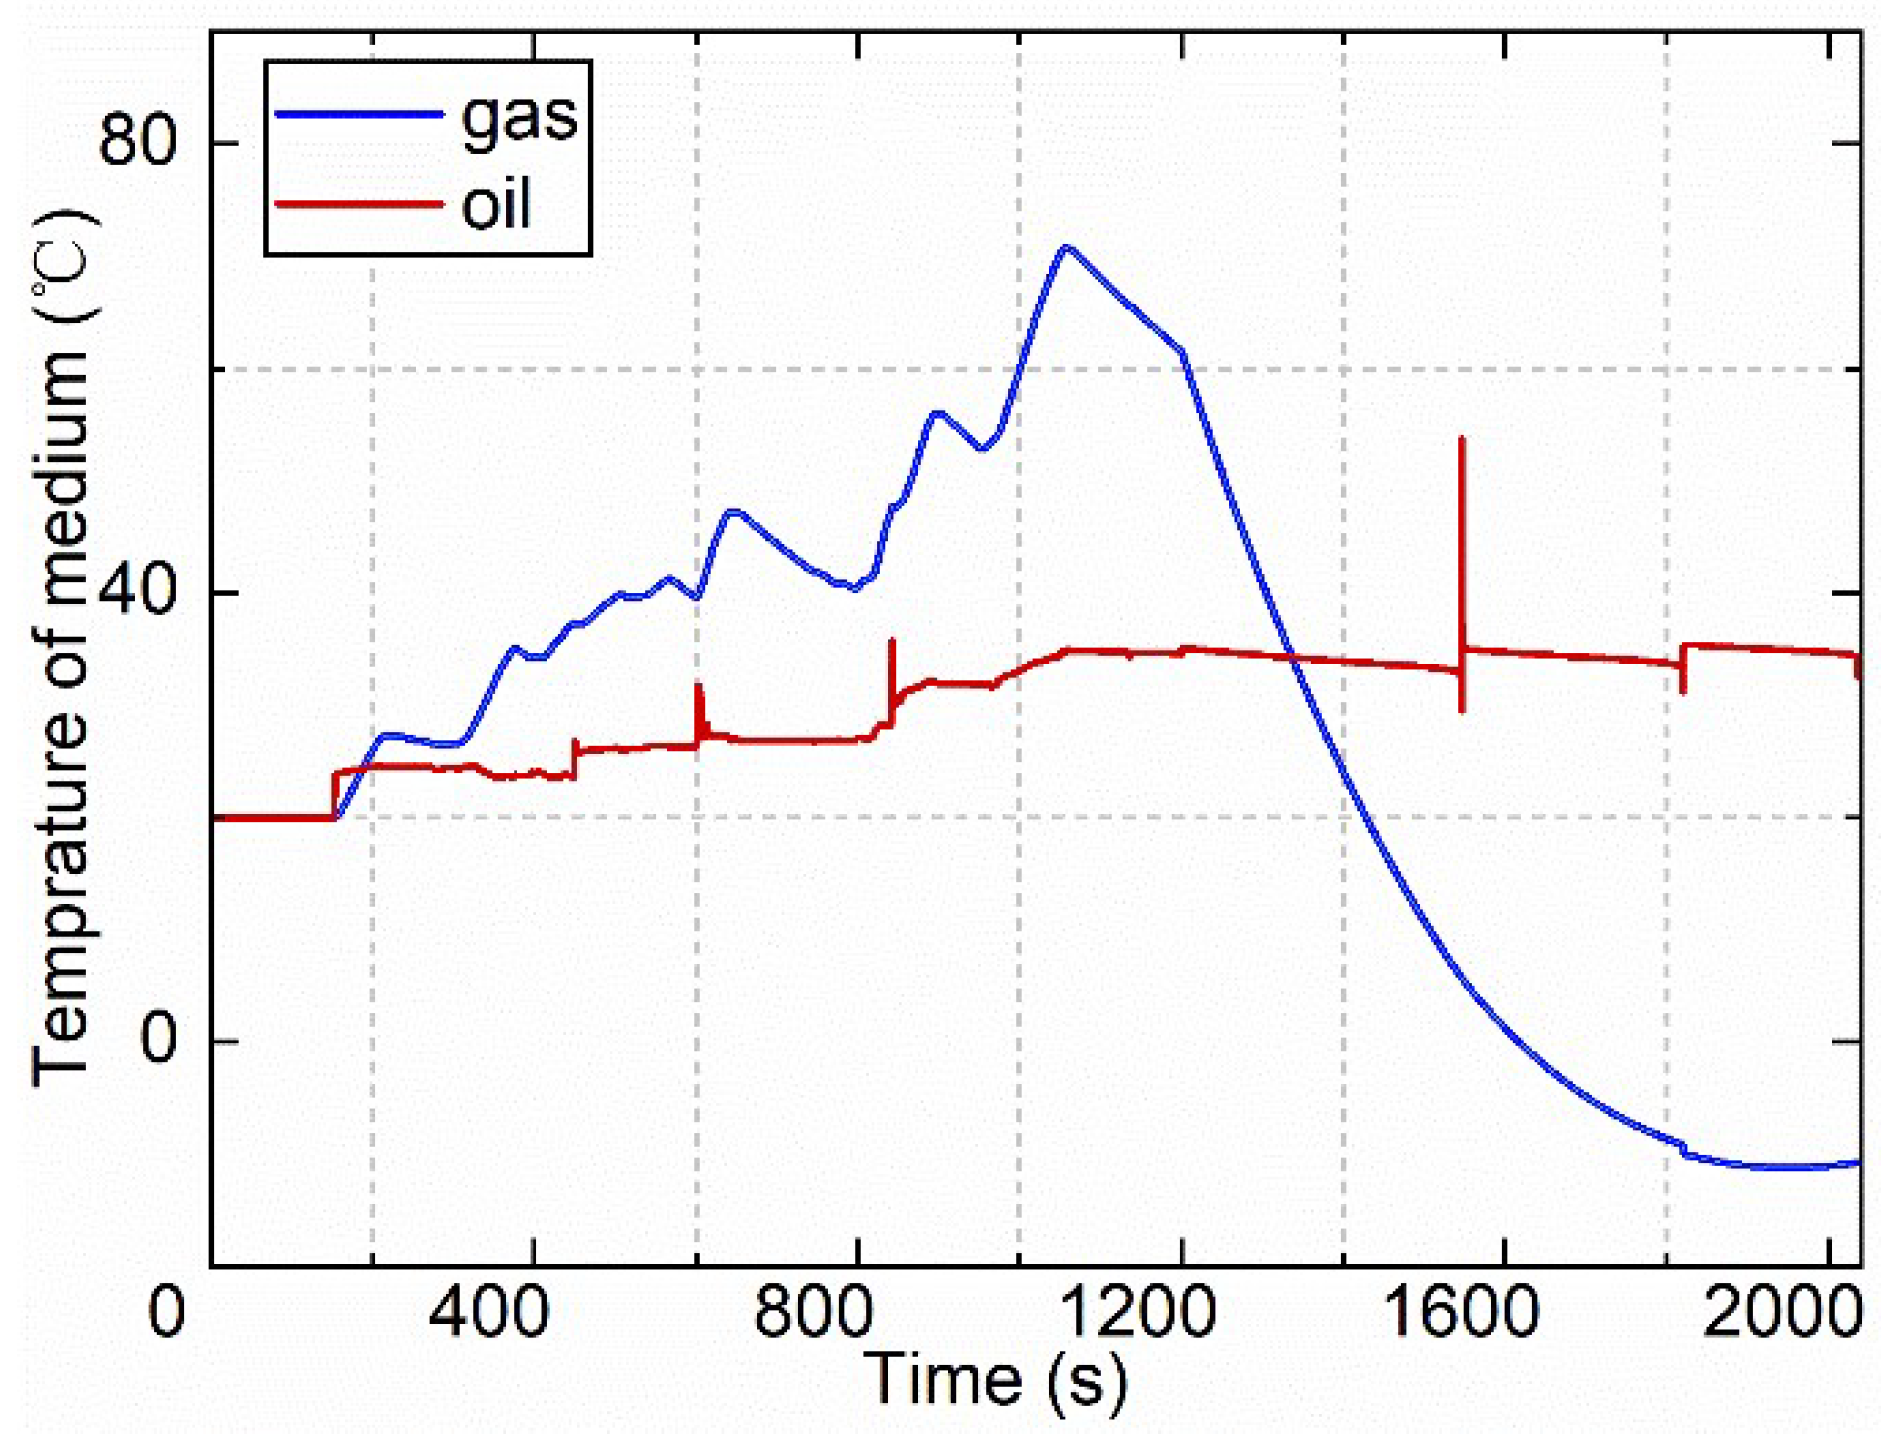
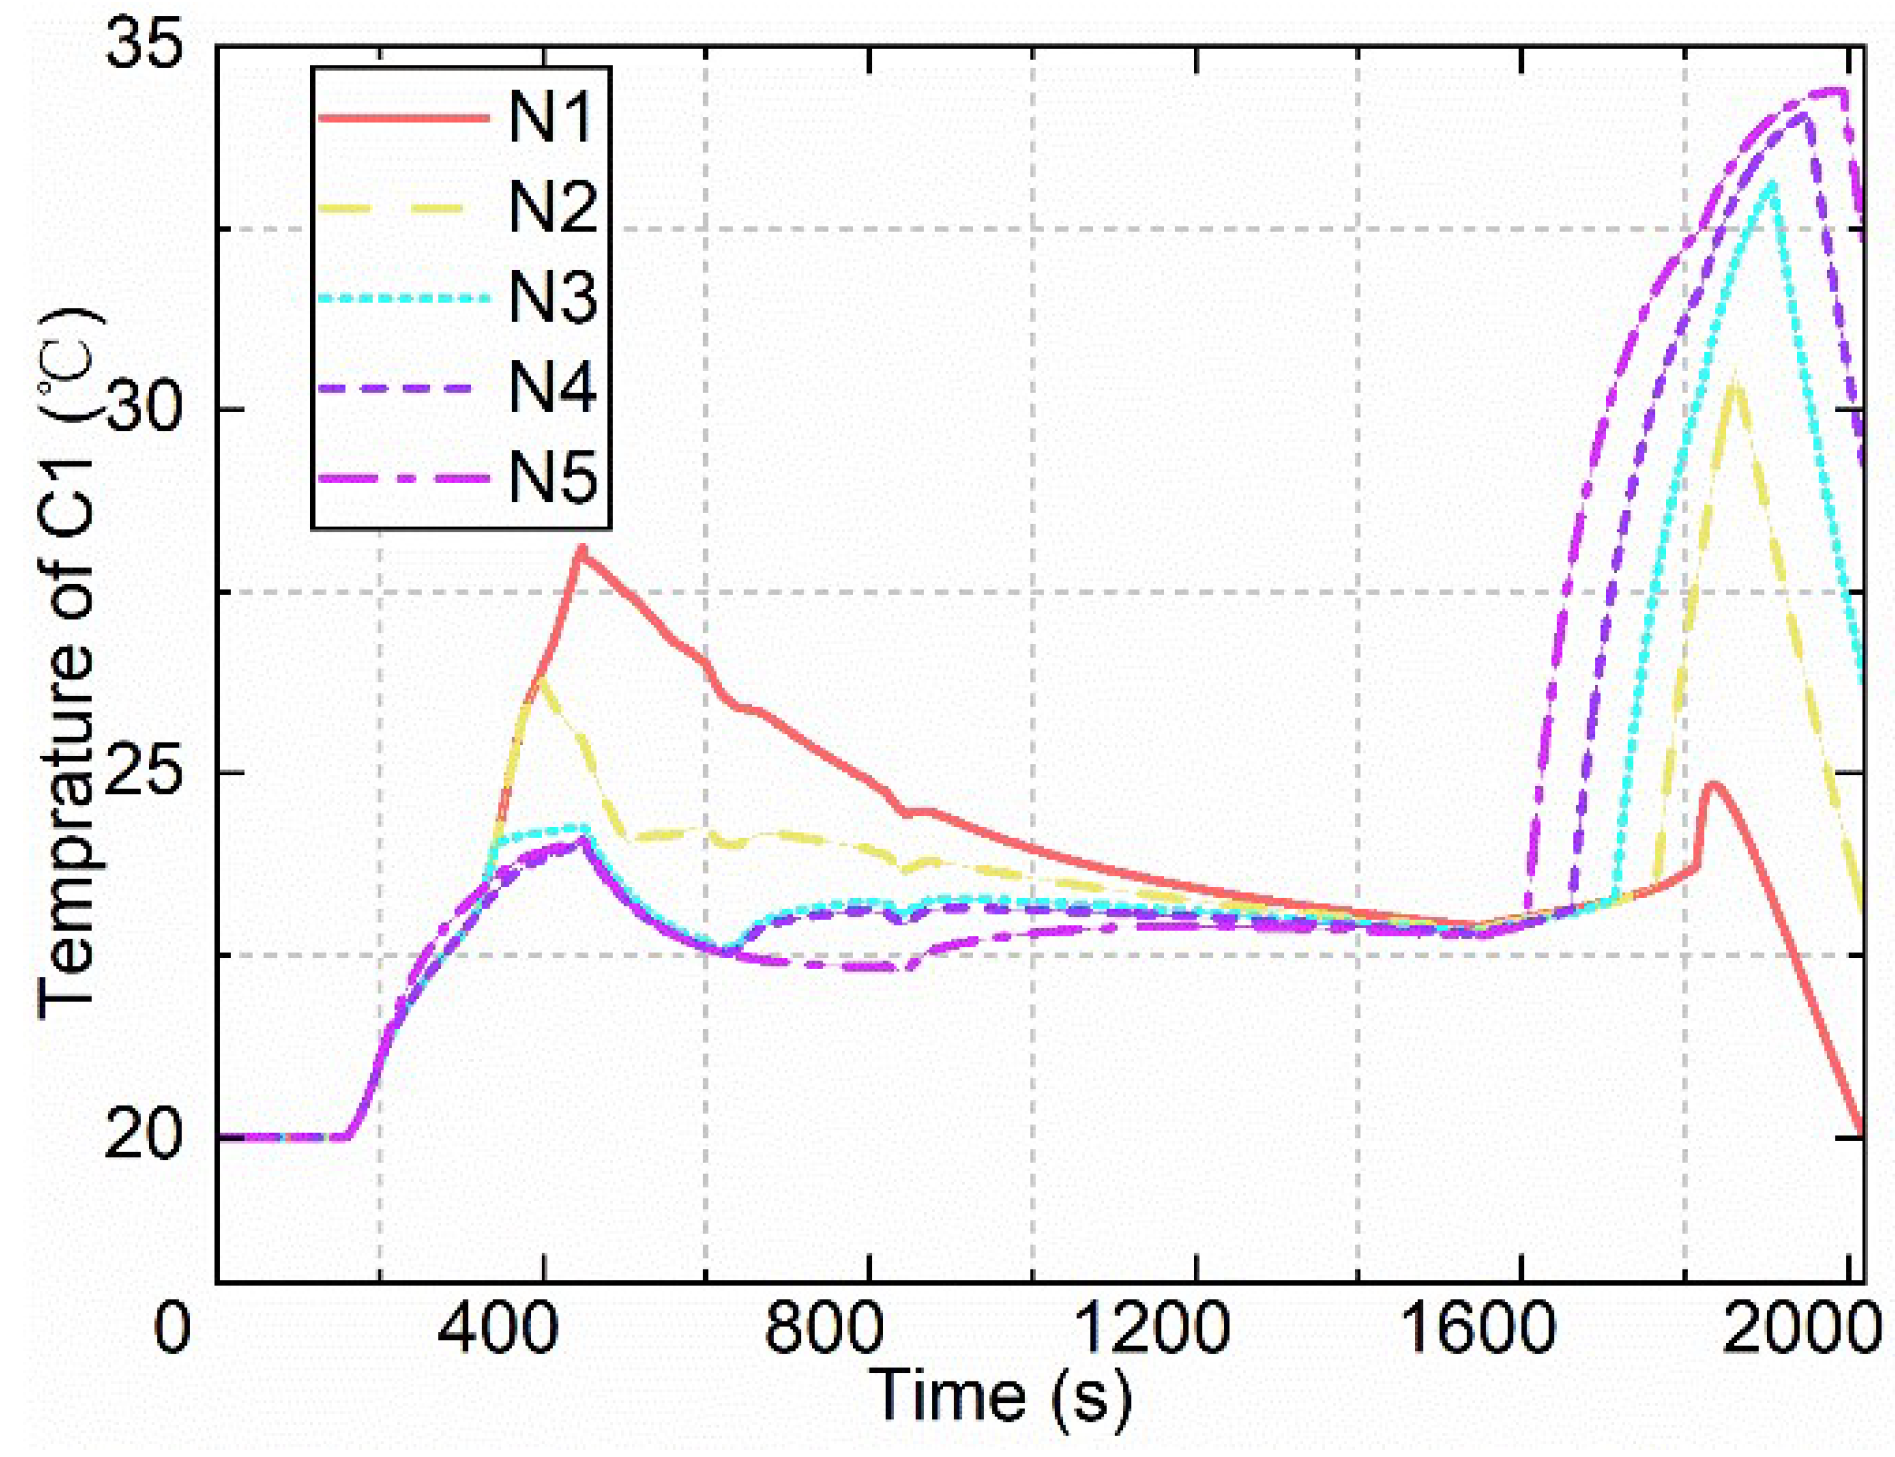
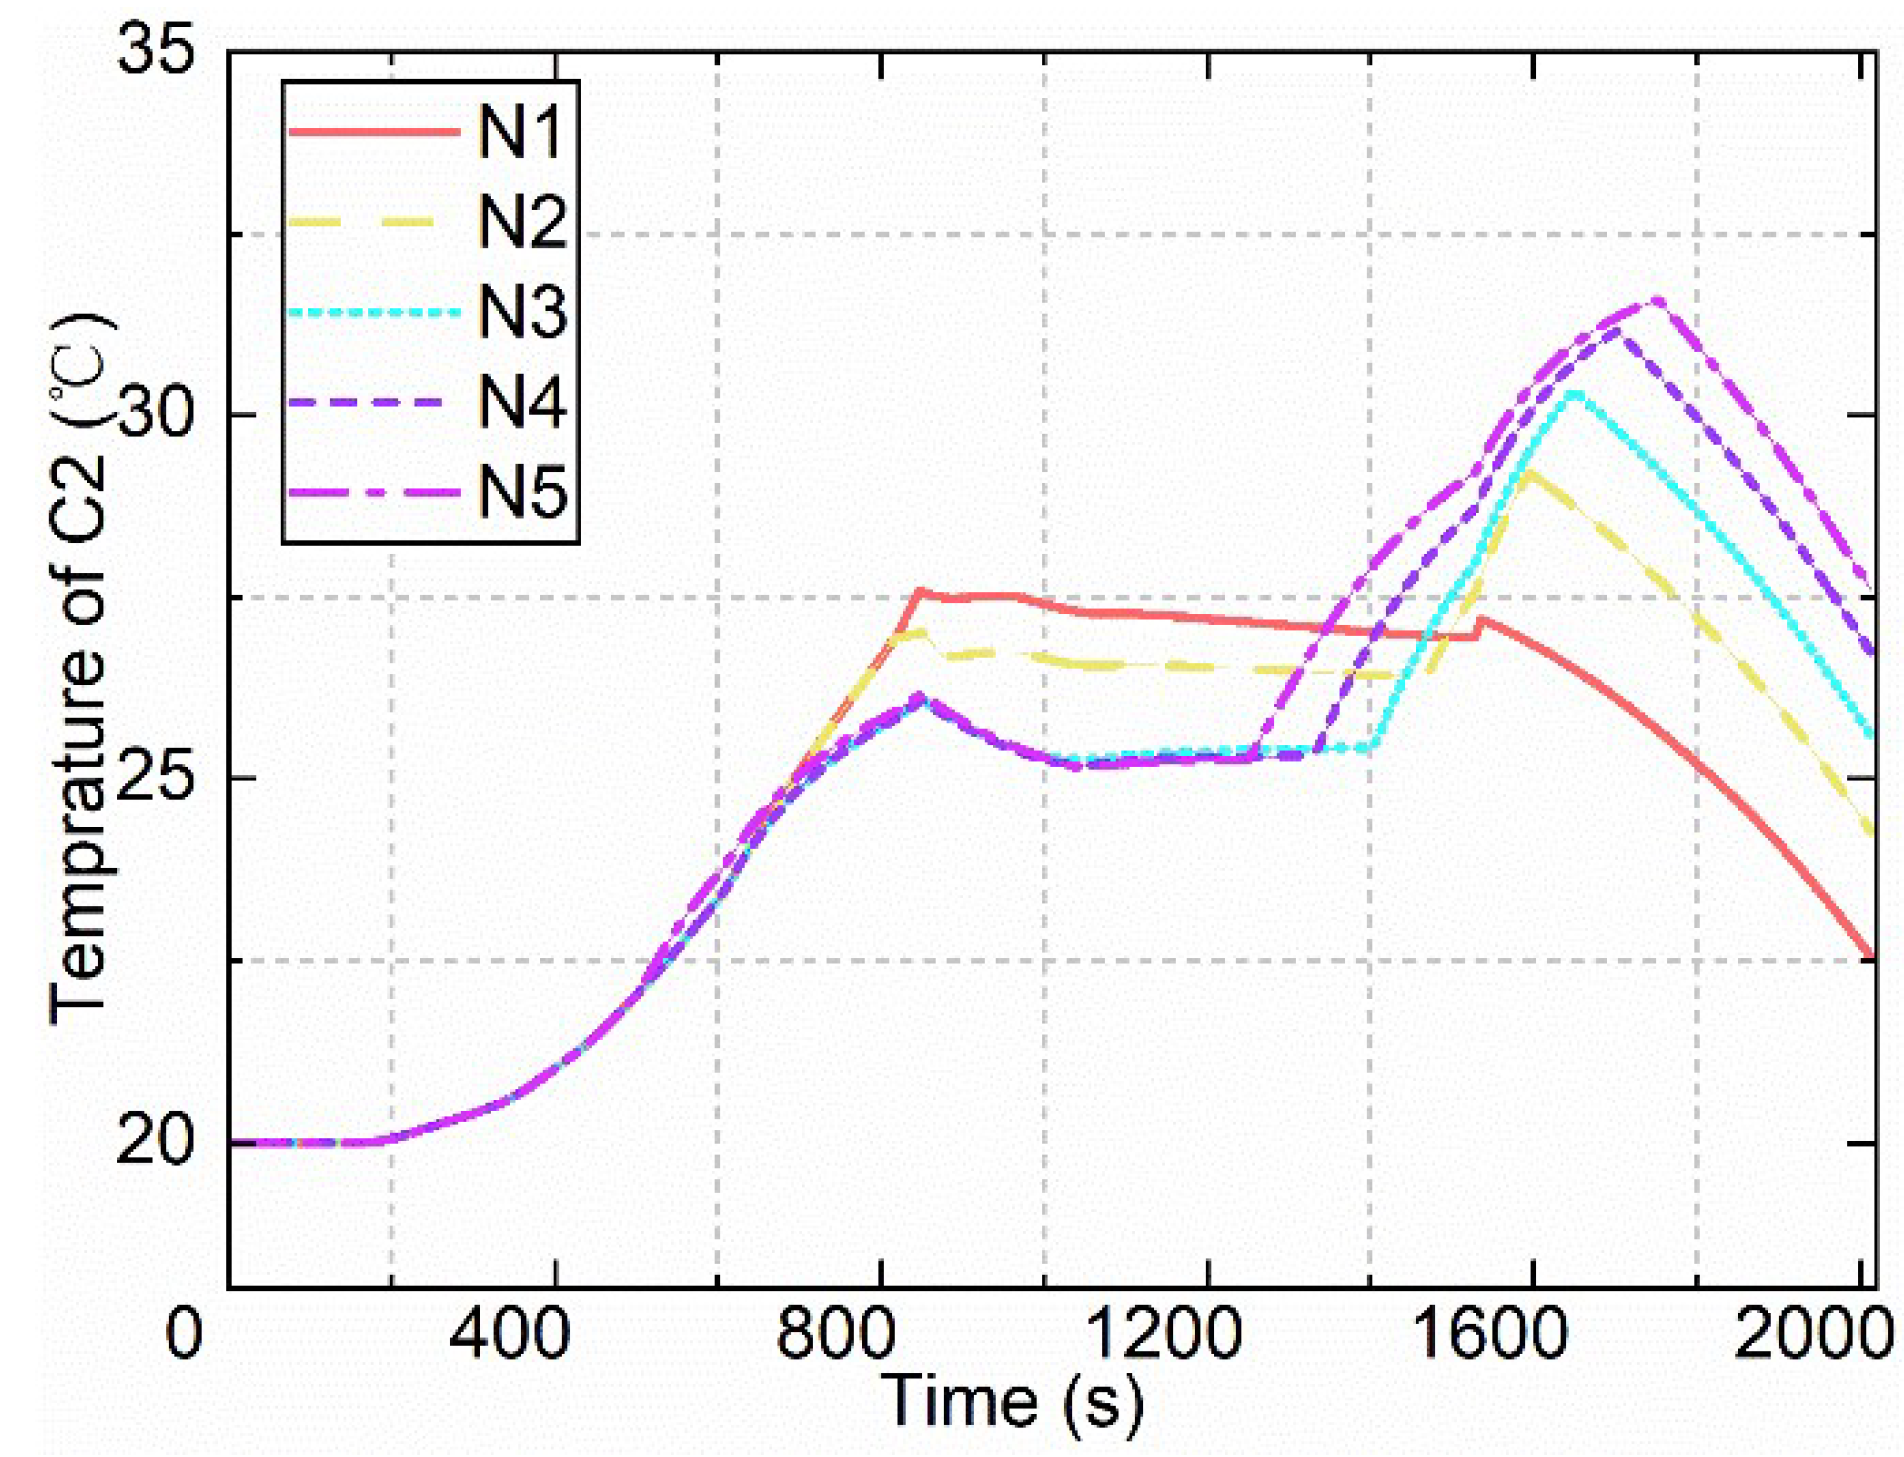
3.3. Temperature Results Analysis

Although the total amount gas was the same, the temperature was different according to the temperature results in Figure 9. The temperature of the hydraulic and gas medium was set to 20 °C at the beginning of charging. The temperature of the gas rose quickly in the charging process and reached 72 °C when the charging process was achieved and the temperature of the hydraulic fluid was nearly 32 °C. The increase in the gas temperature was significantly higher than that of the hydraulic fluid. When the temperature of the gas and the hydraulic fluid was higher than the ambient temperature, the heat of the system dissipated to ambient, and the heat originated from the input energy of the system. Accordingly, when the discharging process finished at approximately 2050 s, the temperature of the gas was nearly −10 °C and the hydraulic temperature was nearly 34 °C. The inner energy difference between the beginning and end was the total heat dissipation throughout the process. The difference can be made up by the heat transfer between the gas tank and ambient, gas pipeline and ambient, which can ensure the state of the gas return back to initial state, i.e., 20 °C and 150 bar during the idle time interval of the HMDT. The HMDT was idle at the loading stage.
The temperature results of different accumulators’ gas chambers were shown in Figure 10. As we can see from Figure 10, the temperature of different gas chambers rose in the charging process, and the temperature of the pressurized chamber was a little higher than the other chambers. Such as, the temperature of C1 was higher than C2 and C3. This was caused by the volume difference of the pressurized gas and the flowing chambers. The final temperature of C3 was approximately 94 °C after the charging process, and the corresponding temperature of C1 and C2 were about 22 °C and 31°. For accumulator C1, the contact medium was ambient gas, the temperature returned the ambient temperature, i.e., 20 °C. While for C2, where the contact medium involved ambient gas and hydraulic oil after the charging process, the temperature fell back to the oil temperature, i.e., 30 °C. In the discharging process, the pressurized gas expansively filled up the accumulator C3, C2, and C1 sequentially. The temperature of the three accumulators would decrease sequentially during this process. According to the results in Figure 10, the final temperatures were −18 °C, 0 °C, and 14 °C, respectively. The temperature difference between the final and initial states can be made up during the idle time of the HMDT.
The temperature of different nodes on accumulators was investigated. Five well-distributed nodes from the upper and lower limits were defined as N1, N2, N3, N4, and N5, respectively. The temperature of different nodes on the three accumulators are shown in Figure 11, Figure 12 and Figure 13. As depicted in Figure 10, Accumulator C1 participated the charging and discharging processes during 137.5~845 s and 1524~2050 s; the temperature changed clearly during the above stages and kept constant during other stage, which was nearly 23.3 °C. The maximum temperature in the charging process was about 27.8 °C, and the corresponding temperature was about 34.2 °C in the discharging process. According to the results in Figure 9, the temperature of the gas was higher than hydraulic fluid and N1 has longer contact time with gas, while the temperature of N1 is higher than N2, N2 was higher than N3, and so on in the charging process.
However, the temperatures of N1~N5 increased reversely at the early stage of the discharging process since the hydraulic oil fills up the accumulator C1 before its discharging process. The wall of the accumulator was warmed. Then the temperatures decreased sequentially in the discharging process. The final state of N1 was nearly 18.1 °C, and the other nodes were slightly higher than N1. The contact area was all ambient environment, and all temperatures of the above nodes would decrease back to ambient temperature.
According to the thermodynamics of the gas, when the gas was suppressed the temperature and pressure would rise together. The different gas chamber of accumulators connected with each other in the charging process, and the gas temperature of C2 and C3 raised in the charging process. Thus, the temperature of the different nodes of C2 and C3 raised synchronously at the starting stage of charging according to the results in Figure 12 and Figure 13. The temperature of N1 kept constant and slightly higher than the other nodes from 840~1200 s and the temperature of other nodes raised over N1 in the discharging process. The maximum temperature was about 32.1 °C when the C2 finished discharging. According to the results in Figure 13, the temperature of different nodes increased in the charging process and decreased in the discharging process synchronously, and there was a slight difference between the temperature of N1 (36.4 °C) and other nodes (32.1 °C) after 1050 s. As depicted in Figure 6, the C3 had not reached the limited position when the charging finished, and N1 nodes kept contact with the gas medium throughout the process. Accordingly, the temperature of N1 was slightly higher than the other nodes.

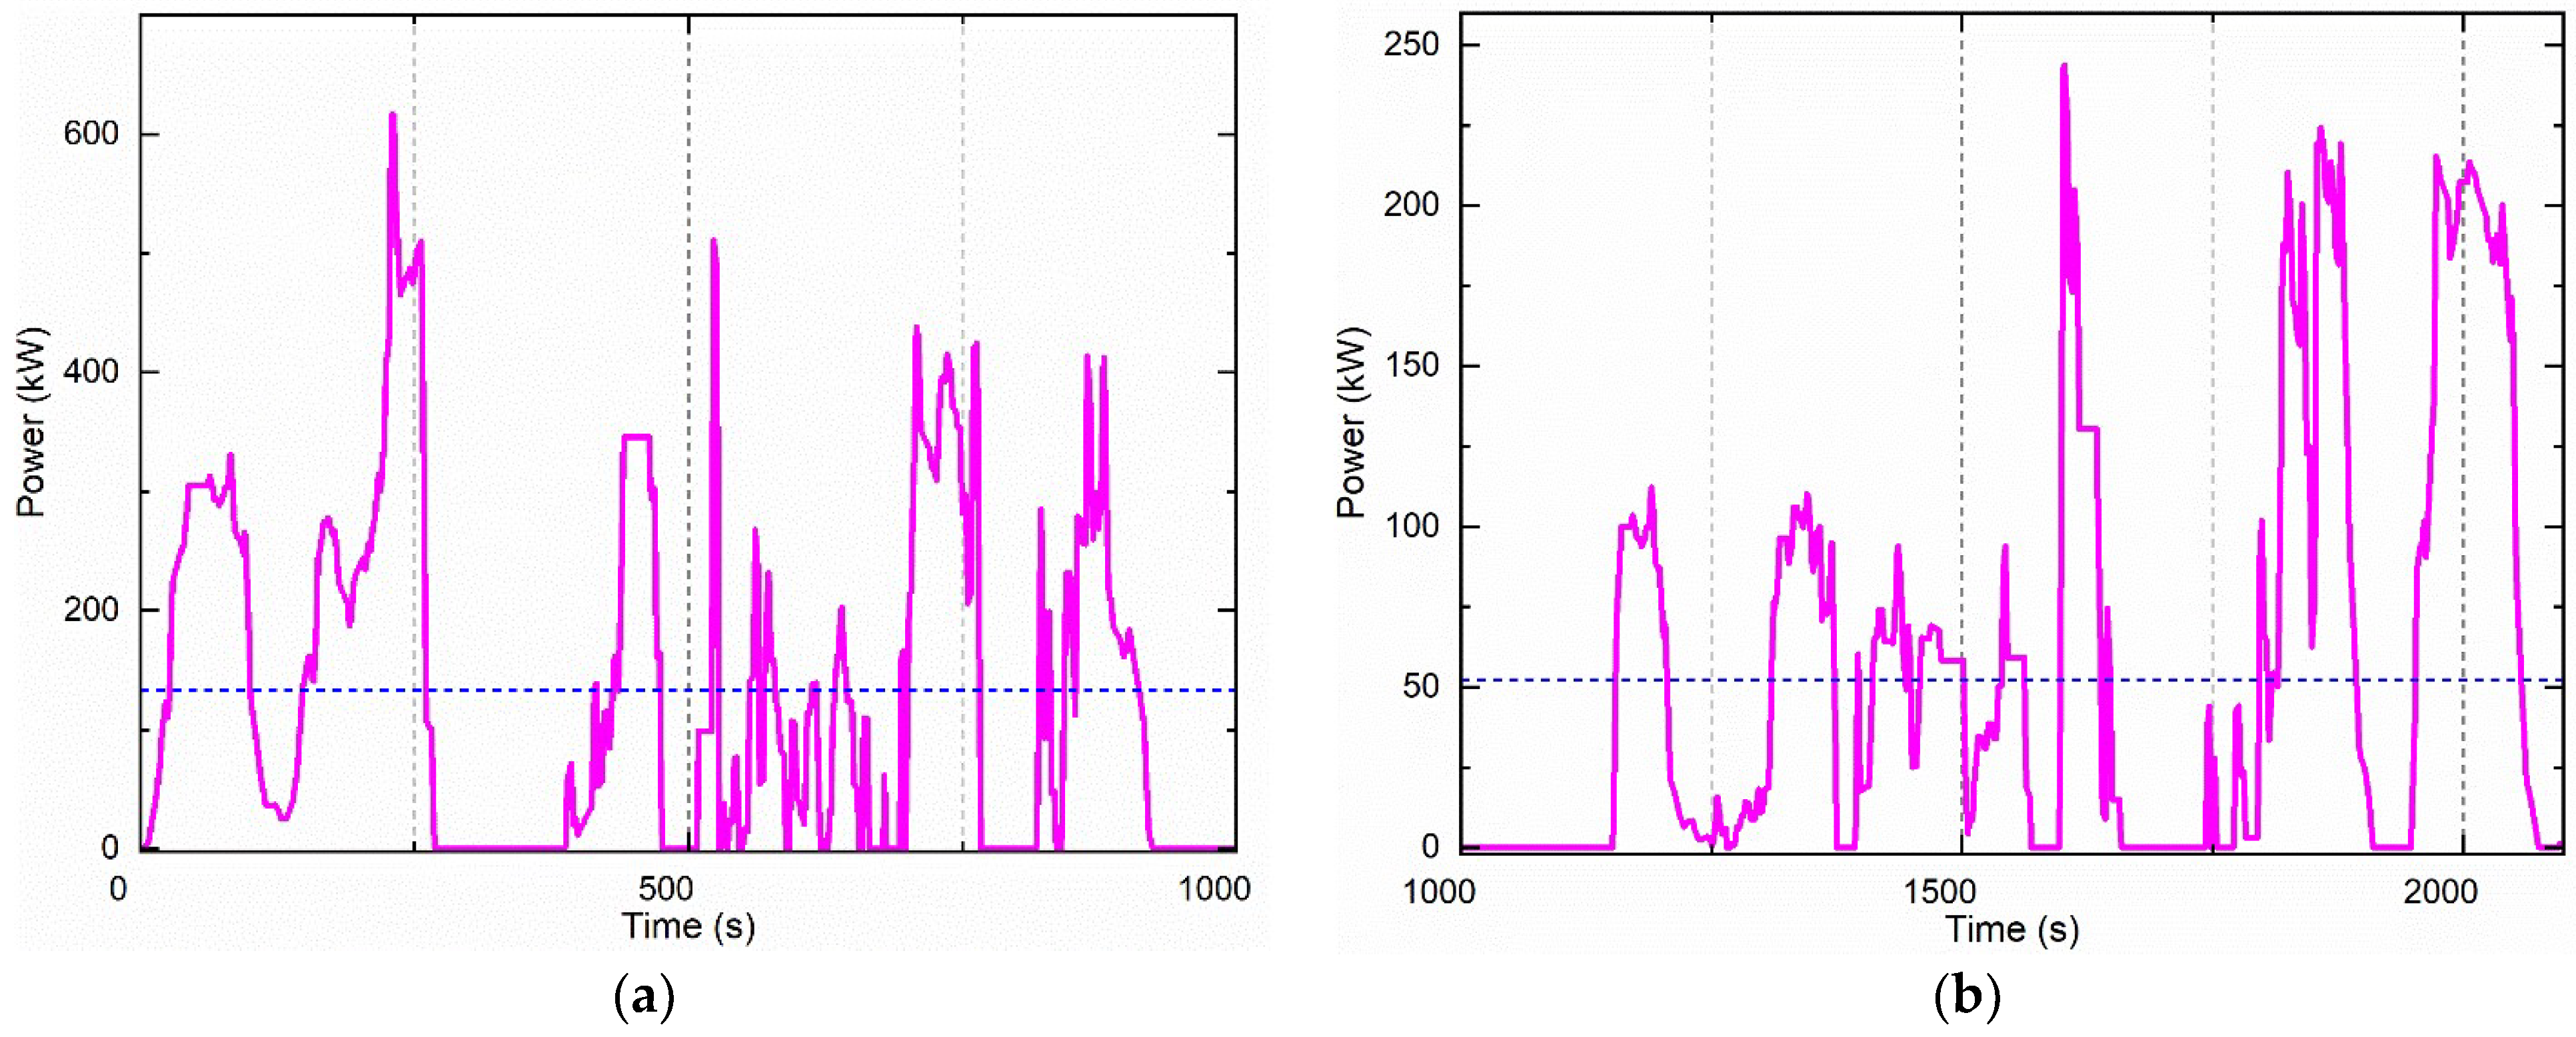
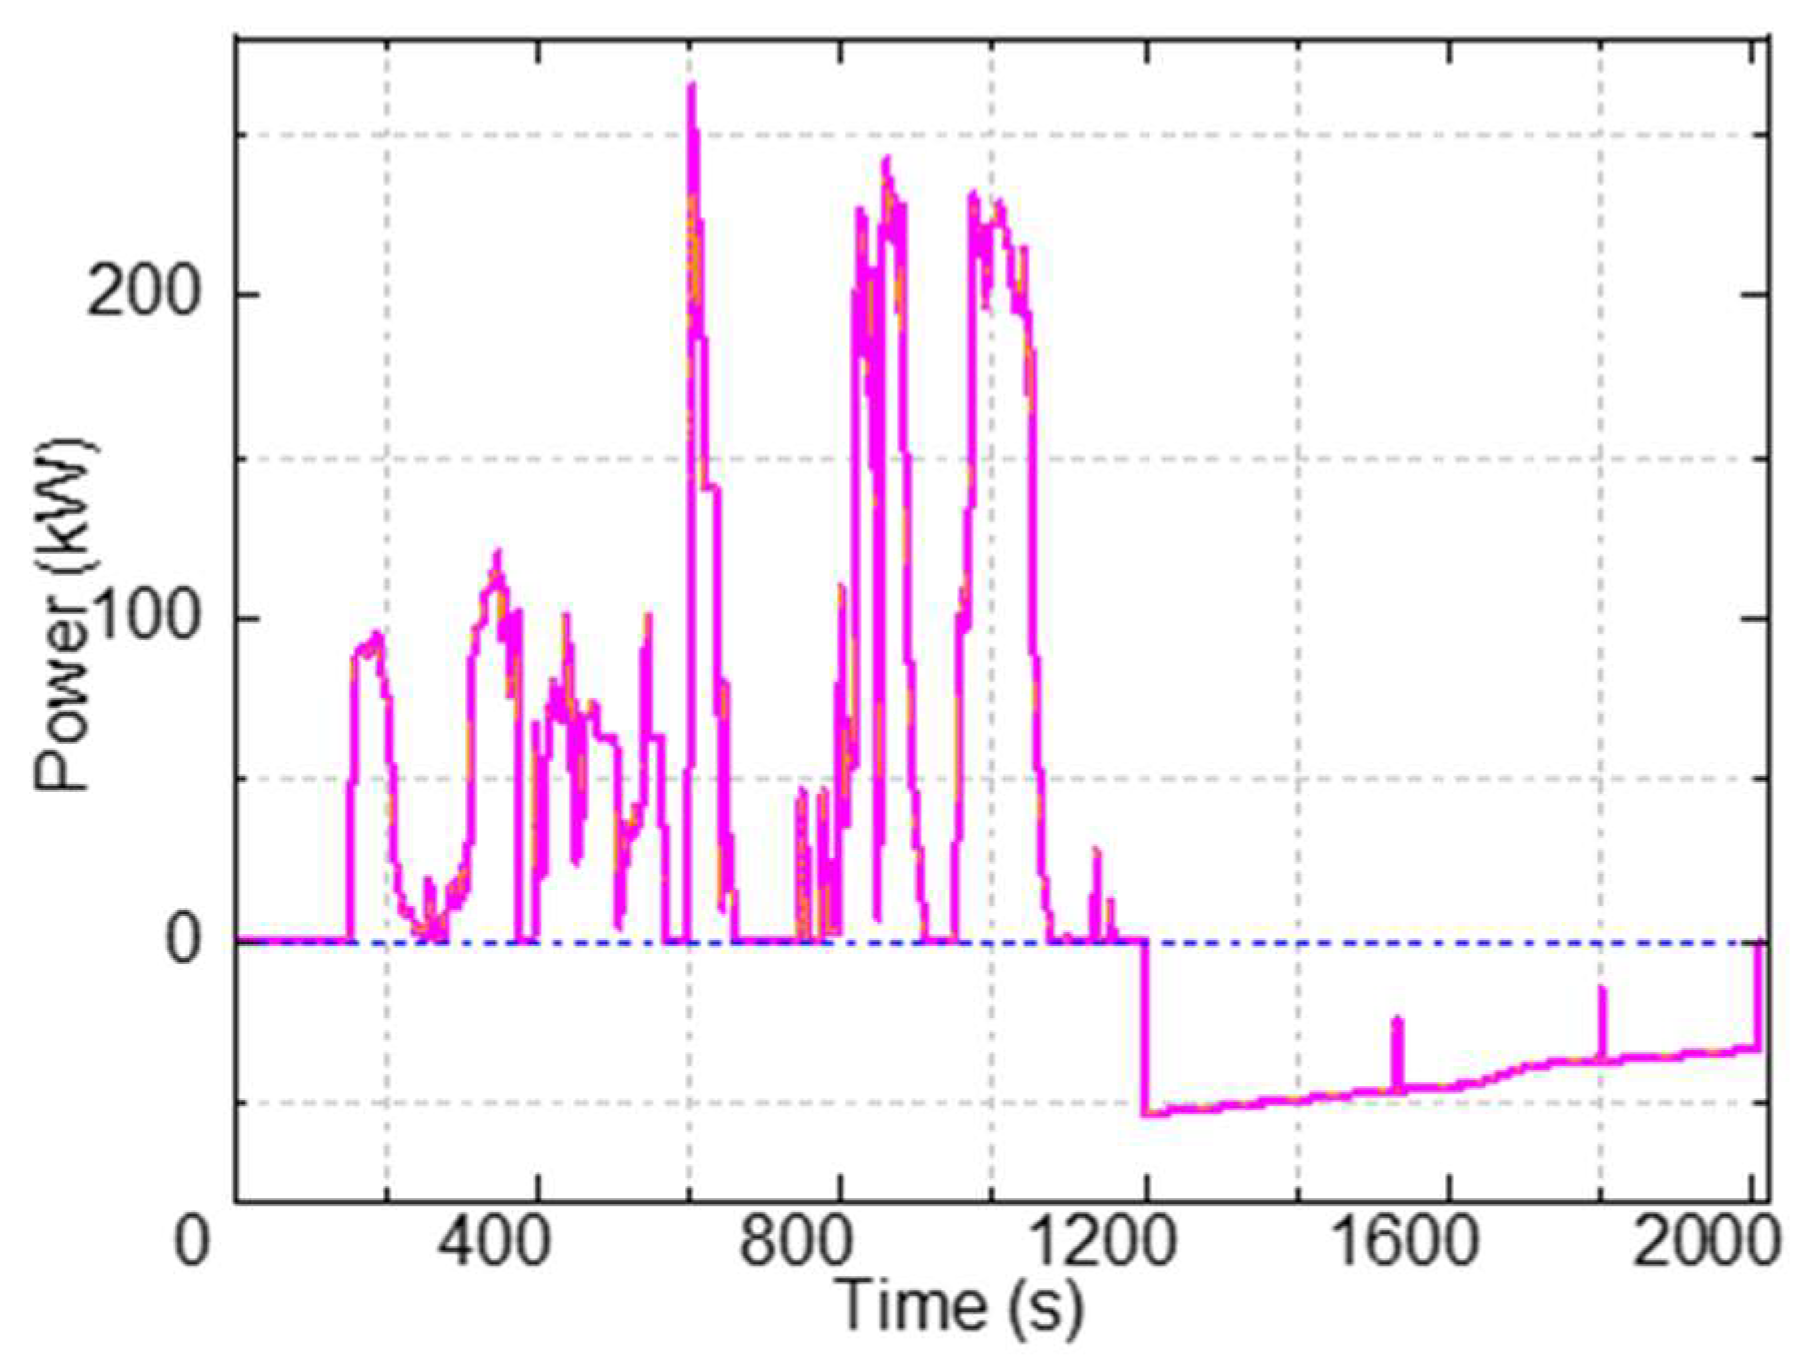
3.4. Power and Energy Performance Analysis

Figure 14 illustrates the power result of a hydraulic pump/motor during the charging and discharging process. The positive result suggests that the pump/motor is employed as a hydraulic pump, driven by the input braking power. In addition, the negative result suggests that the pump/motor is employed as a hydraulic motor, driven by the pressured hydraulic fluid to output energy. The input power was the same as the braking power in Figure 5, and the output power was approximately 45 kW on average. Moreover, the power fluctuated slightly during the switching process of the control valve, the limit position of the accumulator piston. The average out power was based on the full recovering of the braking energy, whereas it cannot be recovered fully. In accordance with [26], 65% is the optimal recovery value. If the braking energy is recovered at this rate, the average out power can then be 29.25 kW. The average power during the climbing condition was nearly 132.8 kW under the test condition, as presented in Figure 8. If this scheme is applied in this HMDT, approximately 22.03% driving power can be reduced.
Numerical integral of the charging and discharging power was conducted, and the obtained energy was nearly 65 MJ and −35 MJ, respectively. Equation (30) indicates that the cycle efficiency of the cycle hydro-pneumatic ESS was about 53.8% without considering the extra heat recovering the gas to the initial state. The calculation result showed that the extra heat was nearly 13.5 MJ, the actual cycle efficiency of the system was approximately 33.1%, and the corresponding energy density was 9.1 MJ/m3. During the above simulation the braking power was embedded as the total input of the ESS, while the maximum power of the ESS was not involved. The characteristics of the hydraulic pump, the power of input was determined by the system pressure and the maximum flow. The hydraulic fluid was adopted to drive the piston compressing the gas, the system pressure was obtained with the pressure of pressured gas in accordance with the results in Figure 7. Moreover, the maximum flow of the pump was calculated with the revolution velocity and displacement. The maximum displacement and typical revolution velocity at the maximum volume efficiency were defined as the maximum flow condition. Next, the maximum power of the ESS was obtained, as presented in Figure 15, where the maximum power at the start stage was approximately 230 kW, and it increased with the changing of pressure and the maximum power was nearly 720 kW. Furthermore, the maximum output power decreased with the pressure declination, and the minimum output power was 210 kW, thus meeting the need of the HMDT and reducing the maximum power of the primer mover.
The results in reference [20] suggest that the thermodynamics of the charging and discharging process is of great significance in the energy and power of the ESS. Subsequently, the simulation with different thermal exchange coefficients for the gas tank was conducted, and the resulting cycle efficiency is presented in Figure 16. The results in Figure 15 suggest that the greater the thermal exchange coefficient, the higher the efficiency will be. Moreover, the efficiency changed significantly between 100~500 J/m2/K/S, and changed slightly between 500~1000 J/m2/K/S. In addition, the maximum efficiency was approximately 40.6%. The corresponding energy density was about 16.7 MJ/m3 without considering the extra heat, and it was nearly 12.6 MJ/m3 considering the extra heat. Furthermore, the cycle efficiency was higher than the isothermal CAES 38% [18].

3.5. Discussion of Results

According to the pressure results in Section 3.2, including the displacement of accumulators and the pressure of hydraulics and gas, the dynamic characteristic of the system is consistent with theoretical analysis, which means that the displacement of accumulators expand and contract with different velocity according to the input and output power. The pressure of hydraulics and gas also rise and fall fluctuating during the compression and expansion operation.
Although we have studied the energy performance of different architecture of hydraulic-pneumatic ESS [13], the thermodynamics are not considered and the ideal isothermal compression and expansion process was set. While according to the previous research [14,20,21] and the results in Section 3.3 and Section 3.4, the thermodynamics of the system, especially the gas part, affect the system performance directly. Accuracy of the thermodynamic model is also the key to the validation of the system model. For the models in this paper, we have to set the coefficients of heat transfer between different mediums, which is the key to the thermodynamic model. Then we carried out a simulation of inflation with the models in this paper and Fluent for one accumulator, respectively, the same initial state and input parameters of gas and the environment temperature flow are set. We set the material of the accumulator as steel, the wall condition was set as wall-solid type in Fluent. The compared results for gas mass, pressure, and temperature are shown in Figure 17, where the mass and pressure of the gas coincide well in trend and value for the model in this paper and Fluent. The temperature during 3~24 s is slightly different, while the final value is the same. The difference is brought by the uneven temperature field in Fluent. Comparing the results of pressure and temperature of the gas chamber can reveal that the model in this paper can model the thermodynamics of gas related components.
The economic and carbon emission benefits can be explained by a numerical example. For the tested HMDT an MTU diesel engine, R1638K40-1814 is used, and we take 220 g/kWh as the specific fuel consumption value. In the presented test condition, the average power during uphill is about 132.8 kW and the time is about 0.23 h. Then we can calculate the total fuel consumption at about 7.9 kg, i.e., 9.3 L. If we use this cycle hydro-pneumatic ESS at 22.03% the driving power can be reduced, which means that the fuel consumption can be reduced 22.03%, i.e., 2.05 L. The resulting greenhouse gas emission can reduce 5.33 kg [27] in this test condition, and the longer the running time the greater the reduction. Although the hydraulic, pneumatic, and other accessory parts are introduced, the characteristics of a long lifecycle would weaken the carbon emission increase brought by the components of ESS. The reduced fuel consumption also brings great economic benefits.

4. Conclusions

This paper presents a cycle hydro-pneumatic energy storage system with long lifecycle for HMDT, and the dynamic model of the system which contained dynamic and thermodynamic models of hydraulic and pneumatic components. In order to analyze the performance of the ESS, a real test condition-based simulation was carried out, in which the system parameters were adjusted according to the condition of an HMDT with 110 t capacity. The simulation results reveal that a larger thermal exchange coefficient leads to better energy density and cycle efficiency performance. A larger thermal exchange coefficient would make the operation process closer to the ideal isothermal expansion and compression process, in which the maximum round trip efficiency could be obtained. The analysis of results shows that the energy density was approximately 12.6 MJ/m3, and the maximum input power was higher than 230 kW while the cycle efficiency was about 40.6%. The system can reduce 22.03% driving power at the optimal braking energy recovery rate, and corresponding economic benefits and carbon emission would be great.

Author Contributions

Conceptualization, L.G. and C.J.; methodology, L.G.; software, L.G.; validation, L.G., D.W. and T.Y.; formal analysis, L.G.; investigation, L.G. and D.W.; resources, L.G.; data curation, D.W.; writing—original draft preparation, L.G.; writing—review and editing, L.G. and D.W.; visualization, L.G. and T.Y.; supervision, L.G.; project administration, L.G.; funding acquisition, L.G. All authors have read and agreed to the published version of the manuscript.

Funding

This research was funded by the National Natural Science Foundation of China (grant number 52104159), the fellowship of China Postdoctoral Science Foundation (Grant No. 2021M690360), the National Key Research and Development Program of China (Grant No. 2016YFC0802900) for the financial support.

Institutional Review Board Statement

Not applicable.

Informed Consent Statement

Informed consent was obtained from all subjects involved in the study.

Data Availability Statement

Not applicable.

Conflicts of Interest

The authors declare no conflict of interest.

References

  1. Wasbari, F.; Bakar, R.A.; Gan, L.M.; Tahir, M.; Yusof, A. A review of compressed-air hybrid technology in vehicle system. Renew. Sustain. Energy Rev. 2017, 67, 935–953. [Google Scholar] [CrossRef]
  2. Yang, W.; Ruan, J.; Yang, J.; Zhang, N. Investigation of integrated uninterrupted dual input transmission and hybrid energy storage system for electric vehicles. Appl. Energy 2020, 262, 114446. [Google Scholar] [CrossRef]
  3. Siami-Irdemoosa, E.; Dindarloo, S.R. Prediction of fuel consumption of mining dump trucks: A neural networks approach. Appl. Energy 2015, 151, 77–84. [Google Scholar] [CrossRef]
  4. Feng, Y.; Dong, Z.; Yang, J.; Cheng, R. Performance modeling and cost-benefit analysis of hybrid electric mining trucks. In Proceedings of the 12th IEEE/ASME International Conference on Mechatronic and Embedded Systems and Applications (MESA), Auckland, New Zealand, 29–31 August 2016. [Google Scholar]
  5. Jin, C.; Yi, T.; Shen, Y.; Khajepour, A.; Meng, Q. Comparative study on the economy of hybrid mining trucks for open-pit mining. IET Intell. Transp. Syst. 2019, 13, 201–208. [Google Scholar] [CrossRef]
  6. Yang, W.; Liang, J.; Yang, J.; Zhang, N. Investigation of a Novel Coaxial Power-Split Hybrid Powertrain for Mining Trucks. Energies 2018, 11, 172. [Google Scholar] [CrossRef]
  7. Feng, Y.; Dong, Z. Integrated design and control optimization of fuel cell hybrid mining truck with minimized lifecycle cost. Appl. Energy 2020, 270, 115164. [Google Scholar] [CrossRef]
  8. Diba, F.; Esmailzadeh, E. Development of hybrid electric heavy-duty truck with self-propelled trailer. Int. J. Heavy Veh. Syst. 2018, 25, 203–222. [Google Scholar] [CrossRef]
  9. Lindgren, L.; Grauers, A.; Ranggård, J.; Mäki, R. Drive-Cycle Simulations of Battery-Electric Large Haul Trucks for Open-Pit Mining with Electric Roads. Energies 2022, 15, 4871. [Google Scholar] [CrossRef]
  10. Wang, Y.; Chen, J.; Liu, J.; Liu, K.; Zhang, Y.; Wu, J.; Zeng, H.; Guan, Z.-L. Research and implementation of key technology of braking energy recovery system for off-highway dump truck. In Proceedings of the Conference of the IEEE Industrial Electronics Society, Beijing, China, 29 October–1 November 2017. [Google Scholar]
  11. Liu, J.; Wang, Y.; Wu, Y.; Li, Y.; Wang, X. Research and implementation of new-type supercapacitor and battery hybrid energy storage system. J. Power Electron. 2020, 20, 1395–1404. [Google Scholar] [CrossRef]
  12. Herrera, V.; Milo, A.; Gaztañaga, H.; Etxeberria-Otadui, I.; Villarreal, I.; Camblong, H. Adaptive energy management strategy and optimal sizing applied on a battery-supercapacitor based tramway. Appl. Energy 2016, 169, 831–845. [Google Scholar] [CrossRef]
  13. Yi, T.; Ma, F.; Jin, C.; Huang, Y. A novel coupled hydro-pneumatic energy storage system for hybrid mining trucks. Energy 2018, 143, 704–718. [Google Scholar] [CrossRef]
  14. Fu, H.; Jiang, T.; Cui, Y.; Li, B. Adaptive Hydraulic Potential Energy Transfer Technology and Its Application to Compressed Air Energy Storage. Energies 2018, 11, 1845. [Google Scholar] [CrossRef]
  15. Li, P.Y.; Van de Ven, J.D.; Sancken, C. Open Accumulator Concept for Compact Fluid Power Energy Storage. In Proceedings of the ASME 2007 International Mechanical Engineering Congress and Exposition, Seattle, WA, USA, 11–15 November 2007. [Google Scholar]
  16. Mohsen, S.; Farzad, S.; Perry, L. Modeling and control of an open accumulator Compressed Air Energy Storage (CAES) system for wind turbines. Appl. Energy 2015, 137, 603–616. [Google Scholar]
  17. Kim, Y.M.; Shin, D.G.; Favrat, D. Operating characteristics of constant-pressure compressed air energy storage (CAES) system combined with pumped hydro storage based on energy and exergy analysis. Energy 2011, 36, 6220–6233. [Google Scholar] [CrossRef]
  18. Puddu, P.; Paderi, M. Hydro-pneumatic accumulators for vehicles kinetic energy storage: Influence of the gas compressibility and thermal losses on storage capability. Energy 2013, 57, 326–335. [Google Scholar] [CrossRef]
  19. Juhala, J.; Kajaste, J.; Pietola, M. Experimental Analysis of Heat Losses in Different Types of Hydraulic Accumulators. In Proceedings of the 8th FPNI Ph.D Symposium on Fluid Power, Lappeenranta, Finland, 11 June 2014. [Google Scholar]
  20. Budt, M.; Wolf, D.; Span, R.; Yan, J. A review on compressed air energy storage: Basic principles, past milestones and recent developments. Appl. Energy 2016, 170, 250–268. [Google Scholar] [CrossRef]
  21. Huang, S.; Khajepour, A. A new adiabatic compressed air energy storage system based on a novel compression strategy. Energy 2022, 242, 122883. [Google Scholar] [CrossRef]
  22. Guo, C.; Xu, Y.; Zhang, X.; Guo, H.; Zhou, X.; Liu, C.; Qin, W.; Li, W.; Dou, B.; Chen, H. Performance analysis of compressed air energy storage systems considering dynamic characteristics of compressed air storage. Energy 2017, 135, 876–888. [Google Scholar] [CrossRef]
  23. Odukomaiya, A.; Abu-Heiba, A.; Graham, S.; Momen, A.M. Experimental and analytical evaluation of a hydro-pneumatic compressed-air Ground-Level Integrated Diverse Energy Storage (GLIDES) system. Appl. Energy 2018, 221, 75–85. [Google Scholar] [CrossRef]
  24. Yi, T.; Jin, C.; Gao, L.; Hong, J.; Liu, Y. Nested Optimization of Oil-Circulating Hydro-Pneumatic Energy Storage System for Hybrid Mining Trucks. Machines 2022, 10, 22. [Google Scholar] [CrossRef]
  25. Pourmovahed, A.; Beachley, N.H.; Fronczak, F.J. Modeling of a Hydraulic Energy Regeneration System: Part II—Experimental Program. J. Dyn. Syst. Meas. Control 1992, 114, 160–165. [Google Scholar] [CrossRef]
  26. Han, T.; Zeng, B.; Tong, Y. Theoretical study on energy recovery rate of regenerative braking for hybrid mining trucks with different parameters. J. Energy Storage 2021, 42, 103127. [Google Scholar] [CrossRef]
  27. GB 19578-2021; Fuel Consumption Limits for Passenger Cars. Ministry of Industry and Information Technology of the People’s Republic of China: Beijing, China, 2021.
Figure 1. Typical electric-drive HMDT.
Energies 15 06672 g001
Figure 2. Structure of cycle hydro-pneumatic ESS.
Energies 15 06672 g002
Figure 3. Thermodynamic process of the piston accumulator.
Energies 15 06672 g003
Figure 4. Typical real condition of the HMDTS. (a) real velocity in typical condition; (b) load mass in typical condition; (c) slope in typical condition.
Energies 15 06672 g004
Figure 5. Power in real test conditions. (a) driving power in uphill; (b) braking power in downhill.
Energies 15 06672 g005
Figure 6. Piston displacement of accumulators.
Energies 15 06672 g006
Figure 7. Pressure of hydraulic oil and gas.
Energies 15 06672 g007
Figure 8. Gas pressure of different accumulators.
Energies 15 06672 g008
Figure 9. Temperature of hydraulic oil and gas.
Energies 15 06672 g009
Figure 10. Temperature of different gas chambers.
Energies 15 06672 g010
Figure 11. Temperature of different nodes in C1.
Energies 15 06672 g011
Figure 12. Temperature of different nodes in C2.
Energies 15 06672 g012
Figure 13. Temperature of different nodes in C3.
Energies 15 06672 g013
Figure 14. Input and output power of the hydraulic pump/motor.
Energies 15 06672 g014
Figure 15. Maximum power of the system.
Energies 15 06672 g015
Figure 16. Cycle efficiency under different conditions.
Energies 15 06672 g016
Figure 17. Comparing results of model in this paper and Fluent. (a) Mass of gas; (b) Pressure of gas; (c) Temperature of gas.
Energies 15 06672 g017
Publisher’s Note: MDPI stays neutral with regard to jurisdictional claims in published maps and institutional affiliations.

