Abstract
Bike-sharing systems implemented in cities with good bike lane networks could potentiate a modal shift from short car trips, boosting sustainable mobility. Both passenger and last-mile goods transportation can benefit from such systems and, in fact, bike sharing (dockless or with docking stations) is increasing worldwide, especially in Europe. This research focused on a European city, Lisbon, and the e-bike sharing system GIRA, in its early deployment, in 2018, where it had about 409 bikes of which 30% were non-electric conventional bikes and 70% were e-bikes. The research aims at answering the main research questions: (1) What is the number of trips per day and travel time in conventional bikes and e-bikes?; (2) Do the daily usage peaks follow the trends of other modes of transport in terms of rush hours?; (3) Are there seasonality patterns in its use (weekdays and weekends, workdays and holiday periods)?; (4) How do climate conditions affect its use?; and finally, (5) What would be the impact on final energy consumption and GHG emissions? The dataset for 2018 regarding GIRA trips (distance, time, conventional or e-bike, docking station origin and destination) and weather (temperature, wind speed, relative humidity, precipitation) was available from Lisbon City Hall by means of the program “Lisboa aberta”. Data regarding the profile of the users (which trips GIRA replaces?) and data regarding electricity consumption were not available. The latter was estimated by means of literature e-bike data and electric motor specifications combined with powertrain efficiency. Greenhouse gas (GHG) emissions were estimated by using the latest Intergovernmental Panel on Climate Change (IPCC) CO2 equivalents and a spreadsheet simulator for the Portuguese electricity GHG intensity, which was adaptable to other countries/locations. In a private car fleet dominated by fossil fuels and internal combustion engines, the e-bike sharing system is potentially avoiding 36 Ton GHG/year and reducing the energy consumption by 451 GJ/year. If the modal shift occurs from walking or urban bus to an e-bike sharing system, the impact will be detrimental for the environment.
1. Introduction
The Sustainable Development Goal 11 (SDG11), Sustainable communities and Cities, advocates to “Make cities inclusive, safe, resilient and sustainable” and includes transportation in the target 11.2: Affordable and sustainable transport systems increasing the public transportation use in a safe, affordable and accessible manner. Bike-sharing systems equipped with dockings stations or free-floating public bicycles are regarded as a tool to move people away from private cars. According to the Meddin Bike-sharing World Map, there are about 1880 bike-sharing systems worldwide [1]. The higher number of bike sharing systems per capita is in Europe; for example, Croatia has 3.7 systems per 1 million inhabitants, while Switzerland has 3.3, Ireland has 1.8, Italy has 1.7, Poland has 1.7, Portugal has 1.4, Brazil has 0.13, the United States of America has 0.52, Japan has 0.26, India has 0.02, and China has 0.48 [1]. In the last 2017–2019 triennium, on average, there were 280 new system launches per year. The percentage of e-bikes has been increasing in the newest launched systems: for example, in 2019, the worldwide launched systems had 32% e-bikes [2].
In Portugal, Lisbon city, 6.5 inhabitants per km2, there is a system with docking stations: the GIRA system. The knowledge regarding bike-sharing systems is crucial to better attribute sustainable mobility indicators in cities [3] and to guarantee its successful implementation. Most studies do not focus on energy consumption and emissions. In Poland [4], Warsaw, 3.5 inhabitants per km2, the Warsaw Bike-Sharing System (Veturilo) has been operating since 2012, which started with 1000 bikes and 100 stations. In 2019, it grew to 377 stations and 5337 bikes and now includes e-bikes. The registration is €2.35, and the first 20 min are free of charge. This study focused on usage satisfaction, and it is interesting to note that respondents who indicated that they have a bike or e-bike in their households more often used the bike-sharing system. The data presented indicated that from year to year, the number of bike-sharing system users increases. These users are mainly young people in the group of age 19–45, using standard bikes, most often in the afternoon (from 3:00 p.m. to 9:00 p.m.) and mostly on working days, in the months from April to September.
In Ireland, Cork Bikes opened in December 2014 with 31 stations and 330 bikes across Cork city, 3.3 inhabitants per km2, the second largest city. The data [5] are from 2015 and represent the first full year of operation of the Cork Bikes Scheme, featuring 100% conventional bikes. The annual pass is €10 with the first 30 min free of charge. The majority of the trips are short trips with over 70% of trips with a travel time less than 9 min and less than 1.8 km. Rainfall affects the number of trips; 70% of the yearly trips occurs with rainfall below 2.7 mm. Rush hours of bike use are typically 7:00–10:00 a.m., 1:00–2:00 p.m., and 5:00–8:00 p.m.
In China [6], Wenzhou, 2.9 inhabitants per km2, the system started in 2012, and by the end of 2016, there were 21,218 bicycles and 721 rental stations in the system. The typical duration of the trips is below 20 min (75% of the trips). There is a strong negative correlation between daily bicycle usage and rainfall as well as working/nonworking day. Usage peaks are around 7 am, 1 pm and 5 pm.
Other research works strive to understand road users’ attitudes toward bike-sharing [7], dockless systems issues [8,9] and the bike-sharing systems’ key to success by avoiding negative perceptions and financial or operational failures [10]. Models for pre-dimensioning the system also exist [11].
To support positive aspects regarding bike-sharing systems and the knowledge of its potential positive impact on energy consumption and climate change-related emissions is deemed necessary. Some researchers realize this fact, and, searching in the advanced search query builder “Web of Science” with the query “bike-sharing AND emissions” OR “bike-sharing AND environment” in the title, all databases, retrieves only 41 studies since 2015. To mention a few: Li et al., 2021 [12] try to enhance estimation methods for dockless systems, Luo et al., 2020 [13] propose a rebalancing model to minimizing the GHG of dockless bike sharing system. To put this into perspective, the query “bike-sharing” in the title retrieved 964 results starting in 2011. So, there is a clear gap relating bike-sharing with environmental impacts.
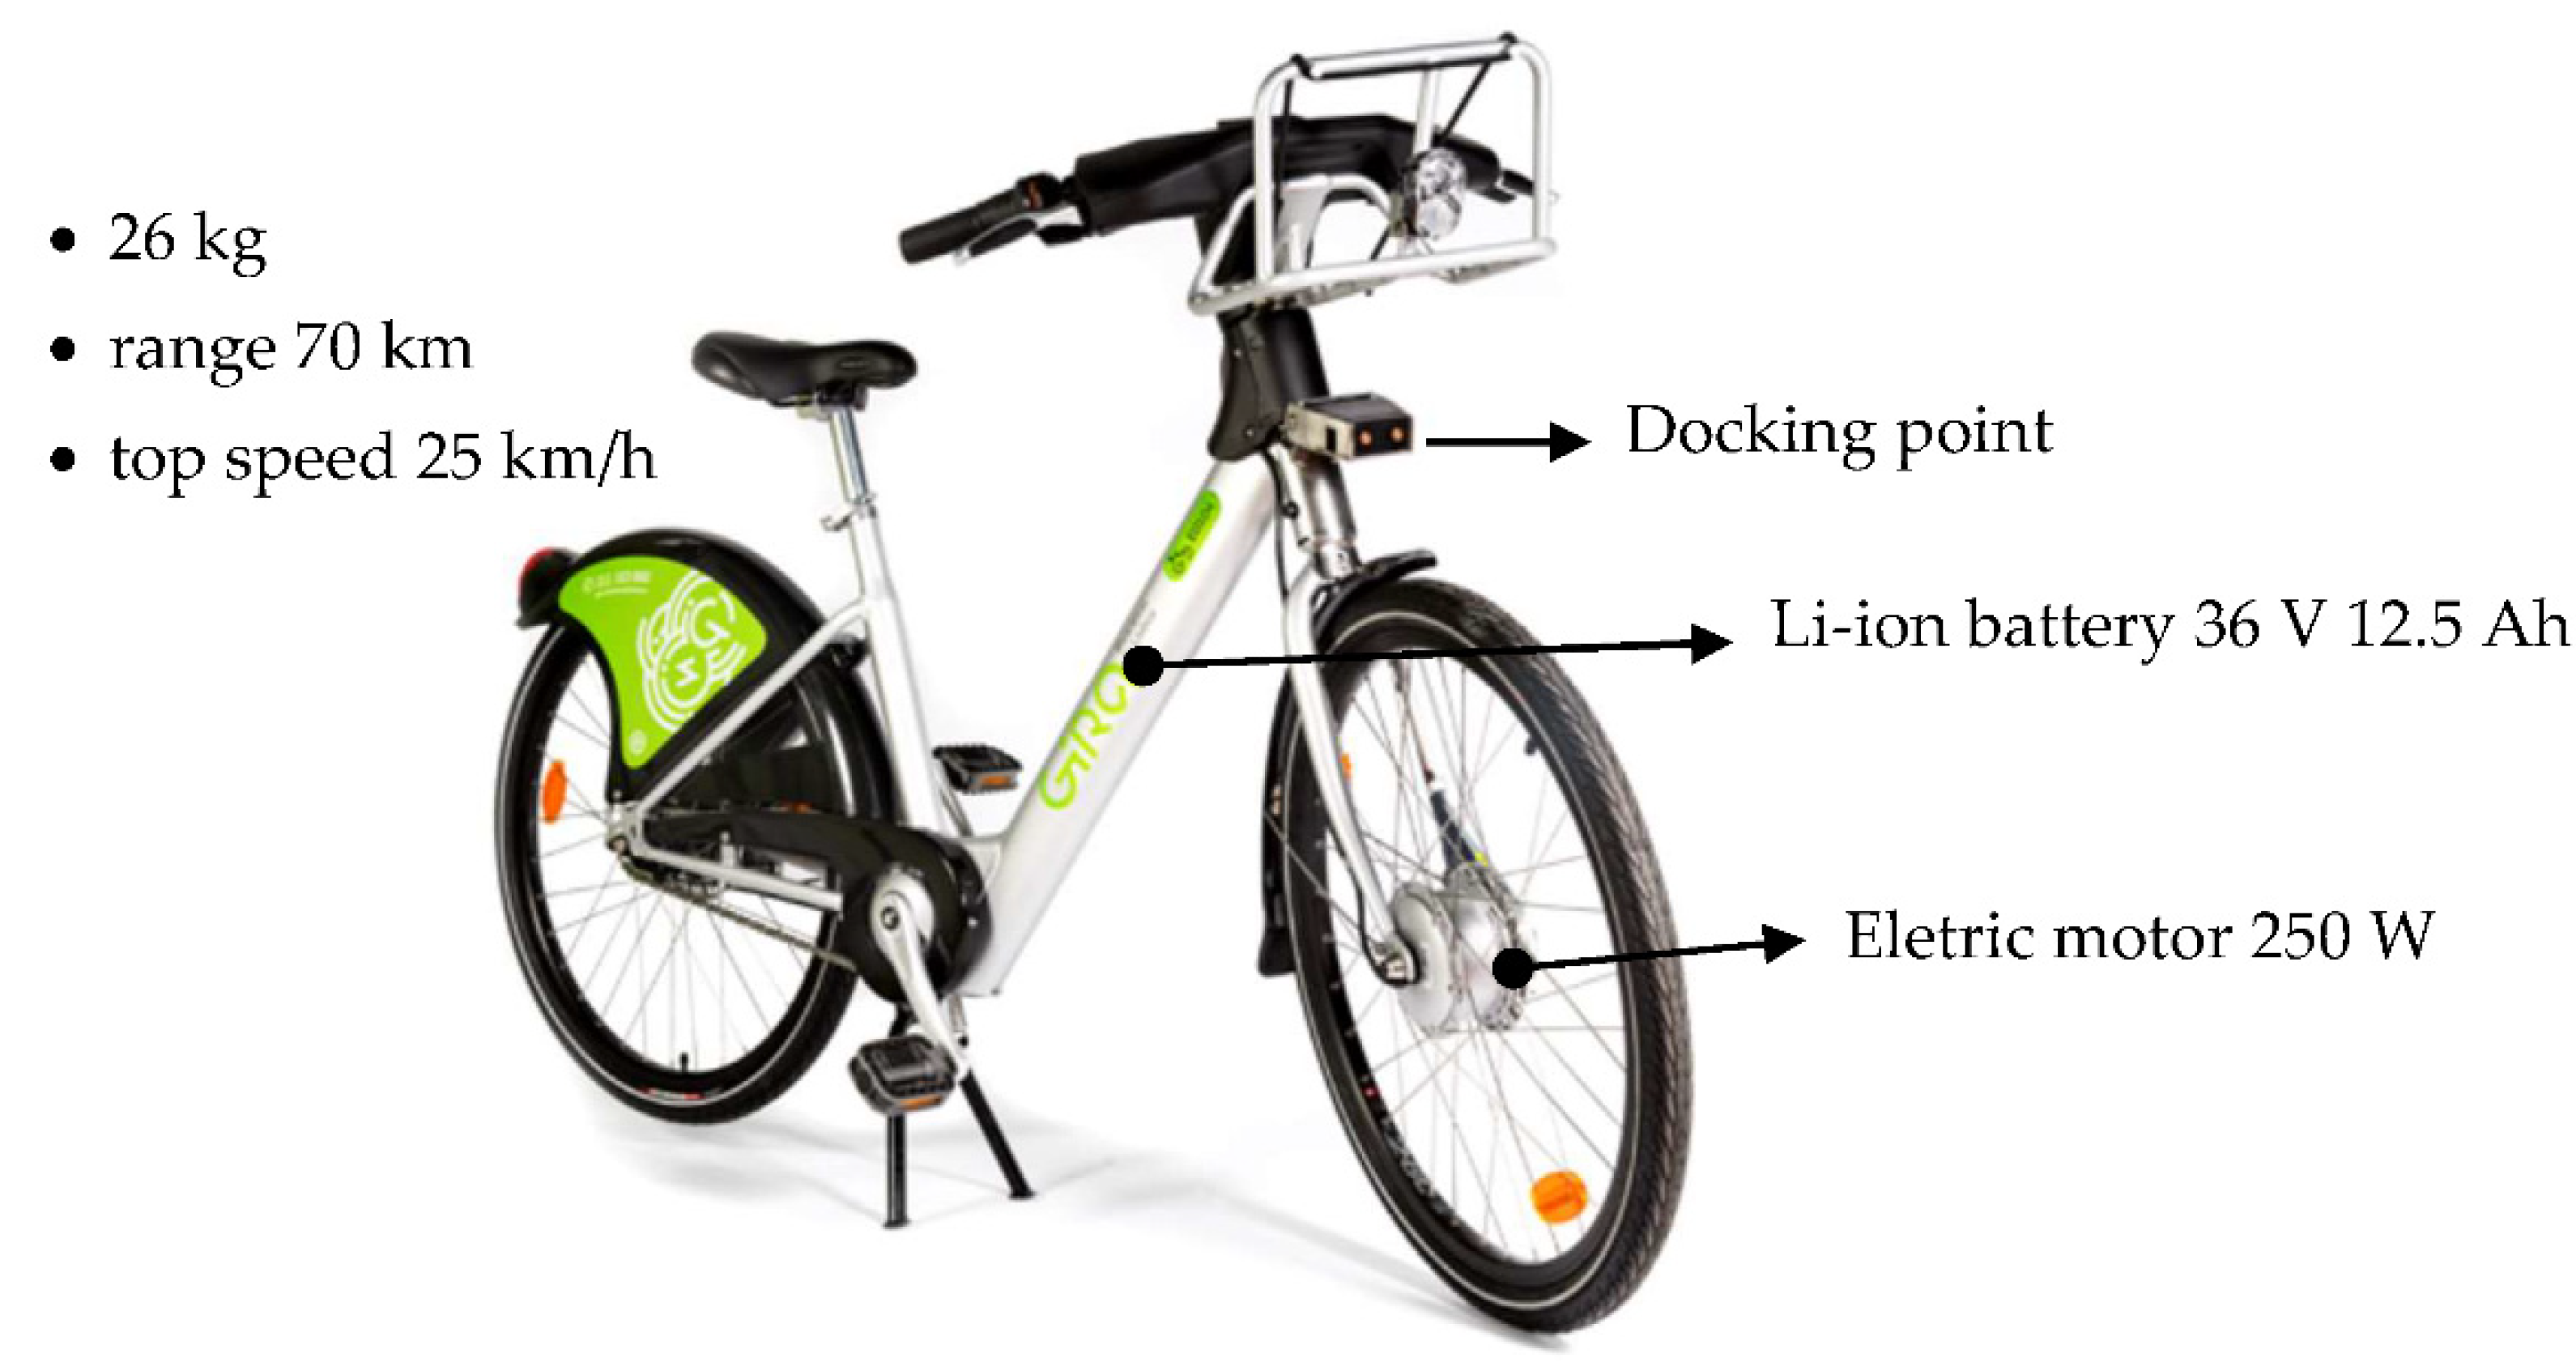
The GIRA system belongs to the Empresa Municipal de Mobilidade e Estacionamento de Lisboa (EMEL), and its trial started in September 2017. The goal was to make Lisbon city less polluted and more accessible to shared mobility, promoting the use of active modes over the private car. It is composed by conventional and electric bikes (26 kg, Li-ion batteries of 12.5 Ah 36 V, electric motor 250 W, see Figure 1).
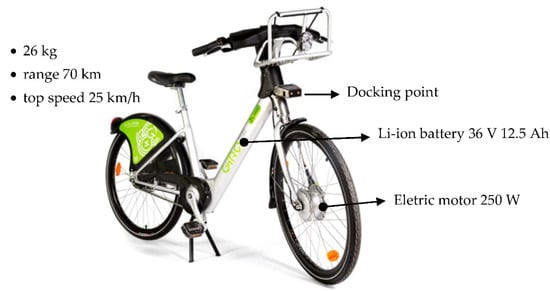
Figure 1.
GIRA e-bike technical specifications.
Safety issues regarding the system are not well documented. Nevertheless, in Lisbon city, in 2018, according to the National Road Security (Autoridade Nacional de Segurança Rodoviária [14]), there were 2813 accidents with injuries from which 3% occurred with bikes (not necessarily the GIRA bikes). Some news reported 136 incidents within the system, resulting in 44 injuries.
The yearly cost of using the GIRA system is only €25 for all the spatial coverage of the network, and for the first 45 min of riding, there is no fee.
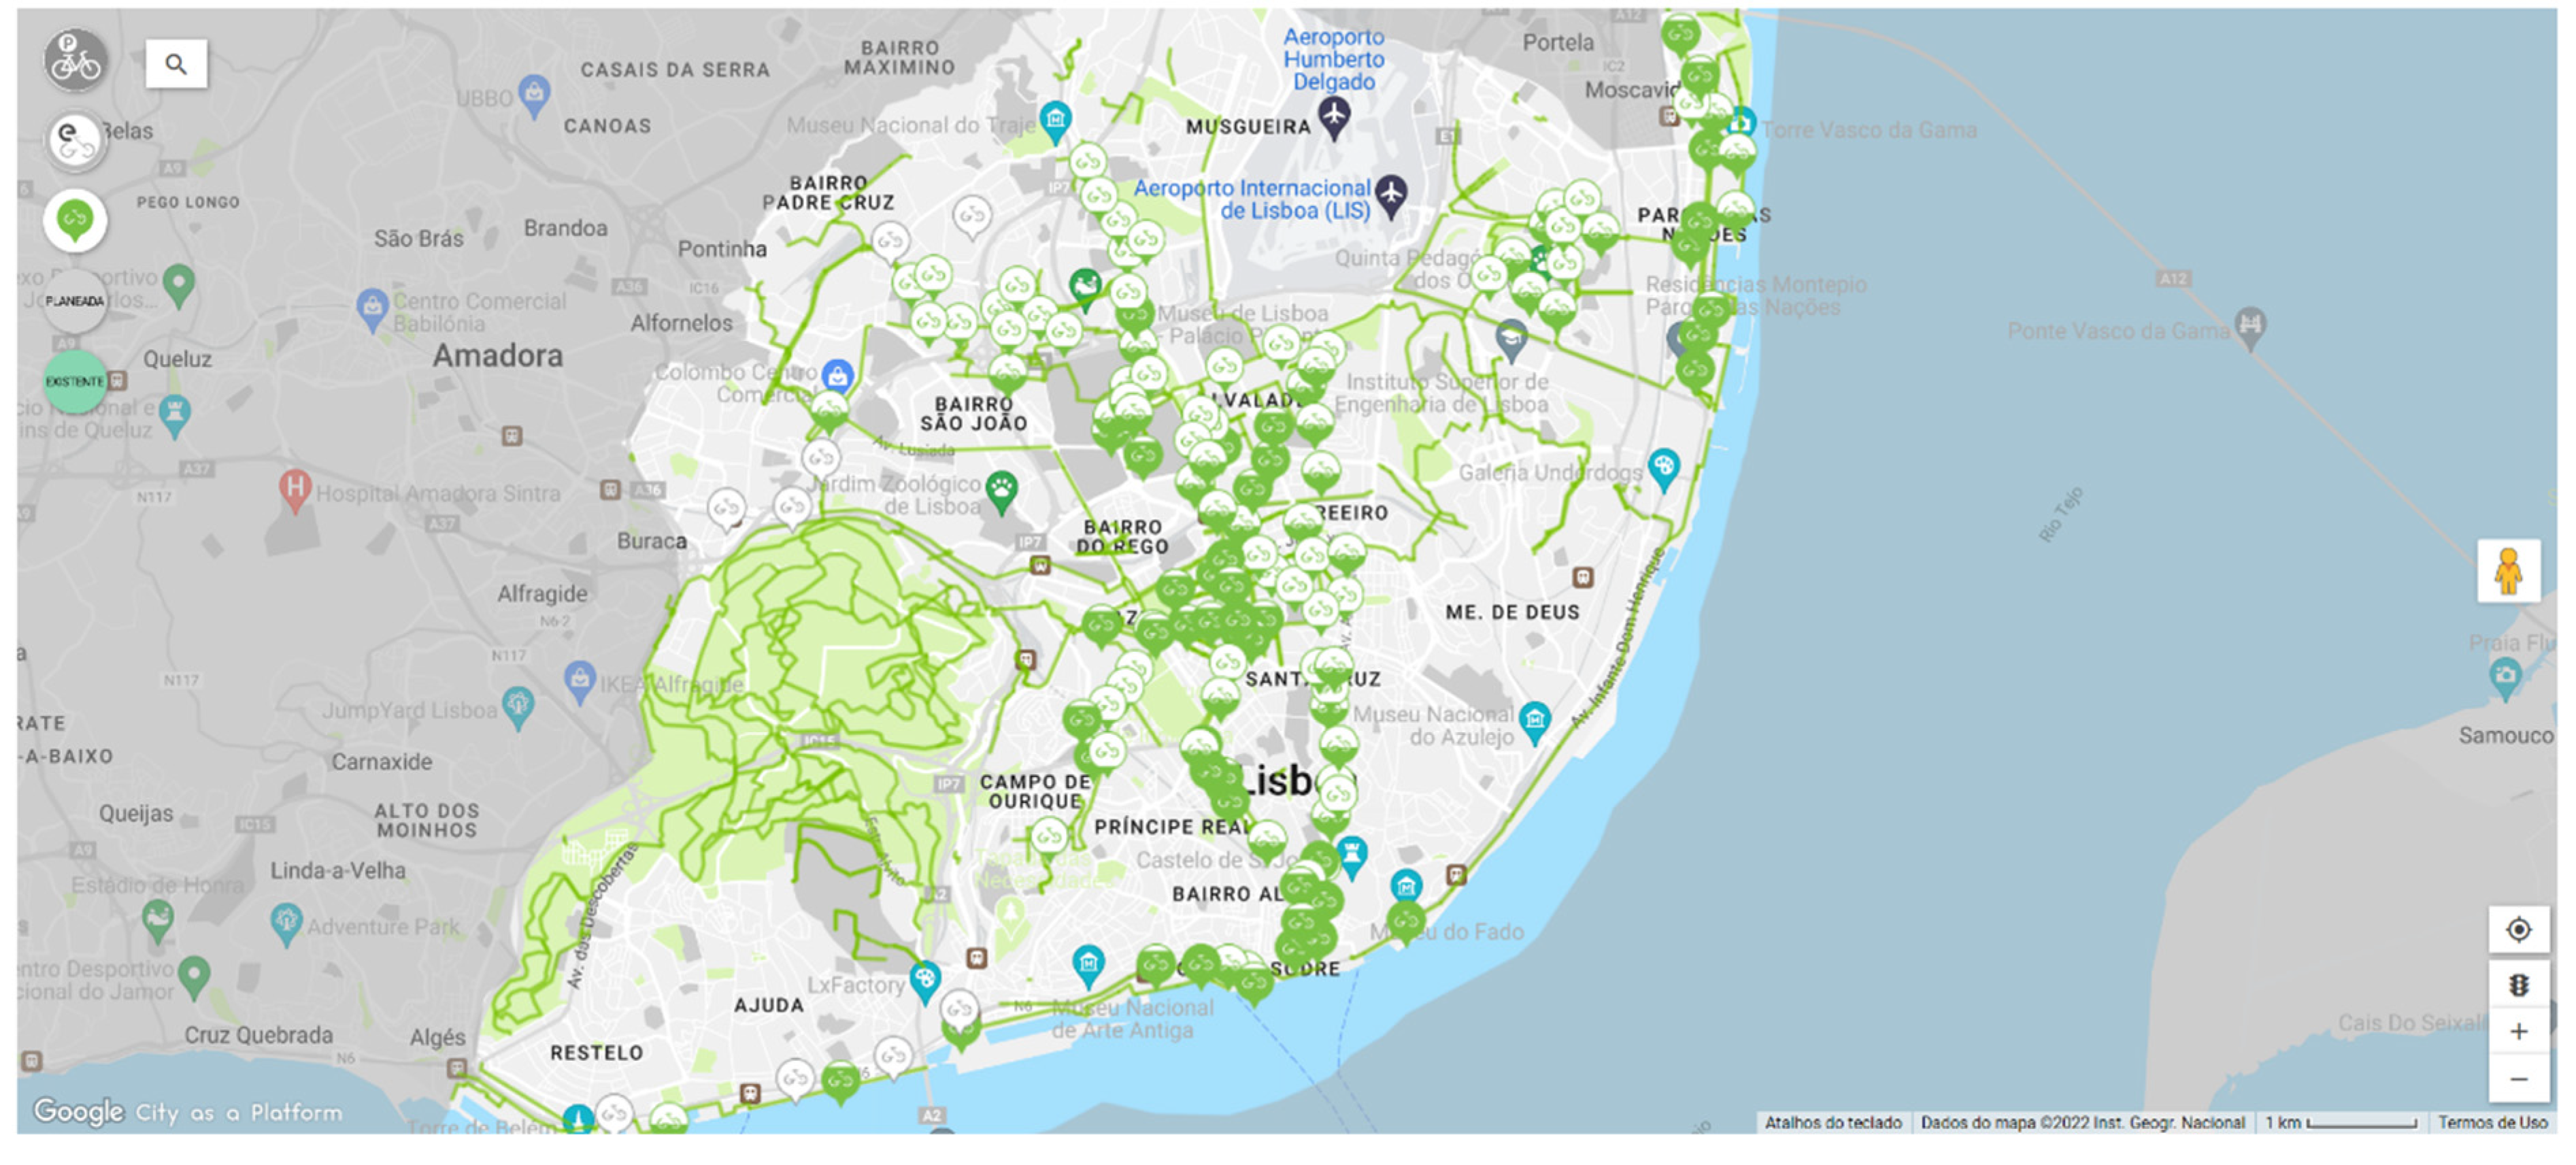
The system has evolved regarding the number of docking stations and total amount of bikes starting with 409 bikes and 700 docking stations (43 stations) in 2018, and it has currently 1173 bikes and 2373 docking stations (123 stations); see Figure 2.

Figure 2.
GIRA system spatial coverage. Bike lanes in green lines (circa 100 km).
To the best of the authors’ knowledge, this is the first time the Lisbon city bike-sharing system is analyzed in terms of trips characterization, energy and GHG emissions, and a spreadsheet model is proposed to calculate the GHG intensity of the national electricity generation mix to better know the uncertainty in the outcomes.
This research aims at answering the main research questions: (1) What is the number of trips per day and travel time in conventional bikes and e-bikes?; (2) How do climacteric conditions affect its use?; (3) Are there seasonality patters in its use (weekdays and weekends, workdays and holiday periods)?; (4) Do the daily usage peaks follow the trends of other modes of transport in terms of rush hours?; and finally, (5) What would be the impact in final energy consumption and GHG emissions?
The term “final energy consumption” refers to the International Energy Agency definition. Final energy consumption covers the energy supplied to the final consumer (end-user). GHG emissions refer to life cycle emissions excluding construction materials.
2. Materials and Methods
2.1. Dataset
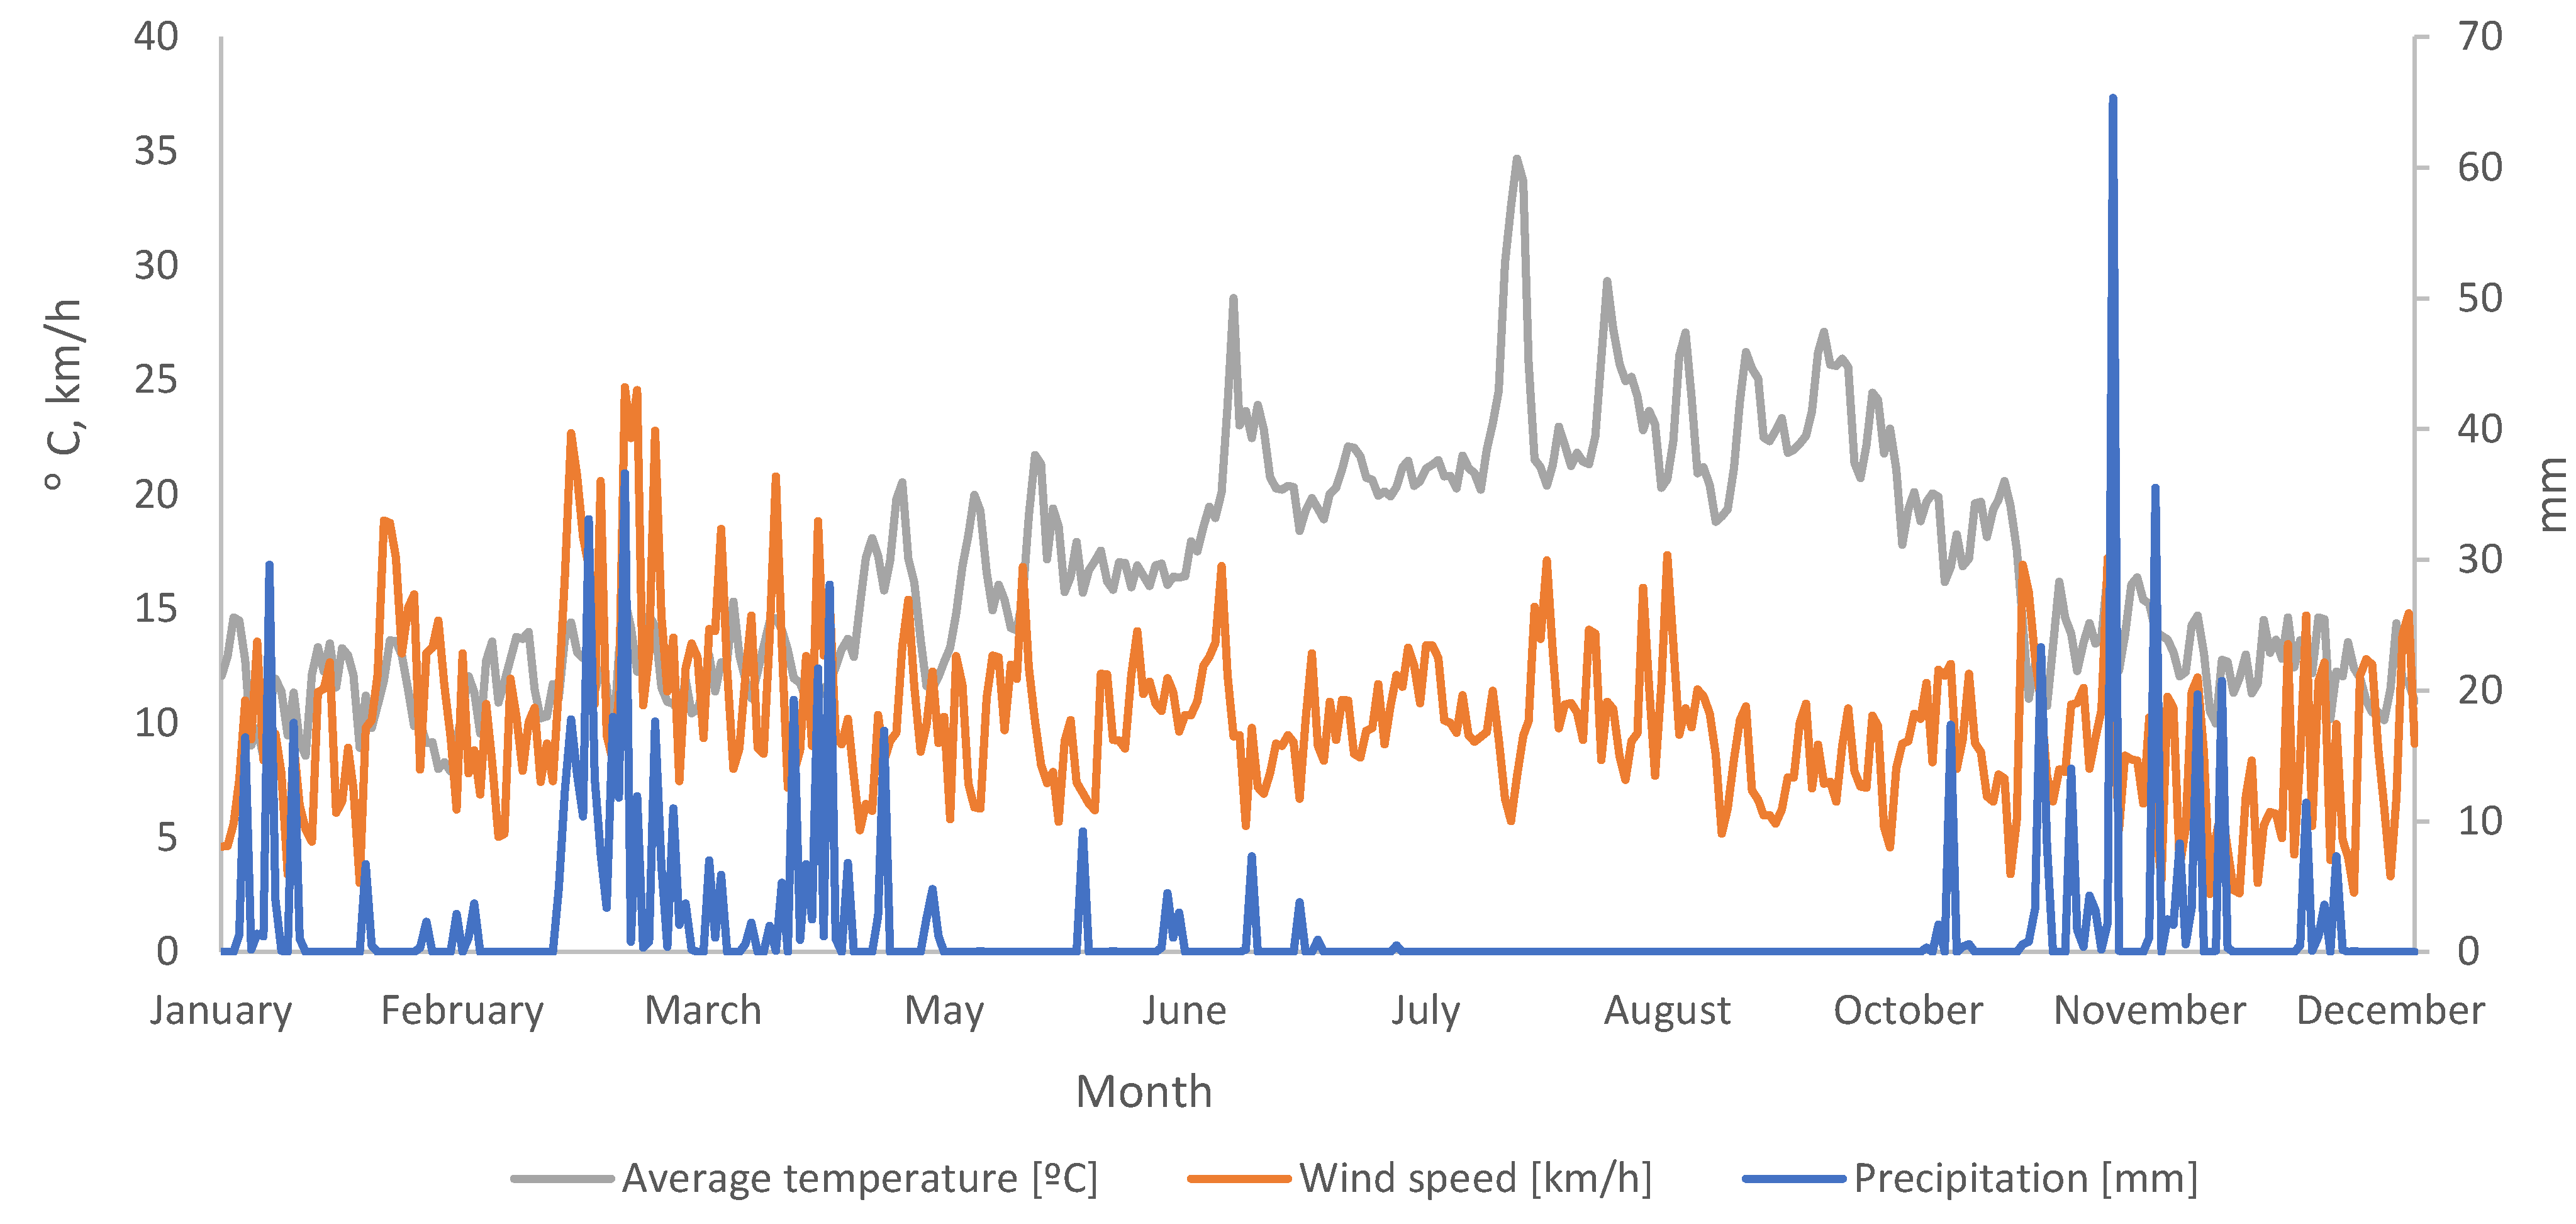
The dataset for the year 2018 for GIRA trips data was available from Lisbon City Hall by means of the program “Lisboa aberta” (Lisboaaberta.cm-lisboa.pt), which also provided data for Lisbon weather from IPMA-Instituto Português para o Mar e Atmosfera. Due to data restrictions, the authors can only show the outcomes but cannot provide the datasets. Climate in the year 2018 is displayed in Figure 3.
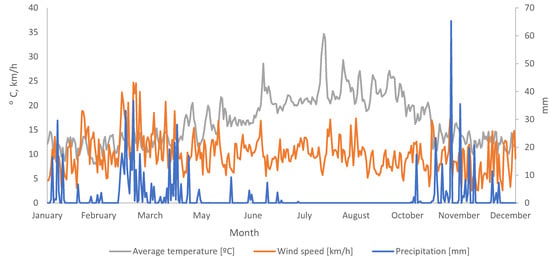
Figure 3.
Weather data for 2018. Data from IPMA provided by Lisbon city hall under the program “Lisboa aberta”).
The climate has the summer (June to September) higher temperatures peaking at 35 °C, and winter has lower temperatures in January and February with 9 °C minimums. Precipitation events occurred mostly in March with episodes with higher peaks in November. This month registered also the higher wind speeds, averaging 15 km/h.
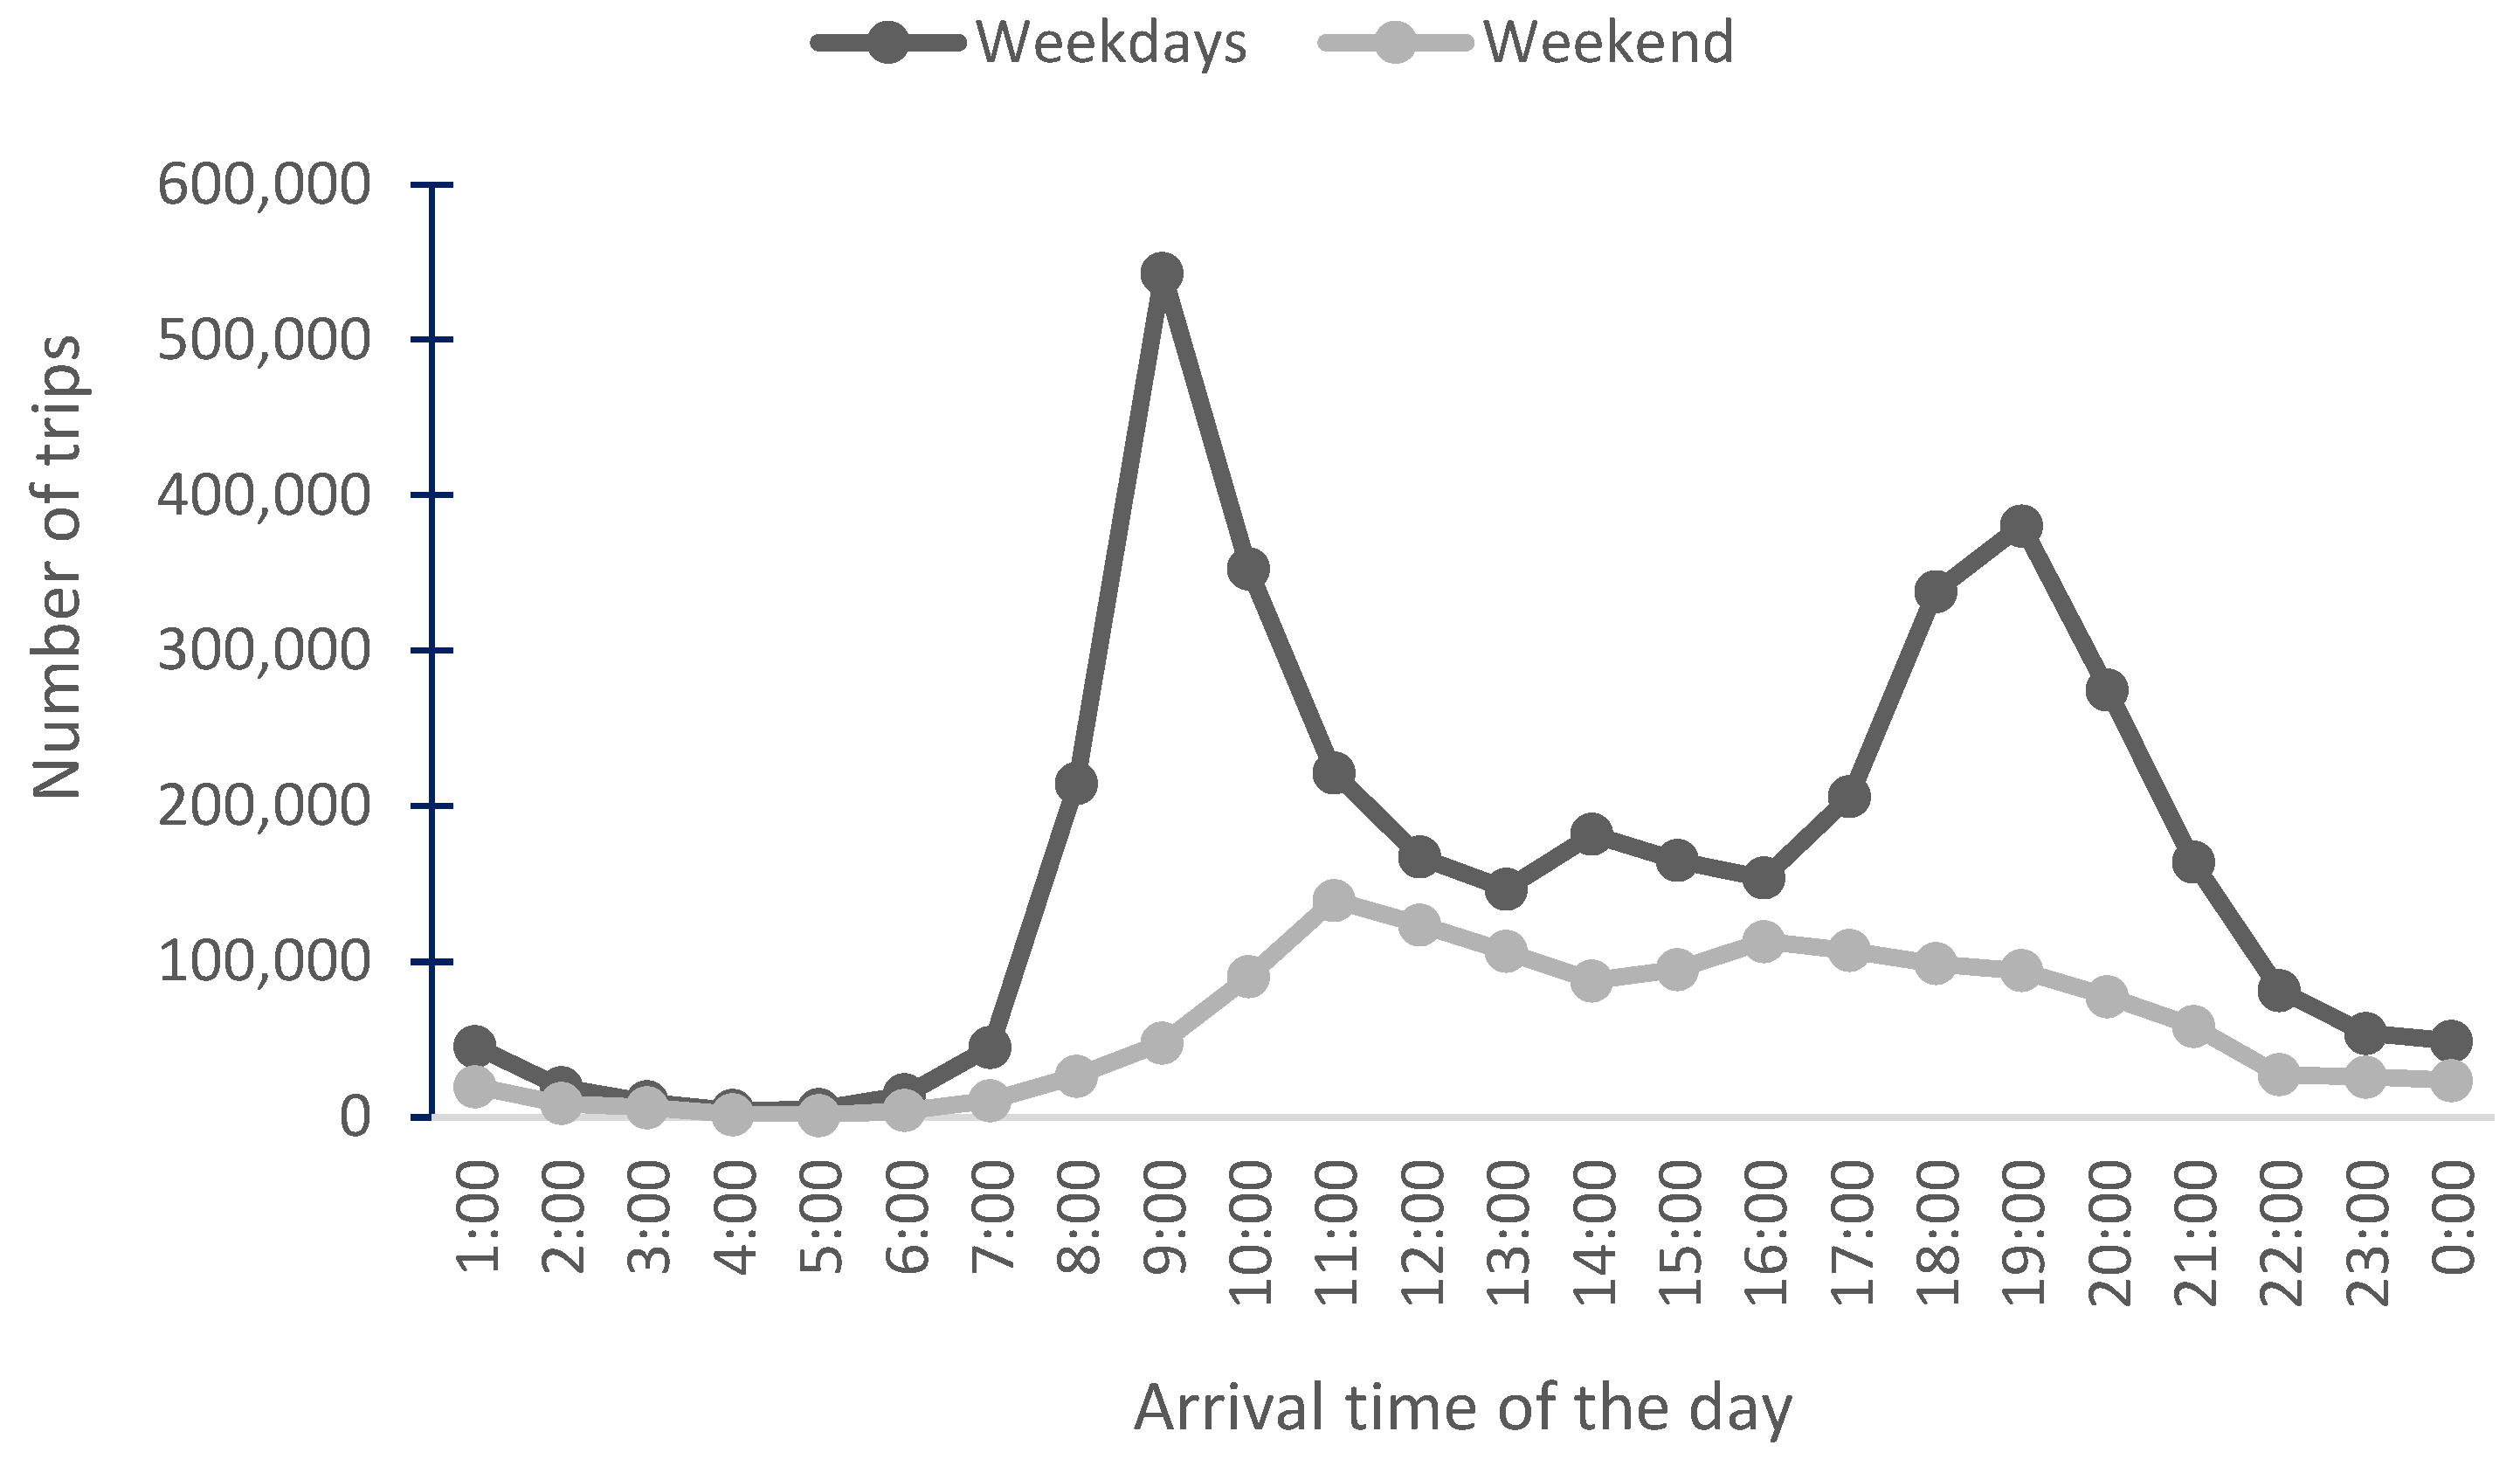
The data regarding rush hours from daily movements in Lisbon were retrieved from the Portuguese National Institute of statistics INE-Instituto Nacional de Estatistica [15] and are shown in Figure 4. These data are the outcome of the survey that is public accessible and was shared in the Supplementary Materials. The authors did not have access to the raw data so cannot add standard deviations.
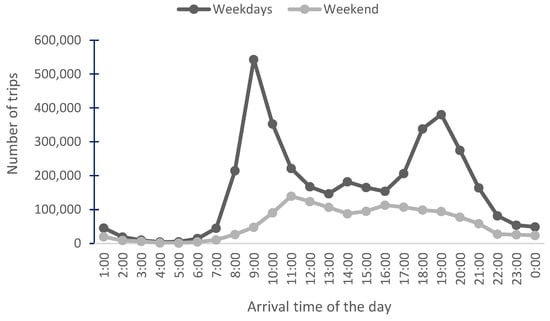
Figure 4.
Rush hours in daily movements (average number of trips) of people within Lisbon Metropolitan area as of 2017 [15].
According to the same report, 60% of the trips are made by car, which reduced to 50% in Lisbon city trips with a commuting time of 26 min (one-way) and 52 min daily (round trip). In 2018 (Table 1), the national passenger car fleet was composed of 6.6 million passenger cars and 1.6 million goods delivery cars (INE-Instituto Nacional de Estatistica, Statistics Portugal [16]), with circa 20% registered in Lisbon city (ASF—Autoridade de Supervisão de Seguros e Fundos de Pensões [17]). For passenger cars, the technology ICEV is dominant with a main fuel partition of 58% diesel and 42% gasoline.

Table 1.
Light-duty circulating fleet composition by technology/fuel in 2017–2018–2019. ICEV—Internal Combustion Engine Vehicle, BEV—Battery Electric Vehicle, PHEV—Plug-in Hybrid Electric Vehicle, HEV—Hybrid Electric Vehicle.
2.2. Final Energy Consumption
The electricity consumption to recharge the e-bikes was not available. An estimation based on the electric motor maximum power (250 W) and top speed (25 km/h) was made (250/25 = 10 Wh/km). This is the engine energy consumption. Accounting for the battery discharging efficiency, converter efficiency, and motor efficiency overall revealed 90% [18], 11 Wh/km.
Real data for e-bikes were reported in other studies, e.g., [19] 1 kWh per 100 km [20], 11.2 Wh/km [21], 1.42 kWh/100 Miles, being 10 Wh/km on average, which is the assumed value hereafter. Assuming the charging losses (3% [22]), 10 Wh/km are in fact 10.3 kWh/100 km or 37.1 MJ/100 km.
For comparison with the fossil system using gasoline/diesel liquid fuels in passenger cars, the conventional internal combustion engine is for gasoline E5 (5% ethanol blended in 95% gasoline, by volume) 173.3 MJ/100 km, and for diesel B7 (7% biodiesel blended in 93% diesel, by volume), it is 145.5 MJ/100 km [23]. According to the Portuguese circulating fleet composition in 2018 (42% gasoline, 58% diesel), the weighted average will be 1.57 MJ/km, and this is the value used hereafter.
2.3. GHG Emissions
Assuming low voltage losses (7% [23], consistent with DGEG (Direção Geral de Energia e Geologia) data regarding own electricity consumption in the electricity generation system (4% DGEG (Direção Geral de Energia e Geologia) data), the actual value retrieved from the electricity generation system from the e-bike will be 12.1 Wh/km. The greenhouse gas (GHG) emissions considered are CO2, CH4 and N2O. The Intergovernmental Panel on Climate Change (IPCC) sixth assessment report (AR6) CO2 equivalency factors used are in Table 2. The global warming potential (GWP) 100-years indicator is used to reflect the GHG harm.
Table 2.
IPCC AR6 CO2 equivalency factors [24].
The electricity production GHG emissions for the Portuguese electricity mix are derived from an in-house simulator developed in a spreadsheet and considering direct emissions only (no construction materials included, no extraction and transport of fossil resources included), using the direct CO2eq emissions by technology indicated in Table 3. Direct emissions correspond to the combustion of fossil fuels. The model was developed to better control the boundary of the calculation of the GHG emissions and to be able to update the values if the CO2eq values change (which has been a reality throughout the several IPCC reports, or if a 20-year time horizon is to be used instead of 100 years). The model works with the range of efficiencies found for each electricity generation technology, according to the IPCC [26], and, by default, it uses the IPCC AR6 CO2 equivalencies in a 100-year time horizon [24]. The min and max values of efficiency are combined with the minimum and maximum values of the CO2eq to give a range as output. This spreadsheet model also allows observing the difference between high voltage, medium voltage and low voltage according to distribution losses. The spreadsheet model is fully available in the Supplementary Materials. The electricity mix of generating technologies is by default the historical 2010–2021 Portuguese data (see Figure 5).
Table 3.
IPCC AR6 CO2eq for each technology [24,26].
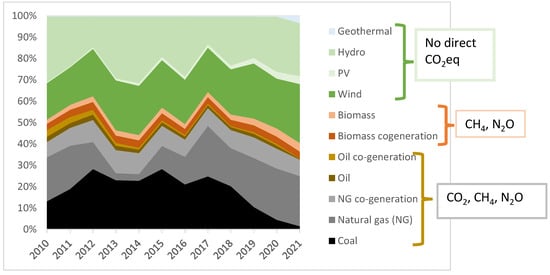
Figure 5.
Portuguese electricity mix throughout the years, according to the Portuguese production.
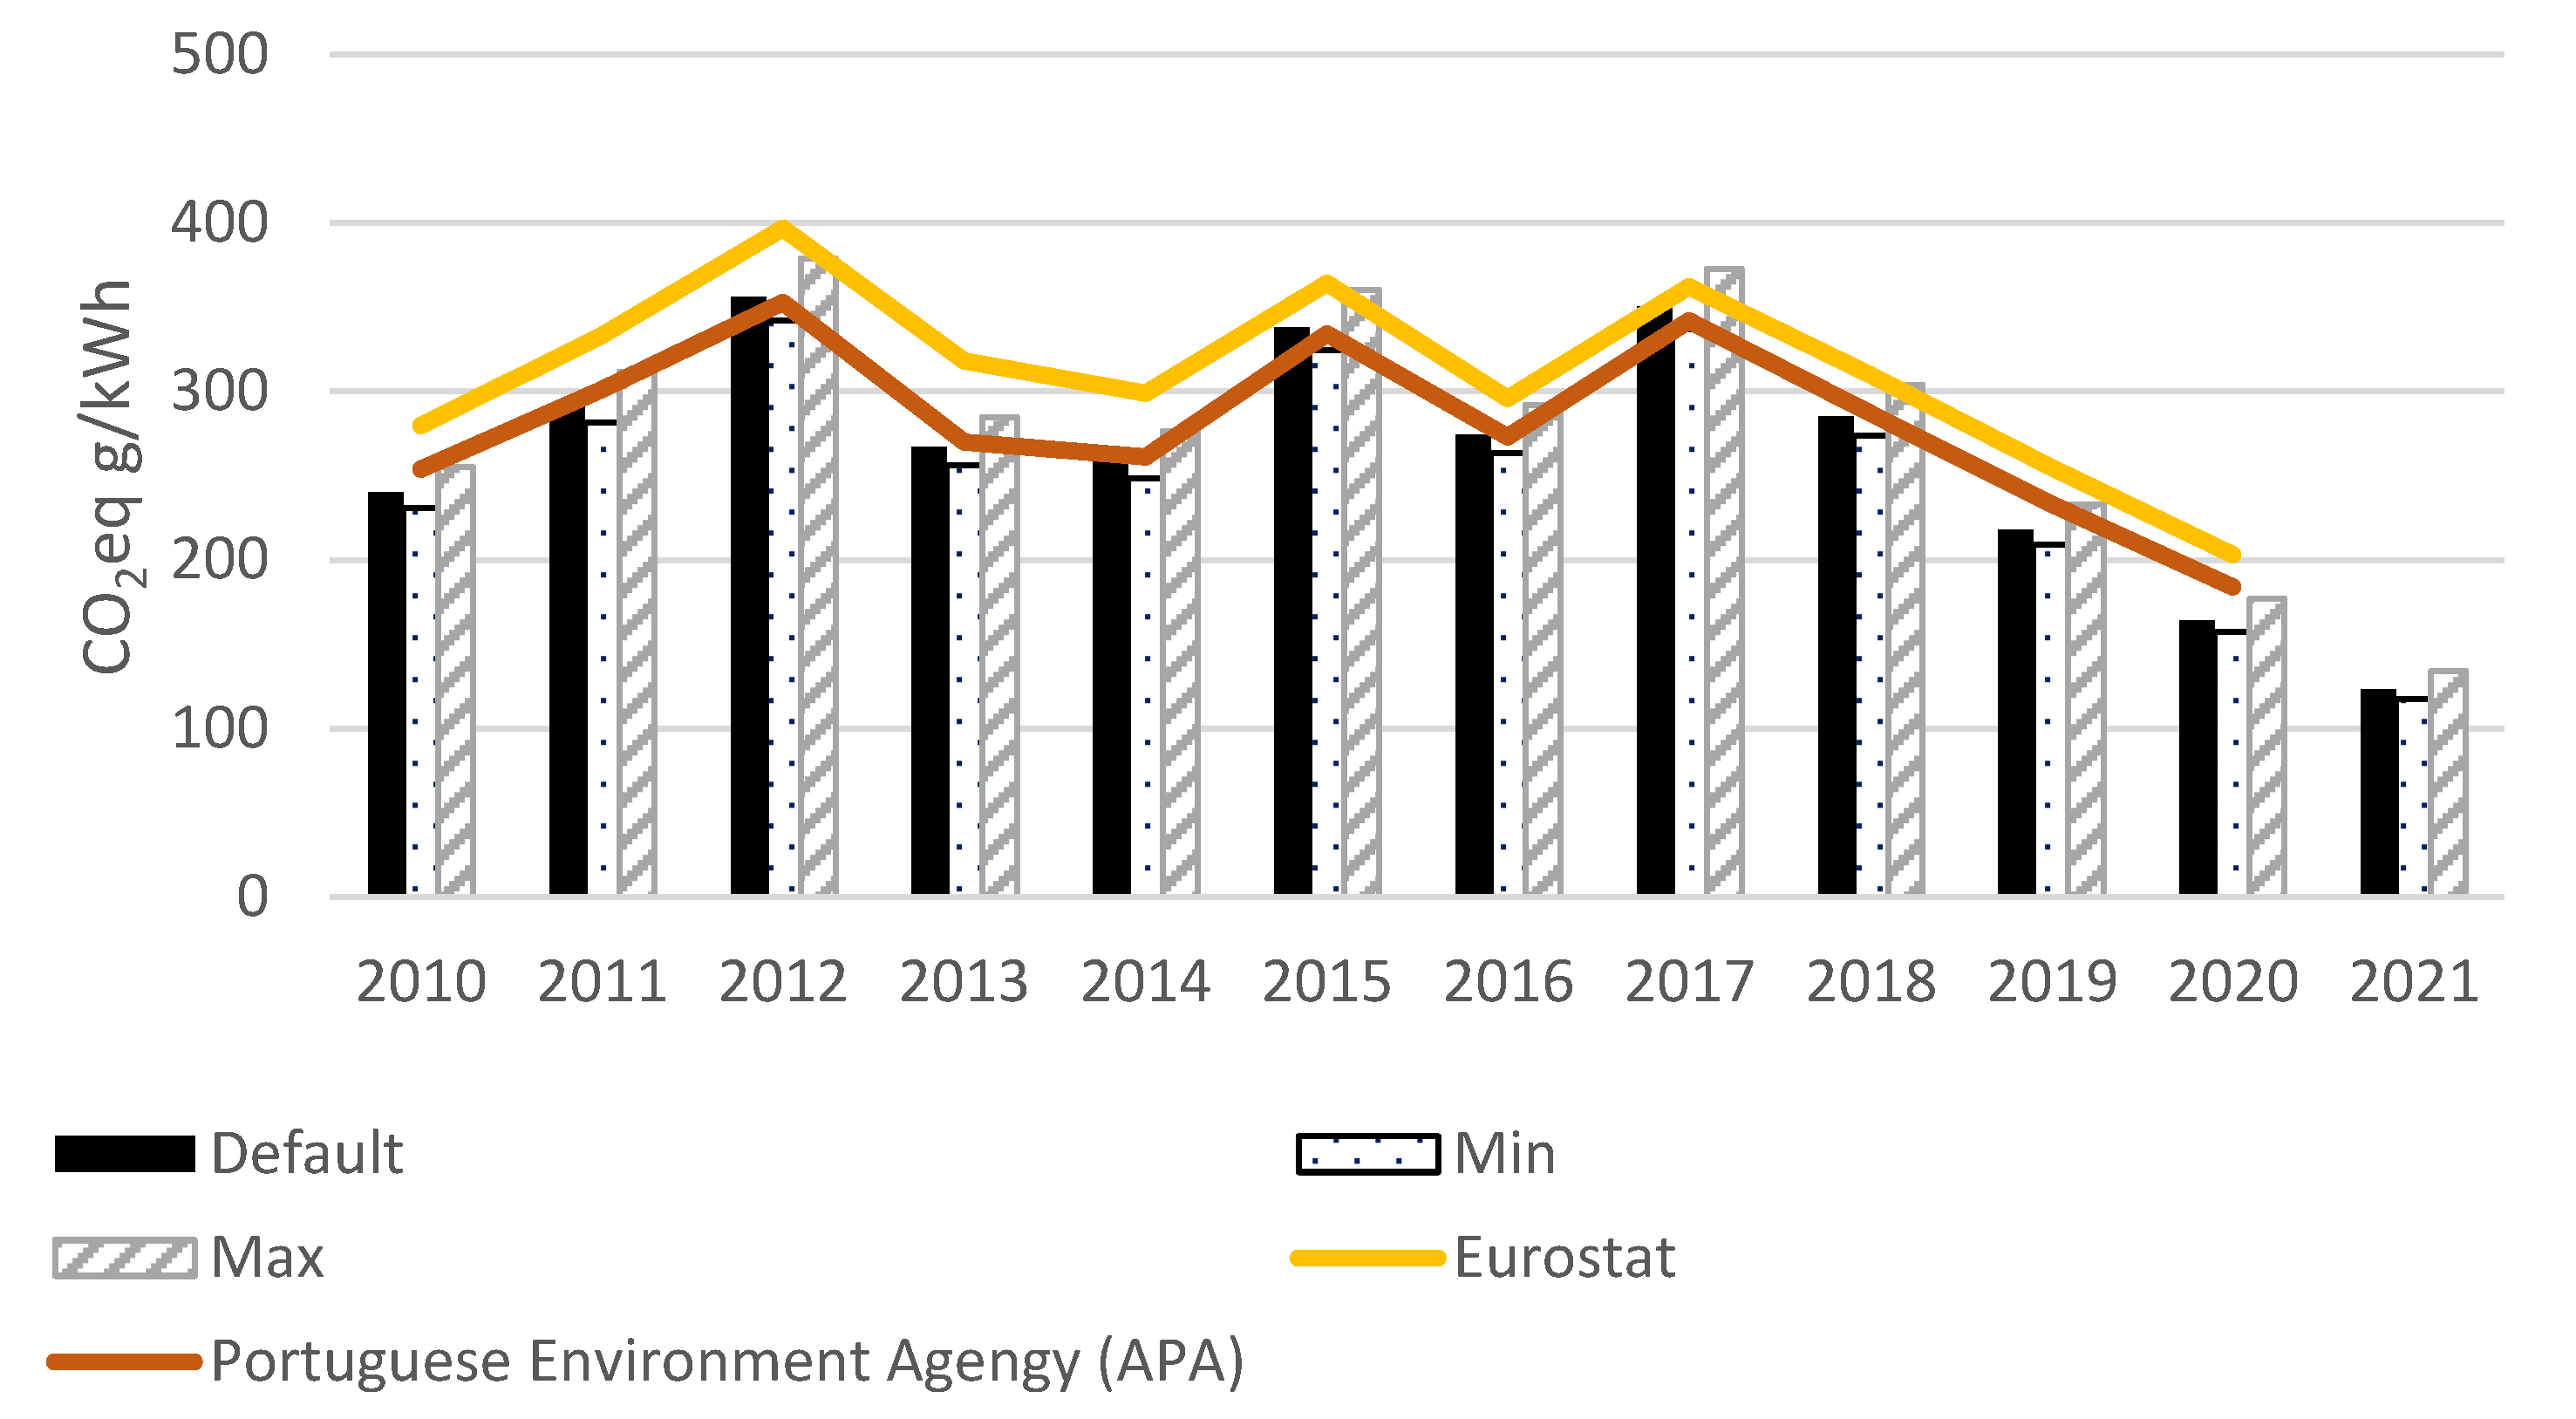
The GHG emission intensity can be retrieved from official databases; however, the IPCC equivalency factors are not up to date, and it is not clear if it concerns the direct emissions per gross kWh or net kWh, with or without co-generation, high, medium or low voltage. The in-house model allows using the most recent equivalency factors (with respective uncertainty) and also the intensity by technology and outputs the emission factor per gross kWh, according to the production mix. See the spreadsheet in the Supplementary Materials. The default value felect = 274 gCO2eq/kWh for 2018 is used hereafter, which means that the e-bike electricity consumption of 12.1 Wh/km translates into 3.3 gCO2eq/km (12.1 × 10−3 × 274 = 3.3). The value for 2018 according to the APA [27] was 287 gCO2eq/kWh, and according to Eurostat, it was 310 g/kWh (see Figure 6). The effect of this variation is assessed in the results.
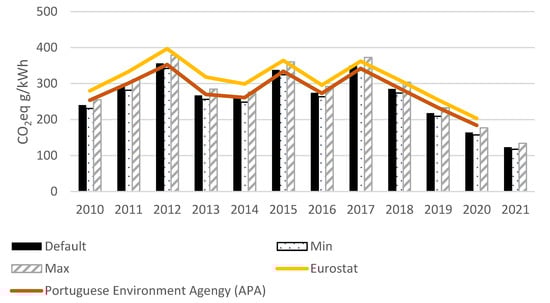
Figure 6.
CO2eq emission factors according to own simulation, Eurostat ([28]) and APA [27].
For comparison, the fossil system using gasoline/diesel liquid fuels in passenger cars has to refine crude oil and the gasoline/diesel burn and emit GHG emissions when driving.
According to the Portuguese circulating fleet composition in 2018 (42% gasoline, 58% diesel), the weighted average will be fPetrol = 6.5 g/MJ, and the driving weighed average CO2eqPetrol = 116 g/km.
2.4. Scenarios
The data regarding the subscriber’s/user’s trip purpose, the original (prior to the GIRA system) mode of transport used and the electricity consumption to recharge the e-bikes were not available. To estimate the possible impact of the GIRA system in the final energy consumption, fossil and renewable origin, and greenhouse gas emissions (CO2, CH4 and N2O), an optimistic and a pessimistic scenario were designed: the former considers that the bike system user originally used the private car for the same origin–destination distance, corresponding to a positive impact. The latter considers that the bike system users originally walked for the same origin–destination distance, corresponding to a negative impact. The preference for e-bikes is also considered.
ECpositive impact = − FCcar × dist + FCe-bike × dist
ECnegative impact = FCe-bike × dist
CO2eqnegative impact = FCe-bike × dist × felect
Dist is the distance in km; FCcar is the fuel consumption of the ICEV in MJ/km; FCe-bike is the electricity consumption of the e-bike including charging losses in MJ/km; fPetrol is the overall CO2eq factor for refinery operations (see Table 4); CO2eqPetrol is the direct combustion emissions when driving the ICEV in g/km; felect is the electricity mix generation direct CO2eq emissions including own consumption; η is the distribution losses for low voltage.
Table 4.
Refining activities (attributional life cycle approach) and direct combustion in use of gasoline/diesel [21].
3. Results
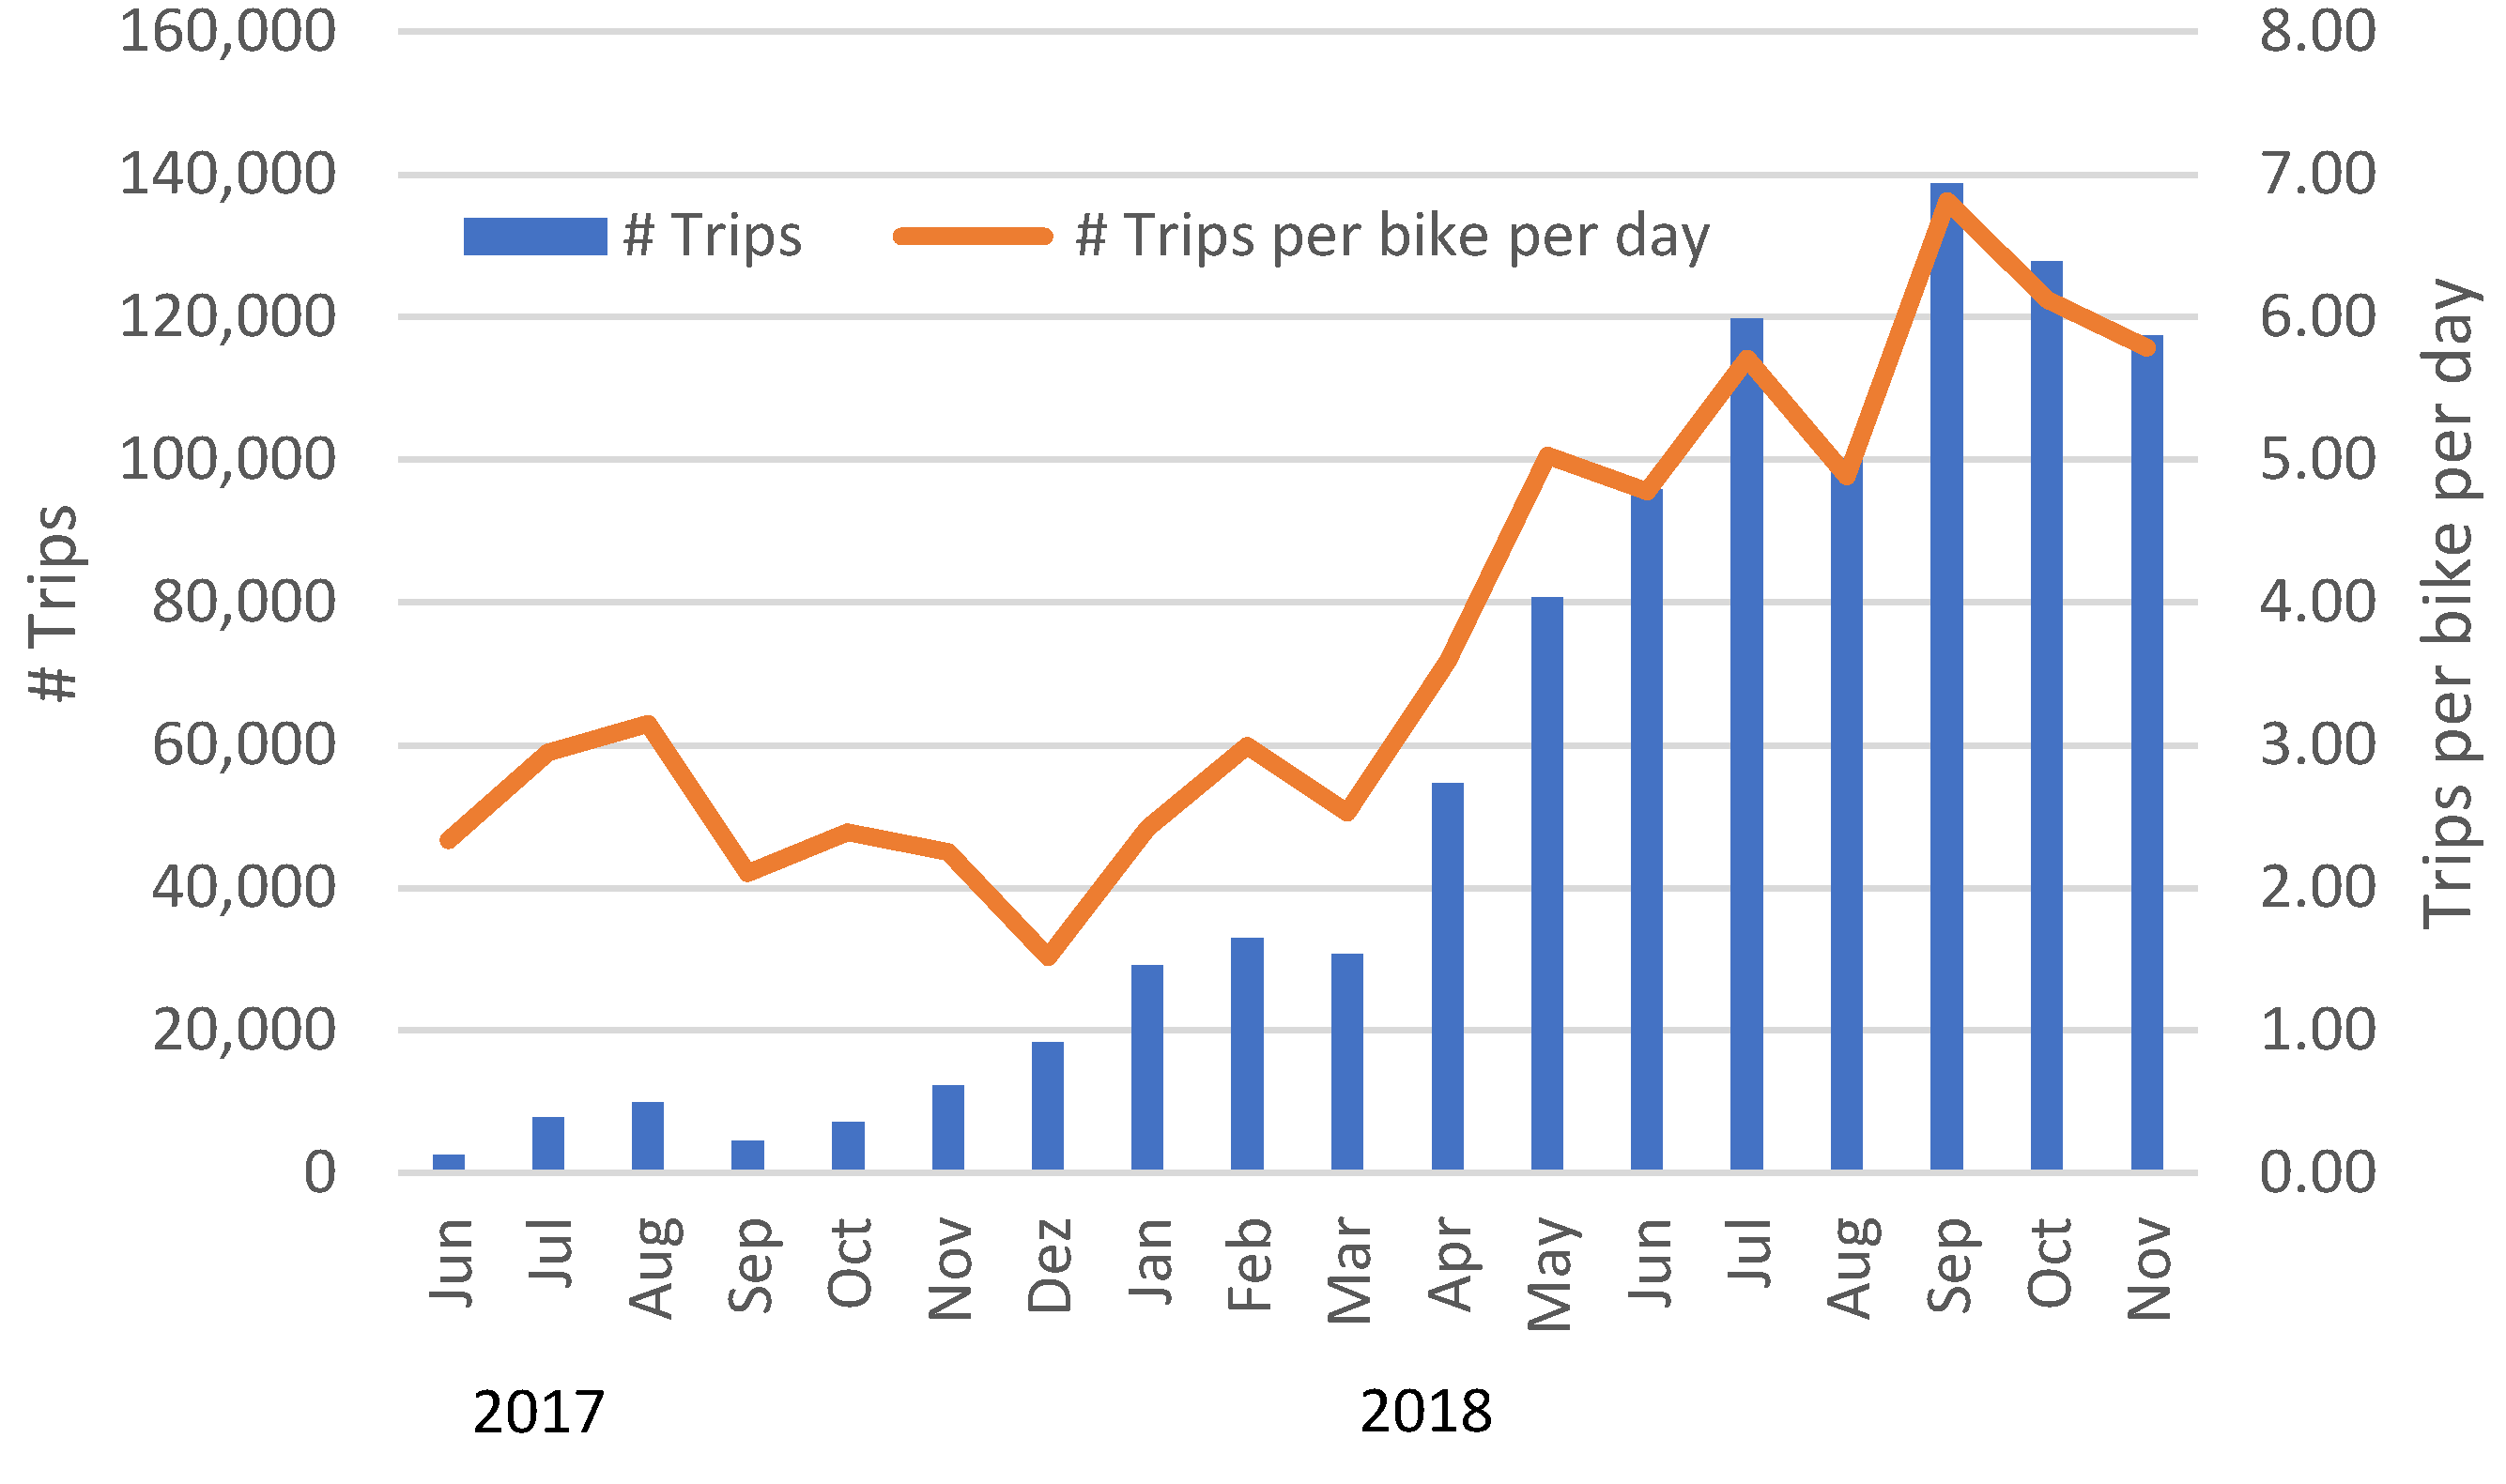
This section shows the results of the study according to the research questions: The total number of trips, trips per bike per day and traveled distance and duration are depicted in Figure 7 and Figure 8. E-bikes make 80% of the trips, which clearly indicated the preference for motorized bikes given that this percentage is higher than their availability in the system. The typical distance traveled is less than 1 km during less than 10 min: essentially short trips.
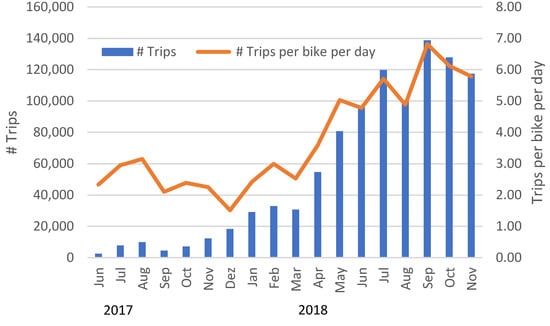
Figure 7.
GIRA trips and average trips per bike in the implementation year, 2017, and first year of operation, 2018.
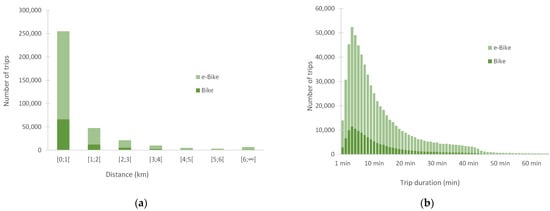
Figure 8.
Trip characteristics (a) Number of trips per distance in 2018; (b) Number of trips per duration in 2018.
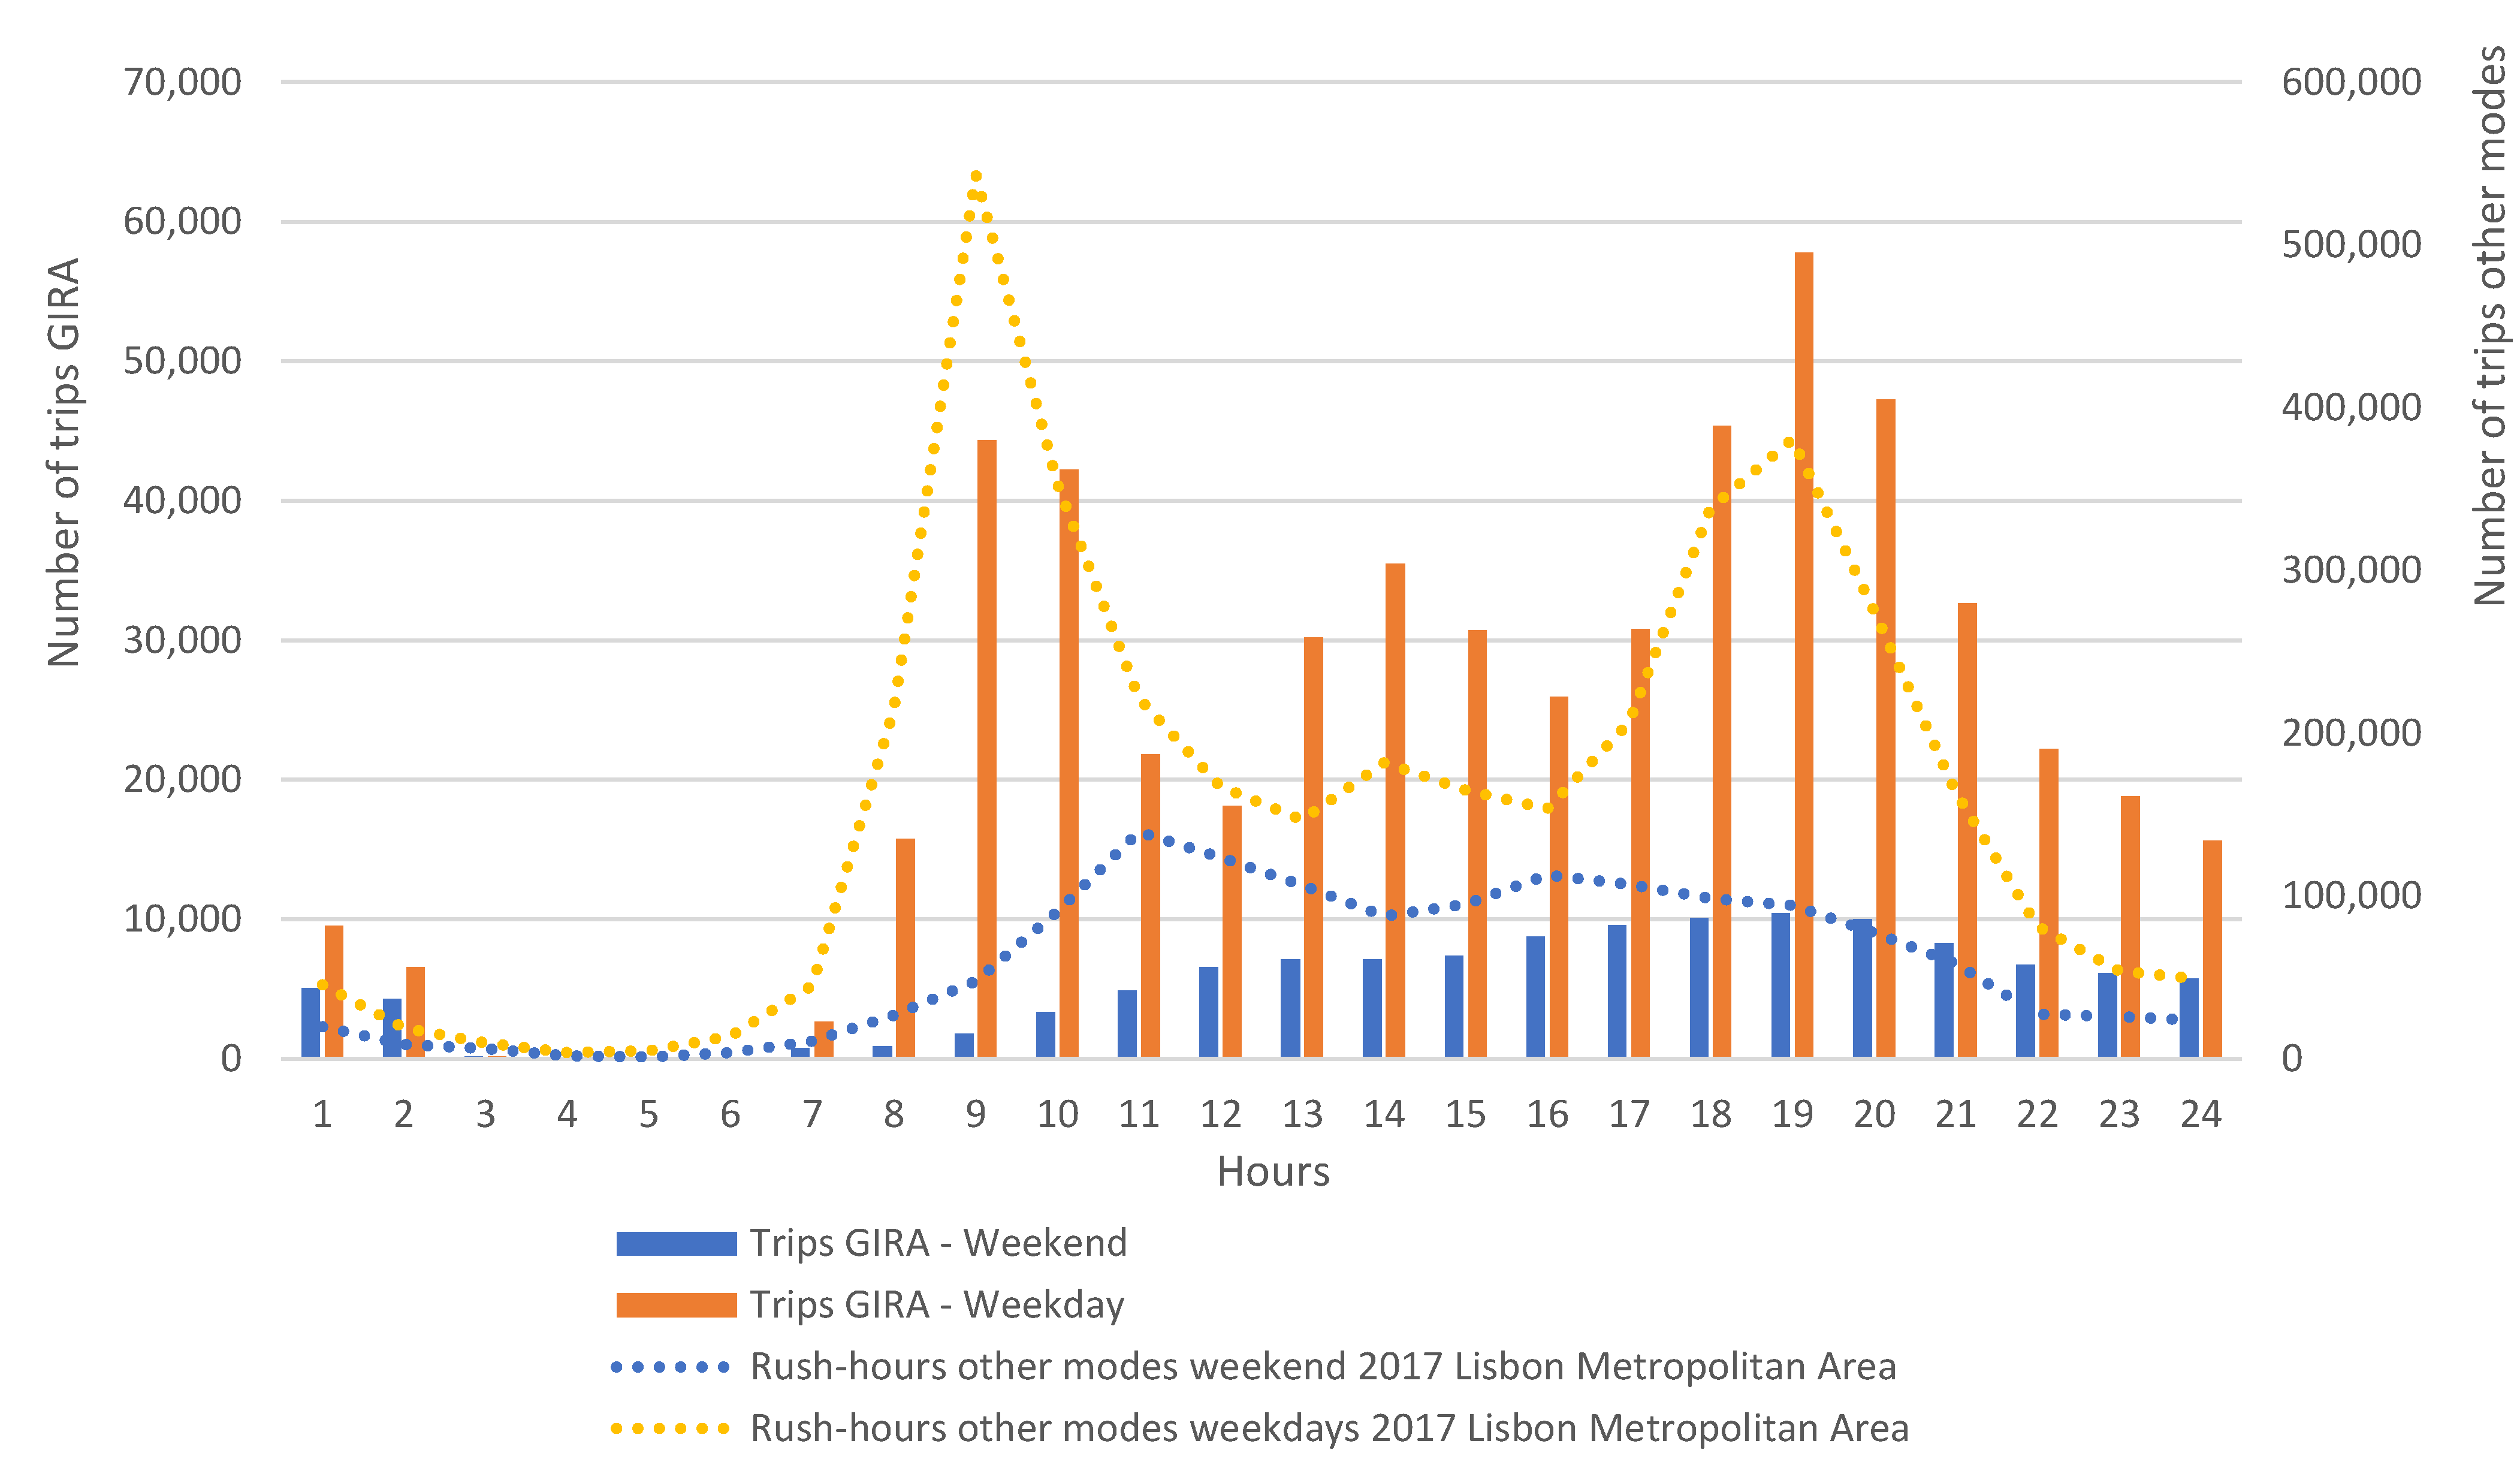
Daily usage during weekdays (Figure 9) has typically two major peaks and one minor peak very similar to rush-hour peaks by other modes of transport: around 9:00 am, 2:00 pm and 7:00 pm. These peaks are also observed in the reviewed studies for Wenzou, China [6] and Cork, Ireland [5]. The difference between weekdays and weekends is observed and is similar for the other transportation modes, a reduction in the number of trips and annulation on the peaks with most trips occurring after 11:00 am.
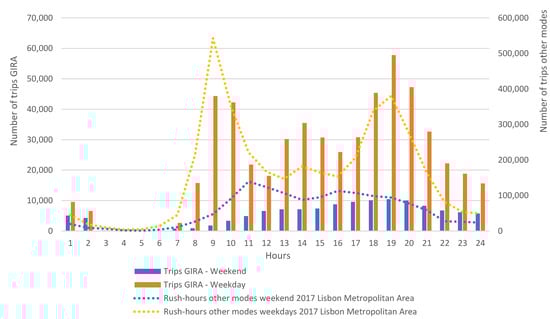
Figure 9.
Rush hours of usual passenger transportation trips (see Figure 4) versus GIRA trips.
In the weekends, the partition between e-bikes and conventional bikes remains 80%/20% with a prevalence of short journeys as well (86% less than 2 km).
Seasonality in terms of holiday period versus non-holiday was measured by dividing the accumulated number of trips at a certain hour of the day by the total amount of trips in that period. Holidays are typically the months of July and August, where no pre-university school takes place, and these are also the months selected by workers to take vacations. As observed in Figure 10, on the weekdays, the two first peaks are slightly lower, but the afternoon peak and 7 pm to 1 am period have higher percentages of trips, which may indicate that the system is used more for night-outs in the holiday period comparing to the non-holiday period, and there is a decrease in the morning and middle day peaks, indicating commuters for work decrease due to holidays. However, these results should be more carefully examined with a survey conducted for the users of the system.
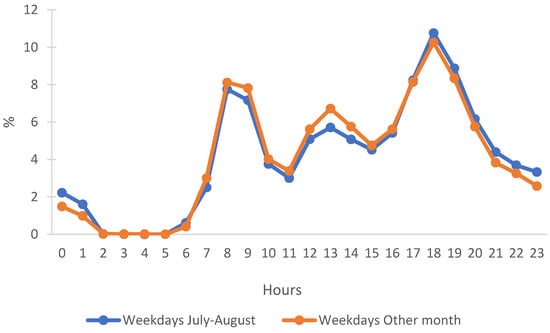
Figure 10.
Percentage of overall trips in July–August versus other months in 2018.
The climate parameters, temperature, precipitation, and wind speed were correlated with the number of trips (Table 5). The Pearson correlation coefficient (R) and p-value were used. Clearly, the combination of high R and low p-values occurs for precipitation: the higher the precipitation, the lower the number of trips (already identified in Section 1. China [6], Whenzhou city and Ireland, Cork city [5]), and for temperature, the higher the temperature, the higher the number of trips. The higher the wind speed, the lower the number of trips, and there was no evidence for relative humidity.
Table 5.
Pearson correlation coefficient (R) and p-value between number of trips and climate parameters.
Precipitation events can be classified as “weak” for values less than 0.5 mm/h, “moderate” for values between 0.5 and 4 mm/h, and “strong” for values above 4 mm/h. These categorized events were correlated with the number of trips considering the entire year of 2018, and the outcome is shown in Figure 11 for the hourly trips. Running an ANOVA null hypothesis on “the hourly trips on the weekends during three different rain events are statistically equivalent” and “the hourly trips on the weekdays during three different rain events are statistically equivalent”, the p-value is less than 0.05 (0.006) for the first and higher than 0.05 (0.25) for the second. Therefore, we may statistically conclude that the weekend is less affected on whether the precipitation is weak, moderate or strong and the weaker precipitation events favor more clearly the weekday trips. Probably, this is due to the nature of the trips (more relaxed, no rigid schedules) on the weekends. However, both show hourly trips up to 10 times higher with no precipitation.
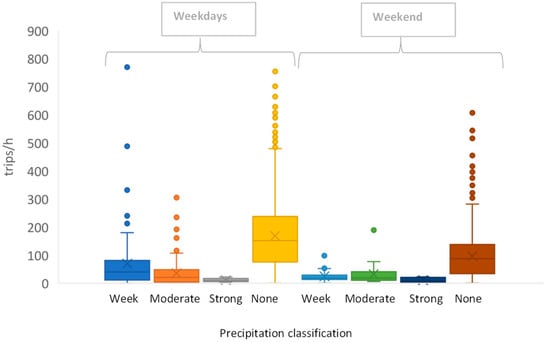
Figure 11.
Precipitation events and hourly number of trips.
Finally, we measured the impact on final energy consumption and GHG emissions. We did not have access to the actual electricity consumption of the system and the user’s profile in terms of whether the system usage replaces private car usage or not. This aspect needs to be further explored by means of a survey conducted to the system users. Nevertheless, the possible impacts range between a user that usually walks and now rides a shared e-bike and a user that replaces the private car trips by e-bike trips. Table 6 shows the outcomes. The increase in renewable energy in the generation mix (Portugal as already abandoning coal power) will reduce the negative impacts even further, since the positive impacts are a major highlight for this kind of shared e-bike system. The electrification of the private car would also reduce the positive impacts: for example, in the final energy consumption, the maximum positive impacts would be −137,330 MJ, by considering a consumption for BEV (electric car) of 0.5 MJ/km (1/3 of ICEV).
Table 6.
Final energy consumption MJ/year and GHG emissions savings (negative values).
4. Discussion
The overall number of bikes and e-bikes in the system is not known over the month, and the fact that this number may change over time may impact the analyzed outcomes. For example, the higher availability of e-bikes along the month may be favoring e-bike trips over conventional bike trips. Common knowledge indicates people prefer e-bikes if both types are available at the docking station. The estimation of energy and emissions impact assumes this premise. It also assumes that the private car mode of transport is the one replaced in e-bike short trips. A sensitivity analysis was made to the parameters felect (by default, 274 gCO2eq/kWh), fPetrol (by default, 6.5 gCO2eq/MJ) and modal shift (by default, private cars to e-bikes).
The accuracy of the parameter felect, the electricity mix generation direct CO2eq emissions including own consumption, in g/kWh, is very important to have higher confidence in the GHG emission avoidance potential, as life cycle analysis has several uncertainty issues [29,30]. A 10% increase in the parameter causes variations in negative impacts of 10%. Therefore, it is important to know how felect is calculated and control it over using “black box” emission factors published elsewhere. The accuracy of the parameter fpetrol is not critical, since the main contribution for GHG emissions for petrol cars is the direct fuel combustion. A 10% increase in the parameter causes variations in the positive impacts of 1%.
Instead of replacing private car trips, the system may be replacing buses or a percentage of bus, car, taxi and walking mode trips. The benefits of the system may be less in the case of bus replacements (decreasing bus occupancy rates) or walking mode replacements (the worst-case scenario analyzed (Table 6 having an increase of +8 GJ/year and adding +1 Ton/year to transportation GHG emissions)). In the case of buses, replacing the energy consumption factor in MJ/pkm should be the original, for a typical occupancy rate, but an extra MJ/pkm should be applied now with the e-bike system [31]. The final energy consumption of the bus [32] ranges between 9 MJ/pkm (0% occupancy, only the driver, no slope), 0.2 MJ/pkm (50% occupancy, no slope) to 0.1 MJ/pkm (100% occupancy, no slope). This means that if there is a modal shift from the bus system to e-bike sharing system and there is a decrease in rush hours (100% occupancy to 50% occupancy), the bus system earns an extra (0.1 MJ/pkm × 81 people − 0.2 MJ/pkm × 41 people) 0.1 MJ/km, and the e-bike system earns an extra (10 Wh/km × 40 people, driver not included) 0.4 kWh/km or 1.44 MJ/km. So, the balance would be an extra 1.54 MJ of energy consumption. For GHG, the diesel extra consumption of 0.1 MJ/km reflects an extra 0.1 × 6.5 gCO2/MJ + 0.1 MJ/km × 73 gCO2/MJ = 7.4 gCO2/km, while extra electricity GHG due to more e-bike use equals 0.4/0.93 × 274 = 118 gCO2eq/km. In this case, we observe an overall increase in 126 g/km GHG, which is equivalent to adding a private car on the road, which has a negative impact. It will be extremely useful to know the probabilities of using the e-bike sharing system and the mode shift that occurred (private car to e-bike, bus to e-bike, a combination, etc.) to obtain the actual impact of the e-bike sharing system and reduce uncertainty.
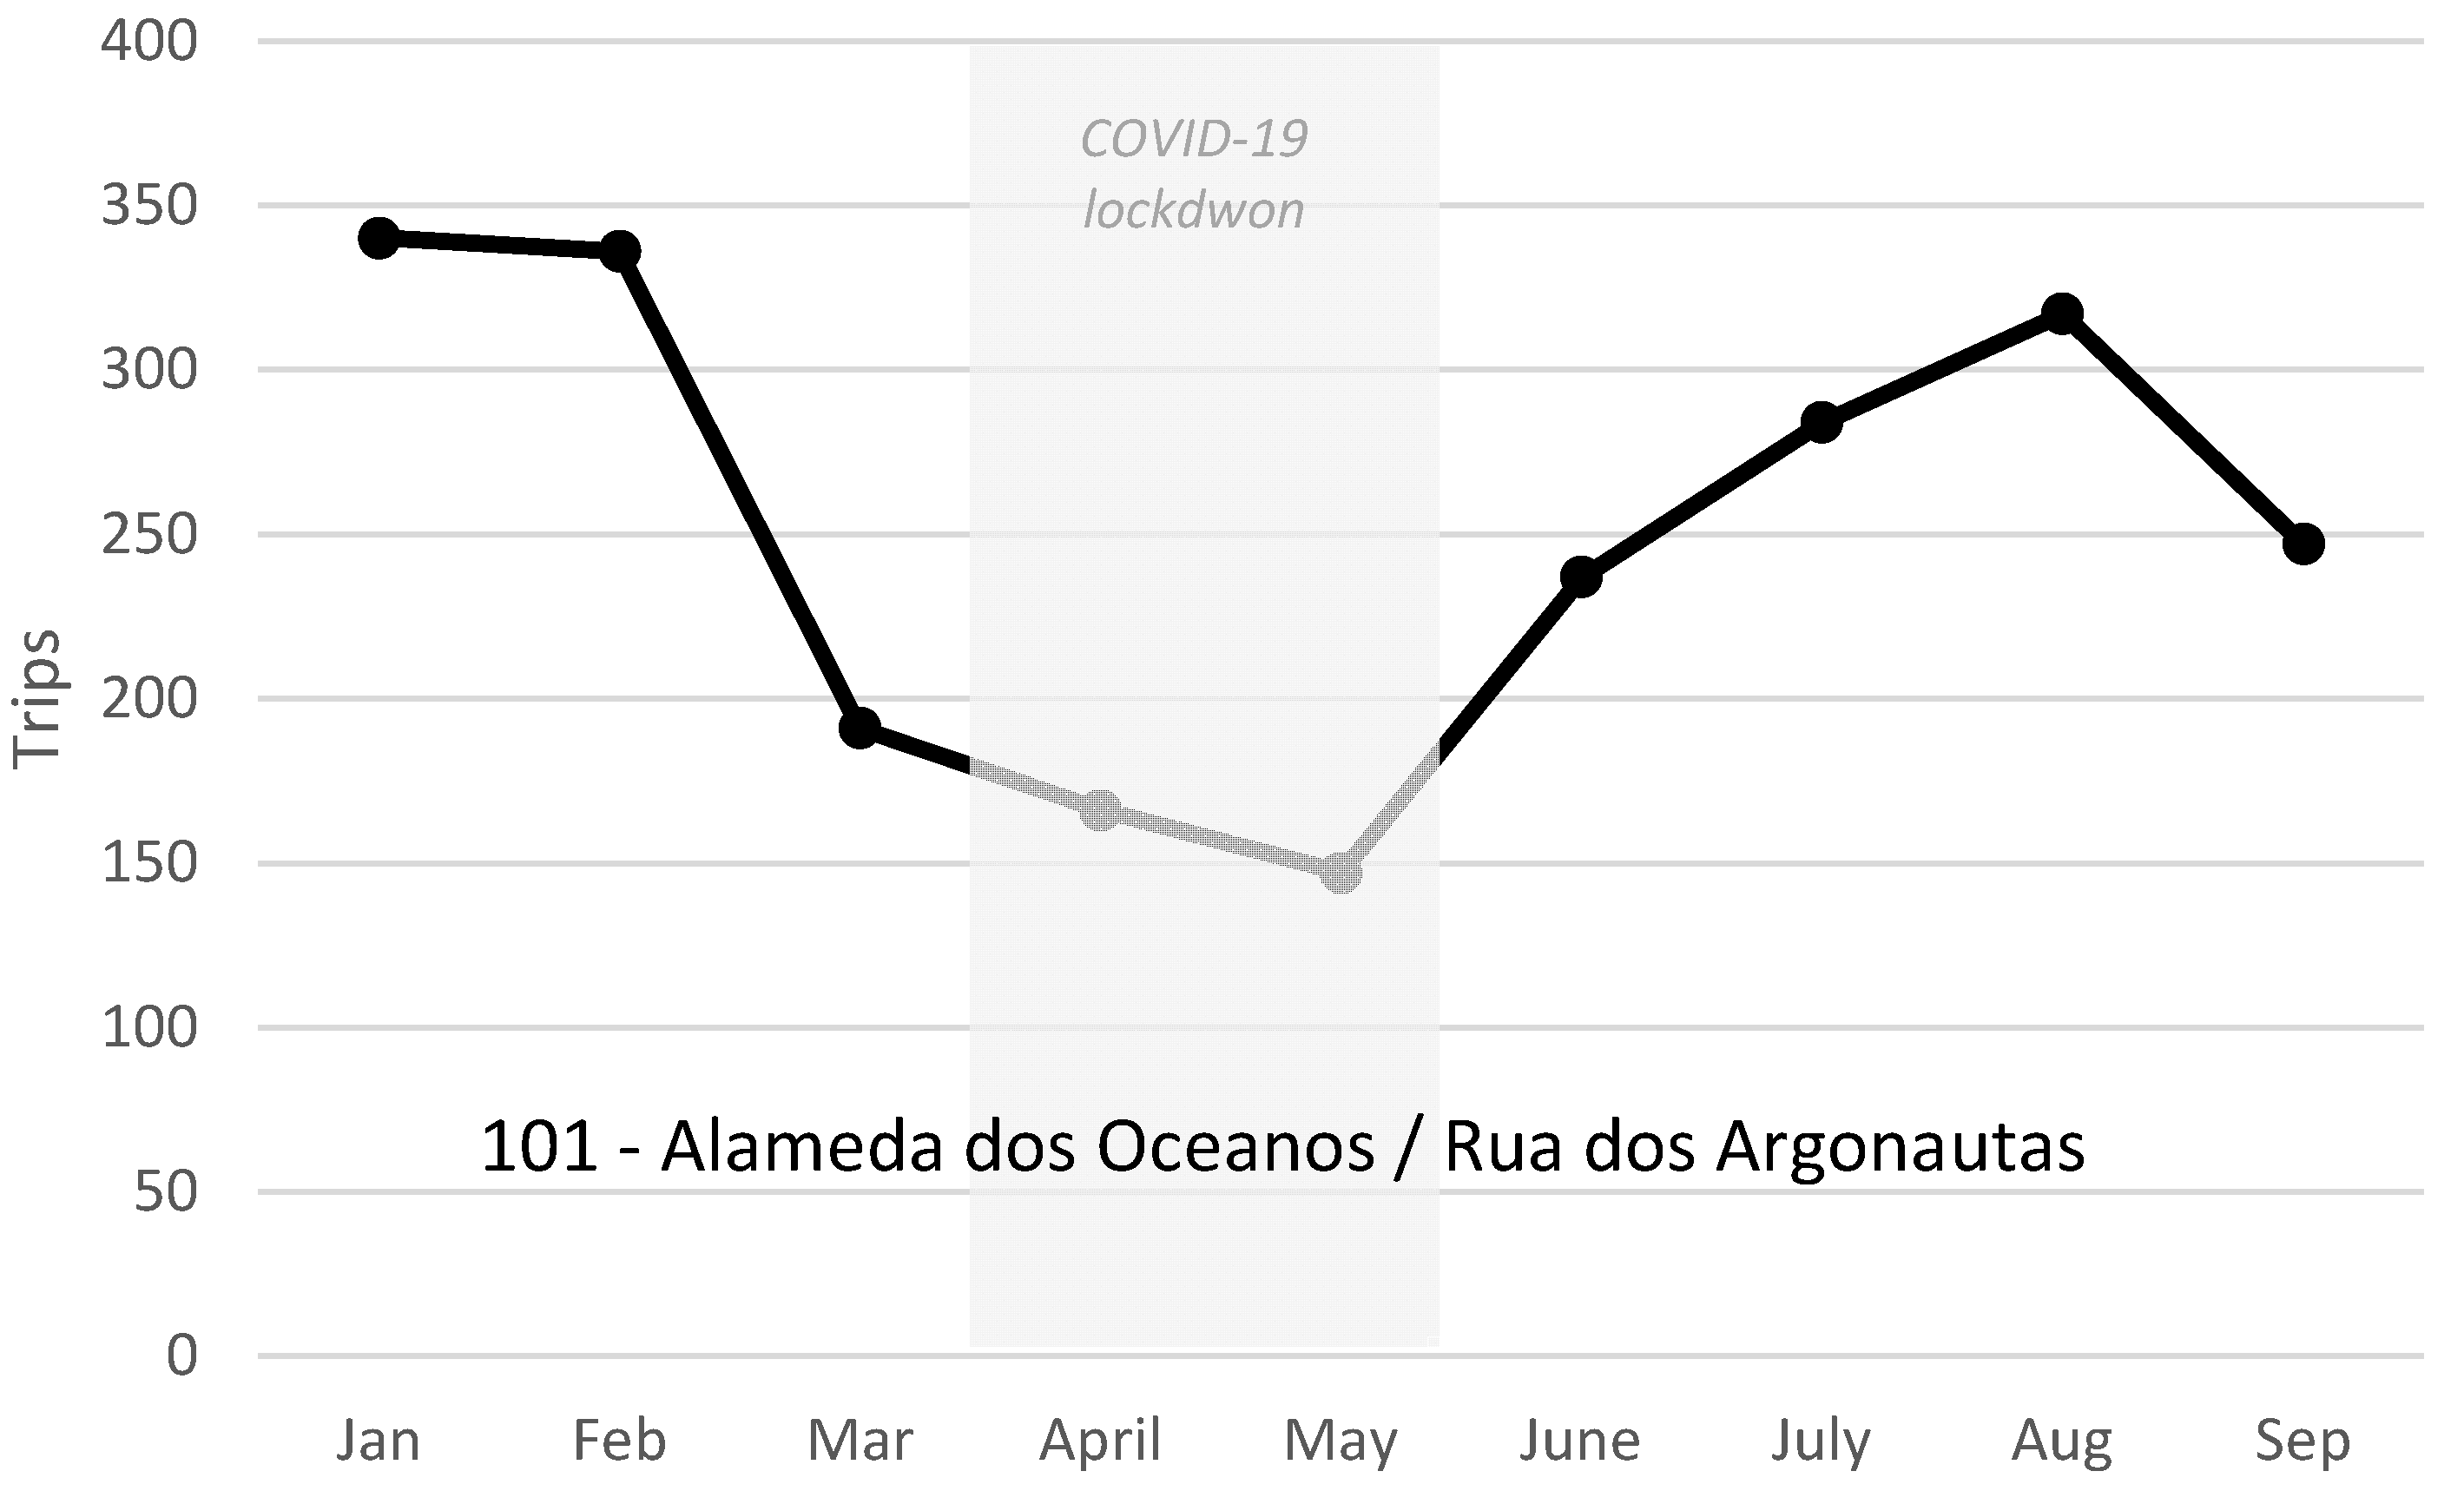
Another issue is the data availability for years other than 2018. The system is still running in 2022. The only publicly available information is that the number of trips per bike and per day has been increasing since the pilot stage (see Figure 7), indicating the increase in the number of subscribers/users. The problem with individuals’ data privacy is blocking the access to data for 2019 and beyond. The years 2020–2021 were atypical due to the COVID-19 pandemic. For example, using the opendata portal [33], and observing the total amount of trips during the first 9 months of 2020, we can observe clearly the reduction in April and May. However, the distinction between e-bike and bike is no longer possible, and the trip duration and distance are not available. Figure 12 shows the busiest station in the system in 2020, where the reduction in the April lockdown and partial lockdown in May can be observed. The climate parameter precipitation was very low in May (on average less than 0.8 mm/day), where the minimum number of trips was observed.
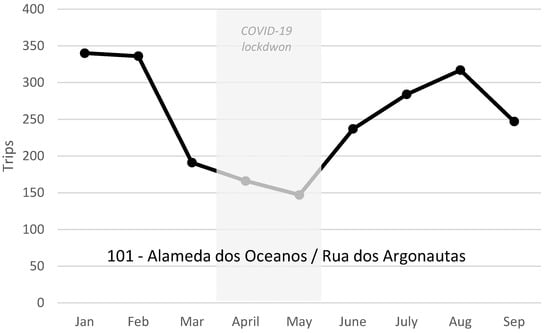
Figure 12.
Trips with origin in the busiest station identified in 2018.
In relation to future research, last mile goods delivery patterns should be studied to see if bike sharing is also used in this context. A typical usage would be on-demand meals delivery. Tourism usage is also a very strong possibility in the most historical places (Lisbon downtown). Additionally, a survey to find out if the users of the system abandoned partially or completely the private car in working weekdays, or the bus/metro systems, and the age of the users would be very helpful to characterize the usefulness of the system more deeply.
5. Conclusions
The usage of bike-sharing systems has been increasing steeply around the world and especially in Europe. This paper analyzes the usage patterns of a docking system with 70% e-bikes and 30% conventional bikes. Users prefer e-bikes with 80% of the trips completed by this mode. The system is used essentially for short trips, less than 1 km with a duration of 10 min, within the free charge range. The climate variable precipitation has a clear negative correlation with the number of trips, which was expected. The working weekdays show three peaks in bike use coincident with rush-hour peaks for private cars and other modes of transport. In the holiday period, the two first peaks are slightly lower, but the afternoon peak and 7 pm to 1 am period has a higher percentage of trips, which may indicate that the system is used more for nights out in the holiday period compared to the non-holiday, and there is a decrease in the morning and middle day peaks, indicating commuters for work decrease due to holidays. The difference between weekdays and weekends is observed and is similar for the other transportation modes: a reduction in the number of trips and annulation on the peaks with the majority of trips occurring after 11 am. In a private car fleet dominated by fossil fuels and internal combustion engines, the GHG benefits are less than 36 Ton/year and final energy consumption is less 451 GJ/year. With the electrification of the private cars and increase in renewables in the electricity generation mix, the final energy consumption benefits amount to less 137 GJ, with no benefits from the GHG point of view (excluding materials of production of the vehicles and respective charging infrastructure).
Two major sources of uncertainty in the results are the GHG intensity of the electricity generation mix and the modal shift that occurs with e-bike system users, so it is recommended that these two aspects be deeply analyzed for similar research works. If the modal shift occurs from petrol bus trips to e-bikes, a negative impact on GHG emission is foreseen due to the increased specific fuel consumption of the bus in rush hours (equivalent to adding a petrol car for each 40 people modal shifting).
Supplementary Materials
The following supporting information can be downloaded at: https://www.mdpi.com/article/10.3390/en15186725/s1, File S1: Outcomes of the Lisbon Metropolitan area mobility survey 2017 “IMOB_2017_AML_Rush-hours”; File S2: Spreadsheet model for electricity mix CO2eq emission factors “CO2eq_Portuguese electricity mix”.
Author Contributions
Conceptualization, C.S.; methodology, C.S.; data analysis and formal analysis, M.R.; investigation, M.R. and C.S.; writing—original draft preparation, M.R. and C.S.; supervision, C.S. All authors have read and agreed to the published version of the manuscript.
Funding
Financiado pela Fundação para a Ciência e a Tecnologia, I.P./MCTES através de fundos nacionais (PIDDAC)—UIDB/50019/2020.
Data Availability Statement
Links to publicly archived datasets analyzed: (https://www.ipma.pt/en/oclima/series.longas/, last access August 2022; https://www.ine.pt/xportal/xmain?xpid=INE&xpgid=ine_indicadores&contecto=pi&indOcorrCod=0007244&selTab=tab0&xlang=pt, accessed on 29 August 2022; https://www.asf.com.pt/ISP/AgregadorEstatisticas, accessed on 29 August 2022; opendata portal https://dados.gov.pt/pt/datasets/gira-bicicletas-de-lisboa-historico/, last access August 2022.
Acknowledgments
This research was conducted in the framework of a master thesis in Energy and Environment Engineering at FCUL-Faculty of Sciences of the University of Lisbon.
Conflicts of Interest
The authors declare no conflict of interest.
References
- Meddin, R.; DeMaio, P.; O’Brien, O.; Rabello, R.; Yu, C.; Seamon, J.; Thiago, B. The Meddin Bike-sharing World Map. Available online: http://bikesharingworldmap.com/ (accessed on 29 August 2022).
- Galatoulas, N.-F.; Genikomsakis, K.N.; Ioakimidis, C.S. Spatio-Temporal Trends of E-Bike Sharing System Deployment: A Review in Europe, North America and Asia. Sustainability 2020, 12, 4611. [Google Scholar] [CrossRef]
- Silva, C.; Marques, C.; Raposo, M.; Soares, A. Smart and Sustainable Mobility Adaptation Toward the Energy Transition. In Technologies for Integrated Energy Systems and Networks; Wiley: Hoboken, NJ, USA, 2022; pp. 165–186. [Google Scholar]
- Macioszek, E.; Świerk, P.; Kurek, A. The bike-sharing system as an element of enhancing sustainable mobility—A case study based on a city in Poland. Sustainability 2020, 12, 3285. [Google Scholar] [CrossRef]
- Caulfield, B.; O’Mahony, M.; Brazil, W.; Weldon, P. Examining usage patterns of a bike-sharing scheme in a medium sized city. Transp. Res. Part A Policy Pract. 2017, 100, 152–161. [Google Scholar] [CrossRef]
- Xu, X.; Ye, Z.; Li, J.; Xu, M. Understanding the Usage Patterns of Bicycle-Sharing Systems to Predict Users’ Demand: A Case Study in Wenzhou, China. Comput. Intell. Neurosci. 2018, 2018, 9892134. [Google Scholar] [CrossRef] [PubMed]
- Nikitas, A. Understanding bike-sharing acceptability and expected usage patterns in the context of a small city novel to the concept: A story of ‘Greek Drama’. Transp. Res. Part F Traffic Psychol. Behav. 2018, 56, 306–321. [Google Scholar] [CrossRef]
- Bakogiannis, E.; Siti, M.; Tsigdinos, S.; Vassi, A.; Nikitas, A. Monitoring the first dockless bike sharing system in Greece: Understanding user perceptions, usage patterns and adoption barriers. Res. Transp. Bus. Manag. 2019, 33, 100432. [Google Scholar] [CrossRef]
- Chen, Z.; van Lierop, D.; Ettema, D. Dockless bike-sharing systems: What are the implications? Transp. Rev. 2020, 40, 333–353. [Google Scholar] [CrossRef]
- Nikitas, A. How to Save Bike-Sharing: An Evidence-Based Survival Toolkit for Policy-Makers and Mobility Providers. Sustainability 2019, 11, 3206. [Google Scholar] [CrossRef]
- Ji, S.; Cherry, C.R.; Han, L.D.; Jordan, D.A. Electric bike sharing: Simulation of user demand and system availability. J. Clean. Prod. 2014, 85, 250–257. [Google Scholar] [CrossRef]
- Li, A.; Gao, K.; Zhao, P.; Qu, X.; Axhausen, K.W. High-resolution assessment of environmental benefits of dockless bike-sharing systems based on transaction data. J. Clean. Prod. 2021, 296, 126423. [Google Scholar] [CrossRef]
- Luo, H.; Zhao, F.; Chen, W.-Q.; Cai, H. Optimizing bike sharing systems from the life cycle greenhouse gas emissions perspective. Transp. Res. Part C Emerg. Technol. 2020, 117, 102705. [Google Scholar] [CrossRef]
- Autoridade Nacional de Segurança Rodoviária. Available online: http://www.ansr.pt/Pages/default.aspx (accessed on 29 August 2022).
- INE. Inquérito à Mobilidade nas Áreas Metropolitanas do Porto e de Lisboa 2017. 2018. Available online: https://www.ine.pt/xportal/xmain?xpid=INE&xpgid=ine_publicacoes&PUBLICACOESpub_boui=349495406&PUBLICACOESmodo=2&xlang=pt (accessed on 29 August 2022).
- INE. Available online: https://www.ine.pt/xportal/xmain?xpid=INE&xpgid=ine_indicadores&contecto=pi&indOcorrCod=0007244&selTab=tab0&xlang=pt (accessed on 29 August 2022).
- ASF—Autoridade de Supervisão de Seguros e Fundos de Pensões. Available online: https://www.asf.com.pt/ISP/AgregadorEstatisticas (accessed on 29 August 2022).
- Drobnik, J.; Jain, P. Electric and hybrid vehicle power electronics efficiency, testing and reliability. World Electr. Veh. J. 2013, 6, 719–730. [Google Scholar] [CrossRef]
- Leuenberger, M.; Frischknecht, R. Life Cycle Assessment of Two Wheel Vehicles; Uster: Uster, Switzerland, 2010. [Google Scholar]
- Evtimov, I.; Ivanov, R.; Staneva, G.; Kadikyanov, G. A Study on electric bicycle energy efficiency. Transp. Probl. 2015, 10, 131–140. [Google Scholar] [CrossRef]
- Mccarran, T.; Carpenter, N. Electric Bikes: Survey and Energy Efficiency Analysis; Report: 000-053; Efficiency Vermont: Winooski, Vermont, 2018. [Google Scholar]
- Toman, M.; Cipin, R.; Cervinka, D.; Vorel, P.; Prochazka, P. Li-Ion Battery Charging Efficiency. ECS Trans. 2016, 74, 37–43. [Google Scholar] [CrossRef]
- Prussi, M.; Yugo, M.; De Prada, L.; Padella, M.; Edwards, R. JEC Well-to-Wheels Report v5; Publications Office of the European Union: Luxembourg, 2020. [Google Scholar]
- IPCC. Climate Change 2021: The Physical Science Basis. In Contribution of Working Group I to the Sixth Assessment Report of the Intergovernmental Panel on Climate Change; Masson-Delmotte, V., Zhai, P., Pirani, A., Connors, S.L., Péan, C., Berger, S., Cau, N., Eds.; IPCC: Paris, France, 2021. [Google Scholar]
- Silva, C. Greenhouse Gas Emission Assessment of Simulated Wastewater Biorefinery. Resources 2021, 10, 78. [Google Scholar] [CrossRef]
- Penman, J.; Gytarsky, M.; Hiraishi, T.; Irving, W.; Krug, T. 2006 IPCC—Guidelines for National Greenhouse Gas Inventories; IPCC: Paris, France, 2006. [Google Scholar]
- Agência Portuguesa do Ambiente. Fator de Emissão da Eletricidade—2022; APA: Amadora, Portugal, 2022. [Google Scholar]
- Eurostat. Available online: https://www.eea.europa.eu/data-and-maps/daviz/co2-emission-intensity-10/ (accessed on 29 August 2022).
- Pacheco, R.; Silva, C. Global Warming Potential of Biomass-to-Ethanol: Review and Sensitivity Analysis through a Case Study. Energies 2019, 12, 2535. [Google Scholar] [CrossRef]
- Silva, C.; Moniz, P.; Oliveira, A.C.; Vercelli, S.; Reis, A.; da Silva, T.L. Cascading Crypthecodinium cohnii Biorefinery: Global Warming Potential and Techno-Economic Assessment. Energies 2022, 15, 3784. [Google Scholar] [CrossRef]
- Silva, C. At what extent the benefits of introducing alternative light-duty vehicles offset those of increasing the buses average occupancy? Energy Convers. Manag. 2013, 70, 211–219. [Google Scholar] [CrossRef]
- Albrektsen, R.H.N.; Hjorth, M.; Mikkelsen, D.; German, R.; Goodwin, J.; Hobson, M.; King, K.; Sanchez, B.; Amon, B.V.N.; Kouridis, C.; et al. EMEP/EEA Emission Inventory Guidebook; Publications Office of the European Union: Luxembourg, 2019; Volume 11. [Google Scholar]
- Available online: https://dados.gov.pt/pt/datasets/gira-bicicletas-de-lisboa-historico/ (accessed on 29 August 2022).


Publisher’s Note: MDPI stays neutral with regard to jurisdictional claims in published maps and institutional affiliations. |
© 2022 by the authors. Licensee MDPI, Basel, Switzerland. This article is an open access article distributed under the terms and conditions of the Creative Commons Attribution (CC BY) license (https://creativecommons.org/licenses/by/4.0/).