Abstract
In power energy distribution networks, switchgear is considered critical equipment. This is because the act of monitoring the operation and condition of switchgear, as well as performing the required corrective maintenance on any potentially problematic equipment, is critical. A single event may harm thousands of customers over time and pose a significant risk to operational staff. Many considerations must be put in place before using outages to switch down the system since they may raise maintenance costs and disrupt the power supply to users. As a result, proper interpretation of switchgear status evaluations is critical for the early identification of possible faults. Existing ultrasound condition-based monitoring (CBM) diagnostic testing techniques require the tester to manually interpret test data. This study aims to review the status of the recent development of CBM techniques with faults in switchgear. The current trend in electrification will be toward the safety and sustainability of power grid assets, which involves an evaluation of the electrical systems’ and components’ health and grids for medium-voltage distribution. This work provides a current state-of-the-art evaluation of deep learning (DL)-based smart diagnostics that were used to identify partial discharges and localize them. DL techniques are discussed and categorized, with special attention given to those sophisticated in the last five years. The key features of each method, such as fundamental approach and accuracy, are outlined and compared in depth. The benefits and drawbacks of various DL algorithms are also examined. The technological constraints that hinder sophisticated PD diagnostics from being implemented in companies are also recognized. Lastly, various remedies are suggested, as well as future research prospects.
1. Introduction
Switchgear is generally known as a switching device. It is used for circuit isolation and the protection of power systems from overload and system faults. The definition of switchgear also includes devices that are utilized to regulate, meter, and control power systems [1]. The term refers to switching and interrupting devices, as well as their combinations with control, instrumentation, metering, protective, and regulating devices, as well as the components of devices involved in dealing with interconnections, items, and supporting structures, which are used primarily in the generation, transmitting distribution, and conversion of electrical power [2]. Switchgear is a critical component of any power distribution system [3]. The popularity of gas-insulated switchgear is due to its compactness and longevity. The inclusion of sulfur hexafluoride (SF6) gas, which has good insulating and quenching properties, contributes to compactness [4]. The technological basis for this method is provided by existing and innovative sensors. Condition-monitoring platforms, such as mechanical systems coupled with switchgear systems, process the signals provided by these sensors. Using these platforms, what goes on with the switchgear at a particular time can be detected. The observed circumstances may be used to determine maintenance and operative actions. Generally, machine learning (ML) is used to predict faults. Researchers use ML and deep learning (DL) to analyze data from condition-monitoring devices. To do so, the data may be connected to other sources of data, such as switchgears or sensors, to forecast future changes in asset status. This circumstance allows for better planning of individual switchgear maintenance strategies. An appropriate and scalable business model for monitoring systems and predicting medium-voltage (MV) switchgear should be established and proven before industrial players implement such technical improvements [5].
Switchgear is a critical component of electrical grids that serves as both a protection and a control device. An electrical circuit may be disrupted by switchgear, such as preventing more losses following a failure or making an adjustment in the circuit elements. There are many types of switchgear; this research studies the MV switchgear (Figure 1) alongside its vital parts, the main busbar system, and power cable terminations.
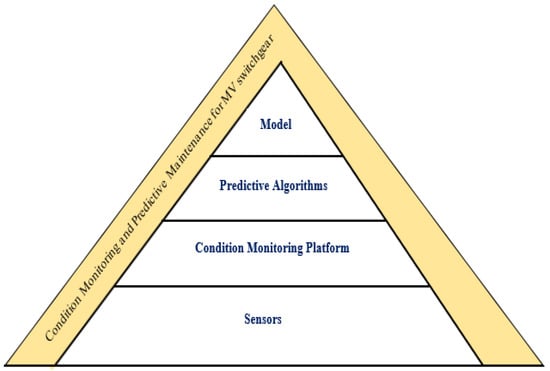
Figure 1.
A comprehensive overview of medium-voltage switchgear condition monitoring and preventative analysis.
1.1. MV Switchgear
The MV switchgear installed in buildings is a line-up made of ten switchgear panels (Figure 2). Air is often employed as an insulating medium, giving room for more design and line-up flexibility. The main functions and features of an MV switchgear panel are to separate electrical failures, such as an arc flash, from the rest of the switchgear system, keep people safe and reliable, be easy to maintain and compact, be able to deactivate ground switchgear parts, and be active for several decades. The basic design of the contemporary MV switchgear is largely dictated by these factors. The entire electrical system is sealed in metal, and doors are often fitted with interlock mechanisms. Segregation walls separate switchgear from its neighbors, and they can be provided with an air blast duct to direct hot gas from an arc flash away from the switchgear via an integrated chimney. Switchgear may be separated into various compartments: a cable, breakers, and busbar compartments for high-voltage components, such as current-carrying, opening, closing, and insulations, and a low-voltage-control equipment compartment (Figure 2), which allow major safety devices, such as breakers, to be taken out of the switchgear so that they can be serviced or changed.
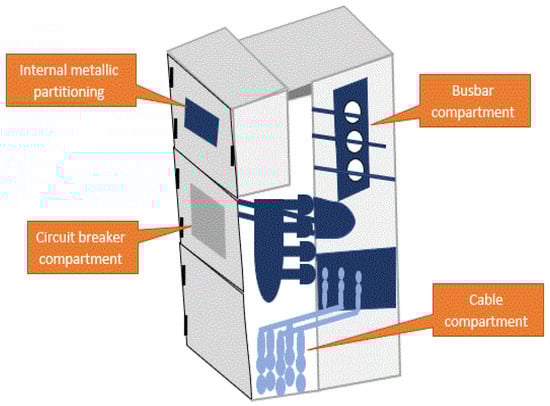
Figure 2.
A panel of medium-voltage switchgear.
An MV line-up often has a central busbar system that runs through all panels. The center system consists of three horizontally individualized busbars for each phase. Vertical feeder busbars are linked to the central system in each panel, which electrically connects to the items in that particular panel. Individual panels may be set up to function as just an in-comer, feeder, or bus-coupler. Many different panel topologies exist in the field, although their specific geometry is mostly determined by the voltage rating (7.2 kilovolts (kV)—36 kV) and current rating (630 amperes (A)—3150 A). As an extensively utilized device in power systems, the safe functioning of MV switchgear has become a hot subject of growing concern. To reduce switchgear power outages and make maintenance more efficient, the switchgear’s associated conditions should be checked [6]. MV switchgear also serves as a means of distributing electricity from power transformers to feeders or consumers [7]. In energy-entering regions, such as communities and village rail systems, MV load-break switchgear devices are installed. Load-break switchgear is a device that cuts power in the neighborhood by employing overloads or in situations where neighborhood energy must be turned off for repair. Voltage is provided from 12.5 kV to 36 kV to areas such as communities, and electricity may leap up to specified distances, posing a catastrophic threat. Distances were previously measured in air, and then the electrical creepage lengths were lowered by operating the systems in hydraulics [8]. The major components of MV switchgear are nitrile O-rings, polymethyl methacrylate (PMMA), zeolite molecule sieves, perfluoralkoxy alkane (PFA), and polycarbonate (PC), all of which have been chosen for long-term aging with the perfluoroisobutyronitrile (C4F7N) gas combination. It is used to see how the electrical properties of the aging gas mixture change after being aged, which can be achieved by means of breakdown tests [9]. Applying predictive maintenance techniques to MV switchgear identifies three primary obstacles. The first challenge is to identify adequate sensors that can reliably and robustly detect important physical quantities across the switchgear’s lifespan. The sensors must also be able to endure the harsh circumstances in which the switchgear is used. The absence of measuring data is the second issue. Continuous temperature monitoring for switchgear is unusual, if not nonexistent, during its extended lifespan. Switching operations for breaker drive monitoring can be carried out exclusively a number of times yearly. This is done for the purpose of maintenance. Therefore, there is a scarcity of measurement data, in either case laying the groundwork for the creation of artificial intelligence (AI) and ML algorithms [10]. Failures of MV-switchgear in distribution systems have been reported every now and then due to various failure modes, such as mechanical failure, partial discharge (PD), etc. Since electrical power demand is increasing day by day due to fast-developing modern technologies, the population of switchgear is also increasing. Hence, the condition of switchgear cannot be taken lightly, as it can contribute to the increase in operation costs and wastage of spare parts if not managed wisely, which can directly affect the finances of the company. A thorough study should be conducted to fully utilize the asset by mapping the parameters involved in handling the switchgear. Several factors need to be considered before taking outages to put the system off because it not only can increase maintenance costs but also interrupt the power supply to the customers. Therefore, wise/proper planning can be made, particularly to the defective switchgear for investigation or repair works.
The rated value for the insulation level of the switchgear must be selected based on the requirements at the site, e.g., on a 33 kV or 11 kV network. Consideration is also made for lightning and switching overvoltage impulses and earthling/neutral configuration. Switchgears used in distribution networks utilize these forms of insulation within the switchgear enclosure [11]. Table 1 details three type of switchgear. Sample of air-insulated switchgear, oil-insulated switchgear and gas-insulated switchgear are shown in Figure 3, Figure 4 and Figure 5.

Table 1.
The three types of switchgear.
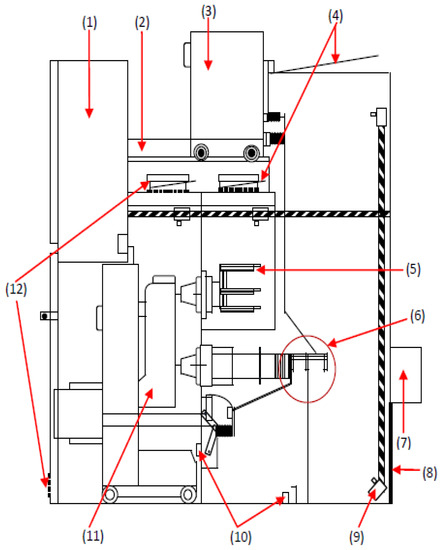
Figure 3.
Side View of AIS Switchgear. 1. Metering Compartment. 2. Railing. 3. Draw out VT Truck. 4. Pressure Relief Flap. 5. Busbar. 6. Cable Termination. 7. Multi Core Cable Box. 8. Earth Bar. 9. Arc Protection. 10. Heater. 11. Vacuum Circuit Breaker. 12. Air Filter.
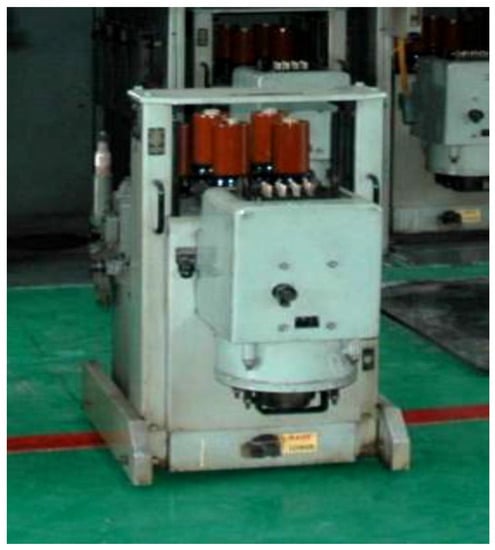
Figure 4.
Sample of bulk/minimum oil circuit breaker [13].
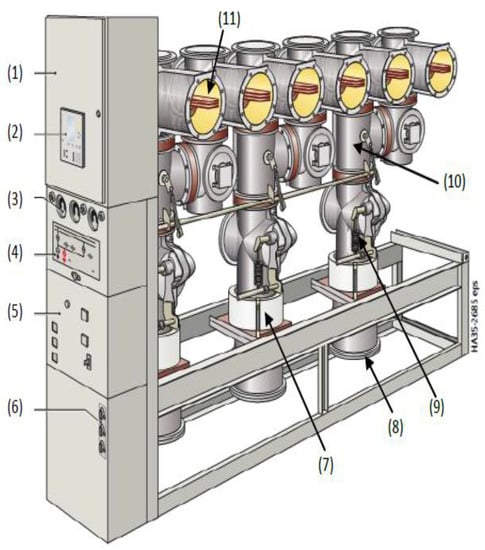
Figure 5.
Example of GIS. 1. LV compartment. 2. Relays. 3. Gas density meter. 4. Single line diagram/semaphore indication. 5. CB operating mechanism. 6. Live indicator. 7. Current transformer. 8. Cable termination. 9. Circuit breaker. 10. Disconnectors/Isolators. 11. Busbar in SF6.
- Air-Insulated Switchgear (AIS)
- Oil-Insulated Switchgear (OIS)
- Gas-Insulated Switchgear (GIS)—SF6
1.2. Breaker Drive Monitoring
The main responsibility of the circuit breaker in the switchgear is to safeguard the electrical current by stopping current leakage and isolating damaged components from the power grid. The breaker is often divided into four subsystems from a mechanical standpoint: drive, linkages, pole, and enclosure (Figure 6). In application fields, whereby the drive sub-system is the source of energy used in a close and open operation, mechanisms that are driven by spring are commonly adopted. The interval between the transmission drive and the pole involving the electrical connections that limit the fault currents is represented by the linkage. The motor and connection are contained in a metal box, and the pole is insulated with a special substance. A recent examination of electrical component failure statistics in an MV distribution network [14,15] has demonstrated that in MV switchgear, the breaker is the principal component that is prone to failure. Mechanics are the cause of about 90% of all breaker problems, which can cause problems with the breaker motor and working mechanism [15].
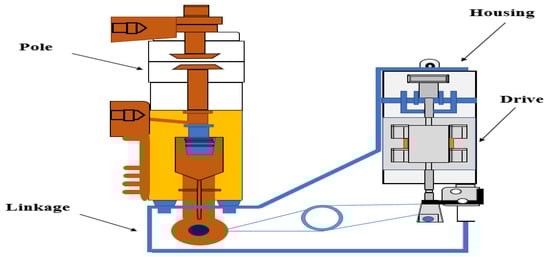
Figure 6.
Circuit breaker for medium-voltage circuits.
Circuit breaker failure mechanisms have been reported in [16]. The vibration signals generated by switching activities at the breaker housing serve as the foundation for monitoring technologies that allow for early fault identification and potentially catastrophic failure prevention. Advanced vibration monitoring systems identify early indicators of operating mechanism deterioration for various common failure types, including “wear,” failures in springs and dampers, and excessive friction owing to improper lubrication, by contrasting unhealthy and healthy breaker states [16] Therefore, circuit breakers require a device to control or remove the arc; the four common mediums used to extinguish an arc during breaker contact separation are Oil, Air, Gas, and opening in a Vacuum. Table 2 explains the MV circuit breaker types.
Table 2.
Medium-voltage circuit breaker types.
1.3. Thermal Monitoring
In a process known as Joule heating, the electric current passes through a conductor and creates heat. According to Joule’s first law, the quantity of heat created is influenced by the current (I) and resistance (R), which are power (P) equal to I2R. As numerous problems increase the pressure of electrical contacts, such as degradation, breakdown of connections, and corrosion, their existence may be identified by temperature monitoring. For examples [24,25]. Furthermore, the greater current generates more heat, which accelerates the depreciation of electrical equipment and reduces its lifespan. As a result, MV connection temperature monitoring is an important indicator of system failures and component servicing needs. Therefore, schedule maintenance is to keep things from breaking down, cut down on downtime, and prevent future losses, damages, expenses, and even human injuries [26]. Temperature monitoring of MV and low-voltage (LV) device connections is needed to predict how well a product will work and to keep customers safe. Before a contact’s deterioration becomes harmful, a warning should be generated, and predictive maintenance actions may be scheduled without jeopardizing the MV system’s service continuity. An example is cable terminations and bushings in MV gas-insulated switchgear (GIS) [27]. Due to the difficulty of accessing the conductor, measuring its temperature using traditional extreme temperature sensors also becomes difficult [27,28].
This paper aims to review the brief status of the recent development of CBM techniques with faults in switchgear, in which the switchgear is considered to have a defect when there are corona, tracking, and arcing while it is in normal condition if there is no PD sound. Additionally, evaluation of deep learning (DL)-based smart diagnostics that were used to identify partial dis-charges, localize them, DL techniques are discussed, and categorized the key features of each method’s benefits and drawbacks of various DL algorithms are also examined.
2. Types of Testing on Switchgear
The following are typical tests for checking the condition of switchgear:
- Thermography—to detect any loose connection or high-resistance surface between electrical contacts.
- Ultrasound—to look for any sign of partial discharge (PD) on the outside or on the surface.
- Transient Earth voltage (TEV)—To see whether there is any PD on the inside.
- Gas pressure checks—To examine the GIS switchgear for any SF6 gas leaks.
- Trip test (online timing)—The circuit breaker must be tested in an energized state to ensure that the first trip worked.
- Visual inspection—To examine the switchgear for any defects [29].
The present research is centered on PD. In electrical engineering, a localized partial discharge that does not entirely bridge the gap between two conductors is referred to as a PD. It may occur in solid, liquid, or gaseous insulating mediums. In a solid-insulating system, the presence of PD is undetectable. However, long-term PD may degrade solid insulation, resulting in eventual insulation failure. The following conditions may be classified as PD:
- Ultrasound—external/surface PD.
- Transient Earth voltage—internal PD.
3. Types of Faults on Switchgear
3.1. Corona
Corona is the faint light that surrounds an electrical conductor caused by the ionization of air when nitrogen in the air breaks down. When nitric acid is mixed with moisture, nitric acid is produced. This acid also destroys insulating materials and metallic mechanisms, potentially causing heat difficulties. The most hazardous element is that it occurs without causing a flashover because corona formation happens when nearby air is strained past its ionization threshold and occurs virtually quietly. When electrical stress surpasses the insulative properties of air (as illustrated in Figure 7), the air across the layers of the insulating becomes charged. Corona finds its way to Earth, as seen in Figure 7 [30,31].
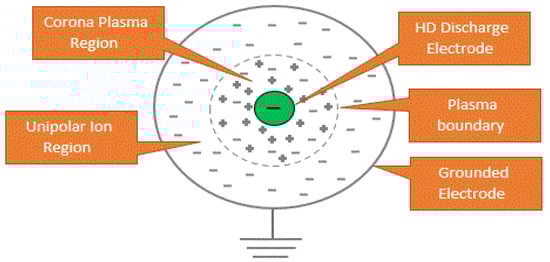
Figure 7.
Process of ionization.
Corona discharge occurs when a neutral atom or molecule is exposed to a high-voltage gradient, which ionizes it and starts an avalanche process [31]. When there is no use of shock in managing electric field intensity, high-voltage equipment may experience the spontaneous occurrence of instantaneous corona discharges. A corona can be created in instances where there is a strong electric field around the conductor, which can generate a conduction band. Although it does not have the strength needed to simply produce an electrical discharge in a device, there is a breakdown or arcing, as presented in Figure 8a–c.
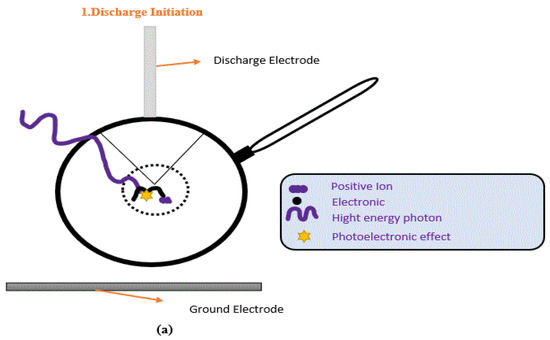
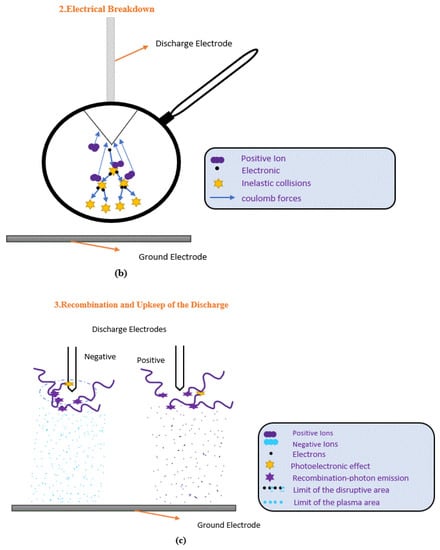
Figure 8.
(a–c) A corona discharge is a phenomenon that occurs in the air.
The conductance and avalanche processes are influenced by the electrode material. Highly conducting materials generate a strong electric field, energizing a large number of free electrons and causing severe corona discharge defects. Copper (Cu) and stainless steel (SS) are two of the most common metals used in MV switchgear because they are both more conductive and more durable than other metals and have a conductivity of 5.96107 siemens per meter (S/m), which is greater than that of SS, which is 1.45106 (S/m). Cu, in comparison to SS, causes more corona discharges in MV switchgear under high-voltage stress. Air, known to have molecules that are electrically neutral, is an insulator. There is an alteration in the molecules whenever energies of high magnitude flow as electrons from an electrode and collide with molecules. Energy is absorbed by the electrons around the atomic nuclei; these electrons transition to high energy levels and separate from their constituent atoms or molecules, leaving a positively charged ion and a dissociated free electron. This avalanche process creates a mix of electrons and ions, as new electrons are created by electrons that have been hit by other electrons [32]. As a consequence, another condition for corona discharges is the presence of light indicators of strong locally applied electric fields that enable persistent discharge into the atmosphere [33]. Moisture plays an important role, such that when a value in air or gas is surpassed, a corona discharge develops, resulting in the formation of ozone and ultraviolet, oxides of nitrogen, sound, electromagnetic emission, and nitric acid. Ozone is a pungent gas that causes rubber-based insulation to fade. Violent nitric acids may occur when there is a lot of moisture or humidity in the air; they target specific metallic compositions, such as copper and other metals, as well as most dielectrics, producing corrosion. Furthermore, tremendous energy from certain discharges causes mechanical, electric, and thermal damage [34]. The electromagnetic emission may be recognized as a disturbance on amplitude-modulated (AM) radios, and the corona sound can be recognized by human ear and ultrasound monitoring instruments. As seen in Figure 9, spectrum analysis software may be used to view the recorded ultrasonic signatures of a corona’s wave pattern. The sounds of the corona are akin to those of frying, torrential rain, or a continual buzzing sound [35].
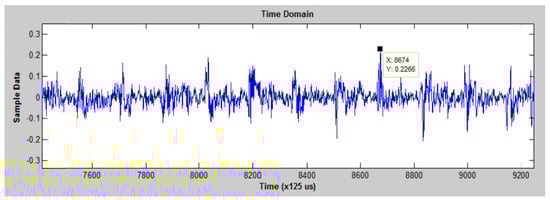
Figure 9.
The wave pattern of a corona [35].
Hence, a corona, for example, signals voltage difficulties and may persist without current flow due to its primary source, which is high potential inside the electric current. The negative (−) and positive (+) positions of a 60 hertz (Hz) rotation have the most corona effect. Corona problems are caused by three basic causes:
- Spatial factors;
- Geometric factors;
- Contamination.
Insulation boards, narrow air gaps among conductors, and switching cabinet components all have these spatial characteristics, which may be caused by the following:
- Grounded surfaces interact with non-shielded cables.
- Conductors are tie-wrapped together.
- Busbars are close to the insulator material, and contamination is present on ceramic (an example is shown in Figure 10, [36]).
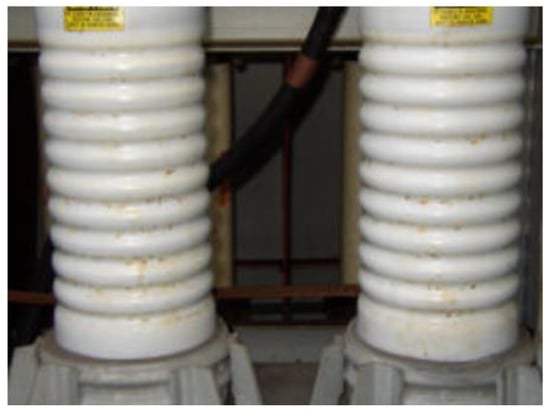 Figure 10. Contamination on ceramic bushing is caused by corona discharge [36].
 - Conductors touch the edges of cabinets, insulators, and conduits.
3.2. Tracking
Tracking (also known as “baby arching”) traces the path of dirty insulation and deterioration over the exteriors of modules. In another way, when the corona is turned on, it creates a conducting mist of air surrounding itself and leaves a conductive path on the exterior. With high-voltage and MV components, tracking occurs such that a carbon track forms on the insulator and conductor. As a result, the time it takes for short-circuit or overheating is determined by the distance between the ground and the phase. Figure 11a,b depicts carbon tracks on insulators in the switchgear compartment caused by a- and b-phase fuses [36,37].
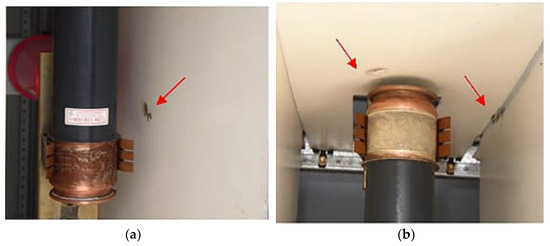
Figure 11.
(a,b) show between a-phase and b-phase fuses; carbon trails may be seen on the insulation [36].
The recorded ultrasonic signature of the tracking’s wave pattern can be seen using spectrum analysis software, as shown in Figure 12 [37].
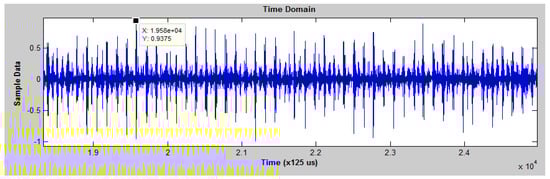
Figure 12.
Tracking wave pattern [35].
From an engineering point of view, tracking is the progression of the creation of a solid channeling track over the exterior of the insulation caused by exterior erosion under voltage application. This incident occurs in all types of polymeric insulators (PI), both indoor and outdoor applications. PIs are always in contact with moisture and/or dust and create a conduction film on the outer layer. During the operation of the PIs, the film begins conducting and causes dryness to the outer layer due to the heat generated. The film then creates sparks, and an insulation fiasco occurs when the whole film is carbonized [38]. Tracking can be identified as a constant buzzing noise with sporadic crackling. The noise is almost similar to that of the corona but has gaps and likely drops in concentration. However, it can swiftly steer to arcing due to further damage when tracking is not altered [39].
In this study [40], the process of tracking was divided into four phases based on the experimental discharge phenomena, discharge automatic methods phase diagrams, and corrosion degree of materials: commencement, safety, development, and outbreak. The micromorphology of the materials was studied using a scanning electron at various phases of tracking. The findings revealed that when surface morphology changes and surface products develop during tracking, the amount of the Carbonyl (C) attribute in the material’s spherical area declines first, then grows, whereas the amounts of oxygen (O) and SuperADM Interferometer (Si) increase first and then decrease. The epoxy group of the material decomposes over time. During the outbreak stage, a carbonyl group is formed on the material’s surface, which subsequently degrades. Furthermore, the processes of thermal aging and tracking degradation vary. Thermal aging allows for easy electron injection into the materials during tracking, lowering the material’s tracking and erosion resistance [40].
3.3. Arcing
An arc defect is an electrical discharge caused by an old wire, weak junction connections, or an external incursion that damages insulation [41]. Because arcing terminates electrical power via bulk or air insulation as Figure 13, all arcing forms impact the standards of power and occur at all voltage levels. Arcing is jarring and might come out as nearly “violent.” It starts strong and soon fades away. Arcing creates a high-current route to Earth, and it is usually accompanied by a lot of heat and noise. It is a constant source of anxiety. Corrective action must be taken as soon as a failure occurs. As seen in plant facility operations, both machinery and people may be severely harmed by arcing. Electrical arcs often result in insulation loss or destruction, dissolved connections, and fires. Figure 14 illustrates dust on a bushing that is responsible for arcing [36]. Arcing can be simply detected and heard via ultrasound.
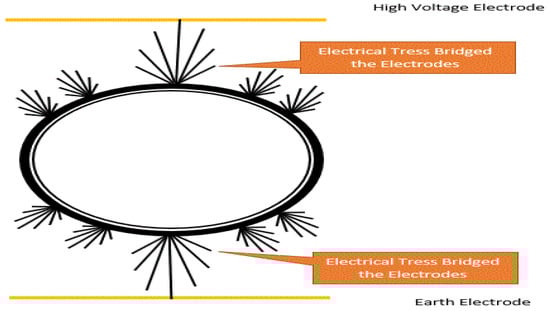
Figure 13.
Discharges across an insulator to the ground.
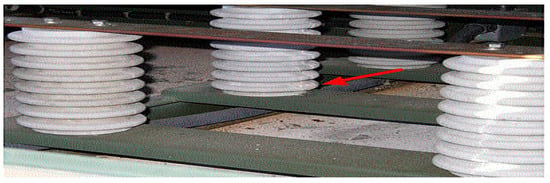
Figure 14.
Dust on a bushing supports the arcing condition [36].
Normally, a popping noise is heard when electrical switches are turned off or on, indicating that arcing has occurred. Arcing is of two types [42]:
- Type 1—Serious havoc is wreaked on a single precise wire, which is called a series arc fault. When the wire cannot tolerate the motion of the current, arcing occurs at the openings within the conductor and finally runs into the insulation.
- Type 2—The outcome is a short circuit when the current travels over the havoc insulation and runs from one conductor to another. This condition is called a parallel arc fault. In other words, the circuit breaker does not trip because the short circuit is not strong. Therefore, the current creates an arc and runs across the whole insulation, which is called a leakage current.
The alternate current (AC) series arc is hazardous, posing a high risk of electric fire and loss of property [43]. A series arc fault has many random nesses, is hard to see, and does not show big changes in current magnitude [43,44]. Electrical arc defects may be classified into the following categories based on their location:
As a result, (1) the fault happens in series with the load, and (2) subsequently, the fault arises across conductors of different polarity (parallel fault shown in Figure 15), broken wiring overheated or strained electrical cables, aged electrical insulation, cables and/or wires in interaction with vibrating metals, damaged electrical equipment, and other causes that may all cause these failures. The resistance of the load helps keep the current in the series arc fault shown in Figure 15 from being too high [45].
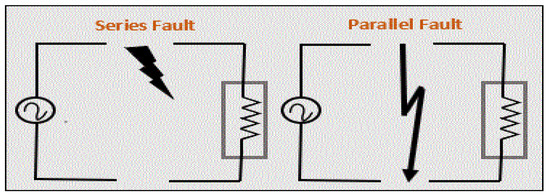
Figure 15.
Electrical arc fault classification.
A variety of direct current (DC) arc defect models have been compared [46]. Insulation deterioration and thermal stress are the two most prevalent non-contact causes of arc-flash events in MV switches and MCC [47]. Table 3 summarizes the many forms of switchgear faults.
Table 3.
Summary of faults on the switchgear.
4. Types of Condition-Based Maintenance
Condition-based monitoring is at the heart of condition-based maintenance (CBM). It makes use of some performance indicators to monitor the state of an asset. This task may be completed by maintenance teams using a range of tools and methodologies. These measures include low-tech approaches, such as technician observation, and technologically advanced operations, such as data collection by sensors. The advantage of CBM is that it is non-invasive. Without shutting down or modifying the way the machine functions, measurements were taken. Devices, visually inspecting performance data, and/or planned tests are used to gather data at specific intervals or continually. Table 4 summarizes some of the strategies used in the CBM.
Table 4.
Summary of the Types of Condition-Based Maintenance.
5. PD Background
Localized electric stress concentration in the insulator or on the surface of the insulation causes PD. In electrical assets, PD is both a key cause and a signal of growing, possibly failure-causing insulation flaws. PD activity grows more intense and riskier over time. The degradation might progress until the insulation is no longer able to sustain electrical stress, resulting in flashover, expensive asset damage, and unplanned outages [57]. Depending on where it occurs, PD is classified into two primary sub-groups: internal and external PD [49]. When this happens, it indicates the sensitivity of the electric insulation to locally applied electric field stress. Although the link between Parkinson’s disease and the impending failure of an electrical network is yet to be known, in many situations when a breakdown occurs later, PDs are known to be observable. PDs are typically modest in size, but they may cause gradual insulation breakdown over time. According to material, thermal, and electrical stress, electrical insulation exposed to strong electrical fields tends to disintegrate. Insulation breakdown causes PD, which is both a symptom and a mechanism for additional insulation deterioration. As a result, the monitoring of PD intensity and type may be utilized to assess the insulation’s status. Furthermore, it is deteriorating over time in [54] and references therein, for example, may be anticipated over time based on detecting a progressive rise in PD activity.
Various sensing modalities have been investigated to monitor PD activities, including electric charge impulses, chemical changes, acoustic pressure wave emissions, and electromagnetic wave radiation. These PD-generated products may be monitored and studied using a variety of sensors and signal processing methods. To achieve adequate monitoring performance, a variety of approaches that involve electrical systems, according to the International Electrotechnical Commission (IEC) 60270 standards and other non-conventional approaches, have been developed and used for PD testing. These approaches may be categorized as offline or online detection methods depending on how they are measured. As opposed to offline monitoring, online monitoring is gaining popularity since it minimizes power interruptions and less disruption to the system’s performance. Figure 16 introduces and summarizes these approaches to PD data collection detection [58].
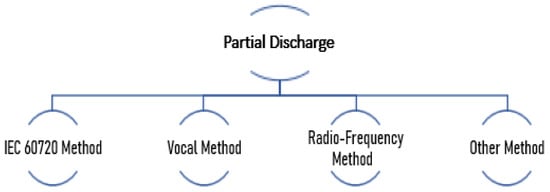
Figure 16.
Summary of PD data collection methods.
5.1. IEC 60720 Method
Precision and the ability to measure PD levels in disconnected situations make the IEC 60270 Standards well-known. Figure 17 depicts the checking circuit for this approach, which contains the main circuit components of the testing item (Cx), coupling capacitors (Cb), and measuring impedance (Z). Present impulses below 1 megahertz (MHz) caused by PD activity in the test item may be recorded and connected to the measuring impedance by the coupling capacitor. To demonstrate the characteristics of PD events, the signal may be shown in the time and phase domains [59]. There are two types of PD activity patterns that show how discharge amplitude (q), and the number of cycles (n) are related. Phase-Resolved Partial Discharge (PRPD) and Phase-R-esolved Pulse S-equence (PRPS) are two of them in terms of phase position (φ). They were suggested by [59] in 1990, and are mostly according to statistical aspects to depict the distinct style of several forms of PD faults. Surface discharges, void discharges, and corona discharges are the three forms of PD patterns. Due to the information from the q − n − φ representation, these patterns may be categorized based on past contributions [60]. However, one of the major limitations of PRPD and PRPS is that they are unable to distinguish between source types when numerous kinds of defects are present, and phase domain information overlaps might negatively impact PD classification performance.
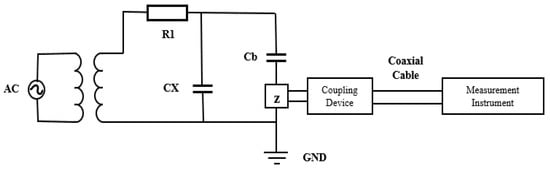
Figure 17.
IEC 60270 PD testing circuit.
Researchers have examined numerous techniques for the continuous monitoring of detection methods in high-voltage equipment to solve the problems faced in the deployment of online management through the IEC 60270 standard approach [61]. An experiment that employs a real post insulator with a micro-crack fault was carried out in [62]. For a full study, the key factors depending on the IEC 60270 standards and the radiofrequency signal were measured concurrently. The findings revealed that the GIS insulator may have certain submillimeter fracture flaws.
5.2. Acoustic Method
Acoustic emission is frequently engaged, mostly in discharge processes owing to excessive electron vibration, and the sampling rate for detecting acoustic emission is 20 kilohertz (kHz) −1 MHz. Due to its benefits, such as little sensitivity to electrical noise and the ability to detect discharge locations, the acoustic approach is utilized for PD monitoring systems [63]. Externally installed piezoelectric sound sensors allow for convenient online monitoring of PD actions without the need for power loss. The quantity of energy in the PD source, as well as the route of the signal, determine the sensitivities of acoustic measurement. Solid, liquid, internal insulation, and the outside construction of the operational equipment have the tendency to, in a good way, affect the propagative features. Furthermore, depending on the length between the sensors and the PD source, acoustic attenuation might be rather considerable [58]. The acoustic style of PD measurement is related to the traditional electrical style, in which PD is measured in various conditions using AET. Previous studies have compiled a list of equipment. [64] reviewed all-acoustic approaches and integrated acoustic–electrical treatments for PD.
5.3. Radio Frequency Method
When PD happens, the radio frequency (RF) technique uses appropriate sensor equipment to detect and collect the generated electromagnetic pulse. If onsite testing is required, it makes the sensor installation accessible and flexible. The results, on the other hand, can only disclose the presence of PD flaws and not their precise position. Therefore, due to the huge size of the physical dimensions of the sensors, and the tendency of the interior installation to be difficult and risky, the VHF approach is seldom employed in practical applications. Meanwhile, because of its noisy immunity and localization efficacy, the UHF technique is commonly used to monitor systems of PD sources [65]. As the measuring frequency extends between 300 MHz and 3 gigahertz (GHz) [66], a value that exceeds the electronic, the UHF approach has a good signal-to-noise ratio. UHF sensing (antennas) is placed in equipment by means of oil drain valves or dielectric windows to collect UHF signals.
5.4. Other Methods
Optical sensors are mounted on power equipment to implement the optical approach. This method’s competitive advantage is its resilience to electromagnetic interference (EMI). However, owing to reflecting light, scattering, and attenuation, a fundamental disadvantage of this technology is that the internal barriers in the equipment have a negative impact on sensitivity [66]. The expensive cost of optical sensors is another disadvantage of this technology. Regarding PD detection based on chemical compounds produced by discharge, dissolved gas analysis (DGA) is often used. PD activity may be identified by a precise examination of an oil sample collected from the transformer. Nevertheless, the position cannot be determined only by looking at the chemical components, but it can be changed on a regular basis. As a result, DGA is seldom used in real operations to identify emergency failures [66].
6. Artificial Intelligence
Artificial intelligence (AI) is a less cost-consuming alternative than traditional modeling techniques. It is a unit in computer science that deals with the creation of robots and software that have an intelligence similar to that of humans. Artificial intelligence is more effective than traditional techniques in addressing ambiguous problems. Therefore, it is the most suitable tool to be used in such conditions. In addition, when there is difficulty in testing, solutions that make use of artificial intelligence are the best options to be employed to detect engineering design traits that lead to less cost of human testing labor. AI can also help with decision-making, mistake reduction, and computer efficiency. Three approaches, namely pattern recognition (PR), deep learning (DL), and ML, have lately been pressed and have turned out to be the new trend of intelligent engineering solutions [67]. Based on the papers that have been examined, we used DL in our study for the following reasons:
According to a literature study on ML algorithms, DL has been used in switchgear failure classification. Because feature extraction may be avoided when the input data are processed immediately by the algorithm, the proposed study intends to increase performance in prediction accuracy, speed of processing, and user-friendliness. Furthermore, compared to simple ML algorithms, DL provides extra capabilities. It teaches representation from data, such as photos, videos, or texts, without the need for hand-coded rules or experts.
7. DL-Based Method
DL is known as a form of artificial intelligence (AI) technology that provides room for speech recognition, computer vision, on-machine translation, mobile phones, self-driving cars, AI-based gaming, and other applications. When we use Microsoft, Facebook, Twitter, Apple, or Google consumer goods, we interact with a DL system. A computer scientist, John Kelleher, in the MIT Press Essential Knowledge series, has given an easy, fast, and complete introduction to the basic technologies at the core of the AI revolution [67]. According to Kelleher, DL allows choices that are data related by detecting and extracting patterns across massive datasets; its capacity to learn from complicated data makes DL suitable for leveraging big data’s exponential expansion and processing power [68]. As such, an increase in training data quantity is not a sustainable means of improving it. Being a subset of ML procedures, attention is given to DL because it does not make use of feature engineering and can achieve tremendous performance in the availability of a large amount of data as well as revolutions in methodologies and technology. It has several fully connected layers that are useful in classification algorithms (generally, softmax). Mathematically, they can be compared to multilayer perceptron (MLP) and BPNN. The hidden number of neurons is above three. Catterson et al. used UHF PRPD to construct a DNN-based PD classification approach [69]. This is one of the first studies to employ DL in the diagnosis of PD. Each input sample in this experiment was comprised of 50 PRPD power cycles with a 5.625 degree (°) phase window size, yielding a 3200 × 1 1D matrix, with the respective phase windows signaled by the value matrix. Some neurons, latent layers, and different forms of activation properties, such as sigmoid and rectified linear units (ReLUs), have all been studied. In comparison to the sigmoid function, the activation function performs better with a richer structure. This almost all the time applies to DL because ReLU successfully mitigates the challenge posed by the disappearance of the gradient in the course of the training [70]. When compared to simple ANNs with sigmoid activation functions, the classification accuracy of a DNN with five hidden layers and ReLUs may improve from 72% to 86%.
7.1. Autoencoder
An autoencoder (AE) is a data dimensionality reduction approach that consists of an encoder and a decoder. It is an unsupervised, deterministic, feed-forward neural ANN design. The encoder is a neural network model that converts a high-dimensional, low-level input data vector to a low-dimensional, high-level latent space vector , which includes essential information defining the distribution of input data. The encoder is mathematically represented by the equation.
where Wenc and Benc are the matrix and biases vector, respectively, and x denotes the input vector. Fenc is a nonlinear activation function that conducts nonlinear transformations on the linear mapping Wencx + Benc. It is a sigmoid, hyperbolic tangent function (tanh), ReLU, or linear function in general. The decoder is also an artificial neural model that reconstructs an approximation of the input data vector x by using the latent vector z as the input. The equation may be used to represent this model.
is the reconstructed vector, while Wdec and bdec are the decoder’s weight matrix and bias vector, respectively. The AE is taught to learn and update weight matrices and bias vectors; for each input vector x, an estimate vector x is calculated and compared to the original goal. This process of learning is carried out by minimizing errors. The mean squared error (MSE) provided by the equation below is the most frequently used cost function for this kind of structure.
Figure 18 illustrates two different forms of AEs. A shallow AE (SAE) is made up of three layers: an input layer, an output layer, and a hidden layer. A deep AE (DAE) is accomplished by adding extra latent layers to both the decoder and the encoder. Both designs have the same input and output dimensions [71]. A variety of methods can be used to protect AEs from having to learn identity mapping and to enhance their performance by assessing the importance of knowledge and learning richer representations [72].
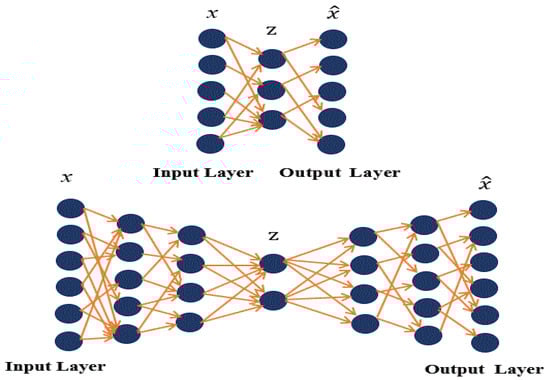
Figure 18.
Autoencoder architecture.
- a
- Regularized AEs
- Sparse AE (SAE);
- Denoising AE (DAE);
- Contractive AE (CAE).
- b
- Concrete AE
- c
- Variational AE (VAE)
A number of AE variations, including s-parse-AE (SAE) [73], denoising AE-(DAE) [74], and finite difference AE (VAE), have been suggested to increase performance [75]. There are two common techniques for building AEs with a schema. The first is generated by stacking several AEs together to create a “stacked AE.” The output of the first AE’s encoder is utilized as both inputs to the next AE. The stacked AE is then established using greedy layer-wise pre-training. Figure 19 depicts the standard procedure for manufacturing a stacked AE.
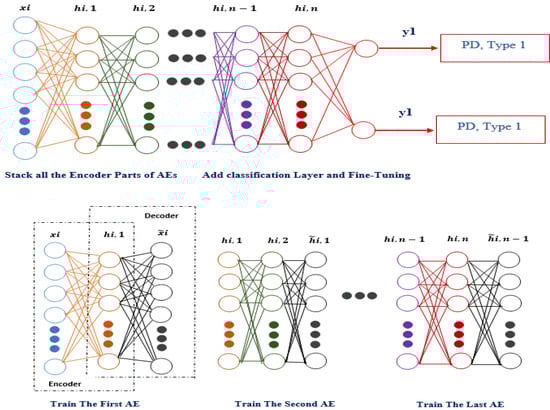
Figure 19.
Stacking AE diagram for PD categorization.
The impact of the number of SAE layers, training data, and neurons in the final SAE’s hidden layer on classification results has undergone an in-depth exploration. The suggested DL-based technique was compared to a support vector machine (SVM) classifier using PRPD statistical features, and the suggested DL-based method outperformed the SVM classifier according to the feature learning to classify. The best efficiency was achieved when there were three or four SAEs. Furthermore, according to the experimental investigation, the number of neurons in the final SAE’s buried layer had less of an influence on accuracy. Duan et al. [73] devised an end-to-end SSAE-PD classification procedure through the use of the PD current waveform, which is gathered by using HFCT as the inputs to the DL-based framework in view. To obtain the best collections of hyperparameters, researchers looked at the impact of the number of hidden nodes, sparsity parameter, framework depth, and activation purpose on the accuracy of PD classification. According to the testing data, a single SAE paired with SoftMax may achieve adequate performance. Conventional approaches, as predicted, have proven to be ineffective in comparison to the suggested DL method. According to the authors, it is used as a feature extraction methodology to create distinct characteristics, which runs counter to the original concept of DL: the extraction of features automatically while no human experience is used. However, further research and comparison investigations should be carried out.
In the encoder and decoder components, the second technique for building AEs with a deep structure replaces a single layer that has numerous layers. Dai et al. [76] used VAE and raw UHF PRPS data to create an approach for PD categorization in GIS. The VAE is taught in an unsupervised manner using experimental and operational datasets gathered from over 30 Chinese substations with forty-two distinct examples of power equipment breakdowns. Evaluating the efficacy of data matching, individual test samples that are a subset of substation fields dataset, is by the use of the encoder of the trained VAE, mapped to a hidden space. Researchers who research a complicated field dataset say that DL-based techniques, such as convolution neural network (CNN), deep belief network (DBN), and the proposed VAE, are better at finding unique types of PD than the traditional method of matching data based on statistics. The suggested VAE outperforms the other two DL-based approaches. Even though the efficacy of ML-based PD diagnoses may be enhanced by utilizing adequate labeled data, one of the primary difficulties that all businesses encounter is huge, high-dimensional, unlabeled data, which Zemouri et al. tackled in [75]. Due to its time consumption and its need for considerable personnel resources, labeling any obtained data is not an efficient choice.
The researchers then used a convolutional VAE-based DL model with minimal labeled PD data to create a PD classification scheme for hydrogenators. The Convolutional VAE’s encoder is mostly utilized as a deep network extraction, while classification is handled by a DNN that has a number of fully linked layers and a SoftMax. A key problem in this study was determining the minimal data quantity for training and selecting the most important PD data for labeling. According to the authors, the optimum features are not always determined by DNNs from a randomly chosen small quantity of labeled data [77]. Barrios et al. suggested a technique for automating the A DNN model titled the convolutional autoencoder was used to classify PD references in electrical distribution networks (CAE), which could also extract features and characteristics from data to identify distinct sources [78]. The model was trained using a database that comprised genuine problems often seen in MV switchgear in operation, as well as noisy and interfering signals that are prevalent in these installations. Defective mountings, such as the breakage of a cable termination’s sealing cover or a ground wire when attached to a cable’s termination insulation, were PD sources. Four sources were reproduced in a smart grid lab, and PD signal data were obtained using online measuring methods. The PD signal was post-processed into a time-frequency picture representation using the continuous wavelet transform (CWT). The trained model was able to predict new data very well. This shows that the method is very good at automating the detection of distinct PDs and separating them from noise and other sources of interference.
7.2. Convolution Neural Network (CNN)
A CNN model is, in general, comprised of a feature extractor that is based on convolutional operators, layers that are fully connected for high-level reasoning, and classification layers, which are presented in Figure 20. The convolutional layers are said to be computationally less complex than fully linked as regards the important operations of matrix multiplication. This is due to the configuration approach adopted. Each of the neurons contained in a convolution layer is in contact with a minute set of neurons in the remaining layers. As a result of the architecture, regional features can be effectively obtained from the input sample using CNNs.
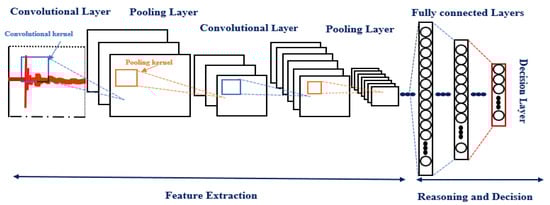
Figure 20.
A convolutional neural network’s general structure.
The following expression can be used to define the convolutional operation of the kth filter at the jth for an input matrix xj–1, P layers are from the last layer, K filters of size 𝐻ƒ × 𝐿ƒ and step size s = 1, and the convolutional parameters of the 𝑘th filter at the jth layer are:
xj denotes the size of the output feature map at the jth layer; ho = 1, ..., Ho, lip = 1, ..., Lo, and k = 1, ..., K are the row, column, and depth index of the feature maps accordingly; and represent the weight vector and bias coefficient of the kth layer. The filter in the jth layer, σ, signifies the activation function that is commonly ReLU for DNN, as it is capable of alleviating the gradient vanishing issue [70]. A pooling layer is often used through the respective CNN layers for dimension reduction purposes. The max pooling (MaxP) layer shown below is the most common layer:
In which the size of the max operator is represented by 𝐻MaxP × 𝐿MaxP, having size of the operations step as 1, while that of the output feature is 𝐻𝑜 × 𝐿𝑜 × 𝐾, aftwerwhich the hierarchical properties are discovered by the stacking of many CNN and pooling layers. For further explanation, the final pooling layer is reduced to a 1D vector and linked to fully connected layers. Lastly, to translate the integration into the target class, a classifying layer, the SoftMax layer, is connected.
Some groundbreaking CNN architectures have been proposed to achieve increased accuracy and reduce computational costs. Some of these architectures are shown in Figure 21 [79].
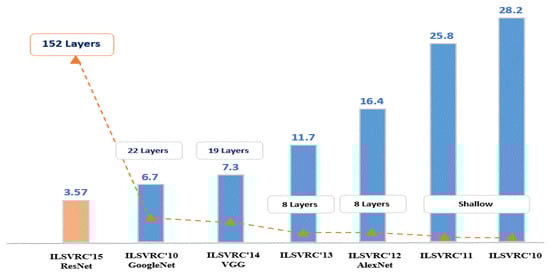
Figure 21.
Types of CNN explained.
- LeNet-5;
- AlexNet;
- VGG-16 Net;
- ResNet;
- Inception Net (GoogleNet).
CNN was first presented to handle image recognition issues using pictures as input samples (2D matrices). Li et al. employed a deep capsule network-based computer vision algorithm for detecting defects (corona, aging) in switchgear equipment [80]. Three photographs were taken using an ultraviolet (UV) camera, an infrared-ray camera, and a recognizable camera. The capsule network model then created a fused picture that included important information on UV strength, temperatures, and physical characteristics of the power apparatus that is being surveyed. The problems that happened in the switchgear were recognized and precisely depicted in the fused picture that was generated. In [81], Puspitasari et al. evaluated the effectiveness of CNN using 2D pictures of recurring signals acquired by various sensors in PD classifications (the segmentation of red, blue, and green (RBG) image data of the PD pulsing is transformed into grayscale for input layer).
Researchers have also utilized PRPS as an input to apply directly to 2D CNN. Wang et al. suggested a PRPS-based CNN-based PD identification algorithm [82]. As the CNN input, the PRPS raw data was transformed into an RBG color picture. The suggested method’s best classification accuracy is 91%. A data augmentation method was used to improve CNN’s ability to generalize. Environmental interference was placed on the PRPS raw data, and the superimposed data were processed into (rbg) images and layered with Gaussian noise for data addition. Data augmentation is useful in achieving the best classification rate, which is enhanced to 97.58 percent. Using CNN’s and Raw data from the UHF signal, Wang et al. proposed an end-to-end system for PD detection in GIS [77]. Instead of employing huge CNNs, such as AlexNet and Visual Geometry Group 16, a light-scale CNN (based on LeNet5) was developed to improve the CNN model’s time and diagnostic performance. Using the down-sampling approach, a 64 × 64 picture was downsized from an Image of Banalization of TRPD single-channel with a size of 600 × 438. The time-series data came from a laboratory experiment, as well as a simulation utilizing the finite-difference time-domain approach. Furthermore, a conditional VAE was used to enhance the data. Due to simulations and data augmentation, which may extend the training data with more variety, the CNN model’s generalization properties can be enhanced. The same author released another study in [83] on GIS PD classification, this time utilizing Mobile Nets instead of [77] (the input picture was downsized from 600 × 438 to 224 × 224). The gradient vanishing issue was minimized during the training of models with a deep structure using a depth-wise separable convolution operation and an oppositional residue architecture. On the test dataset, a 96.5% recognition rate was reached, which was better than other CNN architectures, such as VGG16 and Lenet5, which were used before. Overall, the two suggested frameworks may increase classification accuracy while reducing computation time, making real-time deployment of DL models on resource-constrained internet of thing (IoT) edge devices possible. Nonetheless, there is a need for further research. For instance, for the MobileNets parameter number, the needed storage capacity was 12.8 megabytes (MB), as the input samples were sampled at a rate of 10 giga-samples per second (GS/s) [83].
The viability of the suggested approach for PD classification requires online real-time validation trials, despite the fact that the computing cost has considerably decreased. Time-frequency analysis has been used to turn original 1D data into a 2D display, motivated by music recommendations and voice recognition systems, i.e., spectrograms [84]. Mel-frequency cepstrum coefficient (MFCC) analyses were used to transform the initial 1D time domain signal to a 2D spectral frame outlook. On a dataset that included internal, corona, and surface PD, the MFCC-CNN had a 96.3% success rate. Despite these encouraging findings, no comparison was made between the MFCC-Depend 2D feature and other forms of 2D features. In [85], the high-order statistics bi-spectrum of the HFCT signal was used as the source of ResNet-34, which was used to classify EMI in HV equipment. Corona, PD, and minor PD all had classification percentages of 80.83%, 92.87%, and 80%, respectively. Using the complicated bi-spectrum of HFCT impulses and the deep complexity of CNN, the same authors conducted early research on an EMI classification approach [86]. Corona, PD, and minor PD all had classification rates of 88.33%, 96.67%, and 74.17%, respectively. Comparative research has also looked into entropy and SVM, including DWT entropy.
Wang et al. developed a unique feature-fusion-based Dual-CyCon Net [87], which can use overall duration, phase, and domain characteristics to be learned in one cohesive framework. To calibrate the model’s sensitivity, we suggest a cycle-consistency loss that takes advantage of any relationship between the positive and negative half-cycles of an alternating electrical signal. It also addresses cycle-invariant PD-specific features, permitting the model to achieve noise-invariant and stronger detection characteristics. A case study illustrating the efficiency of combined learning and cycle-consistency loss on noisy measurements from high-frequency voltage sensors to identify broken power lines produced a state-of-the-art MCC score of 0.8455. Furthermore, 2D data may be formed by stacking numerous 1D time series signals (e.g., acquired from different sensors or channels). Banno et al. employed TEV and CNN to classify PD in switchgear [88]. To create a 2D input with two channels, a basic preprocessing approach was used, which included operational efficiency and productivity, scaling, randomized shifts and inversion, and pulse extraction (max and min). Following that, CNN was used to extract and classify features. Wang et al. suggested an online SF6 gas monitoring system that relies on CNN in GIS [89].
Pressure, temperature, and infrared photoacoustic sensing devices were employed to gather physical index readings of the chamber over time, which were then fed into a CNN classifier. The simple threshold and classifier outperformed the suggested technique. However, no information on CNN’s implementation was provided. Reshaping is another frequent 1D-to-2D conversion technique in fault diagnosis, including bearing fault and photometric fault diagnostics [90], in addition to the three conversion methods. 1D-CNN was recently proposed as a way to fill the gap between 1D time-series data and classification outcome, but it did not work even without any basic arrangements; information was recovered straight from a 1D time-series signal [91]. There were no differences between the training and test data [92]. When there were, the suggested 1D-CNN-based technique did better than the SVM-based and RF-based approaches in [92]. When there were differences, such as various locations and oil temperatures, the suggested technique showed improved generalization and beat traditional ML-based procedures with a reasonable margin in various conditions. This implies that some common features cannot be collected from the raw signal using 1D-CNN. However, handcrafted features in traditional ML-based approaches can be overfitted more easily on the training dataset. CNN is utilized by other applications, along with other extraction procedures. Research conducted by Zang et al. addressed the function of DL-based ultrasonic PD detection in a transformer [93]. Traditional RNN, DNN, and CNN models were fed a feature vector containing 193 handmade features, which obtained recognition accuracies of 89.4%, 91.2%, and 93.9%, respectively.
7.3. Recurrent Neural Network (RNN)
Recurrent neural networks (RNNs) do not have the same limitations, unlike feedforward networks, which map one input to one output. Instead, the length of their inputs and outputs may vary, and various kinds of RNNs are employed for diverse applications, such as music production, sentiment categorization, and machine translation. The following are the several varieties of RNNs: one-to-one, one-to-many, many-to-one, and many-to-many [94]. The RNN’s node-to-node linkages build a graph structure along a temporal sequence, allowing it to investigate the time series data’s dynamic properties. The LSTM model, or long-short-term memory, is among the most effective and well-known RNNs; it comprises numerous blocks of LSTM. LSTM is known to give more internal recurrence to standard RNNs, aside from the external. This is one of its benefits, among others. The LSTM model is easy to train with this change because the gradient can flow for a long time [95].
A state unit is one of the multiple components in an LSTM block that governs the flow of information. , Forget the gate component , secondary input gate component , and gate output component for the current input vector, layer index I, and time(step-t). The following is the mathematical expression of an LSTM block:
Here, hi, wi, ui, and bi denote the present hidden layer variable, which serves as the current LSTM unit output, reoccurring weights, and biases input weights for the jth layer of the LSTM block, and hi, wi, ui, and bi signify the current hidden layer variable, that is, the output for the current LSTM unit, reoccurring weights, input weights, and biases for the current. The parameters’ relationship to different units is indicated by the superscripts s, f, g, and q, while the sigmoid and tanh activation functions are indicated by the superscripts sm and tanh, accordingly. A good example of an LSTM unit is shown in Figure 22. After the LSTM model (which consists of numerous LSTM modules) obtains the input over time, fully linked layers have been used to process the LSTM model’s output in many-to-one or many-to-many modes. Then, to accomplish classification, a softmax layer is connected.
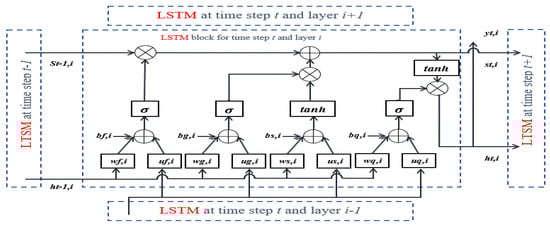
Figure 22.
An LSTM block in an LSTM model is shown in this diagram.
Researchers have also tried to apply LSTM directly to the automated extraction of valuable characteristics from Raw data sequences, including time-series data or PRPD time sequences. Adam et al. used Raw data onto PD pulse waveform and LSTM models to undertake a preliminary assessment of transformer PD categorization [96]. Even though the LSTM model has a poor architecture, it can still accurately classify PD with a 97.04% accuracy rate, which is only slightly lower than the RF classifier that makes its own features. With very complicated data sources, the LSTM model’s capacity must be further examined. in GIS [97]. The window length ought to be adjusted carefully to attain a satisfactory time-frequency resolution balance.
A 2D PRPD matrix is sent to a CNN at each time step. The x-axis shows the phase, the y-axis shows the relative amplitude of PD, and the values of the matrix show how many discharges there were at each time step in the past [98]. At the time step, the CNN output is coupled to an LSTM module after collecting the spatial information. All LSTM modules’ outputs are routed via a fully linked layer (many-to-many) that is accompanied by a softmax for classification. In this investigation, there were 100 LSTM nodes. According to experimental findings on a dataset with four typical insulation fault models, the proposed CNN-LSTM architecture performs CNN and LSTM on a dataset with four typical insulating defect models gathered in an oil-immersed power transformer. Other researchers have looked at the use of handmade characteristics in conjunction with the LSTM model. Dong et al. developed a strategy for detecting PD for aerial-covered conductors regarding time decomposition and the LSTM models in [99]. Using distinct seasons and trend decomposition using Loess, pattern, seasonality, and residual characteristics of voltage signals in one power cycle with multiple windows were retrieved. Then, from each window, three handmade residual component characteristics (numbers of peaks, total of absolute peak heights, and variance of absolute peak heights) were collected to build the LSTM model’s input vector. Noise reduction and oversampling methods were used. According to the research, four is considered the best quantity of windows (every window corresponds to data from a quarter power cycle), and a four-time-step LSTM classification has a detection accuracy of 78.76%. With identical input vectors, the suggested technique outperforms traditional ML classifiers, such as BPNN and SVM. The suggested technique was tested using a Kaggle dataset supplied by the ENET Centre in the Czech Republic (voltage signals of the stray electromagnetic current along aerial-covered cables recorded by a simple meter). Balouji et al. suggested a PD classification approach for power electronics based on the LSTM model (many-to-one) and characteristics retrieved from PD pulses in the PWM waveform within a preset PD cycle (5 ms in this study) [100]. Ahmed et al. introduced a bidirectional LSTM (BLSTM) for fault detection in an MV overhead transmission line with covered conductors [101]. The ENET Centre at the Technical University of Ostrava developed a meter and obtained the actual power line dataset, which is the largest public dataset known in free software. The data were collected by putting a meter with a very high sample frequency (40 MHz) in many different places. This led to very different data in terms of noise spectrum and PD quality, which made categorization more difficult. The collected experimental findings demonstrate that the suggested BLSTM technique is capable of learning chaotic PD patterns at a competitive rate.
7.4. Deep Belief Network (DBN)
A deep belief network (DBN) is a generative neural network that produces outcomes using an unsupervised machine learning model. This sort of network is the outcome of current research on the use of unlabeled data to construct unsupervised models. The DBN comprises a number of limited Boltzmann machines (RBMs), of which models are defined based on the energy function. It is a very important part of the preprocessing process in DL [102] and a very important part of DBNs. RBM is the basic building block of DBN, which is a single-layer ML network that is widely applied. The calculations used in the following paragraph are based on Chen and Li’s [102] research. An RBM structure has two levels, visible and buried, as depicted in Figure 23.
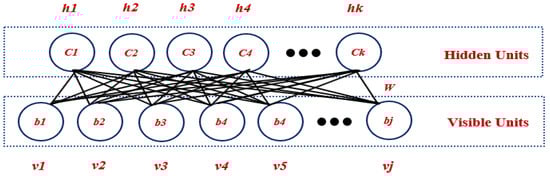
Figure 23.
Structure of a restricted Boltzmann machine.
A link occurs among neuron nodes in the next layer, but the neuron nodes in each layer remain disconnected from one another. W is the weight of the link between the two layers. RBM neurons are Booleans, which means they have just two states (0 and 1). A neuron is activated when it is in state 1, and it is suppressed when it is in state 0. In certain ways, an RBM is energy that relies on a model whose combined probability distribution is determined by its energy task for certain visible and hidden layer neurons in a binary state:
where Z and 𝐸(v, h) are the normalizing partition functions. The following is an example of an RBM’s energy function:
where v = v1, ..., vj and h = h1, ..., hk are visible and hidden binary units, respectively; b is the visible layer’s bias vector; c is the hidden layer’s bias vector; and w is the weight matrix. Z is an intractable problem that requires a significant amount of computing time. The conditional distribution, which is easy to compute due to RBM’s bipartite graph structure, may nevertheless be utilized to assess Z via Gibbs sampling [103]. The conditional distribution of the kth hidden unit and the jth visible unit is found, as shown using the formula below:
The RBM is optimized using the estimated parameters below by means of a contradictory diverse learning method with n samples and matching labels [103]:
The trained RBM may specify the parameters of the DBN’s first layer. To train the second RBM, the hidden layer of the first RBM can be utilized as the visible layer. A DBN can be built by stacking RBMs. After that, the parameters are retrieved from the trained DBN and utilized in building an MLP. Then, a classification layer (typically a softmax layer) is added, followed by discriminative fine-tuning, which allows the MLP to be used for classification tasks.
On the basis of DBN and PRPD raw variables, Karimi et al. developed a special PD classification approach [104]. The average charge, maximum charge, and sum of PDs were estimated using different phase window lengths (1°, 3°, 5°, 6°, 8°, and 10°) during 360° AC power cycles. A PRPD matrix with three W columns and C rows was generated using W phase windows per power cycle and C power cycles. Three components (statistical, signal norm-based, and their combinations) were developed to compare them with approaches that used feature extraction before feeding into the DBN. The numerical findings show that DBN with PRPD raw parameters (8°) produces the best results. In many cases, it performs better, and DBN with feature sets has lower classification accuracy than DBN with raw data. The Adaptive Neuro-Fuzzy Inference System (ANFIS) and SVM, two prominent traditional ML classifiers, were also compared. According to the results, using PRPD raw data, standard ML classifiers could not achieve adequate accuracy. Because traditional structures are not deep, classifiers are unable to collect hierarchical properties and manage complicated input data. When features are extracted before being fed into ANFIS and SVM, their accuracy improves considerably. That said, in terms of average performance, DBN with extracted features outperforms ANFIS and SVM. There have also been investigations into PD categorization in loud environments. When PD signals are heavily polluted with noise, denoising methods should be used. The same authors came up with similar conclusions [103]. In other words, the DBN-based strategy surpasses AI-based methods, such as DT. Applying the non-code ratio and DBN, Dai et al. suggested a DGA-based technique to classify transformer problems [105]. The findings demonstrated that for single-fault and multiple-fault datasets, the suggested technique can reach 91.2% and 96% PD detection accuracy, respectively. With the same dataset, it also outperforms traditional machine learning approaches, such as SVM and BPNN. A summary of the DL methods is presented in Table 5.
Table 5.
Summary of DL Methods.
Although DL algorithms are capable of achieving best-in-class accuracy, their interpretability is lacking. The basic growth of DL is hampered by a lack of fundamental knowledge. Instead of rigorous theories, DL models are chosen according to trial and error. Some studies [76,77,78,79,80,81,82,83,84,85,86,87,88,89,90,91,92,93,94,95,96,97,98,99,100,101,102,103,104,105,106,107,108] have attempted to depict learned CNN kernels to relate their interpretation physically in the context of PD features. Despite the fact that this research provides a number of insights into the understandability of DL algorithms, further research is needed. Some strategies for reading and comprehending DL models were examined through a comprehensive theoretical examination [106,107]. The findings showed that using hyperparameters, such as filter size and layer number, for the establishment of the best model structure for PD diagnosis may be much easier. Various tools and resources are available for creating and implementing deep learning algorithms. The most common deep learning framework is Tensorflow, which is built on a static computational graph. Tensorflow-Lite was recently built for DL mobile systems, and it supports Application Specific Integrated Circuit (ASIC) modification. In addition, the TensorBoard in Tensorflow allows for excellent parameter and data visualization throughout the training process. Keras is easy to use because it is a high-level application programming interface (API) built over other well-known lower-level libraries, such as Tensorflow. Keras is good for quick prototyping, but it is not very adjustable or adaptable. Matlab’s DL toolbox, which includes all regularly used DL methods, is also a good place to start for novices. Unlike previous DL frameworks, PyTorch uses a dynamic graph, allowing users to adjust the computational network during execution. Compared to other DL frameworks, it serves as a source of enhanced flexibility when DL algorithms are developed. PyTorch-Mobile, an experimental mobile solution, was also recently released. Caffe2, a popular deep learning framework for mobile applications, is merging with PyTorch. Chainer also enables dynamic updates to the computational graph and tends to have a higher speed than most Python frameworks. Its popularity, however, is modest due to a lack of knowledge and community support.
Table 6 provides an overview of common DL frameworks and libraries that serve interested researchers as a foundation for developing and applying PD diagnoses utilizing DL methods [82], and provides a more in-depth examination of several DL systems. TensorFlow and PyTorch are two tools that are highly recommended.
Table 6.
A Summary of the Most Popular DL Frameworks.
8. Conclusions
This work includes a thorough evaluation of state-of-the-art research on MV switchgear, their kinds, and the flaws that arise in MV electrical switches published in the previous five years. A table provides a comparison, as well as an explanation of CBM and its many kinds. The use of traditional DL algorithms in PD diagnosis and condition monitoring is also being considered. A summary and comparison of the following information are made and looked at: the purpose of the application; the type of sensor used; the main method used; and how accurate it is.
The following conclusions are derived:
- In PD diagnostics, DL approaches, which have recently received much attention, may achieve best-in-class accuracy while requiring less work on feature building. In contrast to other traditional ML approaches, such as SVM, they lack a strong mathematical basis. DL approaches are also less interpretable than other traditional ML procedures, such as DT.
- Because the experimental settings in each study vary, further work on robust machine learning methods and direct comparisons of multiple intelligent PD diagnostics are needed to create a complete and open-access dataset.
- Most research in this field that used DL focused on detecting and categorizing PD, but other areas, such as PD localization, were not taken into account.
- ML methods, particularly DL, have a number of roadblocks to their adoption for practical applications. Unbalanced datasets, limited datasets, inconsistency among training and testing datasets, unlabeled datasets, model complexity, real-time capacity, and interpretability are some of the obstacles. These elements have yet to be fully investigated and require additional research. To enable the deployment of intelligent PD diagnostic systems in real-world settings, potential solutions to existing problems are also offered in the current study. ML techniques, notably in DL-based PD diagnoses, clearly have a lot of room for improvement.
Author Contributions
Conceptualization, S.P.K. and S.K.T.; methodology, Y.A.M.A., C.T.Y., S.P.K. and S.K.T.; software, Y.A.M.A.; validation, Y.A.M.A., C.T.Y., S.P.K. and C.P.C.; formal analysis, Y.A.M.A., C.T.Y. and S.P.K.; investigation, Y.A.M.A., C.T.Y., S.P.K. and C.P.C.; resources, Y.A.M.A., C.T.Y., S.P.K., S.K.T. and C.P.C.; data curation, Y.A.M.A., C.T.Y. and C.P.C.; writing—original draft preparation, Y.A.M.A., C.T.Y. and S.P.K.; writing—review and editing, Y.A.M.A., C.T.Y., S.P.K., S.K.T., C.P.C. and K.A.; visualization, S.P.K., C.T.Y., S.K.T. and C.P.C.; supervision, S.P.K. and C.T.Y.; project administration, S.P.K. and S.K.T.; funding acquisition, S.P.K. and S.K.T. All authors have read and agreed to the published version of the manuscript.
Funding
This research was funded by 202101KETTHA and BOLDREFRESH 2025 (J510050002 (IC-6C)).
Institutional Review Board Statement
Not applicable.
Informed Consent Statement
Not applicable.
Data Availability Statement
Not applicable.
Acknowledgments
This work was supported by Universiti Tenaga Nasional, BOLDREFREASH 2025 and AAIBE Chair of Renewable Energy (ChRe) for providing all out-laboratory support.
Conflicts of Interest
The authors declare no conflict of interest.
References
- Ghazali, Y.Y.; Talib, M.A.; Soosai, A.M. TNB approach on managing asset retirement for distribution transformers. In Proceedings of the 23rd International Conference on Electricity Distribution, Lyon, France, 15–18 June 2015; pp. 1–5. [Google Scholar]
- IEEE Draft Guide for “Testing Switchgear Rated Up to 52 kV for Internal Arcing Faults-Corrigenda #1,’ in IEEE PC37.20.7_Cor1/D2”. In Proceedings of the 2018 IEEE Petroleum and Chemical Industry Technical Conference (PCIC), Cincinnati, OH, USA, 24–26 September 2018; pp. 1–12.
- Zubcic, M.; Krcum, M. Power frequency withstand voltage type testing and FEM analysis of the medium-voltage switchgear busbar compartment. In Proceedings of the 2018 17th International Symposium INFOTEH-JAHORINA (INFOTEH), East Sarajevo, Bosnia, 21–23 March 2018. [Google Scholar]
- Thummapal, D.; Kothari, S.; Thirumalai, M. Emerging technologies in high voltage gas insulated switchgear-clean air GIS and NCIT. In Proceedings of the 2019 International Conference on High Voltage Engineering and Technology (ICHVET), Hyderabad, India, 7–8 February 2019. [Google Scholar]
- Hoffmann, M.W.; Wildermuth, S.; Gitzel, R.; Boyaci, A.; Gebhardt, J.; Kaul, H.; Tornede, T. Integration of novel sensors and machine learning for predictive maintenance in medium voltage switchgear to enable the energy and mobility revoluti. Sensors 2020, 20, 2099. [Google Scholar] [CrossRef]
- Feng, Z.; Jiaming, Z.; Xingzhi, L.; Jie, D.; Huayong, Z. The method and application of electric energy meter status evaluation fused security region. In Proceedings of the 2016 IEEE Information Technology, Networking, Electronic and Automation Control Confere, Chongqing, China, 20–22 May 2016. [Google Scholar] [CrossRef]
- Kamaludin, A.; Prasetia, H.; Nugroho, Y. Implementation of GOOSE for Overcurrent Relays with Non-Cascade Scheme in Medium Voltage Switchgear as Breaker Failure and Busbar Protection System. In Proceedings of the 2020 International Conference on Technolo, Bandung, Indonesia, 23–24 September 2020. [Google Scholar]
- Ates, H.; Bostanci, E.; Guzel, M.S. Optimization of medium voltage load break switchgear using multiple objective evolutionary algorithms. In Proceedings of the 2019 International Conference on Applied Automation and Industrial Diagnostics (ICAAID), Elazig, Turkey, 25–27 September 2019; Volume 1. [Google Scholar]
- Gao, W.; Cao, Y.; Wang, Y.; Price, C.; Ronzello, J.; Uzelac, N.; Darko, K. Materials Compatibility Study of C 4 F 7 N/CO 2 Gas Mixture for Medium-Voltage Switchgear. IEEE Trans. Dielectr. Electr. Insul. 2022, 29, 270–278. [Google Scholar] [CrossRef]
- Turrin, S.; Deck, B.; Egman, M.; Cavalli, L. Medium voltage equipment monitoring and diagnostics: Technological maturity makes concepts compatible with expectations. In Proceedings of the 23rd International Conference on Electricity Distribution, Lyon, France; 2015. [Google Scholar]
- Hyrenbach, M.; Sebastian, Z. Alternative insulation gas for medium-voltage switchgear. In Proceedings of the 2016 Petroleum and Chemical Industry Conference Europe (PCIC Europe), Berlin, Germany, 14–16 June 2016. [Google Scholar] [CrossRef]
- Hyrenbach, M.; Paul, T.A.; Owens, J. Environmental and Safety Aspects of AirPlus Insulated GIS. CIRED-Open Access Proc. J. 2017, 2017, 132–135. Available online: https://pdfs.semanticscholar.org/d34b/efb3c29fb93b5da1b8fd8e55ada743b6a613.pdf (accessed on 15 June 2022). [CrossRef][Green Version]
- Raju, R.; Narayananaswamy, V.; Durairaj, M.; Vittal, D.P.; Sethuraman, R.; Ananda, R.G.; Aravindakshan, A.M. Design and implementation of compact and robust medium voltage switchgear for deepwater work-class ROV ROSUB 6000. Underw. Technol. 2013, 31, 203–213. [Google Scholar] [CrossRef]
- Zhang, X.; Gockenbach, E.; Wasserberg, V.; Borsi, H. Estimation of the Lifetime of the Electrical Components in Distribution Networks. IEEE Trans. Power Deliv. 2006, 22, 515–522. [Google Scholar] [CrossRef]
- Zhang, X.; Gockenbach, E. Component Reliability Modeling of Distribution Systems Based on the Evaluation of Failure Statistics. IEEE Trans. Dielectr. Electr. Insul. 2007, 14, 1183–1191. [Google Scholar] [CrossRef]
- Boyaci, A.; Becker, O.; Amihai, I. Vibration Monitoring for Medium-Voltage Circuit Breaker Drives Using Artificial Intelligence. In Proceedings of the CIRED 2021—The 26th International Conference and Exhibition on Electricity Distribution, Online, 20–23 September 2021; pp. 628–632. [Google Scholar]
- Pei, X.; Cwikowski, O.; Vilchis-Rodriguez, D.S.; Barnes, M.; Smith, A.C.; Shuttleworth, R. A review of technologies for MVDC circuit breakers. In Proceedings of the IECON 2016—42nd Annual Conference of the IEEE Industrial Electronics Society, Florence, Italy, 23–26 October 2016; pp. 3799–3805. [Google Scholar]
- Park, W.; Kim, Y.K.; Lee, S.; Ahn, K.Y.; Kim, Y.G. Arc phenomena and method of arc extinction in air circuit breaker. In Proceedings of the CIRED 2019, Madrid, Spain, 3–6 June 2019. [Google Scholar]
- [Xemard, A.; Jurisic, B.; Rioual, M.; Olivier, A.; Sellin, E. Interruption of small, medium-voltage transformer current with a vacuum circuit breaker. Electr. Power Syst. Res. 2020, 187, 106502. [Google Scholar] [CrossRef]
- Moore, T.; Schmid, F.; Tricoli, P. Voltage transient management for Alternating Current trains with vacuum circuit breakers. IET Electr. Syst. Transp. 2021, 12, 1–14. [Google Scholar] [CrossRef]
- Tian, S.; Zhang, X.; Xiao, S.; Zhang, J.; Chen, Q.; Li, Y. Application of C6F12O/CO2 mixture in 10 kV medium-voltage switchgear. IET Sci. Meas. Technol. 2019, 13, 1225–1230. [Google Scholar] [CrossRef]
- Seeger, M.; Smeets, R.; Yan, J.; Ito, H.; Claessens, M.; Dullni, E.; Falkingham, L.; Franck, C.M.; Gentils, F.; Hartmann, W.; et al. Recent Trends in Development of High Voltage Circuit Breakers with SF6 Alternative Gases. Plasma Phys. Technol. 2017, 4, 8–12. Available online: https://ojs.cvut.cz/ojs/index.php/PPT/article/view/4573 (accessed on 15 June 2022). [CrossRef]
- Yeckley, R.; Perulfi, J. Oil Circuit Breakers: A Look at the Earlier Generation [History]. IEEE Power Energy Mag. 2018, 16, 86–97. [Google Scholar] [CrossRef]
- Jadin, M.S.; Taib, S. Recent progress in diagnosing the reliability of electrical equipment by using infrared thermography. Infrared Phys. Technol. 2012, 55, 236–245. [Google Scholar] [CrossRef]
- Huda, A.N.; Taib, S. Application of infrared thermography for predictive/preventive maintenance of thermal defect in electrical equipment. Appl. Therm. Eng. 2013, 61, 220–227. [Google Scholar] [CrossRef]
- Alberto, D.; Brun, P.; Ferraro, V.; Secci, M. Accurate Thermal Monitoring by Sensor Embedded in Switchgear Bushing. In Proceedings of the CIRED 2021-The 26th International Conference and Exhibition on Electricity Distribution, 20–23 September 2021; Volume 2021, pp. 565–569. [Google Scholar]
- Snajdr, J.; Bentley, J.P.; Hauck, R.; Novak, P. Stress on outer cable connection of MV gas-insulated switchgear due to cable thermal expansion at rated current. CIRED Open Access Proc. J. 2017, 2017, 450–453. Available online: Https://www.researchgate.net/profile/Jaroslav-1186Snajdr/publication/321205193_Stress_on_outer_cable_connection_of_MV_gas-1187insulat-1188ed_switchgear_due_to_cable_thermal_expansion_at_rated_current/links/5b90d558299bf114b7fd9024/Stress-on-1189 outer-cable-connection-of-MV-gas-insulated-switchgear-due-to-cable-thermal-expansion-at-rated-current.pdf (accessed on 12 July 2022). [CrossRef]
- Cormenier, T.; Chevalier, M.; Helal, K.; Briens, M. Material Efficiency for Circular Economy: From Assessments to Optimizations. In Proceedings of the CIRED 2019 Conference, Madrid, Spain, 3–6 June 2019. [Google Scholar]
- Liu, L.; Shen, M.; Liu, C. Dielectric Tests on Cable Testing Circuits of Medium Voltage Switchgear. In Proceedings of the 2021 IEEE 4th International Electrical and Energy Conference (CIEEC), Wuhan, China, 28–30 May 2021. [Google Scholar]
- Ishak, S.; Koh, S.-P.; Tan, J.-D.; Tiong, S.-K.; Chen, C.-P. Corona fault detection in switchgear with extreme learning machine. Bull. Electr. Eng. Informatics 2020, 9, 558–564. [Google Scholar] [CrossRef]
- Javed, H.; Kang, L.; Zhang, G. The Study of Different Metals Effect on Ozone Generation Under Corona Discharge in MV Switchgear Used for Fault Diagnostic. In Proceedings of the 2019 IEEE Asia Power and Energy Engineering Conference (APEEC), Chengdu, China, 29–31 March 2019. [Google Scholar]
- Bandi, M.M.; Ishizu, N.; Kang, H.-B. Electrocharging face masks with corona discharge treatment. Proc. R. Soc. A 2021, 477, 20210062. [Google Scholar] [CrossRef]
- Schoenau, L.; Steinpilz, T.; Teiser, J.; Wurm, G. Corona discharge of a vibrated insulating box with granular medium. Granul. Matter 2021, 23, 1–6. [Google Scholar] [CrossRef]
- Weichert, H.; Benz, P.; Hill, N.; Hilbert, M.; Kurrat, M. On Partial Discharge/Corona Considerations for Low Voltage Switchgear and Controlgear. In Proceedings of the 2018 IEEE Holm Conference on Electrical Contacts, Albuquerque, NM, USA, 14–18 October 2018; pp. 246–253. [Google Scholar]
- Ishak, S.; Yaw, C.T.; Koh, S.P.; Tiong, S.K.; Chen, C.P.; Yusaf, T. Fault Classification System for Switchgear CBM from an Ultrasound Analysis Technique Using Extreme Learning Machine. Energies 2021, 14, 6279. [Google Scholar] [CrossRef]
- Brady, J.; Thermographer, L.I.C. Corona and Tracking Conditions in Metal-Clad Switchgear Case Studies. Brady Infrared Inspections. 2006. Available online: https://www.irinfo.org/articleofmonth/pdf/article_8_1_2006_Brady.pdf (accessed on 12 July 2022).
- Haiguo, T.; Jiran, Z.; Fangliang, G.; Hua, L.; Min, F.; Qi, H. Research on a rail-robot based remote three-dimensional inspection system for switch stations in power distribution network. In Proceedings of the 2017 Chinese Automation Congress (CAC), Jinan, China, 20–22 October 2017; p. 7. [Google Scholar]
- Yi, M.; Pu, M.; Zhu, Z.; Gu, C.; Su, H.; Wang, X. Research on insulation aging of distribution switchgear. In Proceedings of the 2016 International Conference on Condition Monitoring and Diagnosis (CMD), Xi’an, China, 25–28 September 2016; pp. 206–209. [Google Scholar]
- Capritta, C.; Elisabetta, C. The importance of NFC tracking for MV and LV switchgear. In Proceedings of the 2016 Petroleum and Chemical Industry Conference Europe (PCIC Europe), Berlin, Germany, 14–16 June 2016. [Google Scholar]
- Wang, Y.; Feng, C.; Luo, Y.; Fei, R. Study on Surface Characteristics of E-glass Fiber Reinforced Epoxy Resin Composites in Different Stages of Tracking. Fibers Polym. 2020, 21, 2556–2568. [Google Scholar] [CrossRef]
- Koziy, K.; Gou, B.; Aslakson, J. A Low-Cost Power-Quality Meter With Series Arc-Fault Detection Capability for Smart Grid. IEEE Trans. Power Deliv. 2013, 28, 1584–1591. [Google Scholar] [CrossRef]
- Lutz, F.; Pietsch, G. The calculation of overpressure in metal-enclosed switchgear due to internal arcing. IEEE Trans. Power Appar. Syst. 1982, 11, 4230–4236. [Google Scholar] [CrossRef]
- Wang, Y.; Hou, L.; Paul, K.C.; Ban, Y.; Chen, C.; Zhao, T. ArcNet: Series AC Arc Fault Detection Based on Raw Current and Convolutional Neural Network. IEEE Trans. Ind. Informatics 2021, 18, 77–86. [Google Scholar] [CrossRef]
- Tisserand, E.; Lezama, J.; Schweitzer, P.; Berviller, Y. Series arcing detection by algebraic derivative of the current. Electr. Power Syst. Res. 2015, 119, 91–99. [Google Scholar] [CrossRef]
- Atharparvez, M.; Purandare, K.R. Series Arc fault detection using novel signal processing technique. In Proceedings of the 2018 IEEE Holm Conference on Electrical Contacts, Albuquerque, NM, USA, 14–18 October 2018. [Google Scholar]
- Lu, S.; Phung, B.; Zhang, D. A comprehensive review on DC arc faults and their diagnosis methods in photovoltaic systems. Renew. Sustain. Energy Rev. 2018, 89, 88–98. [Google Scholar] [CrossRef]
- Kay, J.A.; Hussain, G.A.; Lehtonen, M.; Kumpulainen, L. New pre-emptive arc fault detection techniques in medium voltage switchgear and motor controls. In Proceedings of the 2015 61st IEEE Pulp and Paper Industry Conference (PPIC), Milwaukee, WI, USA, 14–18 June 2015; pp. 1–12. [Google Scholar]
- Nicolaou, C.; Mansour, A.; Van Laerhoven, K. On-site Online Condition Monitoring of Medium-Voltage Switchgear Units. In Proceedings of the 11th International Conference on the Internet of Things, St. Gallen, Switzerland, 8–12 November 2021. [Google Scholar]
- Ayo-Imoru, R.; Cilliers, A. A survey of the state of condition-based maintenance (CBM) in the nuclear power industry. Ann. Nucl. Energy 2018, 112, 177–188. [Google Scholar] [CrossRef]
- Barksdale, H.; Smith, Q.; Khan, M. Condition monitoring of electrical machines with Internet of Things. In Proceedings of the SoutheastCon 2018, St. Petersburg, FL, USA, 19–22 April 2018. [Google Scholar]
- Jing, Q.; Yan, J.; Lu, L.; Xu, Y.; Yang, F. A Novel Method for Pattern Recognition of GIS Partial Discharge via Multi-Information Ensemble Learning. Entropy 2022, 24, 954. [Google Scholar] [CrossRef]
- Kumar, S.; Goyal, D.; Dang, R.K.; Dhami, S.S.; Pabla, B. Condition based maintenance of bearings and gears for fault detection–A review. Mater. Today: Proc. 2018, 5, 6128–6137. [Google Scholar] [CrossRef]
- de Almeida, P.R.A.; Pereira, R.P.; Muniz, P.R. Didactic Switchgear for Teaching Thermographic Inspection for Electrical Maintenance. IEEE Rev. Iberoam. de Tecnol. del Aprendiz. 2019, 14, 43–49. [Google Scholar] [CrossRef]
- Doshvarpassand, S.; Wu, C.; Wang, X. An overview of corrosion defect characterization using active infrared thermography. Infrared Phys. Technol. 2018, 96, 366–389. [Google Scholar] [CrossRef]
- Zhiwang, Y.; Zhiqin, Z.; Wude, X.; Yuning, C.; Xueyun, M.; Qiping, Y. Study on Power Equipment Condition Based Maintenance (CBM) Technology in Smart Grid. In Proceedings of the 2021 3rd International Conference on Smart Power & Internet Energy Systems, Shanghai, China, 25–28 September 2021. [Google Scholar]
- Hussain, G.A.; Zaher, A.A.; Hummes, D.; Safdar, M.; Lehtonen, M. Hybrid Sensing of Internal and Surface Partial Discharges in Air-Insulated Medium Voltage Switchgear. Energies 2020, 13, 1738. [Google Scholar] [CrossRef]
- Kessler, O. The Importance of Partial Discharge Testing: PD Testing Has Proven to Be a Very Reliable Method for Detecting Defects in the Insulation System of Electrical Equipment and for Assessing the Risk of Failure. IEEE Power Energy Mag. 2020, 18, 62–65. [Google Scholar] [CrossRef]
- Lu, S.; Chai, H.; Sahoo, A.; Phung, B.T. Condition Monitoring Based on Partial Discharge Diagnostics Using Machine Learning Methods: A Comprehensive State-of-the-Art Review. IEEE Trans. Dielectr. Electr. Insul. 2020, 27, 1861–1888. [Google Scholar] [CrossRef]
- Fruth, B.; Fuhr, J. Partial discharge pattern recognition-a tool for diagnosis and monitoring of aging. Cigre 1990, 15, 12. [Google Scholar]
- Raymond, W.J.K.; Illias, H.A.; Abu Bakar, A.H.; Mokhlis, H. Partial discharge classifications: Review of recent progress. Measurement 2015, 68, 164–181. [Google Scholar] [CrossRef]
- Sahoo, A.; Subramaniam, A.; Bhandari, S.; Panda, S.K. A review on condition monitoring of GIS. In Proceedings of the 2017 International Symposium on Electrical Insulating Materials (ISEIM), Toyohashi, Japan, 11–15 September 2017; Volume 2, pp. 543–546. [Google Scholar]
- Cheng, J.; Xu, Y.; Ding, D.; Liu, W. Investigation of sensitivity of the ultra-high frequency partial-discharge detection technology for micro-crack in epoxy insulator in GIS. High Volt. 2020, 5, 697–703. [Google Scholar] [CrossRef]
- Gao, C.; Yu, L.; Xu, Y.; Wang, W.; Wang, S.; Wang, P. Partial Discharge Localization Inside Transformer Windings via Fiber-Optic Acoustic Sensor Array. IEEE Trans. Power Deliv. 2018, 34, 1251–1260. [Google Scholar] [CrossRef]
- Ilkhechi, H.D.; Samimi, M.H. Applications of the Acoustic Method in Partial Discharge Measurement: A Review. IEEE Trans. Dielectr. Electr. Insul. 2021, 28, 42–51. [Google Scholar] [CrossRef]
- Chai, H.; Phung, B.; Mitchell, S. Application of UHF Sensors in Power System Equipment for Partial Discharge Detection: A Review. Sensors 2019, 19, 1029. [Google Scholar] [CrossRef]
- Chai, H.; Lu, S.; Phung, B.T.; Mitchell, S. Comparative Study of Partial Discharge Localization Based on Uhf Detection Methods. In Proceedings of the CIRED 2019 Conference, Madrid, Spain, 3–6 June 2019. [Google Scholar]
- Salehi, H.; Burgueño, R. Emerging artificial intelligence methods in structural engineering. Eng. Struct. 2018, 171, 170–189. [Google Scholar] [CrossRef]
- Anglekar, S.; Chaudhari, U.; Chitanvis, A.; Shankarmani, R. A Deep Learning based Self-Assessment Tool for Personality Traits and Interview Preparations. In Proceedings of the 2021 International Conference on Communication information and Computing Technolog, Mumbai, India, 25–27 June 2021. [Google Scholar]
- Catterson, V.M.; Sheng, B. Deep neural networks for understanding and diagnosing partial discharge data. In Proceedings of the 2015 IEEE Electrical Insulation Conference (EIC), Seattle, WA, USA, 7–10 June 2015. [Google Scholar]
- Nair, V.; Hinton, G.E. Rectified Linear Units Improve Restricted Boltzmann Machines. Icml. 2010. Available online: https://openreview.net/forum?id=rkb15iZdZB (accessed on 15 June 2022).
- Takaki, S.; Yamagishi, J. A deep auto-encoder based low-dimensional feature extraction from FFT spectral envelopes for statistical parametric speech synthesis. In Proceedings of the 2016 IEEE International Conference on Acoustics, Speech and Signal Processing (I), Shanghai, China, 20–25 March 2016. [Google Scholar]
- Abid, A.; Balin, M.F.; Zou, J. Concrete autoencoders for differentiable feature selection and reconstruction. arXiv 2019, arXiv:1901.09346. [Google Scholar]
- Duan, L.; Hu, J.; Zhao, G.; Chen, K.; He, J.; Wang, S. Identification of Partial Discharge Defects Based on Deep Learning Method. IEEE Trans. Power Deliv. 2019, 34, 1557–1568. [Google Scholar] [CrossRef]
- Ganjun, W.; Fan, Y.; Xiaosheng, P.; Yijiang, W.; Taiwei, L.; Zibo, L. Partial discharge pattern recognition of high voltage cables based on the stacked denoising autoencoder method. In Proceedings of the 2018 International Conference on Power System Tech, Guangzhou, China, 6–8 November 2018. [Google Scholar]
- Zemouri, R.; Levesque, M.; Amyot, N.; Hudon, C.; Kokoko, O.; Tahan, S.A. Deep Convolutional Variational Autoencoder as a 2D-Visualization Tool for Partial Discharge Source Classification in Hydrogenerators. IEEE Access 2019, 8, 5438–5454. [Google Scholar] [CrossRef]
- Dai, J.; Teng, Y.; Zhang, Z.; Yu, Z.; Sheng, G.; Jiang, X. Partial Discharge Data Matching Method for GIS Case-Based Reasoning. Energies 2019, 12, 3677. [Google Scholar] [CrossRef]
- Wang, Y.; Yan, J.; Yang, Z.; Liu, T.; Zhao, Y.; Li, J. Partial Discharge Pattern Recognition of Gas-Insulated Switchgear via a Light-Scale Convolutional Neural Network. Energies 2019, 12, 4674. [Google Scholar] [CrossRef]
- Barrios, S.; Buldain, D.; Comech, M.P.; Gilbert, I. Partial Discharge Identification in MV Switchgear Using Scalogram Representations and Convolutional AutoEncoder. IEEE Trans. Power Deliv. 2020, 36, 3448–3455. [Google Scholar] [CrossRef]
- He, K.; Zhang, X.; Ren, S.; Sun, J. Deep Residual Learning for Image Recognition. In Proceedings of the IEEE Conference on Computer Vision and Pattern Recognition, Las Vegas, NV, USA, 27-30 June 2016; pp. 770–778. Available online: https://openaccess.thecvf.com/content_cvpr_2016/html/He_Deep_Residual_Learning_CVPR_2016_paper.html (accessed on 15 June 2022).
- Li, Y.; Yu, F.; Cai, Q.; Yuan, K.; Wan, R.; Li, X.; Qian, M.; Liu, P.; Guo, J.; Yu, J.; et al. Image fusion of fault detection in power system based on deep learning. Clust. Comput. 2018, 22, 9435–9443. [Google Scholar] [CrossRef]
- Puspitasari, N.; Khayam, U.; Suwarno; Kakimoto, Y.; Yoshikawa, H.; Kozako, M.; Hikita, M. Partial discharge waveform identification using image with convolutional neural network. In Proceedings of the 2019 54th International Universities Power Engineering Conference (UPEC), Bucharest, Romania, 3–6 September 2019. [Google Scholar]
- Wang, Y.; Yan, J.; Yang, Z.; Zhao, Y.; Liu, T. Optimizing GIS partial discharge pattern recognition in the ubiquitous power internet of things context: A MixNet deep learning model. Int. J. Electr. Power Energy Syst. 2020, 125, 106484. [Google Scholar] [CrossRef]
- Wang, Y.; Yan, J.; Sun, Q.; Li, J.; Yang, Z. A MobileNets Convolutional Neural Network for GIS Partial Discharge Pattern Recognition in the Ubiquitous Power Internet of Things Context: Optimization, Comparison, and Application. IEEE Access 2019, 7, 150226–150236. [Google Scholar] [CrossRef]
- Che, Q.; Wen, H.; Li, X.; Peng, Z.; Chen, K.P. Partial Discharge Recognition Based on Optical Fiber Distributed Acoustic Sensing and a Convolutional Neural Network. IEEE Access 2019, 7, 101758–101764. [Google Scholar] [CrossRef]
- Mitiche, I.; Jenkins, M.D.; Boreham, P.; Nesbitt, A.; Stewart, B.G.; Morison, G. Deep residual neural network for EMI event classification using bispectrum representations. In Proceedings of the 2018 26th European Signal Processing Conference (EUSIPCO), Rome, Italy, 3–7 September 2018. [Google Scholar]
- Mitiche, I.; Jenkins, M.D.; Boreham, P.; Nesbitt, A.; Morison, G. Deep complex neural network learning for high-voltage insulation fault classification from complex bispectrum representation. In Proceedings of the 2019 27th European Signal Processing Conference (EUSIPCO), A Coruna, Spain, 2–6 September 2019. [Google Scholar]
- Zunaed, M.; Nath, A.; Rahman, M. Dual-CyCon Net: A Cycle Consistent Dual-Domain Convolutional Neural Network Framework for Detection of Partial Discharge. arXiv 2020, arXiv:2012.11532. [Google Scholar]
- Banno, K.; Nakamura, Y.; Fujii, Y.; Takano, T. Partial discharge source classification for switchgears with transient earth voltage sensor using convolutional neural network. In Proceedings of the 2018 Condition Monitoring and Diagnosis (CMD), Perth, WA, Australia, 23–26 September 2018; pp. 1–5. [Google Scholar]
- Wang, S.; Xia, Y.; Ping, C.; Xue, G. Study on SF 6 Gas On-line Monitoring Method Based on Machine Learning. In Proceedings of the 2018 IEEE 4th Information Technology and Mechatronics Engineering Conference (ITOEC), Chongqing, China, 14–16 December 2018; pp. 240–244. [Google Scholar]
- Lu, S.; Sirojan, T.; Phung, B.T.; Zhang, D.; Ambikairajah, E. DA-DCGAN: An Effective Methodology for DC Series Arc Fault Diagnosis in Photovoltaic Systems. IEEE Access 2019, 7, 45831–45840. [Google Scholar] [CrossRef]
- Khan, M.A.; Choo, J.; Kim, Y.-H. End-to-End Partial Discharge Detection in Power Cables via Time-Domain Convolutional Neural Networks. J. Electr. Eng. Technol. 2019, 14, 1299–1309. [Google Scholar] [CrossRef]
- Woon, W.L.; Aung, Z.; El-Hag, A. Intelligent Monitoring of Transformer Insulation Using Convolutional Neural Networks. In Data Analytics for Renewable Energy Integration, Technologies, Systems and Society; Springer: Cham, Switzerland, 2018; Volume 11325, pp. 127–136. [Google Scholar]
- Zhang, Q.; Lin, J.; Song, H.; Sheng, G. Fault identification based on PD ultrasonic signal using RNN, DNN and CNN. In Proceedings of the 2018 Condition Monitoring and Diagnosis (CMD), Perth, WA, Australia, 23–26 September 2018; pp. 1–6. [Google Scholar]
- Yin, Q.; Zhang, R.; Shao, X. CNN and RNN mixed model for image classification. MATEC Web Conf. 2019, 277, 02001. [Google Scholar] [CrossRef]
- Goodfellow, I.; Bengio, Y.; Courville, A. Deep Learning; MIT Press: Cambridge, MA, USA, 2016. [Google Scholar]
- Adam, B.; Tenbohlen, S. Classification of multiple PD sources by signal features and LSTM networks. In Proceedings of the 2018 IEEE International Conference on High Voltage Engineering and Application (ICHVE), Athens, Greece, 10–13 September 2018. [Google Scholar]
- Li, G.; Wang, X.; Li, X.; Yang, A.; Rong, M. Partial Discharge Recognition with a Multi-Resolution Convolutional Neural Network. Sensors 2018, 18, 3512. [Google Scholar] [CrossRef] [PubMed]
- Zhou, X.; Wu, X.; Ding, P.; Li, X.; He, N.; Zhang, G.; Zhang, X. Research on Transformer Partial Discharge UHF Pattern Recognition Based on Cnn-lstm. Energies 2019, 13, 61. [Google Scholar] [CrossRef]
- Dong, M.; Sun, J. Partial discharge detection on aerial covered conductors using time-series decomposition and long short-term memory network. Electr. Power Syst. Res. 2020, 184, 106318. [Google Scholar] [CrossRef]
- Balouji, E.; Hammarstrom, T.; McKelvey, T. Partial Discharge Classification in Power Electronics Applications using Machine Learning. In Proceedings of the 2019 IEEE Global Conference on Signal and Information Processing (GlobalSIP), Ottawa, ON, Canada, 11–14 November 2019. [Google Scholar]
- Ahmad, D.; Wang, S. Bidirectional LSTM Based Partial Discharge Pattern Analysis for Fault Detection in Medium Voltage Overhead Lines with Covered Conductors. In Proceedings of the 2020 IEEE 18th International Conference on Industrial Informatics (INDIN), Warwick, UK, 20–23 July 2020. [Google Scholar]
- Chen, Z.; Li, W. Multisensor Feature Fusion for Bearing Fault Diagnosis Using Sparse Autoencoder and Deep Belief Network. IEEE Trans. Instrum. Meas. 2017, 66, 1693–1702. [Google Scholar] [CrossRef]
- Karimi, M.; Majidi, M.; Etezadi-Amoli, M.; Oskuoee, M. Partial discharge classification using deep belief networks. In Proceedings of the 2018 IEEE/PES Transmission and Distribution Conference and Exposition (T&D), Denver, CO, USA, 16–19 April 2018; pp. 1061–1070. [Google Scholar]
- Karimi, M.; Majidi, M.; MirSaeedi, H.; Arefi, M.M.; Oskuoee, M. A Novel Application of Deep Belief Networks in Learning Partial Discharge Patterns for Classifying Corona, Surface, and Internal Discharges. IEEE Trans. Ind. Electron. 2019, 67, 3277–3287. [Google Scholar] [CrossRef]
- Dai, J.; Song, H.; Sheng, G.; Jiang, X. Dissolved gas analysis of insulating oil for power transformer fault diagnosis with deep belief network. IEEE Trans. Dielectr. Electr. Insul. 2017, 24, 2828–2835. [Google Scholar] [CrossRef]
- Wan, X.; Song, H.; Luo, L.; Li, Z.; Sheng, G.; Jiang, X. Pattern recognition of partial discharge image based on one-dimensional convolutional neural network. In Proceedings of the 2018 Condition Monitoring and Diagnosis (CMD), Perth, WA, Australia, 23–26 September 2018; pp. 1–4. [Google Scholar]
- Wang, Y.; Yan, J.; Yang, Z.; Zhao, Y.; Liu, T. GIS partial discharge pattern recognition via lightweight convolutional neural network in the ubiquitous power internet of things context. IET Sci. Meas. Technol. 2020, 14, 864–871. [Google Scholar] [CrossRef]
- Nguyen, M.-T.; Nguyen, V.-H.; Yun, S.-J.; Kim, Y.-H. Recurrent Neural Network for Partial Discharge Diagnosis in Gas-Insulated Switchgear. Energies 2018, 11, 1202. [Google Scholar] [CrossRef]
- Tuyet-Doan, V.-N.; Pho, H.-A.; Lee, B.; Kim, Y.-H. Deep Ensemble Model for Unknown Partial Discharge Diagnosis in Gas-Insulated Switchgears Using Convolutional Neural Networks. IEEE Access 2021, 9, 80524–80534. [Google Scholar] [CrossRef]


Publisher’s Note: MDPI stays neutral with regard to jurisdictional claims in published maps and institutional affiliations. |
© 2022 by the authors. Licensee MDPI, Basel, Switzerland. This article is an open access article distributed under the terms and conditions of the Creative Commons Attribution (CC BY) license (https://creativecommons.org/licenses/by/4.0/).