Abstract
The aim of current study is to investigate the significance of green and blue economic activities to mitigate the carbon emission in Saudi Arabia. We use the time series data which covers the period from 1990 to 2019. For empirical estimations, we use nonlinear ARDL approach which confirms that energy indicators and blue economic indicators are not mature enough to achieve carbon neutrality objectives. However, after Vision 2030 empirics, positive shocks in green indicators are turning down the carbon level. The findings of energy and blue indicators are useful for policy recommendations which help to achieve the sustainable environmental goals of Vision 2030.
1. Introduction
Carbon neutrality is the term used to explain that the overall carbon dioxide emission and its offset are equal. It is a fact that a huge amount of carbon is released into the atmosphere due to economic, as well as social activities. However, the same amount of carbon squeezed and makes net carbon emission nearly zero is carbon neutrality, which may guarantee environmental protection. While discussing about the sustainable economic development, carbon neutrality seems important, and majority of the countries around the world are giving high priority to carbon neutrality so that economic development can be achieved without deteriorating the environment.
Though carbon neutrality is important for all countries, the same is the case for Saudi Arabia. The Saudi economy is the largest economy of the middle east and also on the list of top 20 economies of the world, due to its high level of natural resources including oil and petroleum. Alongside, industrialization, as well as urbanization, is also increasing in the country. All these factors contributed to the overall economic growth of the country; however, this also lead to a high level of carbon emission. Figure 1 shows the severity of the issue as it can be seen that carbon emission in the country is increasing significantly since 1965. Although many efforts are made by the government to reduce this intensity and to create carbon sinks to squeeze excess carbon [1,2] to achieve carbon neutrality. However, up till now, the problem is still prevailing and needs immediate attention so that new ways could be found to help the country attain sustainable economic development along with carbon neutrality.
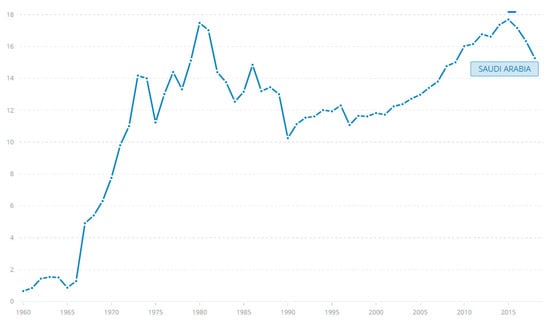
Figure 1.
CO2 emissions—Saudi Arabia (Source: World Development Bank).
After realizing the importance of carbon neutrality for sustainable economic development, researchers tried to explore different factors which can help in the reduction of carbon emission and achieving carbon neutrality. In his regard, it is noted that renewable energy can be an important measure to achieve carbon neutrality [3,4,5,6]. According to these studies, carbon neutrality in selected countries is enhanced by reducing carbon emissions using renewable energy sources. Similarly, energy intensity is also noted to be a significant factor toward carbon neutrality [7,8,9,10]. Besides these solutions, innovations are also presented by previous studies as a potential solution for carbon-related problems of the environment and it is noted that through innovative and eco-friendly products, carbon neutrality can be enhanced [11,12,13,14]. In terms of the importance of oceans for carbon neutrality, researchers tried to explore the impact of the fishery industry on carbon neutrality and found that the development of this industry plays a vital role in the reduction of carbon emission as well as its absorption [15,16,17]. These research conclude that fishery is an important source toward the achievement of carbon neutrality.
Critical analysis of previous literature revealed that none of the studies explore the joint effect of energy components, green components, and blue components on carbon neutrality. Some studies explore few components including renewable energy, innovations and fishery; however, previous studies used only one component. Hence, in light of previous research, the current study is an attempt to fill the gap by addressing four contributions: first, the study explores the impact of the technical grant on carbon neutrality which is not yet explored in empirical research. Technical grants can play a significant role toward carbon neutrality as huge funds are required to develop technically sophisticated but eco-friendly products. This grant enables emerging economies such as Saudi Arabia to enhance research and development in the country to develop sustainable products. These grants help in human wellbeing by providing them clean environment. Currently, no research directly explores the impact of technical grants on carbon neutrality. This study is a pioneer in this regard and uses Saudi Arabia’s data to explore this nexus.
The second contribution of the study is exploring the joint effect of blue factors including fishery, and marine trade on carbon neutrality. There is no research done to explore if marine trade can also play any role in the reduction of carbon emissions. The importance of marine trade cannot be ignored because the majority of global trade is done through water and a huge amount of energy is consumed in this sector. Although currently it is noted that the contribution of this sector in carbon emission is low [18] as compared to other forms of trade. This shows that incorporation of this factor in research is important to check the role of marine trade in Saudi Arabia, in terms of carbon neutrality, so that policy implications can be formulated ahead of time.
The third contribution is the investigation of energy factors, green factors, and blue factors simultaneously, to know the combined impact of these factors on carbon neutrality. As far as green economic factors are concerned, Du et al. [19] argue that technological innovations can help in the reduction of carbon emission. This argument motivates us to check if these green economic factors can help in achieving carbon neutrality or not. In light of these arguments, it seems vital to examine the impact of energy, green and blue economic factors on carbon neutrality; it would be beneficial as it will allow us to put forward important policy implications in terms of ways to achieve carbon neutrality.
The last contribution of this research is to check the impact of Vision 2030 on the carbon neutrality targets of Saudi Arabia. The main reason is the fact that fossil fuel consumption is the main energy source of the country; however, under Vision 2030, it is committed that usage of sustainable energy sources, such as renewable energy, will be implemented to meet the carbon neutrality targets. Hence, it is important to check how many sustainable goals of Saudi Vision 2030 are going to be met. The data set is divided according to the availability since Vision 2030 implementation so that direction of this initiative toward carbon neutrality can be noticed. The findings of the study would be helpful for policymakers to examine the directions and success of Vision 2030, in terms of offsetting the carbon emission and achieving the carbon neutrality goals. For data analysis purposes, the nonlinear ARDL technique is used to check the impact of energy factors, green factors, and blue factors to achieve carbon neutrality in Saudi Arabia.
To account the above-mentioned contributions, the study draws five objectives to address the research questions. The first objective is to examine the impact of energy factors on carbon neutrality. The second objective is to investigate the relationship between green economic factors and carbon neutrality. The third objective is to address the consequences of blue factors on carbon neutrality. The fourth objective is to compare the effect of energy factors, green factors, and blue factors on carbon neutrality to know which factors are most beneficial in terms of achieving carbon neutrality in Saudi Arabia. The fifth objective is to check the importance of Vision 2030 for the carbon neutrality targets of Saudi Arabia.
2. Literature Review
The literature is divided into three sections; energy factors and carbon neutrality, green indicators and carbon neutrality, and blue economic factors and carbon neutrality.
2.1. Impact of Energy Factors on Carbon Neutrality
When it comes to carbon neutrality, energy factors are the first to be considered because it is noted that energy consumption is the main source of carbon-related environmental issues. Currently, researchers are trying to explore how energy intensity is related to carbon neutrality and in this regard Gil and Bernardo [20] explored the measures which can be taken in Portugal to achieve carbon neutrality. They assess the road map toward carbon neutrality and asserts that reduction in energy intensity is the pathway toward achieving carbon neutrality. Similarly, Wang et al. [21] used Chinese data from the year 2007 to 2019 to investigate how much carbon neutrality targets age achieved in the country through effective use of energy by reducing energy intensity in this period. They found that energy intensity is high in China and it is recommended that strict measures should be taken against industries that are energy-intensive so that carbon neutrality goals can be achieved. Likewise, another study is done by Andersson and Karpestam [22] to check how carbon neutrality can be achieved by examining the determinants of energy intensity which is the main source of carbon emission. They used data from two emerging and two developed countries and asserts that although capital is the main source of carbon emission, however, carbon neutrality can be achieved through a reduction in energy intensity by making each unit of capital more energy efficient.
Besides energy intensity, renewable energy can also be related to carbon neutrality as Li et al. [5] used Chinese data from year 1989 to 2019 to check the relationship between renewable energy and carbon neutrality. They found that China’s carbon neutrality targets can be achieved through using renewable energy sources as it reduces carbon emissions significantly. Additionally, Li et al. [4] conducted a study in top exporting countries of the world to examine if renewable energy can be a source of carbon neutrality in these countries. They found a positive association between renewable energy and carbon neutrality and recommend that to achieve carbon neutrality, countries should promote the use of renewable energy sources. Similarly, Juan Lin et al. [23] explored the nexus between renewable energy sources and carbon neutrality in BRICS countries from the year 1980–2018. Their results also indicate that renewable energy consumption is a viable option to achieving carbon neutrality in these countries.
2.2. Impact of Green Factors on Carbon Neutrality
Carbon neutrality can also be achieved through green economic factors including innovations and technical grants. As far as innovation is concerned, it is the growth of energy-efficient, green, and clean products which leads to carbon neutrality. In this regard, Sun et al. [13] researched Turkey to investigate how ecological innovations can help in achieving carbon neutrality targets in emerging countries. By applying the QARDL approach to Turkish data from 1995 to 2018, they found that these innovations have a significant and positive impact on carbon neutrality targets. Another study by Iqbal et al. [24] investigated the nexus between innovation and carbon neutrality in OECD economies from the year 1970 to 2019. Through the augmented mean group approach, they found that innovations play a significant role in helping these economies to achieve their carbon neutrality targets. Similarly, Shao et al. [25] employed (CS-ARDL) test on data from N-11 countries from 1980 to 2018 to check if the positive relationship between innovation and carbon neutrality is valid. Their result confirmed that green technological innovations play a significant and positive role in the carbon neutrality of these countries.
Although it is a top priority of countries around the world to reduce carbon footprint and achieve carbon neutrality, however, it is also a fact that technologies required for this goal are expensive and countries need support for this. The technical grant helps in the development of sophisticated and updated products and systems for environmental protection as well as the introduction of programs for human development. In this regard, the green climate fund is established by United Nations to help developing countries to achieve carbon neutrality by reducing carbon emissions. According to United Nations Environment Program [26] these funds help in the reduction of carbon emission of 4.4 million tons. Moreover, this grant creates jobs that affect the lives of people directly and many other areas will also be impacted in terms of the 2030 Agenda for Sustainable development [27]. Likewise, another technical grant is also approved by the US government for carbon reduction so that until the mid of century, carbon neutralization can be achieved. It shows that technical grants can play a positive role in carbon neutrality.
2.3. Impact of Blue Factors on Carbon Neutrality
In terms of the blue economy, fishery, as well as marine trade, are important factors. As far as the fishery is concerned, the economic impact of this industry is very prominent and it is believed that the fishing industry has the least carbon footprint as compared to other types of food [28]. The main reason is the fact that fishery does not need livestock care as well as farmland Mcdermott [29]; hence, previously it is believed that for carbon neutrality, the fishery can play a role. Logically this seems valid and research literature also validates this point. According to Wan et al. [30], although it is believed that energy consumption in the fishery is a carbon contributing element, however, through marine ranching, Zhou et al. [17], a significant amount of carbon can be absorbed from the atmosphere, Wan et al. [30], which can balance the overall carbon in the air. Another channel through which fishery helps in carbon neutralization is through the cultivation of seaweed as according to Feng et al. [16]. This reduced a significant amount of carbon in China proving that there is a huge potential in ocean-based solutions for climate change.
As far as the marine trade is concerned, it is noted that almost 80% of the trade is done through this channel. This shows the importance of marine trade for the economy; however, as with all types of economic activities, environmental considerations for marine trade are also important. According to Ozer et al. [31] assessment of different types of gas emissions by marine trade is crucial in terms of the implementation of regulations. In this regard, Taghvaee et al. [32] conducted a study to investigate the difference in carbon emission by water transport and other forms of transport. Their analysis revealed that marine trade is the most energy-effective transport and that is why the overall carbon emission by marine trade is significantly lower. The same type of argument is also made by Fratila et al. [33] who mentioned that in terms of carbon emission, marine trade proved to be the most efficient type of transportation. However, Ben Jebli and Belloumi [34] found that there exists bidirectional causality between marine trade and carbon emission. They used data from Tunisia and concluded that marine trade contributes to carbon emission.
The above-mentioned literature highlights that there is not even a single study that checks the impact of marine trade on carbon neutrality. However, it is important to check this nexus because if carbon emission can be affected by marine trade then it is important to check how and through which channel it can help in achieving carbon neutrality. Moreover, empirical research on nexus between technical grant and carbon neutrality is missing. It is essential to fill this research gap by using empirical data to investigate the role of technical grants to attain carbon neutrality. Alongside, different elements of energy factors, blue economic factors, and green economic factors show some impact on carbon neutrality. However, the combined impact of these factors on carbon neutrality is missing in the literature. Hence, it is important to fill this research gap so that major policy implications can be advised.
3. Data and Methodology
3.1. Data
For empirics, the data of carbon, energy, green and blue indicators are covering the period of 1990–2019. According to Union of Concerned Statistics (https://www.ucsusa.org/resources/each-countrys-share-co2-emissions, accessed on 12 July 2022), Saudi Arabia is the higher per capital carbon emitter in the world; however, it is urgent to study the significant measures that may help to minimize the environmental externalities. To address this environmental issue, the study addresses the role of energy factors, green factors, and blue factors to attain carbon neutrality. For energy factors, energy intensity and renewable energy are used as a proxies for empirical estimations. Green factors included the innovation and technical grant. Fishery and ocean trade are used as a proxy of blue indicators. The data of carbon emission, energy intensity, innovation and technical grants are obtained from World Development Indicators (WDI), renewable energy is from International Renewable Energy Agency (IRENA), fishery and ocean trade is collected from Food and Agriculture Organization of the United States (FAO). The definitions and notations are reported in Table 1.

Table 1.
Data and source.
The studied models for energy, green and blue indicators are as below:
- Model 1:
- Model 2:
- Model 3:
The models are formed by using the studies of [35,36,37] which have ignored the economic growth and population in the studied models. Iqbal et al. [24] has not included the population in econometric model, whereas, Yue et al. [14] has not used the economic growth. However, we have formed the model specifications to confirm the reliability of models, such as used the omitted variable bias test (we use STATA command “ovtest” for omitted variable bias. The F-statistics for Model 1 is 0.07, Model 2 is 0.24, and Model 3 is 0.94, with p-values 0.977, 0.865, and 0.438, respectively. However, it is concluded that the models have no omitted variable bias). Moreover, to investigate the implications of Saudi Vision 2030, we split the data into two sub sets; before-Vision and after-Vision. This assists to evaluate the impacts of plans that are formulated under the umbrella of Vision 2030, which helps to determine the future plans and directions that lead toward the carbon neutrality.
3.2. Methodology
- Autoregressive Distributed Lag (ARDL)
is carbon neutrality in the above equations, is energy efficiency, is renewable energy, is innovation, is the fishery, and is ocean trade. The error term is shown by , whereas , are elasticity coefficients for the long term. For the cointegration test, short-run elasticities but long-run cointegration is checked in these equations. This is done because the only long-run impact of explanatory variables on carbon neutrality is checked in these equations.
ARDL form of Equations (2)–(4) takes the following form:
By converting the above equations in matrix form by making all variables as dependent variables, Equations (5)–(7) can be formed. It is essential to measure the long as well as short-run cointegration and do this. The hypothesis is formulated where, in the long run, the null hypothesis of no cointegration is , and the alternative hypothesis is . Similarly, the short-run null hypothesis is and the alternative hypothesis is .
where, = 1st difference operator, to = short run elasticity operators, to = long run elasticity operators, = constant, = noise.
F-statistics and critical values are used to decide whether to accept or reject the hypothesis. The critical values presented by Narayan [38] and Pesaran et al. [39] are used for conclusive statements regarding cointegration.
Nonlinear ARDL
Cointegration tests are based on the linear association between independent and dependent variables. However, this association can be negative and positive, and to cater this asymmetric association, a nonlinear ARDL approach is used [38].
According to Bahmani-Oskooee and Mohammadian [40] and Delatte and lopez-Villavicencio [41], independent variable should be decomposed into two more set of series by considering the positive and negative changes. Following this, Equations (11)–(13) take the following form:
After incorporating the positive and negative changes, Equations (8)–(10) takes the following form:
where, and = coefficients of short run elasticity, and = coefficients of long run elasticity, = carbon neutrality, = energy factors, = green factors, = blue factors.
The Wald test is applied to measure the short run and long run asymmetries, whereas, for optimal lag determination, the Akaike information criterion is used. It is also worth mentioning that bound test is also necessary [42] to check the long-run cointegration by comparing f-statistics and critical value. In this scenario, the null hypothesis can be presented through .
4. Results
4.1. Descriptive Statistics
Descriptive statistics for main variables are presented in Table 2, and it can be noted that grant has the highest mean value and energy intensity has the lowest mean value. In the case of standard deviation, the highest standard deviation is for innovation showing that innovation is highly volatile, whereas energy intensity is least volatile.
Table 2.
Summary of statistics.
4.2. Structural Break Test
It is necessary to check if there are any structural breaks in the data and for this purpose Chow structural break test is used. The null hypothesis represents no structural break, whereas the alternative hypothesis represents that there is a structural break. The result of the Chow structural break test is presented in Table 3. It can be seen that the value of F-statistics is insignificant. Hence, it can be said that there is no structural break, and coefficients are constant across the sample. In addition to Chow structural break test, we used the Quandt-Andrew structural break test to confirm the findings of Chow test. The null hypothesis of Quandt-Andrew breakpoint test represents that there exists no break point [43,44]. The findings are reported in second section of Table 3, which fail to reject the null hypothesis. However, both breakpoint tests mention the non-existence of structural breaks in data.
Table 3.
Structural break test.
4.3. Unit Root Test
In order to check the stationarity of the data, two unit root tests are used, including DF-GLS and KSUR. Table 4 presents the results of these tests. It is evident that unit root is present at a level in the majority of the variables, which is because test statistics are lower than the critical value. This means data are non-stationary at the level. Hence, the first difference is required. However, all variables are stationary at the first difference at a 1% significance level. It is evident that unit root is present at a level for , as test statistics are lower than the critical value. Grant and ocean trade are stationary at a level for GF-GLS unit root test. In case of KSUR, energy intensity and grant are stationary at a level. Hence, the first difference is required. However, all variables are stationary at the first difference at a 1% significance level. In the presence of mix results of unit root, we must use bond cointegration test, which is used to confirm the long run existence of the studied models.
Table 4.
Unit root test.
4.4. Cointegration Test
ARDL bounds cointegration test is used to check cointegration between variables, and results are presented in Table 5. It can be noticed that F-statistics in all models is higher than the upper bound critical value at 1%, 5%, and 10% critical values. This shows that cointegration exists between variables, and the null hypothesis of no cointegration is rejected. In this case, with stationarity of variables at level and first differences the ARDL test is appropriate to check the short-run and the long-run association between variables.
Table 5.
ARDL bounds cointegration test.
4.5. BDS Test
After examining the cointegration test, we have to use the linearity and nonlinearity test. The purpose is to analyze the existence of nonlinearity in the data series. We have used the BDS test, proposed by Broock et al. [46] with null hypothesis of “series are linearly dependent”. Table 6 confirms the significance of series at each dimension, mentioning that the variables are nonlinearly dependent. However, we have to apply nonlinear ARDL test, instead of simple ARDL test.
Table 6.
BDS test.
4.6. Estimation
4.6.1. Non-Linear ARDL Estimates
In order to check the impact of positive and negative shocks in independent variables on dependent variables, the non-linear ARDL method is used, the results are presented in Table 7 and Table 8. Afterward, the data are divided in two parts; before implementation of Vision 2030 and after Vision 2030 to investigate the effect of Vision 2030 policies to minimize the environmental externalities. This will help the policymakers to check if there is a need to alter the environmental policies in Vision 2030.
Table 7.
Nonlinear ARDL estimation.
Table 8.
Asymmetric and model diagnostics.
4.6.2. Full Sample Analysis
Long Run Estimates
Results from full sample analysis are reported in Table 7, where energy efficiency, renewable energy, and innovation have insignificant coefficients. In achieving carbon neutrality in Saudi Arabia, these factors do not play any role. These results contradict the previous studies, including [10,25,27]. The explanation for this insignificant effect could be that Saudi Arabia is the major oil producer, and the country has the highest oil reserves, which makes energy sources irrelevant due to lower prices and lower production costs. Likewise, the negative and positive shocks in innovation coefficients are negative but insignificant. This suggests that although innovation adversely affects carbon neutrality, its impact is insignificant. One possible explanation could be that the country has not achieved a level at which innovation can help to reduce the carbon emission. Due to its dependence on oil, Saudi Arabia had focused less toward industrial innovation and promoting entrepreneurs [47,48].
As far as the grant is concerned, the positive shocks in the grant have significant and positive coefficient, which suggest that 0.029% carbon can be enhanced by a 1% increase in the grant. However, negative shocks in grants do not affect carbon neutrality. The results cannot be compared with the results of other researchers. However, the insignificant relationship could be because, in Saudi Arabia, a major portion of the grant is not used for solving related environmental issues. Moreover, Saudi Arabia recently established different funds to invest in carbon neutralization and targets to achieve carbon neutrality in 2060. Hence, these grants and funds are not showing any impact.
In the case of blue factors, the positive and negative shocks in the fishery have a significant and positive impact on carbon neutrality; however, the strength of the effect is not strong. This confirms that increase (decrease) in fishery increases (decreases) carbon emission. This result is aligned with the results of Wang et al. [31]. Moreover, positive shocks in ocean trade have a significant and positive coefficient, suggesting that any positive shock increases carbon emission. The negative shocks in ocean trade have a significant and negative coefficient, suggesting that negative shocks in ocean trade reduce carbon emission. The results regarding the blue factors confirm that Saudi Arabia understands the importance of marine sector. The country’s strategic location links three continents, and it is surrounded by many coasts; hence, a significant portion of global trade is done through it. Moreover, Saudi Arabia is struggling to attain sustainable marine development which leads to carbon neutrality.
Short Run Estimates
The results regarding the short-run analysis confirm that negative shocks in energy efficiency enhance carbon externalities, as the coefficient is significant and positive. This result is aligned with the findings of Wang et al. [10], and the main reason is that being a leader in oil production, the country’s energy needs are met by fossil fuels. However, recent reforms ensure that strict measures are taken against energy-intensive industries. Moreover, economic diversification is in progress to reduce the dependence on the oil sector. This results in a reduction of energy intensity helping the country to meet carbon neutrality targets. In terms of green factors, it can be seen that these factors do not impact carbon neutrality. This suggests that green reforms are not mature enough to accomplish carbon neutrality targets. The results for blue factors show that negative shocks in the fishery enhance carbon emission. However, positive shocks have a positive coefficient for ocean trade, and negative shocks have a negative coefficient. This suggests that any increase in ocean trade increases carbon, in contrast, negative shocks in ocean trade reduce carbon emission. This shows that the efforts of the government to reduce the carbon footprint of the ocean trade sector are showing benefits.
4.6.3. Before Vision 2030 Analysis
The results regarding the before Vision 2030, for non-linear ARDL, are presented in Table 9 and Table 10. For energy efficiency, long-run and short-run estimates show that the positive shocks in energy intensity have a positive coefficient. In contrast, negative shocks in energy intensity only have a significant positive coefficient in the short run. This means an increase in energy intensity improves carbon emission, in the long run. These results are opposite to previous studies [10,20,22]. It is observed that the economic development of Saudi Arabia is dependent on energy-intensive industries, and the lifestyle is also energy-intensive because energy prices are low. Due to this, although energy intensity is high before Vision 2030, carbon emission is increased due to other measures. For renewable energy, coefficients are significant only in the short run, showing that positive shocks in renewable energy consumption significantly enhance carbon emission. In comparison, negative shocks in renewable energy consumption reduce carbon emission. This result is aligned with the findings of Li et al. [4].
Table 9.
Nonlinear ARDL estimation (before Vision 2030).
Table 10.
Asymmetric and model diagnostics (before Vision 2030).
The same is true for innovations where coefficients are significant only in the short run. In the short run, positive shocks in innovation increase carbon neutrality and negative shocks in innovation are insignificant. The finding contradicts with Iqbal et al. [24], which reported that innovative products are vital in reaching carbon neutrality targets. The main reason for contradiction is that previously Saudi Arabia has focused on oil sector and was less motivated toward high tech, innovation, and environment. As far as the grant is concerned, long-run estimates show that negative shocks enhance carbon neutrality. However, in the short-run positive shocks in grant surge the carbon level. This suggests that before Vision 2030, the full benefits of technical grants were not achieved because there was no policy to use technical grants to improve the country’s carbon neutrality targets. The blue factors suggest that positive shocks in the fishery enhance carbon, in both the short and long run. However, negative shocks improve carbon neutrality in the short run. Before Vision 2030, the country’s economy was dependent on the oil sector, and other sectors, including ocean resources, were neglected [36]. Hence, part of these sectors is limited in the country’s major sustainable issues. For ocean trade, only positive shocks impact carbon positively in both the short-run and long run.
4.6.4. After Vision 2030 Analysis
In Table 11 and Table 12, results for non-linear ARDL estimates after Vision 2030 are presented. It can be noticed that the coefficient of energy intensity is negative and positive shocks are significant, which shows that energy intensity plays a significant role in carbon emission. However, the coefficient of negative shocks in energy intensity gets significant and positive after Vision 2030, showing the positive effect of energy-related policies on carbon neutrality after the introduction of Vision 2030. This change can be attributed to increased energy products and diversification of the economy to the non-oil sector. Moreover, the government tried to introduce technically enhanced and low energy-intensive products, which reduced the energy intensity and enhanced the overall carbon neutrality targets. In the case of renewable energy consumption, in both short-run and long-run estimates, positive shocks enhance carbon, aligned with previous studies [22,24].
Table 11.
Nonlinear ARDL estimation (after Vision 2030).
Table 12.
Asymmetric and model diagnostics (after Vision 2030).
The impact of innovation is insignificant in the long run, but both negative and positive shocks have a negative coefficient in the short run. This means increases (decrease) in innovation increase (decrease) the carbon neutrality. This result is in line with Shao et al. [25], which presents the efforts of Saudi government to introduce the significant policies regarding innovation which on the one hand trigger the economic growth and, on other hand, lead toward carbon neutrality in Saudi Arabia. However, in the long run, the magnitude is low. Hence, it is needed that efforts should be diverted to protect innovations through patents in a way that low carbon emission goals should also be made sure by these patents.
The coefficients for positive and negative shocks are negative and positive respectively, for technical grants, showing that any shock in technical grants reduces carbon emission. Wang et al. [49] explains that development aids are sometimes used to achieve the goals of donor countries; hence misallocation of funds takes place. Due to these reasons, the original intention of the funds, such aa reduction in carbon emission, is deviated, leading to a reduction of the effect of these grants on climate.
As far as blue factors are concerned, the coefficients of positive and negative shocks in the fishery are positive, showing that any increase (decrease) in fishery increase (decrease) the carbon level. Fishery sector requires nonrenewable energy consumption, which increases the carbon emission. However, up till now, the Saudi government has not achieved to get renewable energy sources to support the fishery sector, such as renewable source of energy for boating [50]. In terms of ocean trade, positive shocks reduce the carbon level, in the long and short run. Negative shocks in ocean trade reduce carbon level, in the long run and short run. Before Vision 2030, the role of ocean trade toward carbon neutrality is not significant. However, after Vision 2030, the alignment of ocean trade policies with sustainability is not achieved yet. However, to fulfil the carbon neutrality targets of Saudi Arabia, a prompt action is required.
5. Conclusions
The first objective of this study is related to the nexus between energy factors and carbon neutrality. It is found that in full sample estimation, energy factors are irrelevant to carbon neutrality. However, before vison 2030, energy factors including energy intensity and renewable energy consumption enhance carbon neutrality, which gets significant after vison 2030. Saudi Arabia is a leading producer and exporter of petroleum products; hence energy prices are low. The main focus is on other measures to enhance carbon neutrality, which is the reason for the positive impact of energy intensity on carbon neutrality. However, in Vision 2030, attention is diverted toward the diversification of the economy to low energy intensity sectors and the introduction of energy-efficient products.
The second objective is regarding the green factors and carbon neutrality, and it is noticed that innovation is irrelevant to carbon neutrality in the full sample, whereas, after vison 2030, both positive and negative shocks in innovation enhance carbon neutrality, in the short run. For technical grants, the effect on carbon neutrality is enhanced after the introduction of Vision 2030 because any shock results in increased carbon neutrality. In comparison, the third objective related to the impact of blue factors on carbon neutrality is addressed. In the full sample, positive and negative shocks in fishery negatively affected carbon neutrality. The results regarding ocean trade show that positive shocks and negative shocks enhance and reduce carbon emission respectively, for full sample and after Vision 2030.
While addressing the fourth objective, which is about the combined impact of energy factors, green factors, and blue factors, in the full sample as well as before and after Vision 2030 estimations, green factors proved to be the most significant in terms of the effect on carbon neutrality. The importance of blue sector is not attributed yet, however, they are unable to achieve carbon neutrality. Similarly, energy factors are either irrelevant or are in the opposite direction.
In light of these findings, some important policy implications are diverting the attention toward low-intensity energy products to achieve green environmental objectives. It is recommended that innovations in terms of low-intensity products should be promoted and alternative types of energy products should be introduced in the country. This will reduce the problem of energy intensity and reduce the country’s dependence on fossil fuel energy. The marine sector needs to introduce modern mechanisms which push up the fishery and marine trade, such as solar power boating. Solar boating will be useful in Saudi Arabia, as the sea shores have sunshine throughout the year.
As for the limitations of the study, we were unable to collect the pre 1990 data to create a longer time series data. In case of Saudi Arabia, monthly and quarterly data are not available. For future directions, researchers can focus on GCC countries and carry out a comparative study. Similarly, to increase the scope of study, the future research can be carried out on North African and Middle Eastern countries. There are fewer studies on Blue economy; however, I suggest that upcoming works should include more variables of blue economy.
Author Contributions
Conceptualization, S.S., R.W., G.A. and S.A.A.; methodology, S.S., R.W., G.A. and S.A.A.; software, S.S., R.W., G.A. and S.A.A.; validation, S.S., R.W., G.A. and S.A.A.; formal analysis, S.S., R.W., G.A. and S.A.A.; investigation, S.S., R.W., G.A. and S.A.A.; resources, S.S., R.W., G.A. and S.A.A.; data curation, S.S., R.W., G.A. and S.A.A.; writing—original draft preparation, S.S., R.W., G.A. and S.A.A.; writing—review and editing, S.S., R.W., G.A. and S.A.A.; visualization, S.S., R.W., G.A. and S.A.A.; supervision, S.S., R.W., G.A. and S.A.A.; project administration, S.S., R.W., G.A. and S.A.A.; funding acquisition, S.S., R.W., G.A. and S.A.A. All authors have read and agreed to the published version of the manuscript.
Funding
This work was funded by the University of Jeddah, Jeddah, Saudi Arabia, under grant No. (UJ-22-DR-43). The authors, therefore, acknowledge with thanks the University of Jeddah for its technical and financial support.
Institutional Review Board Statement
Not applicable.
Informed Consent Statement
Not applicable.
Acknowledgments
The authors, therefore, acknowledge with thanks the University of Jeddah for its technical and financial support.
Conflicts of Interest
The authors declare no conflict of interest.
References
- Shaltout, K.H.; Ahmed, M.T.; Alrumman, S.A.; Ahmed, D.A.; Eid, E.M. Evaluation of the carbon sequestration capacity of arid mangroves along nutrient availability and salinity gradients along the Red Sea coastline of Saudi Arabia. Oceanologia 2020, 62, 56–69. [Google Scholar] [CrossRef]
- The Independent. From Waste to Resource: Can Recycling CO2 Help Saudi Arabia Go Green? Available online: https://www.independent.co.uk/climate-change/sgi/carbon-dioxide-recycling-saudi-arabia-b1890563.html (accessed on 12 July 2022).
- Lahiani, A.; Mefteh-Wali, S.; Shahbaz, M.; Vo, X.V. Does financial development influence renewable energy consumption to achieve carbon neutrality in the USA? Energy Policy 2021, 158, 112524. [Google Scholar] [CrossRef]
- Li, H.-S.; Geng, Y.-C.; Shinwari, R.; Yangjie, W.; Rjoub, H. Does renewable energy electricity and economic complexity index help to achieve carbon neutrality target of top exporting countries? J. Environ. Manag. 2021, 299, 113386. [Google Scholar] [CrossRef] [PubMed]
- Li, M.; Ahmad, M.; Fareed, Z.; Hassan, T.; Kirikkaleli, D. Role of trade openness, export diversification, and renewable electricity output in realizing carbon neutrality dream of China. J. Environ. Manag. 2021, 297, 113419. [Google Scholar] [CrossRef]
- Zheng, F.; Zhou, X.; Rahat, B.; Rubbaniy, G. Carbon neutrality target for leading exporting countries: On the role of economic complexity index and renewable energy electricity. J. Environ. Manag. 2021, 299, 113558. [Google Scholar] [CrossRef]
- Akash, A.R.; Rao, A.B.; Chandel, M.K. Relevance of Carbon Capture & Sequestration in India’s Energy Mix to Achieve the Reduction in Emission Intensity by 2030 as per INDCs. Energy Procedia 2017, 114, 7492–7503. [Google Scholar] [CrossRef]
- Nam, E.; Jin, T. Mitigating carbon emissions by energy transition, energy efficiency, and electrification: Difference between regulation indicators and empirical data. J. Clean. Prod. 2021, 300, 126962. [Google Scholar] [CrossRef]
- Wang, H.; Yang, Y.; Keller, A.A.; Li, X.; Feng, S.; Dong Y, n.a.n.; Li, F. Comparative analysis of energy intensity and carbon emissions in wastewater treatment in USA, Germany, China and South Africa. Appl. Energy 2016, 184, 873–881. [Google Scholar] [CrossRef]
- Wang, R.; Wang, Q.; Yao, S. Evaluation and difference analysis of regional energy efficiency in China under the carbon neutrality targets: Insights from DEA and Theil models. J. Environ. Manag. 2021, 293, 112958. [Google Scholar] [CrossRef]
- Chien, F.; Ananzeh, M.; Mirza, F.; Bakar, A.; Vu, H.M.; Ngo, T.Q. The effects of green growth, environmental-related tax, and eco-innovation towards carbon neutrality target in the US economy. J. Environ. Manag. 2021, 299, 113633. [Google Scholar] [CrossRef]
- Shan, S.; Genç, S.Y.; Kamran, H.W.; Dinca, G. Role of green technology innovation and renewable energy in carbon neutrality: A sustainable investigation from Turkey. J. Environ. Manag. 2021, 294, 113004. [Google Scholar] [CrossRef] [PubMed]
- Sun, Y.; Duru, O.A.; Razzaq, A.; Dinca, M.S. The asymmetric effect eco-innovation and tourism towards carbon neutrality target in Turkey. J. Environ. Manag. 2021, 299, 113653. [Google Scholar] [CrossRef] [PubMed]
- Yue, X.G.; Liao, Y.; Zheng, S.; Shao, X.; Gao, J. The role of green innovation and tourism towards carbon neutrality in Thailand: Evidence from bootstrap ADRL approach. J. Environ. Manag. 2021, 292, 112778. [Google Scholar] [CrossRef] [PubMed]
- Ebarvia, M.C.M. Economic Assessment of Oceans for Sustainable Blue Economy Development. J. Ocean Coast. Econ. 2016, 2, 7. [Google Scholar] [CrossRef]
- Feng, C.; Ye, G.; Jiang, Q.; Zheng, Y.; Chen, G.; Wu, J.; Feng, X.; Si, Y.; Zeng, J.; Li, P.; et al. The contribution of ocean-based solutions to carbon reduction in China. Sci. Total Environ. 2021, 797, 149168. [Google Scholar] [CrossRef]
- Zhou, X.; Zhao, X.; Zhang, S.; Lin, J. Marine ranching construction and management in East China Sea: Programs for sustainable fishery and aquaculture. Water 2019, 11, 1237. [Google Scholar] [CrossRef]
- Whieldon, E. Your Climate Change Goals May Have a Maritime Shipping Problem; S & P Global; Available online: https://www.spglobal.com/esg/insights/your-climate-change-goals-may-have-a-maritime-shipping-problem (accessed on 15 July 2022).
- Du, K.; Li, P.; Yan, Z. Do green technology innovations contribute to carbon dioxide emission reduction? Empirical evidence from patent data. Technol. Forecast. Soc. Change 2019, 146, 297–303. [Google Scholar] [CrossRef]
- Gil, L.; Bernardo, J. An approach to energy and climate issues aiming at carbon neutrality. Renew. Energy Focus 2020, 33, 37–42. [Google Scholar] [CrossRef]
- Wang, Y.; Liao, M.; Xu, L.; Malik, A. The impact of foreign direct investment on China’s carbon emissions through energy intensity and emissions trading system. Energy Econ. 2021, 97, 105212. [Google Scholar] [CrossRef]
- Andersson, F.N.G.; Karpestam, P. CO2 emissions and economic activity: Short- and long-run economic determinants of scale, energy intensity and carbon intensity. Energy Policy 2013, 61, 1285–1294. [Google Scholar] [CrossRef]
- Juan lin Shen, Y.; Li, X.; Hasnaoui, A. BRICS carbon neutrality target: Measuring the impact of electricity production from renewable energy sources and globalization. J. Environ. Manag. 2021, 298, 113460. [Google Scholar] [CrossRef] [PubMed]
- Iqbal, N.; Abbasi, K.R.; Shinwari, R.; Guangcai, W.; Ahmad, M.; Tang, K. Does exports diversification and environmental innovation achieve carbon neutrality target of OECD economies? J. Environ. Manag. 2021, 291, 112648. [Google Scholar] [CrossRef] [PubMed]
- Shao, X.; Zhong, Y.; Liu, W.; Li, R.Y.M. Modeling the effect of green technology innovation and renewable energy on carbon neutrality in N-11 countries? Evidence from advance panel estimations. J. Environ. Manag. 2021, 296, 113189. [Google Scholar] [CrossRef] [PubMed]
- United Nations Environment Program. Technology Support Helps Deliver Millions in Climate Funding, Emissions Reductions. Available online: https://www.unep.org/news-and-stories/story/technology-support-helps-deliver-millions-climate-funding-emissions (accessed on 10 July 2022).
- Institute for Marine and Antarctic Studies. Beef, Lamb, Lobster or Fish? Fisheries Study Shows Impact of Food Choice on Carbon Emissions; University of Tasmania: Hobart, Australia, 2019. [Google Scholar]
- Wan, X.; Li, Q.; Qiu, L.; Du, Y. How do carbon trading platform participation and government subsidy motivate blue carbon trading of marine ranching? A study based on evolutionary equilibrium strategy method. Mar. Policy 2021, 130, 104567. [Google Scholar] [CrossRef]
- Mcdermott, A. Eating Seafood Can Reduce Your Carbon Footprint, but Some Fish Are Better than Others. Available online: https://oceana.org/blog/eating-seafood-can-reduce-your-carbon-footprint-some-fish-are-better-others/#:~:text=Worldwide%2C more than 25 percent emissions come from food production.&text=Some foods cost more than,farmland or care of livestock (accessed on 21 July 2022).
- Wan, X.; Xiao, S.; Li, Q.; Du, Y. Evolutionary policy of trading of blue carbon produced by marine ranching with media participation and government supervision. Mar. Policy 2021, 124, 104302. [Google Scholar] [CrossRef]
- Ozer, M.; Canbay, S.; Kirca, M. The impact of container transport on economic growth in Turkey: An ARDL bounds testing approach. Res. Transp. Econ. 2020, 88, 101002. [Google Scholar] [CrossRef]
- Taghvaee, S.M.; Omaraee, B.; Taghvaee, V.M. Maritime transportation, environmental pollution, and economic growth in Iran: Using dynamic log linear model and granger causality approach. Iran. Econ. Rev. 2017, 21, 185–210. [Google Scholar] [CrossRef]
- Fratila, A.; Gavril, I.A.; Nita, S.C.; Hrebenciuc, A. The importance of maritime transport for economic growth in the european union: A panel data analysis. Sustainability 2021, 13, 7961. [Google Scholar] [CrossRef]
- Ben Jebli, M.; Belloumi, M. Investigation of the causal relationships between combustible renewables and waste consumption and CO2 emissions in the case of Tunisian maritime and rail transport. Renew. Sustain. Energy Rev. 2017, 71, 820–829. [Google Scholar] [CrossRef]
- Chaabouni, S.; Zghidi, N.; Mbarek, M.B. On the causal dynamics between CO2 emissions, health expenditures and economic growth. Sustain. Cities Soc. 2016, 22, 184–191. [Google Scholar]
- Sarwar, S.; Alsaggaf, M.I. The role of governance indicators to minimize the carbon emission: A study of Saudi Arabia. Manag. Environ. Qual. Int. J. 2021, 32, 970–988. [Google Scholar] [CrossRef]
- Waheed, R. The Significance of Energy Factors, Green Economic Indicators, Blue Economic Aspects towards Carbon Intensity: A Study of Saudi Vision 2030. Sustainability 2022, 14, 6893. [Google Scholar] [CrossRef]
- Narayan, P.K. Reformulating Critical Values for the Bounds F-Statistics Approach to Cointegration: An Application to the Tourism Demand Model for Fiji; Monash University: Clayton, VIC, Australia, 2004; pp. 1441–5429. [Google Scholar]
- Pesaran, M.H.; Shin, Y.; Smith, R.J. Bounds testing approches to analysis of long run relationships. J. Appl. Econom. 2001, 16, 289–326. [Google Scholar] [CrossRef]
- Bahmani-Oskooee, M.; Mohammadian, A. Asymmetry Effects of Exchange Rate Changes on Domestic Production: Evidence from Nonlinear ARDL Approach. Aust. Econ. Pap. 2016, 55, 181–191. [Google Scholar] [CrossRef]
- Delatte, A.L.; López-Villavicencio, A. Asymmetric Exchange rate pass-through: Evidence from major countries. J. Macroecon. 2012, 34, 833–844. [Google Scholar] [CrossRef]
- Qamruzzaman, M.; Jianguo, W. Nexus between financial innovation and economic growth in South Asia: Evidence from ARDL and nonlinear ARDL approaches. Financ. Innov. 2018, 4, 20. [Google Scholar] [CrossRef]
- Richmond, S.; Andrews, M. Orthodontic treatment standards in Norway. Eur. J. Orthod. 1993, 15, 7–15. [Google Scholar] [CrossRef]
- Andrews, D.W.; Ploberger, W. Optimal tests when a nuisance parameter is present only under the alternative. Econometrica 1994, 62, 1383–1414. [Google Scholar] [CrossRef]
- Kapetanios, G.; Shin, Y. GLS detrending-based unit root tests in nonlinear STAR and SETAR models. Econ. Lett. 2008, 100, 377–380. [Google Scholar] [CrossRef]
- Broock, W.A.; Scheinkman, J.A.; Dechert, W.D.; LeBaron, B. A test for independence based on the correlation dimension. Econom. Rev. 1996, 15, 197–235. [Google Scholar] [CrossRef]
- Shin, Y.; Yu, B.; Greenwood-Nimmo, M. Modelling Asymmetric Cointegration and Dynamic Multipliers in a Nonlinear ARDL Framework. SSRN Electron. J. 2012. [Google Scholar] [CrossRef]
- Kahia, M.; Omri, A.; Jarraya, B. Green Energy, economic growth and environmental quality nexus in Saudi Arabia. Sustainability 2021, 13, 1264. [Google Scholar] [CrossRef]
- Wang, Q.; Guo, J.; Li, R. Official development assistance and carbon emissions of recipient countries: A dynamic panel threshold analysis for low- and lower-middle-income countries. Sustain. Prod. Consum. 2022, 29, 158–170. [Google Scholar] [CrossRef]
- Sunaryo Syahrihaddin, A.; Imfianto, P.S. Solar Energy for a Traditional Coastal Fishing Platform. J. Mar. Sci. Appl. 2019, 18, 366–371. [Google Scholar] [CrossRef]

Publisher’s Note: MDPI stays neutral with regard to jurisdictional claims in published maps and institutional affiliations. |
© 2022 by the authors. Licensee MDPI, Basel, Switzerland. This article is an open access article distributed under the terms and conditions of the Creative Commons Attribution (CC BY) license (https://creativecommons.org/licenses/by/4.0/).