1. Introduction
The environmental concern regarding the impact of the residential sector has been increasing in the last few years. For example, the residential sector is Europe’s second major energy consumer. According to Eurostat [
1], this sector consumed 26.3% of the final electricity consumption in the European Union (EU) in 2019. Additionally, this sector also contributes 36% of the carbon dioxide emissions (CO
2) (European Commission, 2019).
Therefore, to mitigate the environmental impact of dwellings or buildings, designers and architects have adopted sustainable and eco-friendly initiatives to achieve balanced and sustainable development [
2]. As said by the same authors, “green” or “eco-friendly” dwellings are defined by the practice of creating and using healthier and more resource-efficient construction, renovation, maintenance, operation, and demolition models. Roy [
3] complements that explanation by identifying that “green” or “eco-friendly” dwellings attempt to safeguard water, air, and earth by choosing eco-friendly building materials and construction practices. Ragheb et al. [
2] point out that sustainable dwellings or buildings need to have the following characteristics or attributes: (i) alternate energy sources (e.g., solar and wind power); (ii) non-toxic and synthetic materials during the process of construction and maintenance; (iii) efficient ventilation systems designed for efficient cooling and hearting; (iv) appliances and lighting systems with the right energy-efficient energy consumption; (v) high water-saving plumbing fixtures; (vi) landscapes planned that enables passive solar energy; (vii) locally obtained stone and woods; (viii) responsibly harvested woods; (ix) adaptive reuse of older edifices; (x) use of recycled architectural salvage; and (xi) efficient use of space. In the real estate market, numerous rating systems exist to assess the environmental impact of dwellings or buildings and classify them as “green” or “eco-friendly” [
4]. The energy performance certificates (EPCs) are one of them, as Koengkan et al. [
5] and Fuinhas et al. [
6] have cited. The EPCs report the energy efficiency and give recommendations for cost-effective improvements to raise the rating of a dwelling or building [
7].
Consistent with Trotta et al. [
7], these certificates include energy consumption characteristics, such as hot water and air conditioning. Moreover, these certificates also suggest measures to reduce energy use. Indeed, some of these measures can be, for example, reinforcing insulation or installing double glazing in the dwellings. The same authors also state that the year that the dwellings were built, their location, the floor and the area, the composition of their surroundings (e.g., roofs, walls, glazing, and foundations), and whether it is a building or a house determines these certificates. Additionally, the equipment is associated with domestic hot water production and renewable energy sources (e.g., wind power or solar power), air conditioning (e.g., ventilation, heating, and cooling), and water consumption. All these determinants influence the level of the energy performance certificate of a dwelling or building, as mentioned by Fuinhas et al. [
6]. Furthermore, these determinants affect the classification of a “green” or “eco-friendly” dwelling or building, according to Ragheb et al. [
2].
The EPCs in the EU were introduced in 2010 through the Directive 2010/31/EU. Indeed, the EPCs were introduced gradually and at different speeds depending on the member state or region. This directive was the main EU policy instrumental to increasing the energy performance of buildings or dwellings by considering cost-effectiveness and local conditions and requirements [
7]. In 2012 the Directive 2012/27/EU, which was an update of the Directive 2010/31/EU, was established, where specified goals were set for the years 2020 and 2030 (20% and 30% reduction in energy consumption). Later, a new update was realised with the Directive 2018/844/EU, which aimed to accelerate the cost-effective renovation of existing edifices and achieve the goal of a decarbonised building and dwelling stock by 2050 [
8].
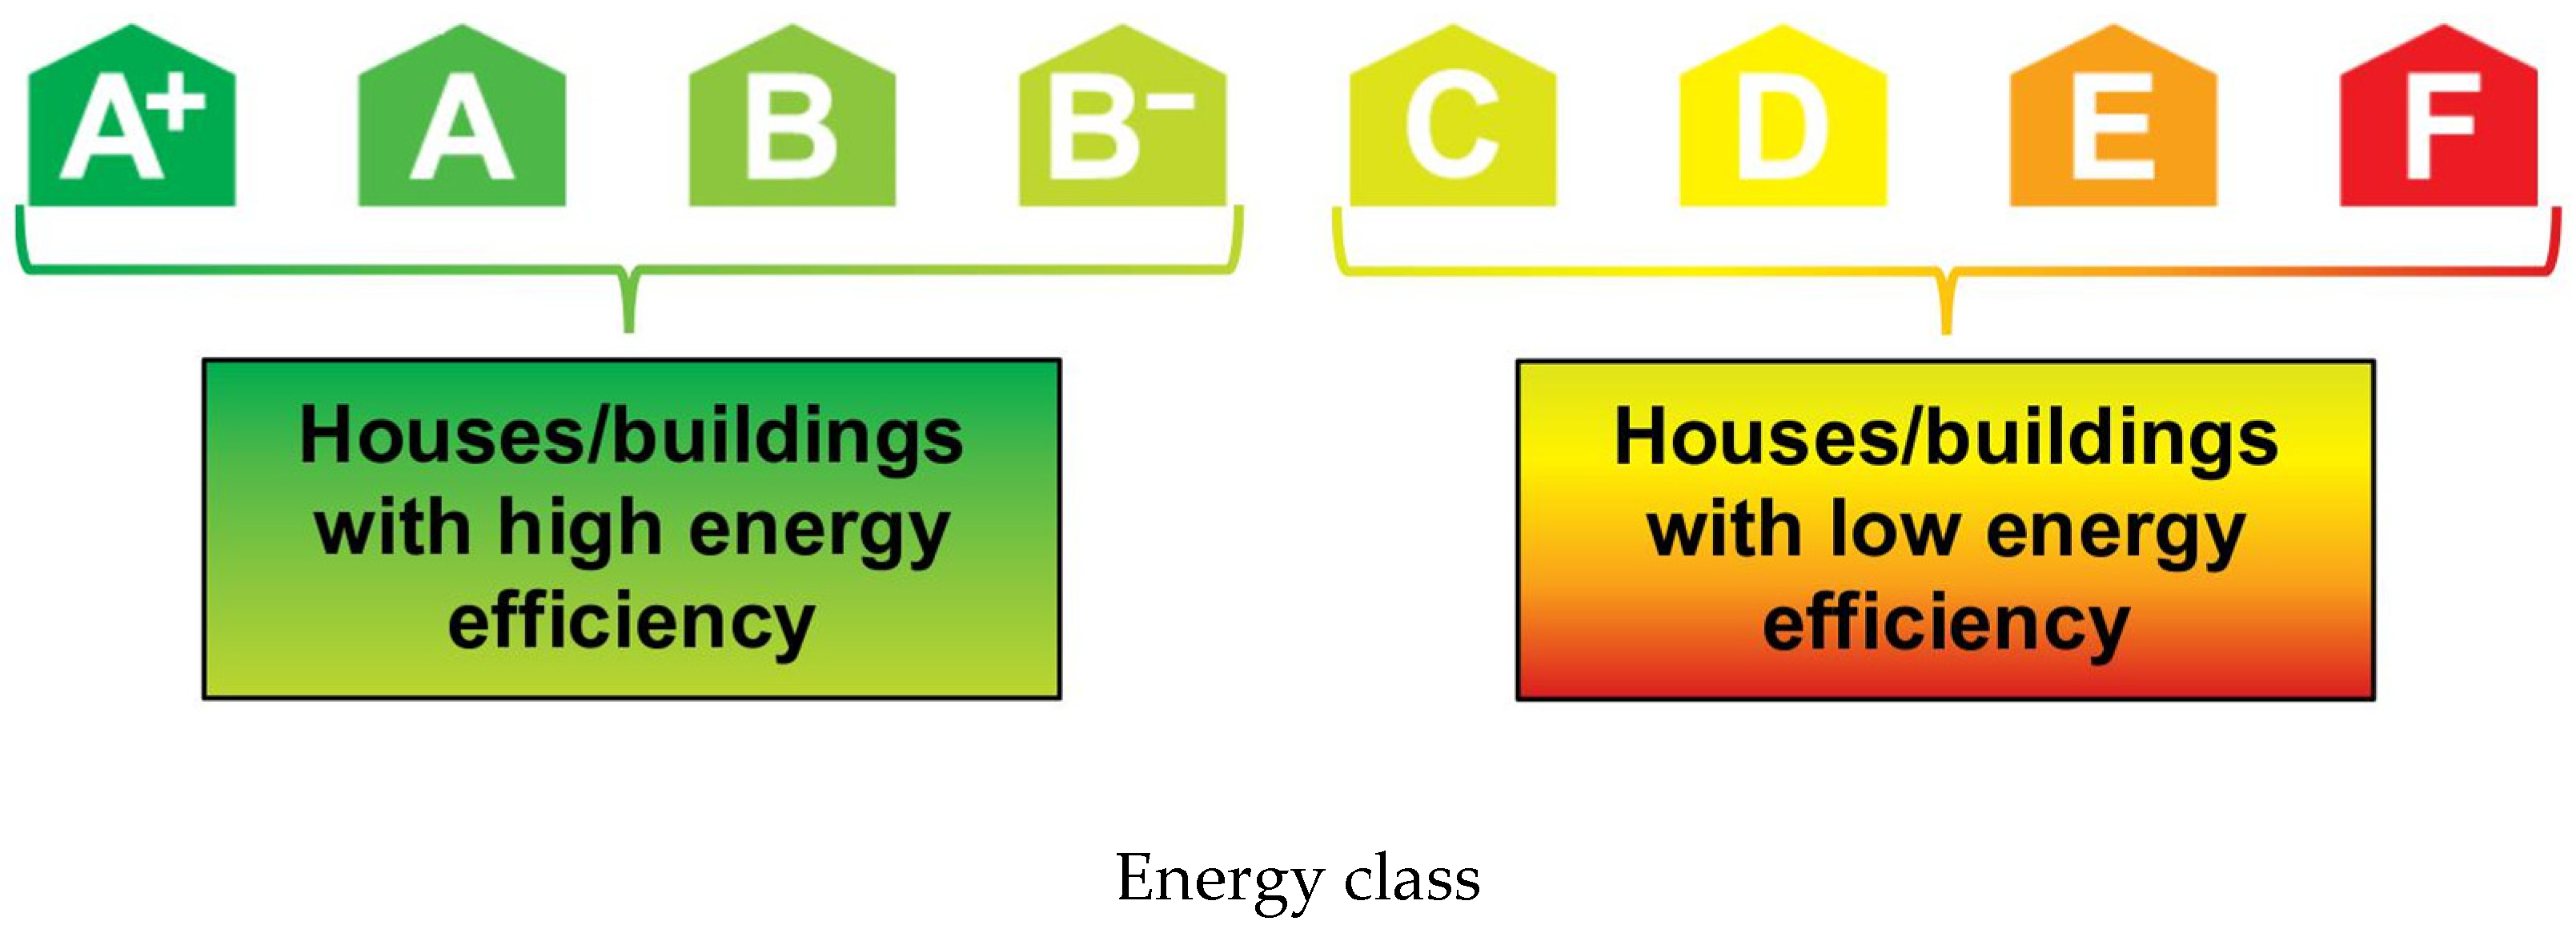
These certificates can also report the energy efficiency of a building or dwelling and make recommendations for cost-effective improvements to raise the energy efficiency rating [
7]. In most countries of the EU, these ratings are expressed on a letter scale between A+ to F, where A+ means that a building or dwelling is very efficient in the consumption of energy and water, and F means that a building or dwelling is very inefficient, as mentioned by Mudgal et al. [
9] and shown in
Figure 1 below.
In Portugal, the study’s object of this empirical investigation, the EPCs became mandatory at the signing of the respective rental, lease, or sale contract with Decree-Law no. 118/2013 on 20 August 2013, which follows the Directive 2010/31/EU. Indeed, from the Decree-Law no. 118/2013 on 20 August 2013, 36,612 certificates were emitted that indicated “green” or “eco-friendly” dwellings in the same year. In 2019 this value reached 83,838 certificates. At the same time, in 2013, 40,568 certificates were emitted that indicated “non-green” or “non-eco-friendly” dwellings. However, the number of homes with certifications indicating “non-green” or “non-eco-friendly” increased to 128,410 in 2019 (as shown in
Figure 2 below).
Indeed, dwellings with green or eco-friendly certificates include dwellings with high energy and water efficiency certificates (e.g., A+, A, B, and B-). In contrast, the non-green/eco-friendly dwellings include low energy and water efficiency certificates (e.g., C, D, E, and F) (see
Figure 3 below).
Increasing the number of high-rated energy certificates is essential for Portugal to reduce domestic energy consumption, as this sector consumed 18.2% of total energy consumption in 2019 [
11].
Therefore, due to the increase in the number of dwellings with “green” or “eco-friendly” certification in Portugal in recent years, as shown in
Figure 2 and
Figure 3 above, it becomes essential to investigate if this increase impacts the transaction prices in the real estate market in this country. Therefore, this investigation’s main objective is to analyse the heterogeneous impact of dwellings with a “green” or “eco-friendly” certification on transaction prices in the real estate market in Portugal. Therefore, microeconomic panel data from 289 Portuguese municipalities between 2014 and 2019, analysed with the ordinary least squares (OLS) with fixed effects, and quantile regression with fixed effects (MM-QR) econometric models, will be used to carry out this analysis.
The literature scarcely focuses on the impact of the availability of dwellings’ efficiency certifications on real estate markets. Therefore, this empirical investigation will introduce a new analysis regarding the effect of dwellings with “green” or “eco-friendly” certificates on transaction prices in Portugal. Furthermore, this investigation is innovative by using econometric and microeconomic approaches to identify the possible effect of “green” or “eco-friendly” certificates on transaction prices. Lastly, the results and explanations of this study will support the policymakers and governments in developing consistent policies and initiatives that promote the “green” or “eco-friendly” dwellings in Portugal or in similar economies.
The rest of this paper is presented as follows.
Section 2 provides an overview of the literature.
Section 3 describes the methodological approach and the data used in this investigation.
Section 4 presents the empirical results.
Section 5 discusses the main results, and finally,
Section 6 presents the conclusions and possible policy implications.
2. Literature Review
As mentioned in the introduction, the literature does not explore the impact of dwellings or buildings with “green” or “eco-friendly” certificates on transaction prices and rents. However, most studies related to this topic of investigation have approached the impact of EPCs on transaction prices and rents (as shown in
Figure 4 below).
For this reason, this research has chosen to use similar studies, such as those on the effect of EPCs on transaction prices and rents (e.g., Mudgal et al. [
9]; Olaussen et al. [
12]; Barreca et al. [
13]; Wilkinson and Sayce [
14]; French [
15]; Aydin et al. [
16]; McCord et al. [
17]; McCord et al. [
18]; Khaza and Sønstebø [
19]; Cespedes-Lopez et al. [
20]; Chegut et al. [
21]; Wilhelmsson [
22]; Dell’Anna et al. [
23]; Olaussen et al. [
24]; Franke and Nadler [
25]; Hårsman et al. [
26]; Roshchanka and Evans [
27]; Davis et al. [
28]; Fuerst et al. [
29]; Qian and Guo [
30]; Cerin et al. [
31]; Högberg [
32]; Sánchez et al. [
33]; Watts et al. [
34]; Fuerst and McAllister [
35]; and Dixon et al. [
36]). The rationale behind these studies is that the EPC ratings influence whether a house/building is “green” or “eco-friendly” or not. In this investigation, the EPCs with ratings with high energy efficiency (e.g., A+, A, B, and B-) and ratings with low energy efficiency (e.g., C, D, E, and F) will be used as a proxy for dwellings with “green” or “eco-friendly” certificates and dwellings with “non-green” or “non-eco-friendly” certificates.
Indeed, most studies that approach the impact of EPCs on transaction prices and rents studied the following countries: Australia (one); Belgium (one); Ireland (one); China (one); France (one); Austria (one); Turkey (one); Italy (one); Germany (one); Russia (one); the Netherlands (one); India (two); Norway (three); Spain (two); the United States (one); and the United Kingdom (eight).
The country with the most studies realised on this topic is the United Kingdom, with eight studies. Moreover, none of these authors mentioned above approached other countries such as Portugal. Most of the studies mentioned in this literature review used as a method the following econometric models for estimation: the spatial autoregressive model; binary logit model regression; ordinal regression; analysis of variance (ANOVA); quantile model regression; and hedonic price model. None of the authors mentioned above used the OLS with fixed effects and MM-QR as a method approach. Recognising the correct model’s specification is far from easy, and when one uses an inadequate econometric modelisation, it can lead to narrow interpretations of economic relationships. In other words, gaps in the literature regarding these econometric specifications of relationships need to be explored and filled.
Indeed, in the literature, some authors indicated that the dwellings or buildings with green/eco-friendly certificates (e.g., A+, A, B, and B−) increase the transaction prices and rents (e.g., Mudgal et al. [
9]; Barreca et al. [
13]; Wilkinson and Sayce [
14]; French [
15]; Aydin et al. [
16]; McCord et al. [
17]; Khaza and Sønstebø [
19]; Chegut et al. [
21]; Dell’Anna et al. [
23]; Franke and Nadler [
25]; Hårsman et al. [
26]; Roshchanka and Evans [
27]; Davis et al. [
28]; Fuerst et al. [
29]; Qian and Guo [
30]; Cerin et al. [
31]; Högberg [
32]; Sánchez et al. [
33]; Watts et al. [
34]; and Dixon et al. [
36]). For example, Barreca et al. [
13] examined the influence of EPC certificates and building features on the real estate market dynamic and pricing process in Turin (Italy). The authors conducted an analysis of data collected between 1946 and 1990. The authors used the standard hedonic price and spatial error models (SEM). The results demonstrate that EPC labels are gaining power in influencing price variations. Moreover, the results highlighted that EPCs with low energy efficiency (E, F, and G) have significantly and negatively affected housing prices, whereas EPCs with high energy efficiency (A1, A2, A3, A4, and B) have a lower but positive influence on them. In addition, some intrinsic building/dwelling features emerged as characteristics influencing the property price formation: the building category and the housing unit maintenance level.
Khaza and Sønstebø [
19] explored the effect of energy performance certificates on the rental market in Norway. The authors conducted an analysis of data collected from 2011 to 2018. These authors used as a method the hedonic price model. The authors found that the labelled dwellings have a premium compared with non-labelled dwellings and that the premium increases with a higher EPC label. McCord et al. [
17] investigated the dynamic effects of EPCs on house prices across the price spectrum and accounted for standardised, cost-effective retrofit improvements in the Belfast housing market (the United Kingdom). The authors analysed data collected from Q2, 2018 to Q1, 2019. The authors used quantile model regression as a method. The results indicated that only properties with higher EPC scores (e.g., A+, A, B, and B−) have significant positive effects at the upper end of the price distribution. There are also brown discounting effects evident for properties with lower scores within EPC properties F and G at the higher end of the price distribution. In addition, the potential energy efficiency rating (score) also shows an increase in selling prices and minimises any discounting effects.
However, some authors point out that the dwellings or buildings with green/eco-friendly certificates do not cause any impact (e.g., Olaussen et al. [
12]; McCord et al. [
18]; Cespedes-Lopez et al. [
20]; Chegut et al. [
21]; Wilhelmsson [
22]; Olaussen et al. [
24]; and Fuerst and McAllister [
35]). For example, McCord et al. [
18] investigated the relationship between EPCs and sales prices in Belfast (Northern Ireland, the United Kingdom). The authors used the data collected from Q3, 2017 to Q3, 2018. The binary logit regression was used as the method approach. The results indicated that sales price comprises no relationship with energy performance, inferring that there is no increased probability of an increase in sales price with a higher EPC rating. Cespedes-Lopez et al. [
20] analysed the effect of EPCs on housing sales prices in Alicante (Spain). The authors used data collected between June 2017 and May 2018. The authors used an analysis of variance (ANOVA) and simple OLS models. The results indicated that homeowners and sellers have no incentive to disclose energy certification in the current market, allowing them to sell low energy-rated homes at prices like those of more energy-efficient homes. In addition, it was also found that houses with better energy ratings (letters A and B) are not sold at higher prices than houses with other rating letters. Chegut et al. [
21] studied the impact of EPCs on rental housing prices in England and the Netherlands. The authors used the data from 2012 to 2015 (England) and 2010 to 2015 (the Netherlands). Empirical results indicated that EPCs had no impact on assessed values in England in 2012, whereas estimation results for 2015 show a significant discount in assessed values for D-, E-, and F-labelled dwellings relative to C-labelled dwellings. The Netherlands did not observe a relationship between EPCs and assessed values in 2010. However, in 2015, higher energy efficiency led to higher external ratings. These findings can signal the increasing importance of EPCs in markets as the public becomes more conscious of the importance of energy-efficient dwellings.
As can be seen in this literature review, there is no consensus regarding the effect of EPCs on transaction prices and rents, as some authors indicated that the high energy efficiency certificates of dwellings or buildings increase the transaction prices and rents and the EPCs with low energy efficiency reduce the transaction prices and rents. In contrast, others showed that these certificates do not impact transaction prices and rents. The following section will present the materials and methods used in this empirical investigation.
3. Data and Methods
To analyse the impact of eco-friendly dwellings on transaction prices in the Portuguese real estate market, we built a concise model that captures its main features. The explained variable is the median value per m2 of dwelling sales in euros. The variables of interest are the number of dwellings divided by categories. The control variables include (i) real municipality GDP; (ii) policies to encourage energy efficiency for the residential sector; (iii) credit agreement for the purchase, construction, and work on dwellings; (iv) the number of completed dwellings in new constructions for family housing; and (v) the number of completed reconstructions per 100 completed new constructions. This section shows the variables and the methodological approach used. Therefore, the first subsection, 3.1., will describe the data/variables, whereas the following subsection, 3.2., will describe the methodological approach.
3.1. Data
In this empirical analysis, 289 Portuguese municipalities were used from 2014 to 2019. This group of municipalities and the period were selected due to the availability of microeconomic data. The variables used in this investigation are presented in
Table 1 below.
In this study, the MVPM2 will be the dependent variable of the econometric model, whereas GD, NGD, EPC A+, EPC A, EPC B, EPC B-, EPC C, EPC D, EPC E, EPC F, GDP, FIP, HC, CD, and CR are the independent variables. Indeed, the GDP, FIP, HC, CD, and CR are also the control variables in the econometric model.
3.2. Method
The subsequent methodologic framework was followed (see
Figure 5 below) to find the effect of dwellings with “green” or “eco-friendly” certification on transaction prices in Portugal.
After presenting the methodology framework that this investigation used, it is crucial to present the preliminary tests, the model estimations, and the post-estimation test.
3.2.1. Preliminary Tests
This empirical study computed the following preliminary tests: (a) Descriptive statistics of the variables. This test verifies the characteristics of the variables used in the econometric model. (b) The Shapiro–Francia test [
42]. This test verifies the presence of normality in the variables of the panel data. The null hypothesis of this test is that the data are normally distributed. (c) The Shapiro–Wilk test [
43]. This test checks for the presence of normality in the panel data variables. The null hypothesis of this test is that the data are normally distributed. (d) The variance inflation factor (VIF) test [
44]. This test checks for multicollinearity among the panel data variables. (e) The Hausman test. This test identifies heterogeneity, that is, whether the panel has random effects (RE) or fixed effects (FE).
3.2.2. OLS with Fixed Effects
The estimation of the OLS model with fixed effects was calculated for this empirical investigation. This estimation model was chosen because it allows for the estimation of the slope and intercepts for a set of observations and other estimates of the mean response for the fixed predictors using the conditional mean function (e.g., Koengkan et al. [
5]). In this examination, the OLS follows the general equation below.
where
βi are the intercepts,
β is the value of fixed covariates being fitted to predict the dependent variable
MVPM2it,
εi is the error term, and each variable enters regression for municipality
i at year
t.
3.2.3. MM-QR
Indeed, to recognise the robustness of the results of the OLS model estimation, this research also chose to calculate the MM-QR model estimation. This model estimation was chosen because, as mentioned in Koengkan et al. [
45], it can be adapted to provide estimates in the presence of cross-sectional models with endogenous variables. Moreover, the same authors add that this method is not based on the estimation of conditional means, but on moment conditions that identify conditional means under exogeneity and the exact quantile structural function. The MM-QR model estimation follows the general equation below in this research.
where
is from a panel of
n individuals
i = 1,…, n over
T time-periods with
. Furthermore, the parameters
, capture the individual
i fixed effects, and
is a k-vector of known differentiable (with probability 1) transformations of the components of
with element
l given by
. The sequence
is
i.i.d. for any fixed
i and independent across
t.
is
i.i.d. (across
i and
t), statistically independent of
, and normalised to satisfy the moment condition
.
3.2.4. Post-Estimation Test
This empirical study calculated the following post-estimation test: the Wald test [
46]. This test checks the overall significance of the estimated models. The null hypothesis of the Wald test is that all coefficients are equal to zero.
In addition, this research computed all preliminary tests, model estimates, and post-estimation tests using Stata 17.0. The following section will present the empirical results of this study.
4. Empirical Results
The first step to realise the preliminary tests is to check the statistical characteristics of variables.
Table 2 below reveals the descriptive statistics of the variables.
As can be observed, the panel data of this investigation is highly unbalanced, where most variables of the econometric model have a panel that is highly unbalanced (e.g., MVPM2, GD, NGD, EPC A+, EPC A, EPC B-, EPC C, and HC). Indeed, the presence of highly unbalanced panel data prevents the realisation of some preliminary tests developed for the panel data (e.g., the cross-sectional dependence (CSD) test, Kao panel data cointegration test, Pedroni panel data cointegration test, and Westerlund panel data cointegration test, among others). The presence of highly unbalanced panels is normal when microeconomic data are used. In the case of this investigation, the microeconomic data from Portuguese municipalities contain several gaps during the period between 2014 and 2019.
The second step in performing the preliminary tests is to verify the manifestation of normality in the panel data variables. For this purpose, the Shapiro–Francia and Shapiro–Wilk tests were calculated.
Table 3 below highlights the results of the normal distribution tests.
As shown in
Table 3 above, the results of the Shapiro–Francia and Shapiro–Wilk tests show that all variables used in the econometric model are not normally distributed, where the null hypotheses of both tests can be rejected.
The third step in performing the preliminary tests is to check for multicollinearity in the model variables. The effect of energy certificate ratings on the value per m
2 of housing sales was assessed using nine models (from I to IX). The models differ from each other due to the specific rating under analysis. In model I, we assess the impact of green and non-green dwellings. Models II to IX assess the isolated classifications (A+, A, B, B−, C, D, E, and F) on the value per m
2 of housing sales. The VIF test was calculated to this finality.
Table 4 below shows the results from the VIF test.
As shown in
Table 4 above, the VIF results show that the presence of multicollinearity is not a concern for all models, given the low VIF and mean VIF values recorded, which are lower than the generally accepted benchmark of 10 for VIF values, and 6 for mean VIF values [
47,
48,
49,
50,
51,
52]. Subsequently, the VIF and the cross-sectional dependence test (CSD) should have been calculated. However, since the panel data of this research were highly unbalanced, this test could not be calculated. It is worth remembering that the CSD requires a balanced panel.
The last step to realise the preliminary tests is to check the presence of random effects (RE) or fixed effects (FE) in the econometric models mentioned above. For this task, the Hausman test was computed (see
Table 5 below).
The results in
Table 5 above indicate the presence of fixed effects in all econometric models. After conducting preliminary tests, the estimates of the models can be calculated.
Table 6 below shows the results of the OLS with fixed effects and MM-QR using the 50th quantile. This research chose to use only the 50th quantile in MM-QR because the results of the OLS model with fixed effects are compared with the 50th quantile in MM-QR [
5].
The results in
Table 6 above indicate that in the OLS models, the independent variable GD has a positive effect of 0.2426 on the dependent variable MVPM2, whereas the independent variable NGD has a negative impact of −0.1661. For the control variables, GDP has an impact of 0.0000, the FIP variable has a positive impact of 67.1235, the HC variable has a negative impact of −0.0004, and the CD variable has a positive impact of 0.4465. The MM-QR, used for checking robustness, showed similar results as the OLS model estimation. The robustness check indicated that the econometric model is robust to the method-switching approach. However, the statistical significance of the control variable CR is an exception, which had a negative impact of −0.2274 on the dependent variable MVPM2.
Wald’s test shows that the parameters for specific explanatory variables are zero for each OLS model (except for OLS FE D.K.). Therefore, the null hypothesis of the Wald test cannot be rejected, i.e., the variables can be used to fit the regression in the model.
Figure 6 below summarises the effect of the independent variables on the dependent variables.
However, to confirm the results in
Table 6 above, this investigation opted to use each EPC level to identify the impact of “green” or “eco-friendly” certificates of dwelling on transaction prices. In other words, the dwellings with “green” or “eco-friendly” certificates are identified by the following EPC levels of A+, A, B, and B-, whereas dwellings with no “green” or “eco-friendly” certificates are identified by the following EPC levels of C, D, E, and F.
Table 7 shows the results from the OLS with fixed effects and MM-QR using the 50th quantile.
The results in
Table 7 above indicate that in OLS models, the independent variables of EPCs A+, A, B, and B− positively impact the dependent variable MVPM2. The control variables, such as GDP, FIP, and CD, have a positive impact in models II, III, IV, and V, whereas the variable CR has a negative impact only in model II and is statistically insignificant in models III, IV, and V. Furthermore, EPC C has a positive impact on the dependent variable MVPM2 in model VI. On the other hand, the EPCs D, E, and F negatively impact the dependent variable. The control variables GDP, FIP, and CD positively impact the dependent variable in models VI, VII, VIII, and IX. The control variable HC has a positive impact in model VI and a negative impact in models VII and VIII. However, the control variable CR is statistically insignificant in models VI, VII, VII, and IX.
The MM-QR model pointed out similar results to the OLS models. The independent variables of EPCs A+, A, B, and B− positively impact the dependent variable MVPM2. The control variables, such as GDP, FIP, and CD, positively impact models II, III, IV, and V. In contrast, the variable HC has a positive impact only in model II and is statistically insignificant in models III, IV, and V. However, the control variable CR is statistically insignificant in models II, III, IV, and V. Furthermore, EPC C has a positive impact on the dependent variable MVPM2 in model VI. In contrast, EPCs D, E, and F negatively impact the dependent variable. The control variables GDP, FIP, and CD positively impact the dependent variable in models VI, VII, VIII, and IX. The control variable HC negatively impacts model VIII and is statistically insignificant in models VI, VII, and IX. However, the control variable CR is statistically insignificant in models VI, VII, VII, and IX.
Furthermore, the Wald test shows that the parameters for specific explanatory variables are zero for each OLS model (except for OLS FE D.K.) and MM-QR. Therefore, the null hypothesis of the Wald test cannot be rejected.
Figure 7 below summarises the effect of the independent variables on the dependent variables.
5. Discussion
This section will briefly present the possible explanations for the positive impact of dwellings with “green” or “environmentally friendly” certification on transaction prices in the real estate market in Portugal. In the literature, this positive impact has been found by several authors. For example, according to Mudgal et al. [
9], a house with better energy and environmental performance costs more to build or renovate. Investors can recover this investment through a high sales price or rent. Moreover, the same authors suggest that many investors improve the energy and environmental performance of houses or buildings to preserve their value going into the future (future-proofing) in the face of changing demand and regulatory requirements.
In a comprehensive analysis by Ürge-Vorsatz et al. [
53], the energy and environmental performance of dwellings/buildings is expected to affect the value of buildings because it saves money and conforms to changing social norms vis à vis the environment. In addition, it is expected to affect the monetary value of property because there are numerous other benefits associated with more energy-efficient buildings (e.g., energy-efficient facilities provide a higher level of services). Mudgal et al. [
9] state that energy performance affects the running cost of various services. Suppose the running costs of two houses that provide similar services are different. The price of living in these houses (as a homeowner or tenant) should consider this difference. Therefore, the net present value of goods that provide the same utility to consumers should be equalised. The price of two goods that provide the same services but with different levels of energy efficiency should not be the same.
Therefore, evidence of a positive relationship between dwellings or buildings with high energy efficiency certificates and transaction prices and rents in Europe has been discussed by Mudgal et al. [
9]. These authors reported that, in Austria, the effect of a one-letter improvement in energy efficiency is estimated to increase the price by 8% in the sales market and 4.4% in the rental market. In Belgium, there is a clear relationship between the energy efficiency of a property, as measured by EPCs, and its advertised price or rent. According to the authors, a significant improvement in energy efficiency is associated with a 4.3% higher price, whereas the rental effect was 3.2%. In France, each one-letter improvement in a property’s energy label is associated with a 4.3% higher price. Finally, in Ireland, there are clear indications from the property market that energy efficiency is rewarded. The effect of a one-letter improvement in energy efficiency is estimated to increase the price by 2.8% in the sales market and 1.4% in the rental market.
The negative impact of housing without “green” or “eco-friendly” certification on transaction prices in the real estate market has been found by some authors in the literature (e.g., Barreca et al. [
13]; McCord et al. [
17]; and Khaza and Sønstebø [
19]). According to Barreca et al. [
13], dwellings with low EPC ratings (D, E, F, and G) negatively affect transaction prices and rents. This negative impact may be related to the low investment in constructing or renovating a dwelling with better energy and environmental performance. Therefore, this low investment negatively impacts sales prices and rents. In addition, the low demand for buying or renting housing without “green” or “environmentally friendly” certification due to environmental and energy efficiency concerns also negatively impacts transaction prices and rents. According to McCord et al. [
17], “brown discounts” caused by the low demand for low EPC-rated housing negatively impact prices and rents.
6. Conclusions and Policy Implications
The main objective of this research is to assess the impact of ratings of energy certificates on the value per m2 of dwelling sales. Data availability has limited the variables to the period from 2014 to 2019. It is, however, important to mention that this period has specificities that may limit the generalisation of the results obtained. The period under analysis was the follow-up to the Portuguese severe financial crisis from 2010 to 2014. The financial crisis had its genesis in the global financial crisis (2007–2008) and has gained momentum with the Eurozone public debt crisis. Consequently, our study covers the financially challenging period of post-Troika intervention in Portugal.
The empirical analysis uses microeconomic data from 289 Portuguese municipalities from 2014 to 2019. To assess the impact of energy certificate ratings and control variables on the value per m2 of dwelling sales, a panel of fixed effects and the method of moments quantile regression were used. The model comprises (i) variables associated with energy performance certificates and as control variables, (ii) municipality GDP, (iii) fiscal/financial incentive policies for energy efficiency for the residential sector, (iv) credit agreement for the purchase, construction, and work on permanent or secondary dwellings or dwellings for rent and land purchase for the construction of owner-occupied dwellings, (v) the number of completed dwellings in new constructions for family housing, and (vi) the number of completed reconstructions per 100 completed new constructions.
The analysis was divided into two approaches. First, EPCs with high energy efficiency ratings (e.g., A+, A, B, and B−) used as a proxy for dwellings with “green” or “environmentally friendly” certificates were assessed. Low energy efficiency ratings (e.g., C, D, E, and F) were used as a proxy for dwellings with “non-green” or “environmentally unfriendly” certificates. Second, individual energy efficiency ratings were assessed.
The general results support the idea that performance certificates associated with green dwellings increase the value per m2 of dwelling sales, and those associated with non-green dwellings depress the sales value. It was also found that municipality GDP, fiscal/financial incentive policies for energy efficiency, and the number of completed dwellings in new constructions for family housing will increase sales value. On the other hand, credit agreements and completed reconstructions reduce sales value.
Individual energy efficiency ratings (models II to IX) show that efficiency certificates almost monotonically increase the value per m2 of dwelling sales. Beyond these main results, the municipality GDP, fiscal/financial incentive policies for energy efficiency, and the number of completed dwellings in new constructions for family housing will increase sales value. Credit agreements and completed reconstructions lost part of their explanatory power on sales value.
As the world proceeds with the energy transition, the affordability of energy implies that technology will be able to obtain huge gains in energy efficiency. Therefore, eco-friendly dwellings are a requirement for investors to preserve their value. Furthermore, since eco-friendly dwellings have beneficial environmental externalities, Portuguese policymakers should promote policies that take advantage of the market’s propensity to evaluate them positively.
In short, this empirical investigation introduced a new analysis regarding the effect of dwellings with “green” or “eco-friendly” certificates on transaction prices in Portugal. Furthermore, this investigation is innovative as it used econometric and microeconomic approaches to identify the possible effect of “green” or “eco-friendly” certificates on transaction prices. Lastly, the results and outgrowths of this study will support the policymakers and governments in developing consistent policies and initiatives that promote the construction of “green” or “eco-friendly” dwellings in Portugal or in similar economies.
Limitations and Future Research
This study suffers from the common limitations of research in new fields. Among these limitations, one can identify short periods, insufficient knowledge about control variables, and a lack of consensus on the expected variables’ relationships in the literature. Consequently, the study of the impact of EPCs on vital aspects of real estate markets, such as transaction prices and rents, has been mostly an exploratory analysis. An additional aspect of major importance is the period analysed. Indeed, strong technological innovation and energy transition costs could compromise the study results’ generalisation. One must be aware of possible instability or breaks in estimated parameters. All these shortcomings advise further research on the topic.
Future research can be directed to cross-validate the results. For example, research can focus on the longitudinal data’s temporal dimensions to better capture the effects of time over the estimated parameters or the presence of cointegration in models. Another way to cross-validate the results is to extend the research topic to other countries or groups of countries to cross-validate the results for the Portuguese economy.


