Article

The Environmental Impacts of Carbon Capture Utilization and Storage on the Electricity Sector: A Life Cycle Assessment Comparison between Italy and Poland

by
Marco Facchino
1,*,
Paulina Popielak
2,
Marcin Panowski
2,
Dariusz Wawrzyńczak
2,
Izabela Majchrzak-Kucęba
2 and
Marcello De Falco
1
1
Unit of Process Engineering, Department of Engineering, Università Campus Bio-Medico di Roma, Via Álvaro del Portillo 21, 00128 Rome, Italy
2
Faculty of Infrastructure and Environment, Czestochowa University of Technology, Dąbrowskiego 73, 42-200 Czestochowa, Poland
*
Author to whom correspondence should be addressed.
Energies 2022, 15(18), 6809; https://doi.org/10.3390/en15186809
Submission received: 10 August 2022 / Revised: 9 September 2022 / Accepted: 14 September 2022 / Published: 18 September 2022

Abstract

:
Carbon Capture Utilization and Storage (CCUS) is a set of technologies aimed at capturing carbon dioxide (CO2) emissions from point-source emitters to either store permanently or use as a feedstock to produce chemicals and fuels. In this paper, the potential benefits of CCUS integration into the energy supply sector are evaluated from a Life Cycle Assessment (LCA) perspective by comparing two different routes for the CO2 captured from a natural gas combined cycle (NGCC). Both the complete storage of the captured CO2 and its partial utilization to produce dimethyl ether are investigated. Moreover, the assessment is performed considering the region-specific features of two of the largest CO2 emitters in Europe, namely Italy and Poland. Results shows that the complete storage of the captured CO2 reduces Global Warming Potential (GWP) by ~89% in Italy and ~97%, in Poland. On the other hand, the partial utilization of CO2 to produce dimethyl ether leads to a decrease of ~58% in Italy and ~68% in Poland with respect to a comparable reference entailing conventional dimethyl ether production. A series of environmental trade-offs was determined, with all the investigated categories apart from GWP showing an increase, mainly connected with the higher energy requirements of CCUS processes. These outcomes highlight the need for a holistic-oriented approach in the design of novel implemented configurations to avoid burden shifts throughout the value chain.

1. Introduction

Climate neutrality is one of the main objectives of the European Union’s (EU) environmental policies. The goals set out within the European Green Deal [1] and the implemented legislative framework amended by the European Commission [2] make the EU a frontrunner in climate mitigation. Climate action is foreseen within the purposes of European environmental policies, strongly based on the principles of precaution, prevention and rectifying pollution at source. Mitigation strategies are indeed intended to prevent or reduce the emissions of greenhouse gases (GHGs) to ease the impacts of climate change.
The strong commitment of the EU dates back to 2015, when 195 countries signed the Paris Agreement, agreeing “to keep the increase in global mean surface temperature to well below 2 °C, and to limit the increase to 1.5 °C” in order to lessen the negative outcomes of climate change [3]. Signing the agreement, the EU set a binding target to cut emissions in the EU territory by 2030 to levels at least 40% below those in 1990 [4]. Nonetheless, according to a report published by the European Environment Agency in 2021, the strategies implemented by the EU lead to a decrease in GHGs as high as 31% with respect to 1990 levels [5], thus supporting the new targets adopted in 2021 under the European Climate Law increasing the reduction target to 55% [2].
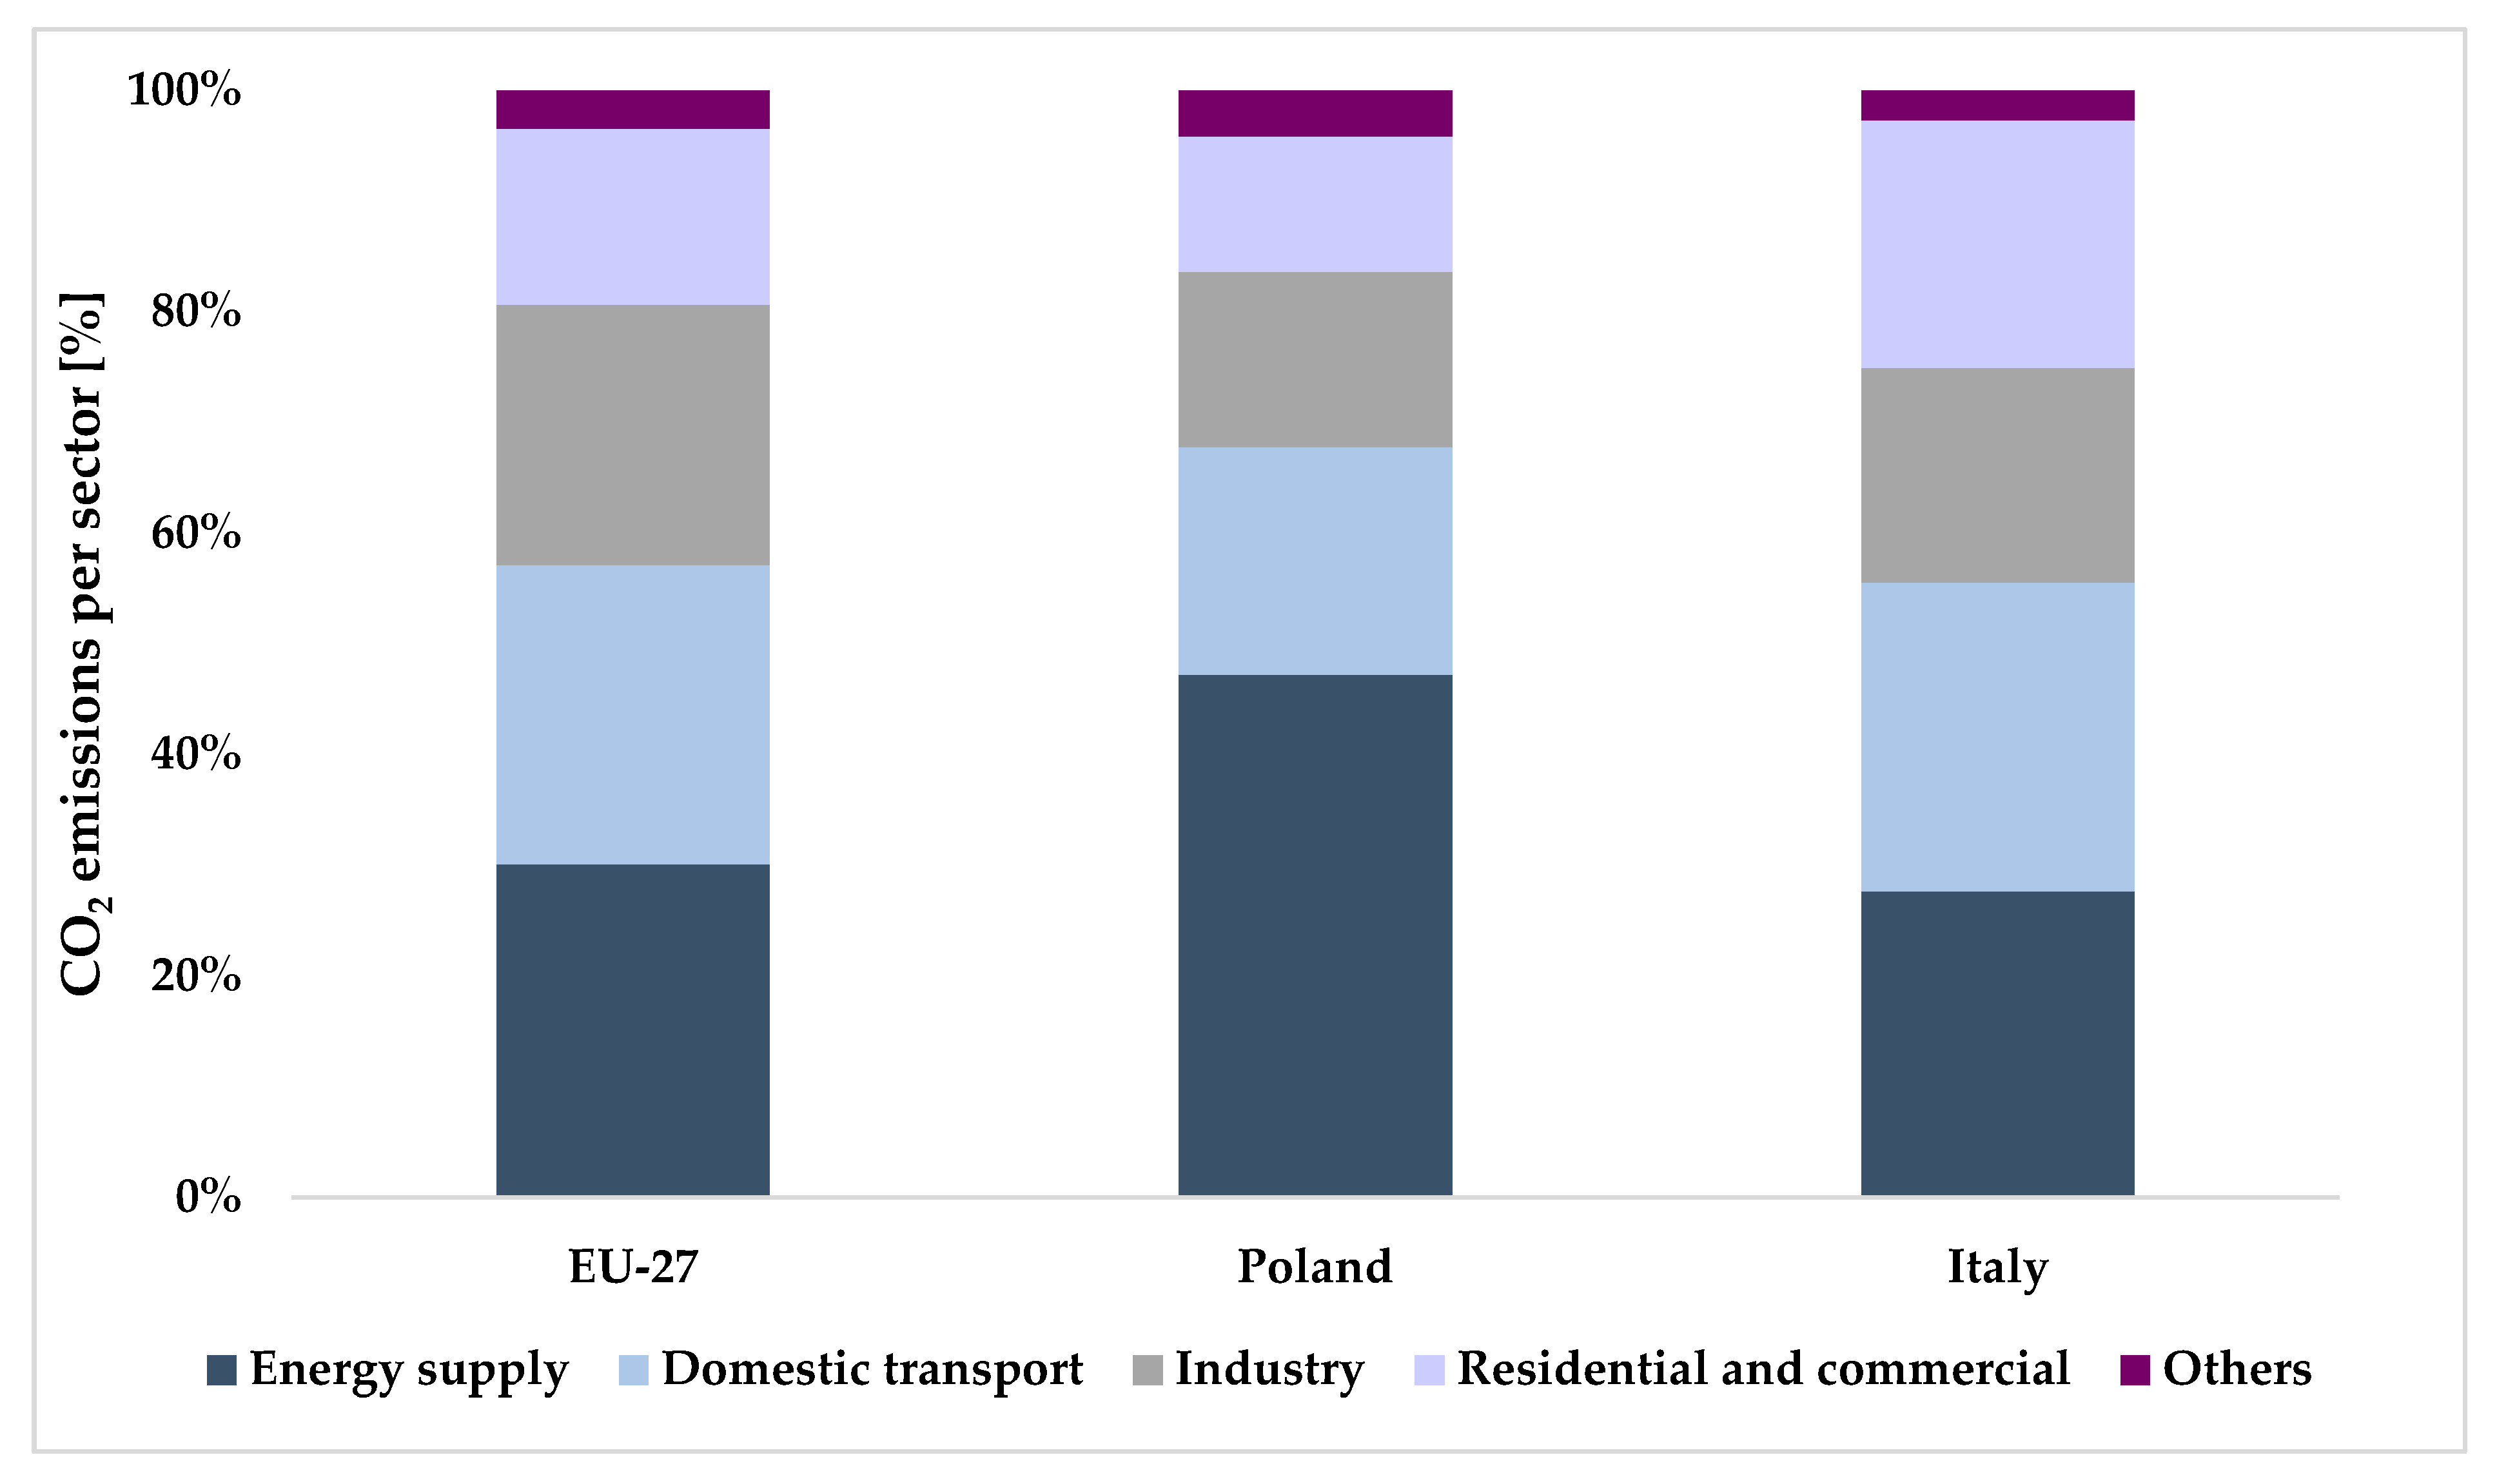
However, in 2020, CO2 emissions in the 27 Member States of the EU exceeded 2.6 Gt (also considering the other GHGs, the value rose to around 3.3 Gt of CO2), with the energy supply sector being the main source (~31%), followed by the transport sector (~28%), manufacturing industries (~24%), and residential and commercial activities (~16%) [6]. It is therefore evident that the energy sector is the largest contributor to GHG emissions, and that the achievement of the aforementioned goals requires the combined action of a series of climate mitigation strategies.
Among them, the European Commission called for the improvement of energy efficiency, a deeper electrification of fossil fuel–supplied sectors, and a growing share of renewable energy production (in 2020, the share of energy consumed from renewable sources reached 22.1%, whereas the 2030 target was set at 40%) [5]. According to Gelien et al. [7], energy efficiency and renewable energy technologies are the core elements of energy transition, having the potential to meet ~70% of the global energy demand. Nonetheless, without favorable policies at national and international levels, there is no possibility to fully exploit that potential. Though recognizing the high level of maturity and economic competitiveness of solar photovoltaic power generation, Jäger-Waldau et al. [8] underlined that to reach a 55% emission reduction, the solar photovoltaic installed capacity should be brought to 455–605 GW, thus making mandatory a drastic growth of the photovoltaic market volume in the EU due to the increase of the average annual growth rate. Nonetheless, the intrinsic intermittency of these sources requires proper integration with other energy systems. For instance, Rashidi et al. [9] proposed to utilize wind energy to supply power to desalination systems. This resulted in improvements of the overall reliability of the systems, lower GHG emissions, and a proper balance of power fluctuations.
In addition to wind and solar photovoltaics, natural gas can be considered as a bridge towards a cleaner energy system. Natural gas indeed represents a cleaner energy source option compared to other fossil fuels (such as coal, bitumen, and diesel) [10], with the potential to take advantage of the well-developed dedicated infrastructure and having strong economic competitiveness. Within the EU, the inland demand for natural gas in 2020 exceeded 360 Mtoe [11], representing 21.5% of the EU’s primary energy consumption, with the residential sector accounting for most EU gas demand (40%), followed by industry and gas use for power generation [12]. Worldwide, natural gas–fired power plants supplied ~6300 TWh, accounting for about 24% of total global power generation, in 2020 [13]; this technology is seemingly the only one among fossil resources that is capable of providing flexibility for the power system in the coming years [14], enabling the integration of intermittent renewable energy sources [10].
In order to continue using natural gas, the implementation of technologies to avoid CO2 emissions into the atmosphere is essential. Within this context, Carbon Capture Utilization and Storage (CCUS) can be seen as a viable tool to enable industrial decarbonization while curbing CO2 emissions. CCUS refers to a set of technologies aiming at capturing CO2 emitted from a wide variety of sources (i.e., power plants, cements plants, etc.) in order to store in different forms. The captured CO2 can be either stored underground or employed as a feedstock to other industrial processes for the production of fuels, chemicals, or building materials.
As for the storage pathway, Carbon Capture and Storage (CCS) involves different operations, mainly consisting of three major processes: CO2 capture, transportation, and injection underground [15,16]. The technical aspects of carbon sequestration depend on the specific industrial application; it can be performed by adopting different physico-chemical processes, with the main distinction being among pre-combustion, post-combustion, and oxy-fuel combustion [17]. On the other hand, both transportation and storage phases are deeply site-dependent, thus requiring an extended investigation of the local and geological characteristics [18]. The main hinderance to widespread CCS, in addition to the high costs, is the low social acceptance [19]. Concerns of CO2 being leaked from the storage sites are mainly related to both climate change issues and ecosystem damage at a local level. Therefore, in order for CCS to be considered as a safe technology, the storage site must be properly selected according to strict safety, geological, and technical standards [18].
On the other hand, Carbon Capture and Utilization (CCU) uses the same process schemes of CCS for CO2 capturing, with the main difference lying in CO2 being used as a raw material for the production of synthetic fuels or chemical compounds. CO2 is commonly perceived as an industrial waste, but its hydrogenation leads to the generation of several valuable products (such as methane, methanol, dimethyl ether, formic acid, etc.) [20]. The required hydrogen could be produced by water electrolysis fueled by renewable energies, therefore creating a network connecting the renewable energy supply system and the industrial value chain according to a concept known as Power-to-Gas (PtG). PtG is described as a chemical energy storage technology aiming at transforming electric energy through water electrolysis into combustible gases with high energy density [21]. Among CCU technologies, however, great attention has been paid to CO2 conversion into fuels, with both methanol [22] and dimethyl ether [23] produced within this context being credited as potential alternative fuels in the future energy scenarios.
Nonetheless, the spread of these technologies is still limited. According to the latest estimates [24], the current capacity of CCUS facilities allow the capturing of ~40 MtCO2 each year. At first, these plants were constructed to supply CO2 to local oil producers for enhanced oil recovery operation (this is still one of the main utilization pathways for CO2, covering more than 30% of the overall demand), being connected to natural gas processing facilities. However, in the 1980s, CCUS facilities barely managed to handle 0.5 Mt of CO2; a major expansion has taken place during the last decade, with the majority of plants still operating in the natural gas processing sector (~28.5 Mt of CO2) and some related to the power generation sector (~2.4 Mt of CO2). Though the largest deployment of CCUS has been seen in China, European countries are also committed to the implementation of these kinds of technologies. The North Sea is currently the center of CCUS deployment in Europe, with the first projects being implemented in 1996. Indeed, to date, the main large-scale CCUS projects operating in Europe (namely, Sleipner and Snøhvit), with a combined storage capacity of 1.7 Mt of CO2 per year, are both located in Norway and both capture CO2 from natural gas processing and reinject it into dedicated storage sites. Nonetheless, other small pilot and demonstration projects are currently operating in Europe, with a capacity of nearly 30 Mt of CO2 per year, which is projected to rise to around 35 Mt in 2030. CCUS technologies should thus be coupled with existing facilities belonging to the three main CO2 emission contributors (namely, power generation, transport, and manufacturing), considering that most of Europe’s energy sector emissions come from sources located in relatively close proximity to potential storage sites (for instance, ~68% of all the emissions from power plants and factories in Europe are located within 100 km of a potential storage site) [16].
A deeper understanding of the environmental outcomes related to the implementation of this kind of system could be obtained by means of Life Cycle Assessment (LCA). Holistic LCA, dealing with performance improvement of industrial processes, is recognized as a valid tool for governments in aiding decision-making processes [25]. This tool is crucial, since implementing CO2 emission–mitigating technologies and shifting the energy supply towards more sustainable technologies could lead to significant environmental trade-offs, thus leading to further negative outcomes.
LCA methodology has been widely adopted to evaluate and compare the environmental profile of systems and products [26]. During the last decades, many assessments were performed to investigate the outcomes deriving from changing the energy scenarios at national or regional levels [27,28,29,30]. Through a wider perspective, Carvalho et al. [30] carried out an environmental assessment to gain insights into the environmental profile of the electricity system of seven European countries in 2030. The authors found out that the implementation of the policies promoted by the European Commission would eventually lead to an average reduction of 42% in the impacts of climate change, with the best result coming from the reduction of acidification (impact category closely linked to the first). In addition, assessments have been performed to evaluate the feasibility of implementing both CCUS units [14,31,32]. Singh et al. [31] proposed a hybrid life cycle assessment to evaluate the consequence of coupling a natural gas combined cycle (NGCC) power plant with CCS, showing that a CO2 capture efficiency of 90% could result in the avoidance of 70% of CO2 emissions per kWh, reducing global warming potential (GWP) by 64%. The authors also identified some relevant trade-offs related to acidification, eutrophication, and toxicity, whose increase is due to the use and degradation of monoethanolamine (MEA) and on some process wastes. Similarly, Barbera et al. [14] investigated the effects of the introduction of the most promising CCS configurations in series to a gas-fired combined cycle power plant, employing either MEA or potassium carbonate as solvents. The authors also considered electricity generation from a photovoltaic plant and a wind turbine to identify the technology with the higher environmental performance, assuming Germany as a reference site. The environmental impacts of renewable energy sources were found to be very low when compared with those of fossil fuel–based technologies, but a burden shifting among environmental compartments was also found, with detrimental effects towards human health and freshwater. A more holistic perspective was instead proposed by Volkart et al. [32], who performed an assessment to evaluate the environmental consequences of integrating a carbon capture and storage (CCS) unit in both power generation and the cement industry, assuming Europe as a reference geographical region. The authors assessed the impacts on power generation assuming 2050 as a reference year, considering the time required for large-scale implementation of the CCS technology and the future potential technology development. They found a significant reduction of the life cycle GHG emissions from power generation thanks to CCS unit implementation for all the investigated power generation technologies, while the benefits of integrating CCS in cement plants was found to be highly dependent on the source of heat and power for the capturing process. Studies related to CCU technologies, on the contrary, have been mostly focused on the potential environmental benefits of the process itself rather than their integration into the energy sector [33,34]. However, the evaluation of the environmental impacts of these technologies are also intimately related to territorial features and to production–consumption patterns [35]; this relationship should be taken into account in order to understand which technology best suits the needs of a specific territory.
With this aim, a systematic analysis focused on the effect of storing or utilizing the CO2 emitted from a power plant could be useful in order to address national environmental policies. Therefore, the present study aims at evaluating the potential environmental benefits of a NCGC power plant coupled with either a CCS or CCUS unit in two different European countries. The analyzed plant configurations are the same as those reported in a parallel work by De Falco et al. [36], within which an energetic and exergetic comparison between CCS and CCUS was made. Two possible routes for the CO2 captured from a NGCC power plants are considered: (1) feeding 25% of the captured CO2 to a methanol and dimethyl ether production plant while storing the remaining 75% underground under supercritical conditions, and (2) storing 100% of the captured CO2 underground. An LCA-based comparison, relying on an extensive evaluation of the country’s environmental profile, was thus performed to identify whether CCUS technologies could actually play a beneficial role within the climate-mitigating efforts of those countries, and which processes could potentially hinder their deployment.
The paper is organized as follows: Section 2 describes the current environmental profile of the selected countries, with a brief insight into the potential for CCUS spread; Section 3 outlines the methodology adopted to run the assessment, with an in-depth description of the process units; Section 4 shows the results from the two analyzed routes in Italy and Poland, identifying the major drawbacks coming from their development; lastly, some final considerations are reported in Section 5.

2. Potential for CCUS Implementation in Italy and Poland

According to the European Environment Agency [6], in 2020, Germany, Poland, and Italy were the three major contributors to CO2 total emissions, with released amounts accounting for 639.381 Mt, 303.523 Mt, and 302.279 Mt of CO2 emitted throughout the reference year, respectively. It is worth noting that the overall emissions of Poland and Italy considered together were lower than the total emissions of Europe’s largest contributor. Nevertheless, considering the per capita emissions of CO2, only Italy is below the European mean average (5.885 kt of CO2 per capita), with an emission footprint of 5.086 kt of CO2 per capita. On the other hand, though having a smaller footprint than Poland (8.009 kt of CO2 per capita), Germany (7.688 kt of CO2 per capita) exceeds the European mean average of total emissions per capita.
As shown in Figure 1, the shares of CO2 emissions per sector in Italy are similar to the ones previously detailed for the EU, with the major contribution given by transport (~28%), energy supply (~28%), and residential and commercial activities (~22%). On the contrary, regarding Poland, the contribution of individual sectors to total emissions differs significantly, with energy supply accounting for near half of the total CO2 emissions (~47%), followed by the transport sector (~21%), and industrial activities (~16%).
Due to their role as large CO2 emitters within the EU, Italy and Poland were selected for the present investigation. The choice of this pair of countries is also related to the significant difference among the specific energy supply sectors. Indeed, as will be further detailed in the following paragraphs, the internal energy demand of Italy and Poland is satisfied by a different set of energy supply sources, with Poland still majorly relying on fossil fuels. Therefore, this section deals with a brief description of the current environmental and energy scenarios of the countries covered by the present analysis, with a focus on the potential for the implementation of CCUS systems. For the data to be comparable, we refer to European institutions or to the International Energy Agency (IEA) as main sources.

2.1. Italian Case

Energy and climate are at the top of the Italian political agenda. Within the Integrated National Plan for Energy and Climate (PNIEC), ambitious targets were set for renewables by 2030, aiming at reaching 30% in total energy consumption and 22% in transport sector consumption [37]. In 2020, Italy reached the target set by the EU for the share of energy from renewable sources, with 20.4% of energy supplied by renewables [38]. Nonetheless, the main energy supply source for Italy in 2020 was still natural gas, accounting for ~43% of the total energy supply (TES), being also the second-most natural gas–demanding country in Europe after Germany [11].
With reference to CCUS technologies, some investigations on their feasibility in the country have already been made [18,39]. Desideri et al. [18] presented their solution for a CO2 capture and storage network in Italy, performing a case study located in Northern Italy, acknowledged as the Italian industrial district. The authors underlined the complex geological characteristics of the country, suggesting depleted or in-use hydrocarbon reservoirs as the most convenient storage site, provided that the safety standards were satisfied. The authors found that it would have been possible to store up to 8 Mt of CO2 by implementing a 122 km long pipeline for storage and trading of CO2. On the other hand, Bellocchi et al. [39] evaluated the impacts of PtG and Power-to-Liquid (PtL) systems on future CO2-reduced scenarios, featured by a high renewable energy penetration. The authors found that PtG and PtL could allow the exploitation of renewable energy surplus in other sectors apart from electricity generation, with the production of synthetic natural gas ultimately leading to CO2 emission reduction in the heavy transport sector.

2.2. Polish Case

Poland’s economy is largely based on non-renewable energy sources, with its energy supply dominated by fossil fuels (85% of TES in 2020), and the largest share coming from coal (40%), followed by oil (28%) and natural gas (17%). Poland had the highest shares of coal in energy production, and the second-highest share in heat production among all IEA member countries, though this massive dependence has declined in the last decade [40]. As for renewables, Poland failed the 2020 target set by the EU, reaching a share of ~16% [38], although the country was recognized as one of the fastest growing photovoltaic markets in the EU [40].
As a result of the introduction of the European Green Deal, the Polish government amended Poland’s Energy Policy 2040 [41]. The document led the way to decarbonization based on three main pillars—i.e., (1) a fair transition, (2) a zero-carbon energy system, and (3) good air quality—and eight Strategic Objectives describing the actions to be taken while aiming to spread cleaner technology. One of the objectives was also to reduce the share of coal and lignite in electricity generation to less than 60% by 2030, also by means of natural gas, which has been targeted as a viable transition fuel to severely abate the national dependence on coal. As for CCUS, Poland does not have a clear strategy, and these technologies do not have a role within Poland’s Energy Policy 2040. Nonetheless, the Polish Geological Institute documented 87 oil fields in Poland, estimating a storage potential in Poland for brine levels ranging from 12,009 Mt to 14,495 Mt for a total of 45 structures [42,43]. However, regardless of the large-scale research on the possibility of storing carbon dioxide, social factors need to be considered in the case of CCS implementation. According to Kaiser et al. [44], a large part of the Polish public has a positive outlook on CCS technology, although there are expectations from the public, such as clear benefits of CCS installations for the region or the country, among others.

3. Methodology

3.1. Life Cycle Assessment

Life Cycle Assessment (LCA) is a methodology dealing with the holistic evaluation of environmental impacts of a product or service throughout its entire life cycle. To date, LCA is regarded as a valuable supporting tool both for process design and policymakers. Despite having been adopted since the 1970s [26], the International Standardization Organization (ISO) standardized LCA methodology only a few decades ago, through ISO 14040 [45] and ISO 14044 [46], which are still regularly updated. According to the developed framework, the procedure for the calculation and preparation of LCA modelling is carried out in four interdependent and iterative steps:
  • Goal and Scope Definition, related to defining the intended application of the analysis alongside the basic issues determining the following evaluation (that is, functional unit, system boundaries, and level of details);
  • Life Cycle Inventory Analysis, consisting of gathering data on the inputs and outputs featured in each analyzed process, deriving from the interaction among each stage of the product’s life cycle with the environment;
  • Life Cycle Impact Assessment, dealing with the actual computation of the environmental pressure consequent to both resource consumption and emissions into the different environmental compartments;
  • Life Cycle Interpretation, during which conclusions are drawn, identifying the most significant issues to provide feasible recommendations.
Due to its holistic approach, LCA provides the possibility of consistently evaluating CCUS technologies and avoiding problem shifting between both environmental impact categories and life cycle stages. Furthermore, the main issue in conducting LCA studies on CCUS technology lies in the double role of CO2 as both emission (from a point-source emitter) and feedstock (to produce chemicals and fuels) [47]. Dealing with a product system producing multiple outputs is known as multifunctionality, which is a common problem for other processes [25]. Several methodological approaches can be used to address multifunctionality, depending on the goal of the study and the available information. However, ISO [46] defined a hierarchy among the possible options, with system expansion being the most recommended [47,48]. Through this approach, the system can either maintain each function by creating a joint functional unit to include other functions of the product systems or subtract the burdens related to the co-products that are not part of the functional unit [49]. Substitution and expansion are mathematically equivalent in comparative LCA, though the former can lead to negative environmental impacts that could be misinterpreted [47,48].

3.2. Goal and Scope Definition

The main objective of the present LCA investigation was to evaluate the environmental consequences of coupling a CCS and/or a CCU unit with a gas-fired combined cycle power plant. The assessment was performed considering the current features of the energy supply sector of two different countries to run a comparison and obtain country-specific results able to guide future decision-making processes. For this analysis, the carbon capture unit was modelled according to a post-combustion capture process involving methyl diethanolamine (MDEA) as a solvent. As for the CO2 enriched stream flowing for the carbon capture unit, according to the different routes proposed and following the existing guidelines [47,48], two scenarios were modelled:
  • CCS scenario: Assessing the environmental performance of CCS at a NGCC power plant located either in Poland or in Italy, compared to a reference system without CCS.
  • CCUS scenario: Assessing the environmental performance of a CCUS system implemented at a NGCC power plant located either in Poland or in Italy, compared to a reference system without CCUS. As mentioned, within this investigation, CCU was intended to produce dimethyl ether using the captured CO2 as feedstock for its production. Therefore, with dimethyl ether being a product of the CCUS scenario, the reference scenario must also provide the same production function. Consequently, the system was expanded to include not only conventional production of dimethyl ether but also the amount of renewable electricity used to produce it through the Power-to-Liquid (PtL) concept. Eventually, to obtain a fair comparison between CCS and CCU, the CCS scenario was expanded to include the additional functions.
Accordingly, the functional unit was defined in conformity to the specific goal of each scenario:
  • CCS scenario: “1 kWh of high-voltage electricity generated through a natural gas combined cycle power plant” with or without carbon capture and storage.
  • CCUS scenario: “1 kWh of high-voltage electricity generated through a natural gas combined cycle power plant” with or without carbon capture and storage; “production of 0.55 kg of dimethyl ether”; renewable electricity used to satisfy the internal demand or for substitution.
Performing calculations, the boundaries of the systems were restricted, focusing only on plant operation, due to the lack of reliable data related to plant construction and operating activities such as the transport and storage of CO2. The present study can be therefore be regarded as a gate-to-gate analysis, focused on the issues of combustion of natural gas, capture, utilization, and storage of CO2, in addition to its twofold nature in CCUS processes. Following the guidelines of Müller et al. [47] and von der Assen [48], allocation was avoided by dividing the process into sub-processes and extending the boundaries with additional auxiliary sub-processes.
As shown in Figure 2, the largest system boundary of the CCU scenario is defined by a total of five processes and sub-processes that were implemented for each country, as follows: (1) a state-of-the-art NGCC power plant; (2) a NGCC power plant integrated with a CCS unit; (3) a green hydrogen production plant; (4) a green dimethyl ether production facility; and (5) a NGCC power plant coupled with both a CCS and a CCU unit.
The assessment was performed using openLCA™ 1.10.3 (©GreenDelta, Berlin, Germany), and the background data were mainly retrieved within ecoinvent v3.8 (ecoinvent, Zurich, Switzerland) [50].

3.3. Life Cycle Inventory

The inventory was compiled according to the outcomes of a process simulation carried out by means of Aspen Plus™ (AspenTech®, Bedford, MA, USA). The following paragraphs will detail the main inputs and outputs of the processes featuring the investigated product system.
Data about the energy supply chain and the natural gas market are provided as background processes. Nonetheless, due to their significant contribution to the cumulative LCA results [32], country-specific markets for both electricity and natural gas are adjusted according to the 2020 scenario.

3.3.1. Natural Gas Combined Cycle Power Plant

A 188.5 MW NGCC power plant was modelled as the reference process of the present investigation. The functioning principle of a NGCC power plant basically consists of the use of the high-temperature exhaust gases deriving from the combustion of natural gas to generate steam that is then exploited to drive a steam turbine generator [14]. By coupling these generation cycles, several advantages in terms of efficiency, operating flexibility, and emission reduction can be achieved. Table 1 includes the inventory related to the electricity production process. The coproduced heat is actually the amount needed from the reboiler of the carbon capture unit, but it was chosen to consider it as a co-product within the reference case scenario, expanding the base case system through substitution. This assumption is coherent with the heat recovery process implemented when the carbon capture unit is added, though different from the approach of Barbera et al. [14], which converted heat into power by means of an efficiency factor.
Natural gas composition for each investigated case and for each natural gas demanding application is based on that reported by the National Energy Technology Laboratory (NETL) [51], and its characteristics are listed in Table 2.
However, the natural gas market was adjusted for each country according to the market data for 2020. Due to the crucial role of natural gas as an energy supply source in Italy, the country developed a branched infrastructure to allow multiple access points for the imports and a wide distribution across the country [52]. On the other hand, the historical dependence of Poland from coal hindered the spread of natural gas as an energy supply source in the country [40]. Despite the small role in the energy system, the natural gas network is well-developed and extremely interconnected, apart from also representing a bridge between the Russian Federation and Western Europe through the Yamal–Europe gas pipeline [53].
In 2020, both Italy and Poland were net importers of natural gas, with the highest share of import coming from the Russian Federation. The gas balance for both countries is reported in Table 3, according to data provided by Eurostat [11]. Furthermore, information about the natural gas import market for Italy [54] and Poland [53] is given in Table 4, outlining the market share by origin country and considering the major exporters. These data were used to adjust the background process related to the market for the natural gas feeding the plant, considering only the import processes available in the adopted dataset. For this reason, only imports from the Russian Federation, Algeria, Norway, and the Netherlands were considered for Italy, while the Polish market comprised imports from the Russian Federation, Germany, and the Netherlands.

3.3.2. Carbon Capture and Storage Units

As mentioned, the technology selected for CO2 capture was post-combustion. Post- combustion capture is regarded as one of the most mature and feasible processes to separate CO2 from flue gas streams, with the capturing being typically performed through absorption into a suitable solvent (commonly MEA in power plants). The process simulation for the present investigation adopted a 40 wt% MDEA aqueous solution to achieve a 90% removal of CO2 from the gaseous stream. The inventory of the unit is outlined in Table 5.
As for the storage unit, the process included the purification and pressurization of the captured CO2 stream from the top of the carbon capture unit stripper, as well as the amount of cooling water needed to refrigerate and liquefy the stream. Table 6 shows the inventory of the storage process.

3.3.3. Hydrogen Production Unit

To produce chemicals and fuels using the captured CO2 as feedstock, another reactant is needed. Most of CCU processes mainly consist of the hydrogenation of the CO2, thus involving a certain amount of hydrogen for the process. To date, hydrogen can be produced through several industrial processes, though most of it is still produced from steam methane reformation [55,56,57].
However, even though economically convenient, these processes feature the highest environmental burden among the available technologies [55]. Therefore, hydrogen should be produced by water electrolysis, a more environmentally friendly strategy, enabling the production of a high-purity hydrogen stream without releasing harmful GHGs to the atmosphere [57]. Currently, there exists different water electrolysis technologies featuring different levels of maturity and operating conditions [58]. Among them, for the purpose of the present study, an alkaline electrolyzer was chosen for the production of the required hydrogen stream. Alkaline electrolysis is actually the oldest and most widespread technology, being characterized by an extremely simple functioning mechanism [57,59].
As mentioned, a sub-process was modelled for hydrogen production, assuming as a functional unit “1 kg of hydrogen” according to a gate-to-gate approach. Table 7 outlines the inventory related to the operating phase of an alkaline electrolyzer, as reported by Koj et al. [59], whose data refer to a 6 MW electrolyzer producing hydrogen at ~30 bar and 40 °C.
It is commonly recognized that the operating phase for water electrolysis is the one associated with the highest environmental impacts [60]. Therefore, with the energy supply source as the major contributor for most of the impact categories investigated through LCA studies, the required electricity was assumed as deriving only from intermittent renewable sources—i.e., solar and wind plants. A costumed market entailing these sources was therefore implemented according to each country electricity mix and is further detailed in the following section.

3.3.4. Dimethyl Ether Production Unit

In the implemented CCU scenario, a part of the captured CO2 is sent to a dimethyl ether production unit. While there exist different pathways and reactor configurations, the process considered within the present study is a one-step synthesis process [61], where the reactor is equipped with a bifunctional catalyst [62,63]. Table 8 specifies the main inputs and outputs of the process as obtained from process simulations, with the amount of required power and cooling water given by the contribution of the various equipment constituting the entire CO2 conversion unit.
Differently from the compression and storage unit, the dimethyl ether production plant was intended to be fed by grid electricity. This assumption allows us to consider the production facility as a separate production facility, improving the comparability with the currently adopted processes. The latter actually involve a different production scheme, consisting of an indirect production process. Conventional production plants are equipped with reforming unit producing syngas to be converted into methanol, which is in turn dehydrated to produce dimethyl ether [33]. Therefore, the process implemented within the reference case scenario to expand the system was taken from the inventory of Ecoinvent. The selected process was related to the production of 1 kg of dimethyl ether from methanol with a process yield of 95%. Nonetheless, since the already present process unit was for the average European market, both the electricity and heat requirement were changed to account for the country-specific case.

3.3.5. Electricity

Data related to each country’s electricity mix are taken from Eurostat [64] in order to be comparable. Eurostat structures the electricity production mix, splitting it according to the energy source and classifying it in classes and sub-classes. Despite the high level of detail offered by these datasets, the adopted ecoinvent 3.8 database (ecoinvent, Zurich, Switzerland) is not based on the same set of assumptions as Eurostat. For this reason, the electricity production mix was redesigned to be in compliance with the employed database, assuming as valid the assumptions related to plant technologies (type of installation, technology, and size) while adapting the shares to the 2020 electricity mix reported in Table 9. Moreover, in order to redesign the market for electricity consumption at the different voltage levels, electricity import shares were adjusted according to 2020 data. As for Italy, data from Terna [65] were used, and the imports from Switzerland (49.68%), France (36.80%), Slovenia (10.15%), and Austria (3.37%) were included in the implemented process in Ecoinvent. On the other hand, data for Poland were retrieved from IEA [40], considering Germany (53.53%), Sweden (23.52%), Lithuania (12.26%), and Ukraine (10.70%) as the main exporters.
Eventually, the above-mentioned market for intermittent renewable electricity was designed considering only wind and solar photovoltaic production to obtain the shares of the two sources within the fictional market. This process resulted in an Italian market in which the shares were quite similar (42.93% solar photovoltaic and 47.07% wind), while for Poland there was a predominance of electricity produced from wind farms (11.03% solar photovoltaic and 88.97% wind).

3.4. Impact Assessment Methods

The evaluation of the environmental impacts of technologies was performed by means of a selected impact assessment method. Although the main aim of CCUS technologies is the reduction of GHG emissions [66,67], their introduction into the energy sector might lead to adverse effects on other environmental compartments and impact categories. According to Müller et al. [47], it is important to include other impact categories apart from Global Warming Potential (GWP) to avoid misinformed decision making, especially if these categories are considered relevant and assessable. Since numerous impact categories and assessment methods are available in the market, the choice of the impact categories to be treated as relevant was made according to both the existing literature [66,67] and guidelines [34,47]. As for the latter, the European Joint Research Centre (JRC) drew up an Impact Assessment guideline [68], providing a set of recommendations about the impact categories and related methods to be used, while Rosental et al. [34] provided the six most relevant categories representing commonly affected environmental impacts, where conflicts of interest could occur in terms of environmental protection goals. These categories are reported in Table 10, together with a brief description and the recommendation level set by the JRC (level I stands for “recommended and satisfactory”, while level II indicates categories that are “recommended but in need of some improvements”).
Of the above-mentioned categories, particulate matter formation was excluded from the present assessment, while due to the adoption of CML (Institute of Environmental Sciences, University of Leiden) as an impact assessment method, as suggested by Müller et al. [47], abiotic depletion (AD) (fossil fuels) was considered in place of cumulated energy demand. The two categories are indeed similar since AD (fossil fuels) is an index of the fossil energy exploited to satisfy the energy demand of the value chain under investigation [66].

4. Results and Discussion

In the case of CCS and CCUS, the modified environmental profile was compared to the reference case of each scenario. In this section, the environmental consequences of implementing CCS and CCUS technologies will be therefore discussed for both Italy and Poland, with each process and sub-process modelled considering the country’s market for natural gas and the national market for electricity supply. Results are reported normalized to the highest computed value.

4.1. Carbon Capture and Storage

The addition of a CCS unit to the NGCC power plant mainly aims at reducing the emitted CO2 during plant operation. Results from the impact assessment, as shown in Figure 3 and Figure 4, confirm a drastic reduction of CO2-equivalent emissions both in Italy and Poland.
While current emissions are estimated to be 0.715 kg CO2-eq kWh−1 and 0.695 kg CO2-eq kWh−1 in Italy and Poland, in the CCS scenario the GWP is reduced to 0.076 kg CO2-eq kWh−1 and 0.021 kg CO2-eq kWh−1, respectively. Results for the reference case also reflect the choice of considering the heat coproduced from the plant (which is actually used in the carbon capture unit) as an avoided product for the sake of comparability between the case studies. Without this assumption, the gap would have been even higher. Moreover, it must be noted that the large decrease in GWP (~89% and ~97%, for Italy and Poland, respectively), is also attributable to the gate-to-gate approach. Indeed, if considering also the emissions associated with the carbon capture infrastructure development and the CO2 network (requiring further energy for the compressors and covering large distances), the total reduction of CO2 emissions would be limited.
However, since data on GHG emissions mainly refer to the operating phase, assuming as valid the obtained emission rates and considering the energetic scenario of the two countries, the implementation of CCS would lead to an overall CO2 emission reduction of 9.64% and 1.16% in Italy and Poland, respectively. As previously outlined, the main difference in the percentual decrease can be attributed to the different amount of electricity generated from NGCC power plants in the two countries.
On the other hand, in addition to CO2 emissions, various other impact categories were analyzed, resulting in significant environmental trade-offs that must be properly treated, as also identified by similar earlier studies [14,31]. The significant increase of the other impact categories is mostly driven by natural gas utilization, in terms of extraction, processing, and transportation, especially as regards the increase in AP (+94% and +84% for Italy and Poland, respectively), EP (+93% and +101% for Italy and Poland, respectively), and ODP (+76% and +79% for Italy and Poland, respectively), with the difference between Italy and Poland mainly due to the amount of Russian natural gas imported. Moreover, neglecting the sulfur content within the natural gas feed and the amount of release of nitrogen oxides from the plant, the three impact categories are underestimated in the reference case, while the gap between the compared cases could have been also reduced from considering the beneficial effect of ammine scrubbing for nitrogen oxide and sulfur component removal.
The higher AD of fossil fuels (+72% for both Italy and Poland) can be attributed to the large energy consumption of both carbon capture and underground storage. Indeed, the energy required for the compression of the flow rate of flue gas resulting from the process simulation exceeds 60% of the net power produced from the plant, with severe consequences in terms of efficiency. This outcome is mainly due to the process not being optimized in terms of air excess and operating pressure of the absorber.
Even though impact categories related to toxicity have not been regarded as fitting the purpose of the present study, previous investigations have underlined the possible increase in toxicity-related issues due to the production and use of ammine-based solvents during the absorption process, most of which are toxic compounds whose emission during the process (to atmosphere, water, and soil) is unavoidable [32,66]. Therefore, further attention in process design must be paid both to efficiency losses and solvent selection if post-combustion processes are chosen for cleaning the flue gas stream.

4.2. Carbon Capture Utilization and Storage

Differently from the CCS scenario, CCUS processes represent multifunctional systems, and the reference case is provided with the equal amounts of renewable energy to substitute background processes, apart from being expanded to account for the conventional production of the equal amount of dimethyl ether. Figure 5 and Figure 6 provide the scores of each impact category for the Italian and Polish case study, respectively.
Regarding GWP, the reduction in CO2 emissions is less marked. Indeed, the reduction of CO2 emissions has been estimated to account for ~58% and ~68% in Italy and Poland, respectively. In the reference scenario, the production of electricity and dimethyl ether accounts for 0.723 kg CO2-eq and 0.745 kg CO2-eq for the two countries, with the substitute electricity coming from renewables, contributing to a decrease of 0.053 kg CO2-eq in Italy and 0.024 kg CO2-eq in Poland. In both cases, the burden of conventional dimethyl ether production on GWP was less than 9%, mainly because of the small amount produced. The implementation of CCUS processes, however, lowers the emission to 0.303 kg CO2-eq and 0.236 kg CO2-eq in Italy and Poland, respectively. In the investigated case, the production of dimethyl ether from CO2 hydrogenation accounts for 26.95% in Italy and 28.32% in Poland, with differences related to the Polish country electricity mix used to satisfy the energy demand of the synthesis process being more CO2 intensive than the Italian one. However, adopting the same perspective as for the CCS scenario, CCUS technologies could lead to an overall emission reduction of 3.85% in Italy and 0.68% in Poland.
As in the CCS scenario, all the other investigated categories showed an increase. Considerations related to AD (fossil fuels)—whose increase was 67% for Italy and 66% for Poland—and ODP—whose increase was 74% for Italy and 75% for Poland—are the same as for the CCS scenario. On the other hand, little confidence is given to the results related to AP and EP; therefore, they are not shown within the graphs. Nonetheless, it must be underlined that both wind and solar power generation technologies are featured by a high impact in terms of AP and EP, and the implementation of CCUS processes fed with hydrogen produced by renewable electricity is therefore likely to be featured by a marked worsening of performance with respect to these categories [66].
Lastly, Figure 7 and Figure 8 provide a wider comparison of the CCS scenario, properly modified to account for the production of dimethyl ether and the use of renewable electricity. As for the previous case, only impacts related to GWP, AD, and ODP are shown to avoid misinterpretation issues related to the substitution approach.
Considering the CCS comparable reference case, it is clear that, from a GWP perspective, it is the option to be implemented. Indeed, though entailing a conventional dimethyl ether production process, the CCS comparable scenario has a lower GWP (0.085 kg CO2-eq for Italy and 0.071 kg CO2-eq for Poland) than in the CCUS scenario (0.303 kg CO2-eq and 0.236 kg CO2-eq for Italy and Poland, respectively). This marked difference is mostly ascribable to renewable electricity replacing conventional fossil energy supply within the background processes. These results therefore suggest that, in terms of GWP, the considered amount of renewable electricity would perform better if employed within other processes rather than in CCUS.
As for the other categories, results from AD (45.16 MJ and 43.07 MJ for CCS and CCUS, respectively, in Italy, and 43.52 MJ and 40.98 MJ for CCS and CCUS, respectively, in Poland) are similar due to the small faction of the captured CO2 used as feedstock in the CCUS scenario. AD is mostly driven by the increased amount of natural gas required when multiple energy-demanding units are added to the NGCC power plant, though dimethyl ether production contributes 5.9% and 6.39% in Italy and Poland within the CCS scenario and 1.68% and 1.34%, respectively, in the CCUS scenario. Similarly, ODP levels do not significantly differ between the CCS (5.58 × 10⁻⁷ kg CFC-11-eq for the Italian case and 4.46 × 10⁻⁷ kg CFC-11-eq for the Polish case) and the CCUS (5.58 × 10⁻⁷ kg CFC-11-eq for the Italian case and 4.46 × 10⁻⁷ kg CFC-11-eq for the Polish case) scenarios, being majorly influenced by the modified power plant configurations. The higher ODP in the CCS reference scenario with respect to CCUS scenarios is partially attributable to conventional dimethyl ether production, contributing 3.02% and 3.70% in Italy and Poland, respectively, in the former case. However, in the CCUS scenario, the burden of green dimethyl ether production is decreased to 1.2% and 0.6% in Italy and Poland, respectively. Though not extremely significant in absolute terms, ODP caused by green dimethyl ether production in the Italian case (6.51 × 10⁻⁹ kg CFC-11-eq) is more than doubled with respect to its counterpart in Poland (2.57 × 10⁻⁹ kg CFC-11-eq), mainly due to the higher share of photovoltaics in the Italian renewable electricity market.

5. Conclusions

The implementation of both carbon capture and storage and carbon capture and utilization processes coupled with a natural gas combined cycle power plant was evaluated by means of life cycle assessment methodology. Due to the twofold nature of carbon dioxide as emission and feedstock within the carbon capture and utilization scenario, the system boundary of the reference case was expanded by creating a joint functional unit comprising both the produced electricity and the synthetized chemical (i.e., dimethyl ether). Each analysis was performed accounting for the characteristics of both Italy and Poland to obtain region-specific outcomes. Results from both scenarios confirm the crucial importance of evaluating climate-mitigating technologies from a wider perspective, thus avoiding the issue of burden shift. Indeed, though the Global Warming Potential drastically decreased in each investigated scenario, all the other categories showed an increase. The increase in abiotic depletion, eutrophication potential, acidification potential, and ozone depletion can be attributable to the higher requirement of natural gas to produce the same amount of electricity with and without carbon capture utilization and storage units. Therefore, an in-depth analysis aimed at optimizing the investigated configurations is required to evaluate the trade-offs between process requirements and environmental impacts. Moreover, results revealed the crucial role of the electricity produced from renewable sources as substituted within background processes, suggesting its spread could play a major role with respect to carbon capture and utilization processes. Nonetheless, further calculations and developments of the model should include a more detailed elaboration of the presented numerical model, entailing estimates of plant construction and transportation and storage issues.

Author Contributions

Conceptualization, M.D.F., D.W. and M.F.; methodology, M.F., P.P. and M.D.F.; software, M.F. and P.P.; validation, M.D.F., D.W. and M.F.; formal analysis, M.F., M.P. and M.D.F.; investigation, M.F., M.P. and M.D.F.; resources, P.P., M.P. and M.F.; data curation, M.F., M.D.F. and D.W.; writing—original draft preparation, M.F., P.P. and M.D.F.; writing—review and editing, D.W., I.M.-K., M.P. and M.D.F.; visualization, P.P.; supervision, M.D.F., D.W. and I.M.-K.; project administration, M.D.F., D.W. and I.M.-K.; funding acquisition, M.D.F., D.W. and I.M.-K. All authors have read and agreed to the published version of the manuscript.

Funding

This article has been supported by the Polish National Agency for Academic Exchange under Grant No. PPI/APM/2019/1/00042/U/00001. The scientific research was funded by the statute subvention of Czestochowa University of Technology, Faculty of Infrastructure and Environment.

Conflicts of Interest

The authors declare no conflict of interest.

Nomenclature

APAcidification Potential
ADAbiotic Depletion
CCSCarbon Capture and Storage
CCUCarbon Capture and Utilization
CCUSCarbon Capture Utilization and Storage
GWPGlobal Warming Potential
MDEAMethyl Diethanolamine
MEAMonoethanolamine
LCALife Cycle Assessment
NGCCNatural Gas Combined Cycle
ODPOzone Depletion Potential

References

  1. European Commission. Communication from the Commission to the European Parliament, the European Counclin, the Council, the European Economic and Social Committe and the Committe of the Regions ‘European Green Deal’; European Commission: Brussels, Belgium, 2019. [Google Scholar]
  2. European Commission. Regulation (EU) 2021/1119 of the European Parliament and of the Council of 30 June 2021 Establishing the Framework for Achieving Climate Neutrality and Amending REGULATIONS (EC) No 401/2009 and (EU) 2018/1999 (‘European Climate Law’); European Commission: Brussels, Belgium, 2021. [Google Scholar]
  3. United Nations Framework Convention on Climate Change (UNFCCC). The Paris Agreement. 2016. Available online: https://unfccc.int/documents/184656 (accessed on 5 August 2022).
  4. European Commission. Directive (EU) 2018/2001 of the European Parliament and of the Council of 11 December 2018 on the Promotion of the Use of Energy from Renewable Sources (Recast); European Commission: Brussels, Belgium, 2018. [Google Scholar]
  5. Dael, S.; Renders, N.; Nissen, C.; Förster, H.; Siemons, A.; Tomescu, M.; Sporer, M. European Environment Agency. Trends and Projections in Europe 2021; EU Publications: Luxembourg, 2021. [Google Scholar] [CrossRef]
  6. European Environment Agency. EEA Greenhouse Gases—Data Viewer, 13 April 2021. Available online: https://www.eea.europa.eu/data-and-maps/data/data-viewers/greenhouse-gases-viewer (accessed on 1 August 2022).
  7. Gielen, D.; Boshell, F.; Saygin, D.; Bazilian, M.D.; Wagner, N.; Gorini, R. The role of renewable energy in the global energy transformation. Energy Strategy Rev. 2019, 24, 38–50. [Google Scholar] [CrossRef]
  8. Jäger-Waldau, A.; Kougias, I.; Taylor, N.; Thiel, C. How photovoltaics can contribute to GHG emission reductions of 55% in the EU by 2030. Renew. Sustain. Energy Rev. 2020, 126, 109836. [Google Scholar] [CrossRef]
  9. Rashidi, M.M.; Mahariq, I.; Murshid, N.; Wongwises, S.; Mahian, O.; Nazari, M.A. Applying wind energy as a clean source for reverse osmosis desalination: A comprehensive review. Alex. Eng. J. 2022, 61, 12977–12989. [Google Scholar] [CrossRef]
  10. Mohammad, N.; Ishak, W.W.M.; Mustapa, S.I.; Ayodele, B.V. Natural Gas as a Key Alternative Energy Source in Sustainable Renewable Energy Transition: A Mini Review. Front. Energy Res. 2021, 9, 625023. [Google Scholar] [CrossRef]
  11. Eurostat. Natural Gas Supply Statistics. April 2022. Available online: https://ec.europa.eu/eurostat/statistics-explained/index.php?title=Natural_gas_supply_statistics#Consumption_trends (accessed on 23 July 2022).
  12. Gas Factsheet. ACER. Available online: https://www.acer.europa.eu/gas-factsheet (accessed on 23 July 2022).
  13. Greenfield, C. Natural Gas-Fired Power; IEA: Paris, France, 2021; Available online: https://www.iea.org/reports/natural-gas-fired-power (accessed on 23 July 2022).
  14. Barbera, E.; Mio, A.; Pavan, A.M.; Bertucco, A.; Fermeglia, M. Fuelling power plants by natural gas: An analysis of energy efficiency, economical aspects and environmental footprint based on detailed process simulation of the whole carbon capture and storage system. Energy Convers. Manag. 2022, 252, 115072. [Google Scholar] [CrossRef]
  15. Bandilla, K.W. 31—Carbon Capture and Storage. In Future Energy, 3rd ed.; Letcher, T.M., Ed.; Elsevier: Amsterdam, The Netherlands, 2020; pp. 669–692. [Google Scholar] [CrossRef]
  16. International Energy Agency (IEA). CCUS in Clean Energy Transitions, Paris. 2021. Available online: www.iea.org/t&c/ (accessed on 20 July 2022).
  17. Capocelli, M.; de Falco, M. Generalized penalties and standard efficiencies of carbon capture and storage processes. Int. J. Energy Res. 2022, 46, 4808–4824. [Google Scholar] [CrossRef]
  18. Desideri, U.; Arcioni, L.; Tozzi, M. Feasibility study for a carbon capture and storage project in northern Italy. Int. J. Energy Res. 2008, 32, 1175–1183. [Google Scholar] [CrossRef]
  19. Majchrzak-Kucęba, I.; Szymanek, P. CCU Technologies in the Green Economy. Eng. Prot. Environ. 2018, 21, 261–271. [Google Scholar] [CrossRef]
  20. Leonzio, G. State of art and perspectives about the production of methanol, dimethyl ether and syngas by carbon dioxide hydrogenation. J. CO2 Util. 2018, 27, 326–354. [Google Scholar] [CrossRef]
  21. Ma, J.; Li, Q.; Kühn, M.; Nakaten, N. Power-to-gas based subsurface energy storage: A review. Renew. Sustain. Energy Rev. 2018, 97, 478–496. [Google Scholar] [CrossRef]
  22. Matzen, M.; Demirel, Y. Methanol and dimethyl ether from renewable hydrogen and carbon dioxide: Alternative fuels production and life-cycle assessment. J. Clean. Prod. 2016, 139, 1068–1077. [Google Scholar] [CrossRef]
  23. Catizzone, E.; Bonura, G.; Migliori, M.; Frusteri, F.; Giordano, G. CO2 recycling to dimethyl ether: State-of-the-art and perspectives. Molecules 2018, 23, 31. [Google Scholar] [CrossRef]
  24. International Energy Agency (IEA). About CCUS; IEA: Paris, France, 2021; Available online: https://www.iea.org/reports/about-ccus (accessed on 5 August 2022).
  25. Joint Research Centre (JRC). International Reference Life Cycle Data System (ILCD) Handbook: General Guide for Life Cycle Assessment: Provisions and Action Steps; Publication Office of the European Union: Luxembourg, 2013. [Google Scholar] [CrossRef]
  26. Guinée, J.B.; Heijungs, R.; Huppes, G.; Zamagni, A.; Masoni, P.; Buonamici, R.; Ekvall, T.; Rydberg, T. Life Cycle Assessment: Past, Present, and Future. Environ. Sci. Technol. 2011, 45, 90–96. [Google Scholar] [CrossRef]
  27. Gargiulo, A.; Carvalho, M.L.; Girardi, P. Life Cycle Assessment of Italian Electricity Scenarios to 2030. Energies 2020, 13, 3852. [Google Scholar] [CrossRef]
  28. Lelek, L.; Kulczycka, J.; Lewandowska, A.; Zarebska, J. Life cycle assessment of energy generation in Poland. Int. J. Life Cycle Assess. 2016, 21, 1–14. [Google Scholar] [CrossRef]
  29. Barros, M.V.; Salvador, R.; Piekarski, C.M.; de Francisco, A.C.; Freire, F.M.C.S. Life cycle assessment of electricity generation: A review of the characteristics of existing literature. Int. J. Life Cycle Assess. 2020, 25, 36–54. [Google Scholar] [CrossRef]
  30. Carvalho, M.L.; Marmiroli, B.; Girardi, P. Life cycle assessment of Italian electricity production and comparison with the European context. Energy Rep. 2022, 8, 561–568. [Google Scholar] [CrossRef]
  31. Singh, B.; Strømman, A.H.; Hertwich, E. Life cycle assessment of natural gas combined cycle power plant with post-combustion carbon capture, transport and storage. Int. J. Greenh. Gas Control. 2011, 5, 457–466. [Google Scholar] [CrossRef]
  32. Volkart, K.; Bauer, C.; Boulet, C. Life cycle assessment of carbon capture and storage in power generation and industry in Europe. Int. J. Greenh. Gas Control. 2013, 16, 91–106. [Google Scholar] [CrossRef]
  33. Lerner, A.; Brear, M.J.; Lacey, J.S.; Gordon, R.L.; Webley, P.A. Life cycle analysis (LCA) of low emission methanol and di-methyl ether (DME) derived from natural gas. Fuel 2018, 220, 871–878. [Google Scholar] [CrossRef]
  34. Rosental, M.; Fröhlich, T.; Liebich, A. Life Cycle Assessment of Carbon Capture and Utilization for the Production of Large Volume Organic Chemicals. Front. Clim. 2020, 2, 586199. [Google Scholar] [CrossRef]
  35. Loiseau, E.; Aissani, L.; le Féon, S.; Laurent, F.; Cerceau, J.; Sala, S.; Roux, P. Territorial Life Cycle Assessment (LCA): What exactly is it about? A proposal towards using a common terminology and a research agenda. J. Clean. Prod. 2018, 176, 474–485. [Google Scholar] [CrossRef]
  36. De Falco, M.; Natrella, G.; Capocelli, M.; Popielak, P.; Sołtysik, M.; Wawrzyńczak, D.; Majchrzak-Kucęba, I. Exergetic Analysis of DME Synthesis from CO2 and Renewable Hydrogen. Energies 2022, 15, 3516. [Google Scholar] [CrossRef]
  37. Ministeri dello Sviluppo Economico dell’Ambiente e della Tutela del Territorio e del Mare delle Infrastrutture e dei Trasporti. Piano Nazionale Integrato per l’Energia e il Clima. December 2019. Available online: https://www.mise.gov.it/images/stories/documenti/PNIEC_finale_17012020.pdf (accessed on 24 July 2022).
  38. Eurostat. Renewable Energy Statistics. January 2022. Available online: https://ec.europa.eu/eurostat/statistics-explained/index.php?title=Renewable_energy_statistics#Share_of_renewable_energy_more_than_doubled_between_2004_and_2020 (accessed on 4 August 2022).
  39. Bellocchi, S.; de Falco, M.; Gambini, M.; Manno, M.; Stilo, T.; Vellini, M. Opportunities for power-to-Gas and Power-to-liquid in CO2-reduced energy scenarios: The Italian case. Energy 2019, 175, 847–861. [Google Scholar] [CrossRef]
  40. International Energy Agency (IEA). Poland 2022—Energy Policy Review; IEA: Paris, France, May 2022; Available online: www.iea.org (accessed on 24 July 2022).
  41. Ministry of Climate and Environment. Energy Policy of Poland until 2040, Warsaw. 2021. Available online: https://www.gov.pl/web/climate/energy-policy-of-poland-until-2040-epp2040 (accessed on 5 August 2022).
  42. Polish Geological Institute. Mineral Resources of Poland. 2020. Available online: http://geoportal.pgi.gov.pl/surowce/energetyczne/ropa_naftowa/2020 (accessed on 5 August 2022).
  43. Mathisen, A.; Skagestad, R. Utilization of CO2 from Emitters in Poland for CO2-EOR. Energy Procedia 2017, 114, 6721–6729. [Google Scholar] [CrossRef]
  44. Kaiser, M.; Zimmer, R.; Brunsting, S.; Mastop, J.; Pol, M. Development of CCS Projects in Poland. How to Communicate with the Local Public? Energy Procedia 2014, 51, 267–273. [Google Scholar] [CrossRef]
  45. ISO 14040:2006(en); Environmental Management—Life Cycle Assessment—Principles and Framework. ISO—The International Organization for Standardization: Geneva, Switzerland, 2006.
  46. ISO 14044:2006(en); Environmental Management—Life Cycle Assessment—Requirements and Guidelines. ISO—The International Organization for Standardization: Geneva, Switzerland, 2006.
  47. Müller, L.J.; Kätelhön, A.; Bachmann, M.; Zimmermann, A.; Sternberg, A.; Bardow, A. A Guideline for Life Cycle Assessment of Carbon Capture and Utilization. Front. Energy Res. 2020, 8, 15. [Google Scholar] [CrossRef] [Green Version]
  48. Von der Assen, N.; Jung, J.; Bardow, A. Life-cycle assessment of carbon dioxide capture and utilization: Avoiding the pitfalls. Energy Environ. Sci. 2013, 6, 2721–2734. [Google Scholar] [CrossRef]
  49. Heijungs, R.; Allacker, K.; Benetto, E.; Brandão, M.; Guinée, J.; Schaubroeck, S.; Schaubroeck, T.; Zamagni, A. System Expansion and Substitution in LCA: A Lost Opportunity of ISO 14044 Amendment 2. Front. Sustain. 2021, 2, 692055. [Google Scholar] [CrossRef]
  50. Wernet, G.; Bauer, C.; Steubing, B.; Reinhard, J.; Moreno-Ruiz, E.; Weidema, B. The ecoinvent database version 3 (part I): Overview and methodology. Int. J. Life Cycle Assess. 2016, 21, 1218–1230. [Google Scholar] [CrossRef]
  51. Zoelle, A.; Keairns, D.; Pinkerton, L.L.; Turner, M.J.; Woods, M.; Kuehn, N.; Shah, V.; Chou, V. Cost and Performance Baseline for Fossil Energy Plants Volume 1a: Bituminous Coal (PC) and Natural Gas to Electricity Revision 3; Technical Report DOE/NETL-2015/1723; Office of Scientific and Technical Information: Oak Ridge, TN, USA, 2015. [Google Scholar] [CrossRef]
  52. Snam. Transportation Network. 2022. Available online: https://www.snam.it/en/about-us/snam-infrastructures/the-transportation-network/ (accessed on 5 August 2022).
  53. International Energy Agency (IEA). Poland Natural Gas Security Policy. 30 June 2022. Available online: https://www.iea.org/articles/poland-natural-gas-security-policy (accessed on 4 August 2022).
  54. Ministero della Transizione Ecologica. Analisi e Statistiche Energetiche e Minerarie. Gas Naturale. 2022. Available online: https://dgsaie.mise.gov.it/importazioni-gas-naturale (accessed on 4 August 2022).
  55. Cetinkaya, E.; Dincer, I.; Naterer, G.F. Life cycle assessment of various hydrogen production methods. Int. J. Hydrogen Energy 2012, 37, 2071–2080. [Google Scholar] [CrossRef]
  56. Simons, A.; Bauer, C. Life cycle assessment of hydrogen production. In Transition to Hydrogen: Pathways toward Clean Transportation; Wokaun, A., Wilhelm, E., Eds.; Cambridge University Press: Cambridge, UK, 2011; pp. 13–57. [Google Scholar] [CrossRef]
  57. Vidas, L.; Castro, R. Recent Developments on Hydrogen Production Technologies: State-of-the-Art Review with a Focus on Green-Electrolysis. Appl. Sci. 2021, 11, 1363. [Google Scholar] [CrossRef]
  58. International Renewable Energy Agency. Green Hydrogen Cost Reduction: Scaling Up Electrolyseres to Meet The 1.5 °C Climate Goal. 2020. Available online: www.irena.org/publications (accessed on 25 July 2022).
  59. Koj, J.C.; Wulf, C.; Schreiber, A.; Zapp, P. Site-Dependent Environmental Impacts of Industrial Hydrogen Production by Alkaline Water Electrolysis. Energies 2017, 10, 860. [Google Scholar] [CrossRef]
  60. Kanz, O.; Bittkau, K.; Ding, K.; Rau, U.; Reinders, A. Review and Harmonization of the Life-Cycle Global Warming Impact of PV-Powered Hydrogen Production by Electrolysis. Front. Electron. 2021, 2, 711103. [Google Scholar] [CrossRef]
  61. de Falco, M.; Capocelli, M.; Giannattasio, A. Membrane Reactor for one-step DME synthesis process: Industrial plant simulation and optimization. J. CO2 Util. 2017, 22, 33–43. [Google Scholar] [CrossRef]
  62. Mota, N.; Ordoñez, E.M.; Pawelec, B.; Fierro, J.L.G.; Navarro, R.M. Direct Synthesis of Dimethyl Ether from CO2: Recent Advances in Bifunctional/Hybrid Catalytic Systems. Catalysts 2021, 11, 411. [Google Scholar] [CrossRef]
  63. Bonura, G.; Todaro, S.; Frusteri, L.; Majchrzak-Kucęba, I.; Wawrzyńczak, D.; Pászti, Z.; Tálas, E.; Tompos, A.; Ferenc, L.; Solt, H.; et al. Inside the reaction mechanism of direct CO2 conversion to DME over zeolite-based hybrid catalysts. Appl. Catal. B 2021, 294, 120255. [Google Scholar] [CrossRef]
  64. Eurostat. Energy Balances April 2022 Edition, April 2022. Available online: https://ec.europa.eu/eurostat/web/energy/data/energy-balances/ (accessed on 4 August 2022).
  65. Terna. Dati Statistici Sull’energia Elettrica in Italia. 2020. Available online: https://www.terna.it/it/sistema-elettrico/statistiche/pubblicazioni-statistiche (accessed on 18 July 2022).
  66. Raadal, H.L.; Modahl, I.S. Life Cycle Assessment of CCS (Carbon Capture and Storage) and CCU (Carbon Capture and Utilization); NORSUS: Kråkerøy, Norway, 2021. [Google Scholar]
  67. Skone, T.J.; Schivley, G.; Jamieson, M.; Marriott, J.; Cooney, G.; Littlefield, J.; Mutchek, M.; Krynock, M.; Shih, C.Y. Life Cycle Analysis: Natural Gas Combined Cycle (NGCC) Power Plants; Technical Report DOE/NETL-2018/1890; Office of Scientific and Technical Information: Oak Ridge, TN, USA, 2018. [Google Scholar] [CrossRef]
  68. EC-JRC. ILCD Handbook: Recommendations for Life Cycle Impact Assessment in the European Context. 2011. Available online: https://eplca.jrc.ec.europa.eu/uploads/ILCD-Handbook-Recommendations-for-Life-Cycle-Impact-Assessment-in-the-European-context.pdf (accessed on 25 July 2022).
Figure 1. CO2 emissions by sector in EU-27, Poland, and Italy. Data elaborated from [6].
Energies 15 06809 g001
Figure 2. System boundaries.
Energies 15 06809 g002
Figure 3. Impact category scores for the Italian case study in the CCS scenario.
Energies 15 06809 g003
Figure 4. Impact category scores for the Polish case study in the CCS scenario.
Energies 15 06809 g004
Figure 5. Impact category scores for the Italian case study in the CCUS scenario.
Energies 15 06809 g005
Figure 6. Impact category scores for the Polish case study in the CCUS scenario.
Energies 15 06809 g006
Figure 7. Impact category scores for the Italian case study in the CCUS scenario considering a comparable CCS reference scenario.
Energies 15 06809 g007
Figure 8. Impact category scores for the Polish case study in the CCUS scenario considering a comparable CCS reference scenario.
Energies 15 06809 g008
Table 1. Inventory for the NGCC power plant operation.
ParameterValueUnit
Inputs
Natural gas50,000kg h−1
Air2,572,035kg h−1
Make-up water9502kg h−1
Cooling water7066m3 h−1
Outputs
Electricity188.5 MWh
Coproduced Heat143.8MWh
Emissions
CO2132,327kg h−1
Flue gas (without CO2)2,489,707kg h−1
Table 2. Natural gas composition and characteristics.
ComponentVolume Percentage
Methane, CH493.10%
Ethane, C2H63.20%
Propane, C3H80.70%
Butane, C4H100.40%
Carbon dioxide, CO21.00%
Nitrogen, N21.60%
Calorific ValueValue
Higher Heating Value (HHV) in kJ kg−152,581
Gross Calorific Value in MJ m−338.46
Table 3. Natural gas balance in Italy and Poland in 2020. Values are expressed in terajoules (gross calorific value).
Natural Gas BalanceItalyPoland
Primary production149,810157,151
Imports (entries)2,523,2491,582,568
Resources2,673,0591,739,720
Stock change −41,034−18,444
Exports (exits)12,027966,209
Inland demand2,702,066791,955
Energy dependency (from import)92.94%77.83%
Share on EU inland demand17.80%5.22%
Natural gas share in the overall energy mix40.47%16.89%
Table 4. Natural gas import shares by origin country for Italy and Poland in 2020.
CountryItalyPoland
Russian Federation43.37%55.81%
Algeria22.83%-
Netherlands1.38%-
Libya6.74%-
Norway11.17%1.74%
Qatar10.49%13.37%
United States2.65%5.81%
France0.93%-
Germany-20.93%
Czech Republic-1.74%
Others0.43%0.58%
Table 5. Inventory of the carbon capture unit.
ParameterValueUnit
Inputs
CO2132,327kg h−1
Flue gas (without CO2)2,489,707kg h−1
Water make-up3415kg h−1
MDEA make-up249kg h−1
Required power123.5MWh
Heat143.8MWh
Cooling water46,914.27m3 h−1
Outputs
CO2 enriched stream125,014kg h−1
Emissions
Clean gas2,410,824kg h−1
Table 6. Inventory of the underground storage unit.
ParameterValueUnit
Inputs
CO2 enriched stream125,014kg h−1
Required power11.5MWh
Cooling water1867.50m3 h−1
Outputs
CO2 underground119,067.55
Emissions kg h−1
Losses5947kg h−1
Table 7. Inventory of the hydrogen production unit.
ParameterValueUnit
Inputs
Water, deionized10kg per kg of hydrogen
Electricity50kWh per kg of hydrogen
Potassium hydroxide0.11g per kg of hydrogen
Steam1.9per kg of hydrogen
Outputs
Hydrogen1kg
Table 8. Inventory of the dimethyl ether production unit.
ParameterValueUnit
Inputs
CO229,766kg h−1
Hydrogen3751kg h−1
Required power4.66MWh
Cooling water6,482,752m3 h−1
Outputs
Dimethyl Ether10,444kg h−1
Methanol3293kg h−1
Water16,199kg h−1
Emissions
CO22964kg h−1
Table 9. Electricity mix in Italy and Poland in 2020. Values are reported in TWh.
ItalyPoland
Gross Electricity Production280.03157.95
Solid Fossil Fuels13.38107.40
Natural Gas133.6817.29
Oil and petroleum products3.171.75
Manufactured Gas (1)1.661.97
Other Solid Fuels (2)20.747.61
Other Gaseous Fuels (3)8.171.23
Hydro Power49.492.94
Geothermal Power6.03-
Wind Power18.7615.80
Photovoltaic Power24.941.96
Net Imports32.2013.3
(1) Comprising blast furnace gases and coke oven gases. (2) Comprising biofuels, municipal waste, and other oils. (3) Biogas.
Table 10. Suggested impact categories for CCUS. Adapted from [34].
Impact CategoryIndicatorUnitRecommendation Level
Global Warming Potential (GWP)Potential global warming in a 100-year time horizon due to emissions of greenhouse gases to airkg CO2-eqI
Cumulated Energy Demand (CED)Total energy content of all fossil, nuclear, and renewable energies consumedGJNot listed
Acidification Potential (AP)Potential acidification of soils and water due to the increased concentration of hydrogen ions in a local environmentkg SO2-eqII
Eutrophication Potential (EP)Nutritional element enrichment within aquatic and terrestrial ecosystem caused by the release of nitrogen or phosphor containing compoundskg PO4-eqII
Ozone Depletion Potential (ODP)Deterioration of the stratospheric ozone layer caused by the emission of halogenated hydrocarbonsg CFC-11-eqI
Particulate Matter Formation (PM2.5)Particulate matter emissions to air that cause damage to human healthg PM2.5-eqI
Publisher’s Note: MDPI stays neutral with regard to jurisdictional claims in published maps and institutional affiliations.

