Abstract
An alluvial fan is a good area to install open-loop geothermal heat pump (GHP) systems due to shallower aquifers, faster groundwater flow, and fewer land subsidence risks. The natural temperature change in groundwater occurs in alluvial fans due to the recharge of river water and faster groundwater flow, and the thermal impact of the open-loop system has not been studied well in such areas. The purpose of this research is to understand the thermal impact of open-loop GHP systems on an alluvial fan. A regional 3D model of groundwater flow with heat transport was created to determine the distribution of flow velocity and temperature of groundwater. After that, two local models with different groundwater velocities were constructed to demonstrate the thermal impact of an open-loop GHP system using one extraction and one injection well. The results indicated that the local model with faster groundwater flow had a smaller thermal impact. The natural temperature change in groundwater causes groundwater temperature to be lower in the summer and higher in winter during the operation in the local model, with faster groundwater flow.
1. Introduction
Geothermal heat pumps (GHP) have gained a lot of attention in recent years because of the increasing public demand for sustainable heating and cooling systems with low CO2 emissions in comparison to other commercial and domestic heating and/or cooling alternatives [1,2,3]. GHP are promising devices to utilize low-enthalpy geothermal energy for the heating and cooling of buildings. They use underground as heat sinks in the summer and as heat sources in the winter. GHP are classified as closed-loop systems and open-loop systems. A closed-loop system uses an underground as a heat source by burying pipes underground as heat absorbers, while an open-loop system uses groundwater as a heat source through extraction and injection wells. Groundwater is extracted from an aquifer, run through a heat pump, and injected back into the ground.
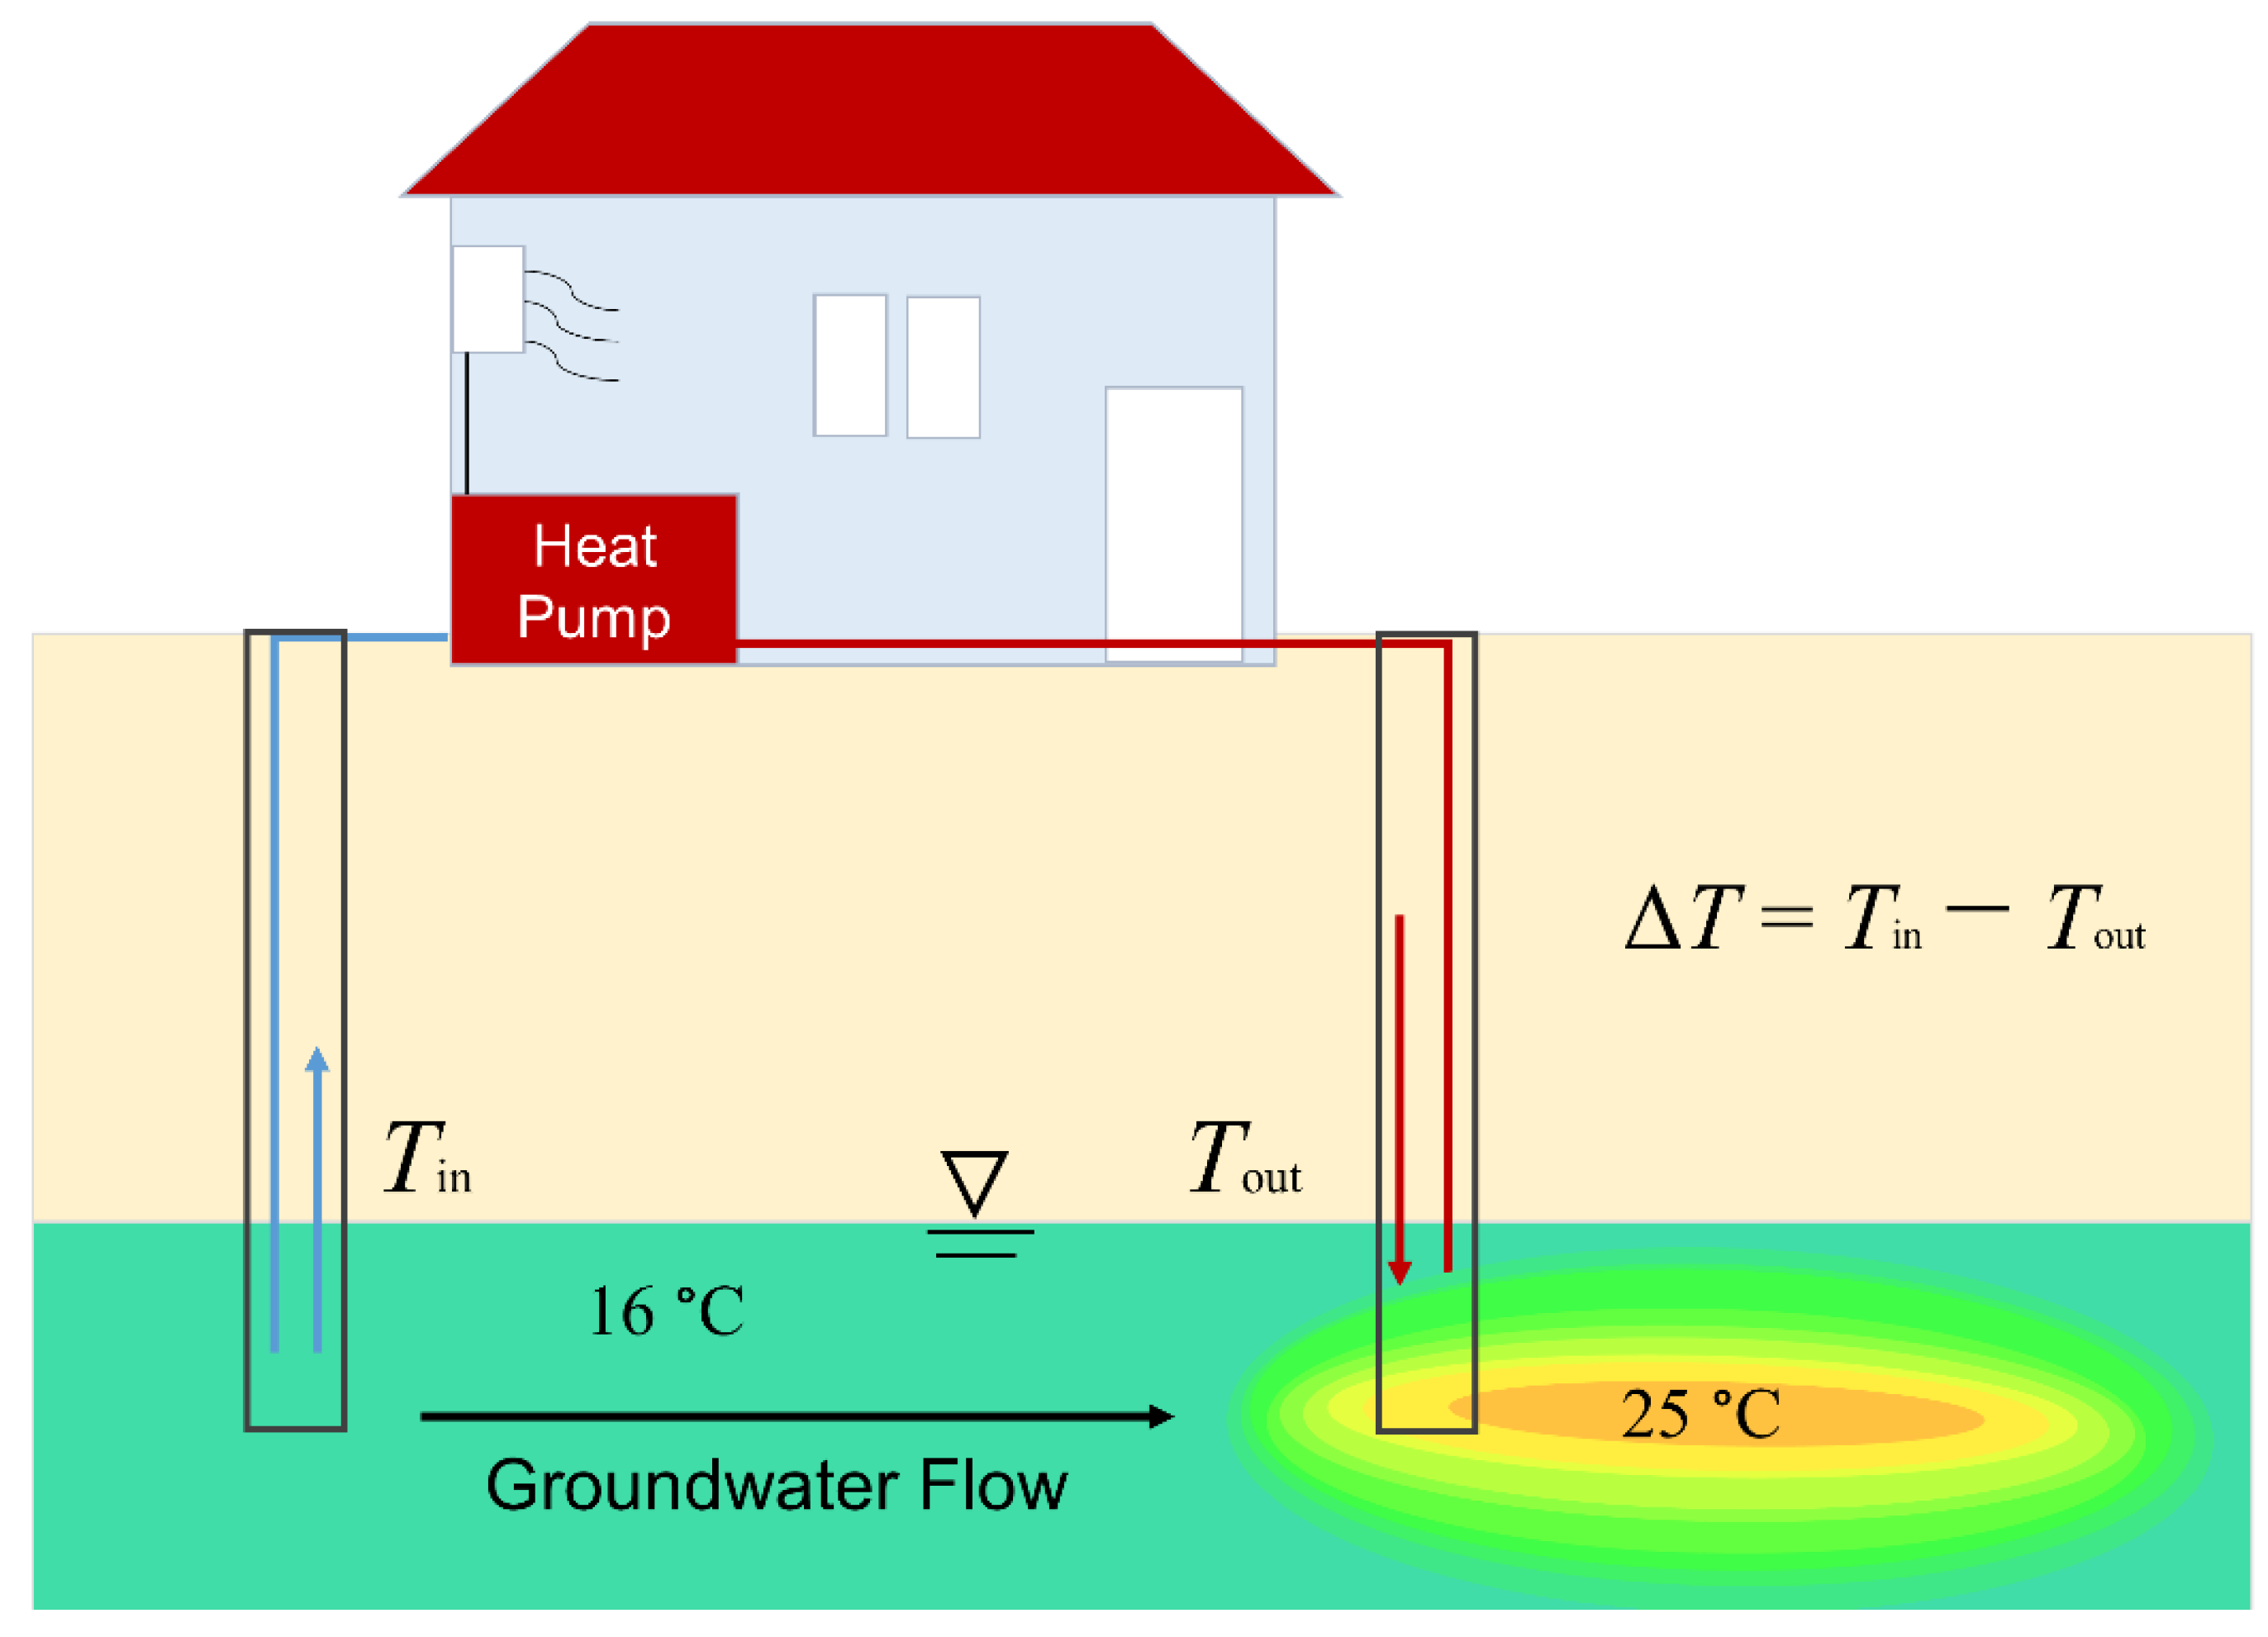
The effect of the water returned to the ground by an open-loop system has impacted an increasing or decreasing groundwater temperature. The extraction and injection of groundwater results in thermal plumes of cooled and warmed groundwater spreading in an aquifer (Figure 1). The correct evaluation of thermal plumes of colder or warmer re-injected groundwater is a critical aspect in open-loop GHP plant design [4]. Thermal plumes due to operation may impact groundwater chemistry and neighborhood installations [5]. GHP may also experience thermal interference and thermal feedback from adjacent GHP systems, resulting in a decrease in system efficiency [6]. A few studies based on the environmental problems induced by the application of geothermal heat pumps have been carried out [7,8,9]. Freedman et al. [7] performed a thermal analysis of the open-loop system of the geothermal heat pump installed at the Pacific Northwest National Laboratory (model area: 50,000 m2) in southeastern Washington State, using a steady-state numerical modeling approach. Pophillat et al. [8] investigated the effect of groundwater velocity, longitudinal and transverse dispersivity coefficients, and energy load parameters on the long-term thermal impact of variable injection. Piga et al. [9] performed a numerical simulation to assess the thermal impact of an open-loop system of a geothermal heat pump, comparing rigorous to simplified models. These previous studies implied that, in addition to the pumping rate and water injected temperature, the thermal impact is strongly influenced by subsurface conditions, such as hydraulic conductivity and thermal subsurface parameters.
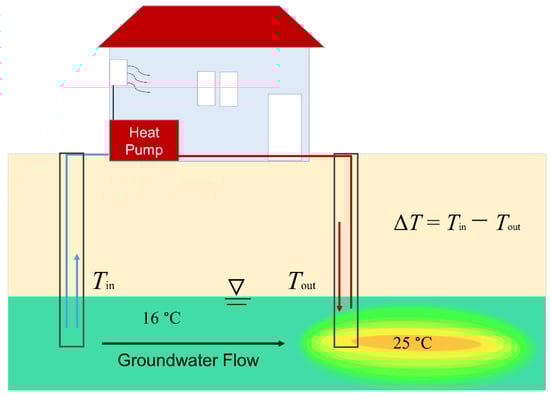
Figure 1.
Schematic image of an open-loop geothermal heat pump system.
Many residential areas in Japan are situated on alluvial deposits, which generally occur with fast groundwater flow. The alluvial fan of the Nagara River is one of the alluvial fan areas that is influenced by infiltrating surface water from the Nagara River. Groundwater temperatures near the apex of the alluvial fan are influenced by the natural temperature change recharged from the river and the lateral groundwater flow. River water is recharged into the aquifer, influencing groundwater temperature. This influence brings about a zone where the temperature is cooler than the Nagara River in the summer, whereas in the winter, the groundwater is warmer than the river water. However, these groundwater temperature fluctuations decreased at distances far away from the apex of the alluvial fan. This makes the groundwater temperature at the toe of the alluvial fan area more consistent throughout the year. This influence is noted from observation wells that were monitored from May 2013 to May 2014 at monthly intervals across the Gifu city area [10].
There has been no study of the thermal environmental impact of an open-loop GHP system in alluvial fan areas with natural temperature changes due to groundwater flow. Most studies have examined the thermal impacts and sustainability of intensive shallow geothermal utilization at alluvial and glaciofluvial deposits, with no significant vertical temperature variation in groundwater. This study was performed to understand the thermal environmental impact of an open-loop GHP system in areas with natural temperature changes in groundwater. GHP systems have the potential to be an economical, sustainable, and environmentally friendly heating and cooling options, but they need to be carefully planned. We aimed to understand how the thermal impact of groundwater extraction and injection using an open-loop GHP system varied in two different local locations with different underground conditions: (1) local model 1 with fast groundwater flow velocity, influenced by a natural change in the groundwater system, and (2) local model 2 with slow groundwater flow velocity, influenced by a very small natural change in the groundwater system.
Approaches based on numerical simulations are useful for analyzing the thermal impacts of GWHP installation [11,12,13]. The FEFLOW program was used to construct the 3D model. A groundwater flow and heat transport simulation was performed to understand the patterns of regional groundwater flow and heat transport. The local model was performed to understand the thermal environmental impact accompanied by the operation of the open-loop GHP system on the 2 local models on the Nagara River alluvial fan.
2. Materials and Methods
2.1. Site Description
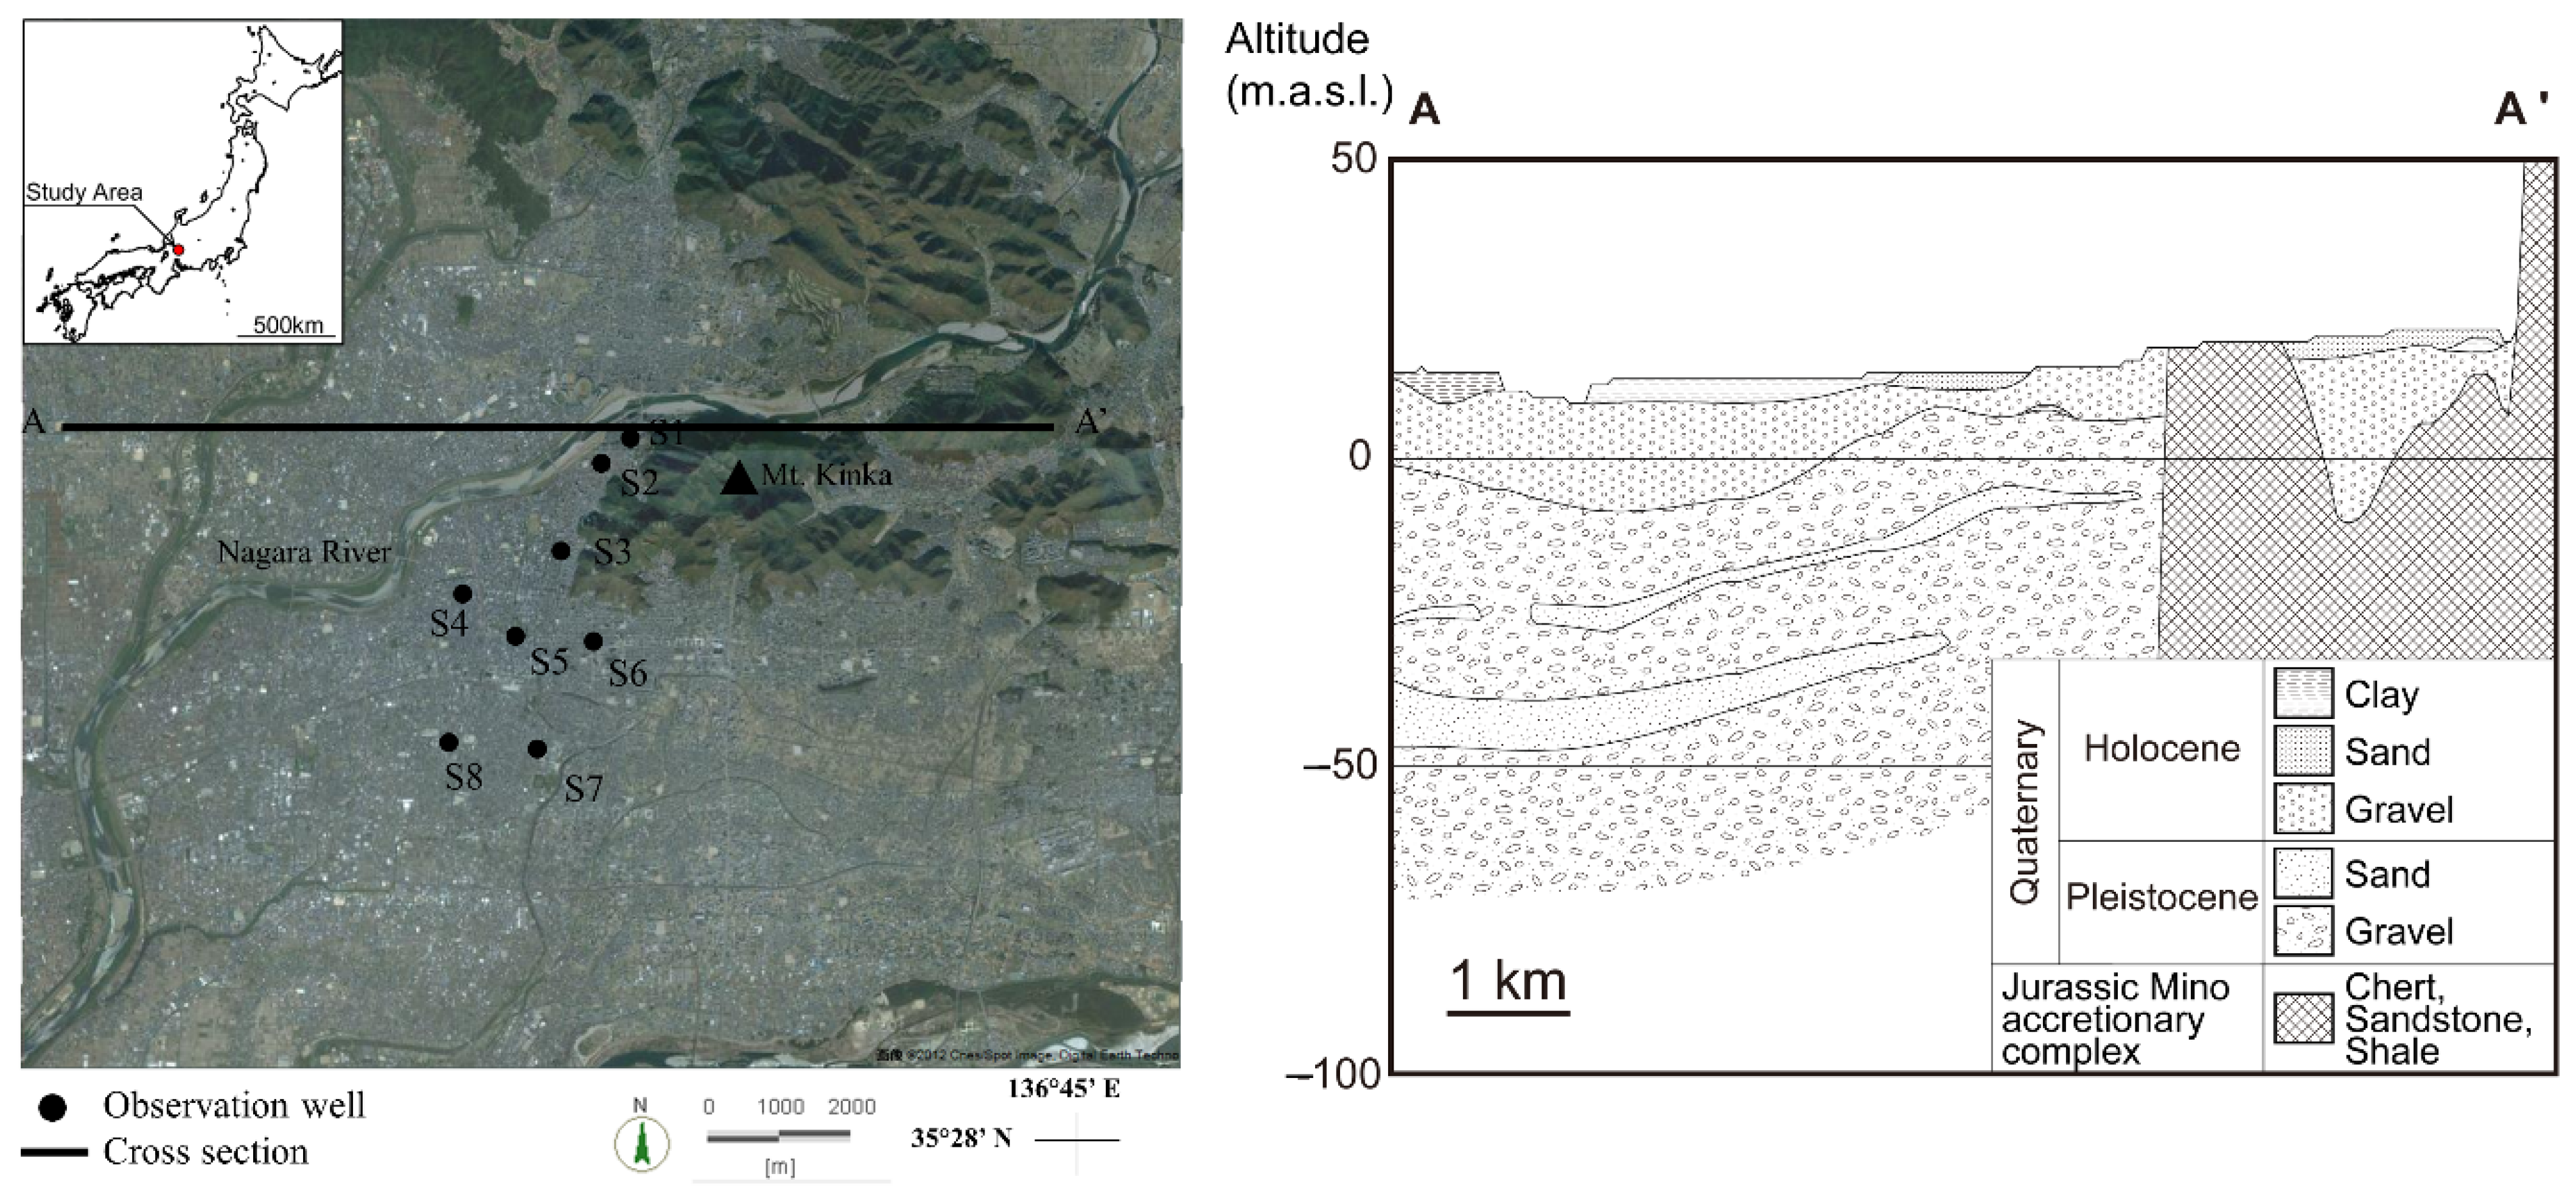
The study area was the alluvial fan of the Nagara River in central Japan. The Nagara River flows at the center of the alluvial fan and is bounded by mountain ranges from the north to the northeast. The mountain ranges are composed of the Jurassic accretionary complex, including chert, sandstone, and shale. The underground area of the alluvial fan is mainly composed of Holocene gravel and silt beds near the surface and Pleistocene gravel and sand beds below Holocene beds (Figure 2). The sand and silt layers divide the aquifers. Furthermore, these aquifers are partially connected because water table changes in these aquifers are related to one another [10].
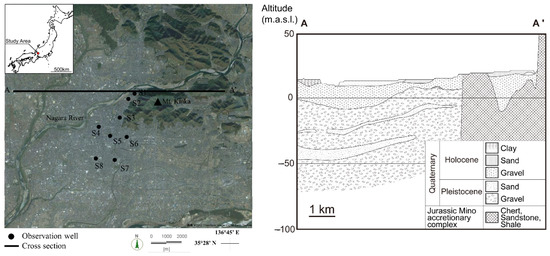
Figure 2.
Study area (left) and geologic cross-section (right) of the alluvial fan of the Nagara River.
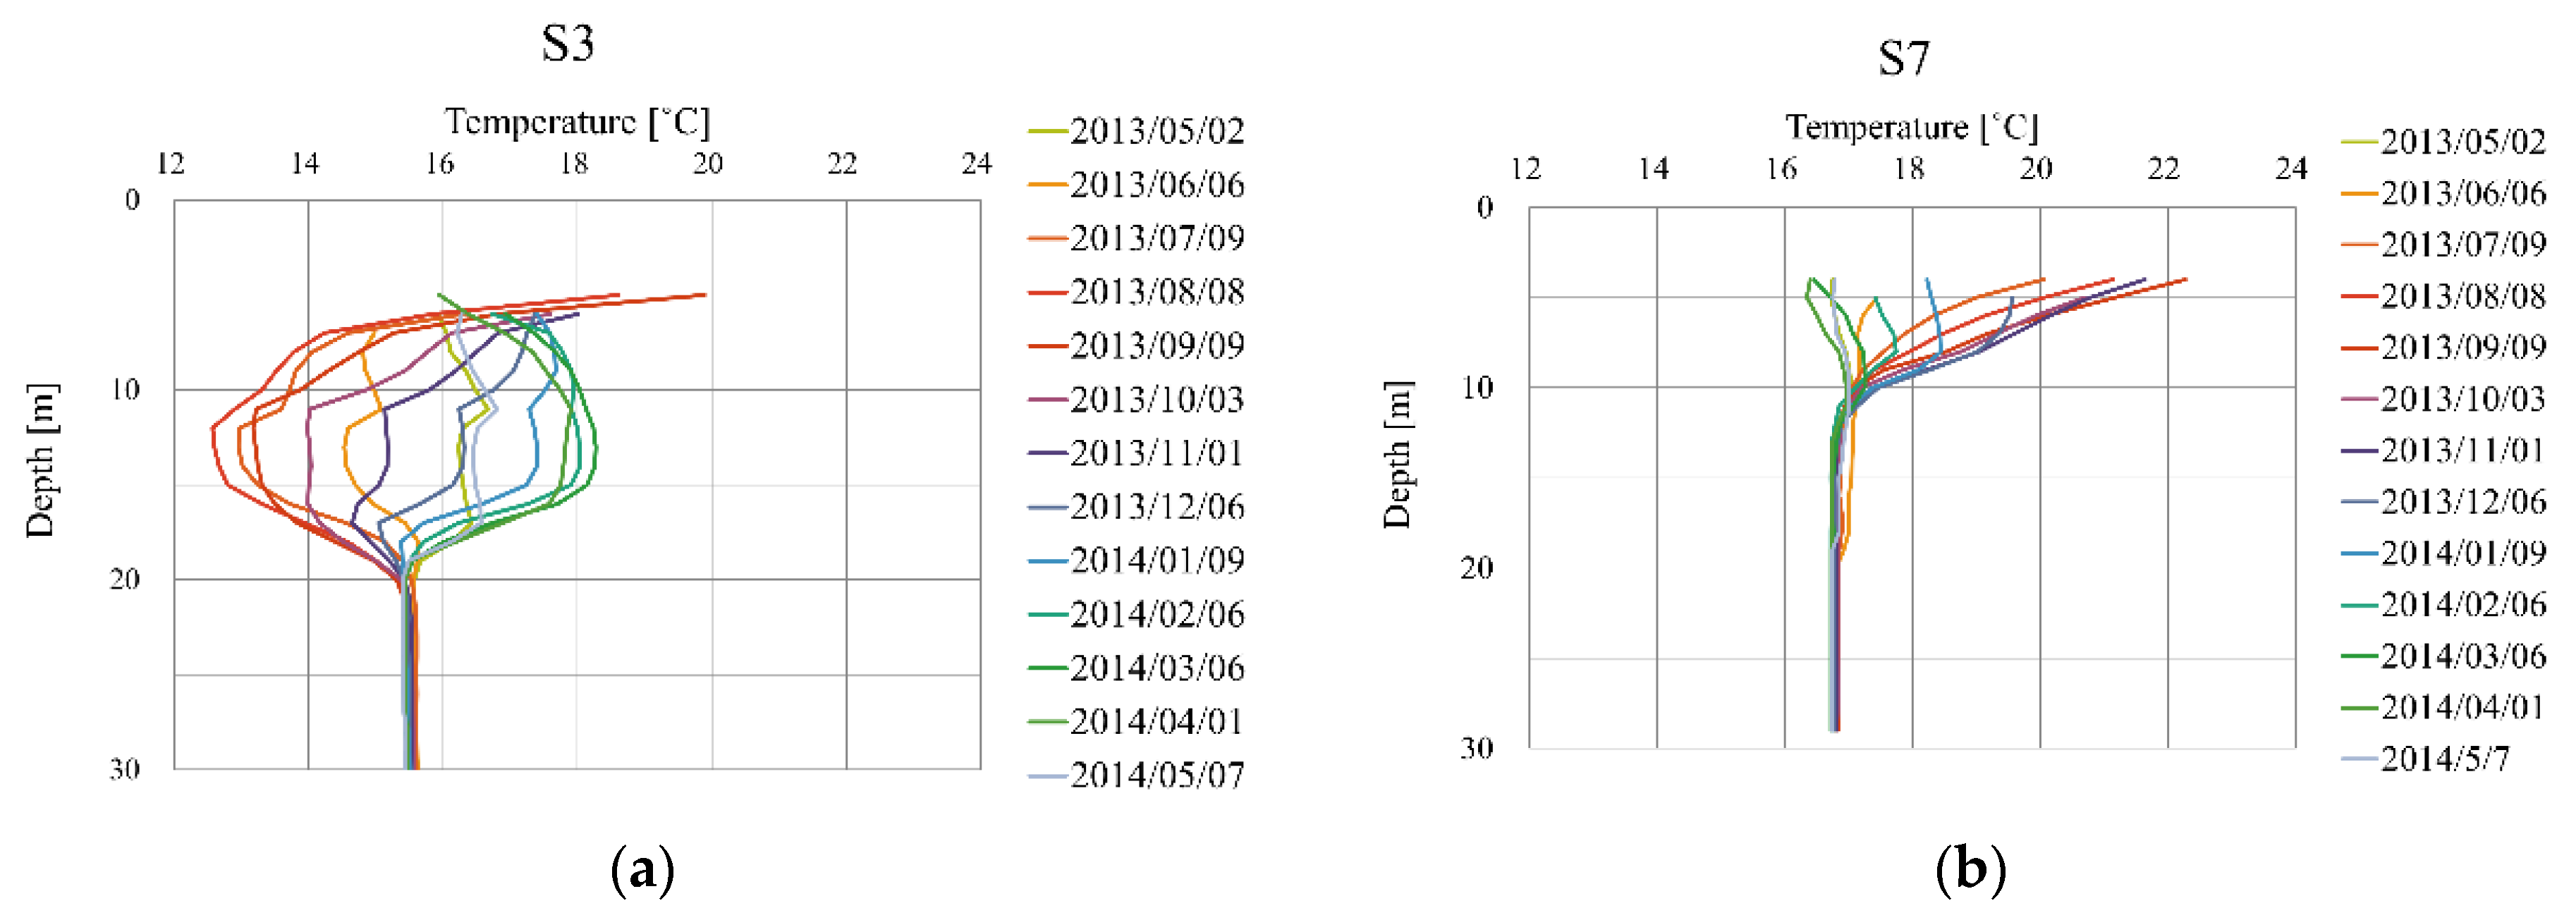
Ohtani et al. [10] reported monthly water levels and groundwater temperatures at the Nagara River alluvial fan from May 2013 to May 2014. Groundwater temperatures were observed at 1 m depth intervals from the water surface to the bottom of the holes. The river water recharge and the fast lateral groundwater flow impact the groundwater temperatures in the alluvial fan (Figure 3a), and the phase difference between river water temperature and groundwater temperature increases as the distance from the Nagara River increases. The groundwater temperature is almost constant throughout the year at the toe of the alluvial fan (Figure 3b).

Figure 3.
Vertical profiles of groundwater temperature of the observation wells in the alluvial fan of the Nagara River. Wells S3 (a) and S7 (b) are in the middle and toe of the alluvial fan, respectively.
2.2. Regional Simulation Model Settings
In this study, DHI FEFLOW (Finite Element subsurface FLOW and transport system) version 7.0 was used to simulate groundwater flow and heat transport modeling. FEFLOW is an interactive groundwater modeling system for three-dimensional and two-dimensional subsurface water environments, with or without one or multiple free surfaces. FEFLOW can be efficiently used to perform groundwater flow and heat transport simulation of an open-loop geothermal installation.
A simulation of groundwater flow and heat transport was performed based on a constructed model. The model area had a size of 13 km (NS), 12 km (EW), and 400 m (depth). Geological and hydrological data were used as the basis for the numerical simulation model. The distribution of geological layers in the study area was based on 230 borehole data obtained from the Teikoku Construction Consultant Company. There were 31 layers (and 32 slices) in the layer model. The layer configuration was based on actual borehole data so that the thickness of each layer was not constant, as shown in Figure 4. However, in Holocene gravel, the thickness of each layer was set at 1 m because the target aquifer from the open-loop GHP system was applied here. There were 5530 nodes per slice and 10,212 elements per layer.
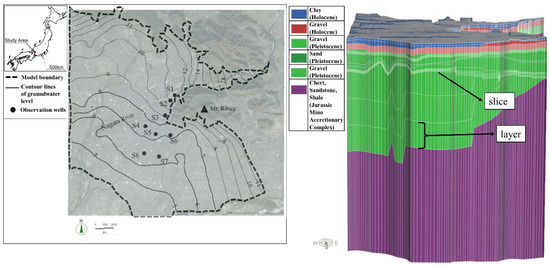
Figure 4.
(Left) Model study area and measured hydraulic head distribution in winter (Gifu city). (Right) 3D geological model.
Groundwater level data were derived from measurements taken at 195 observation wells on 20–21 February 2014, obtained from Gifu city data. SURFER software was used to contour groundwater levels. The contour lines of groundwater levels can be seen in Figure 4. Contour lines were used to define the flow boundary conditions, and each value was set for all slice borders to the bottom of the Pleistocene gravel layer. The pumping-rate boundary conditions were applied in the aquifer (slice 3–28) based on total pumped storage in Gifu city (Figure 5).

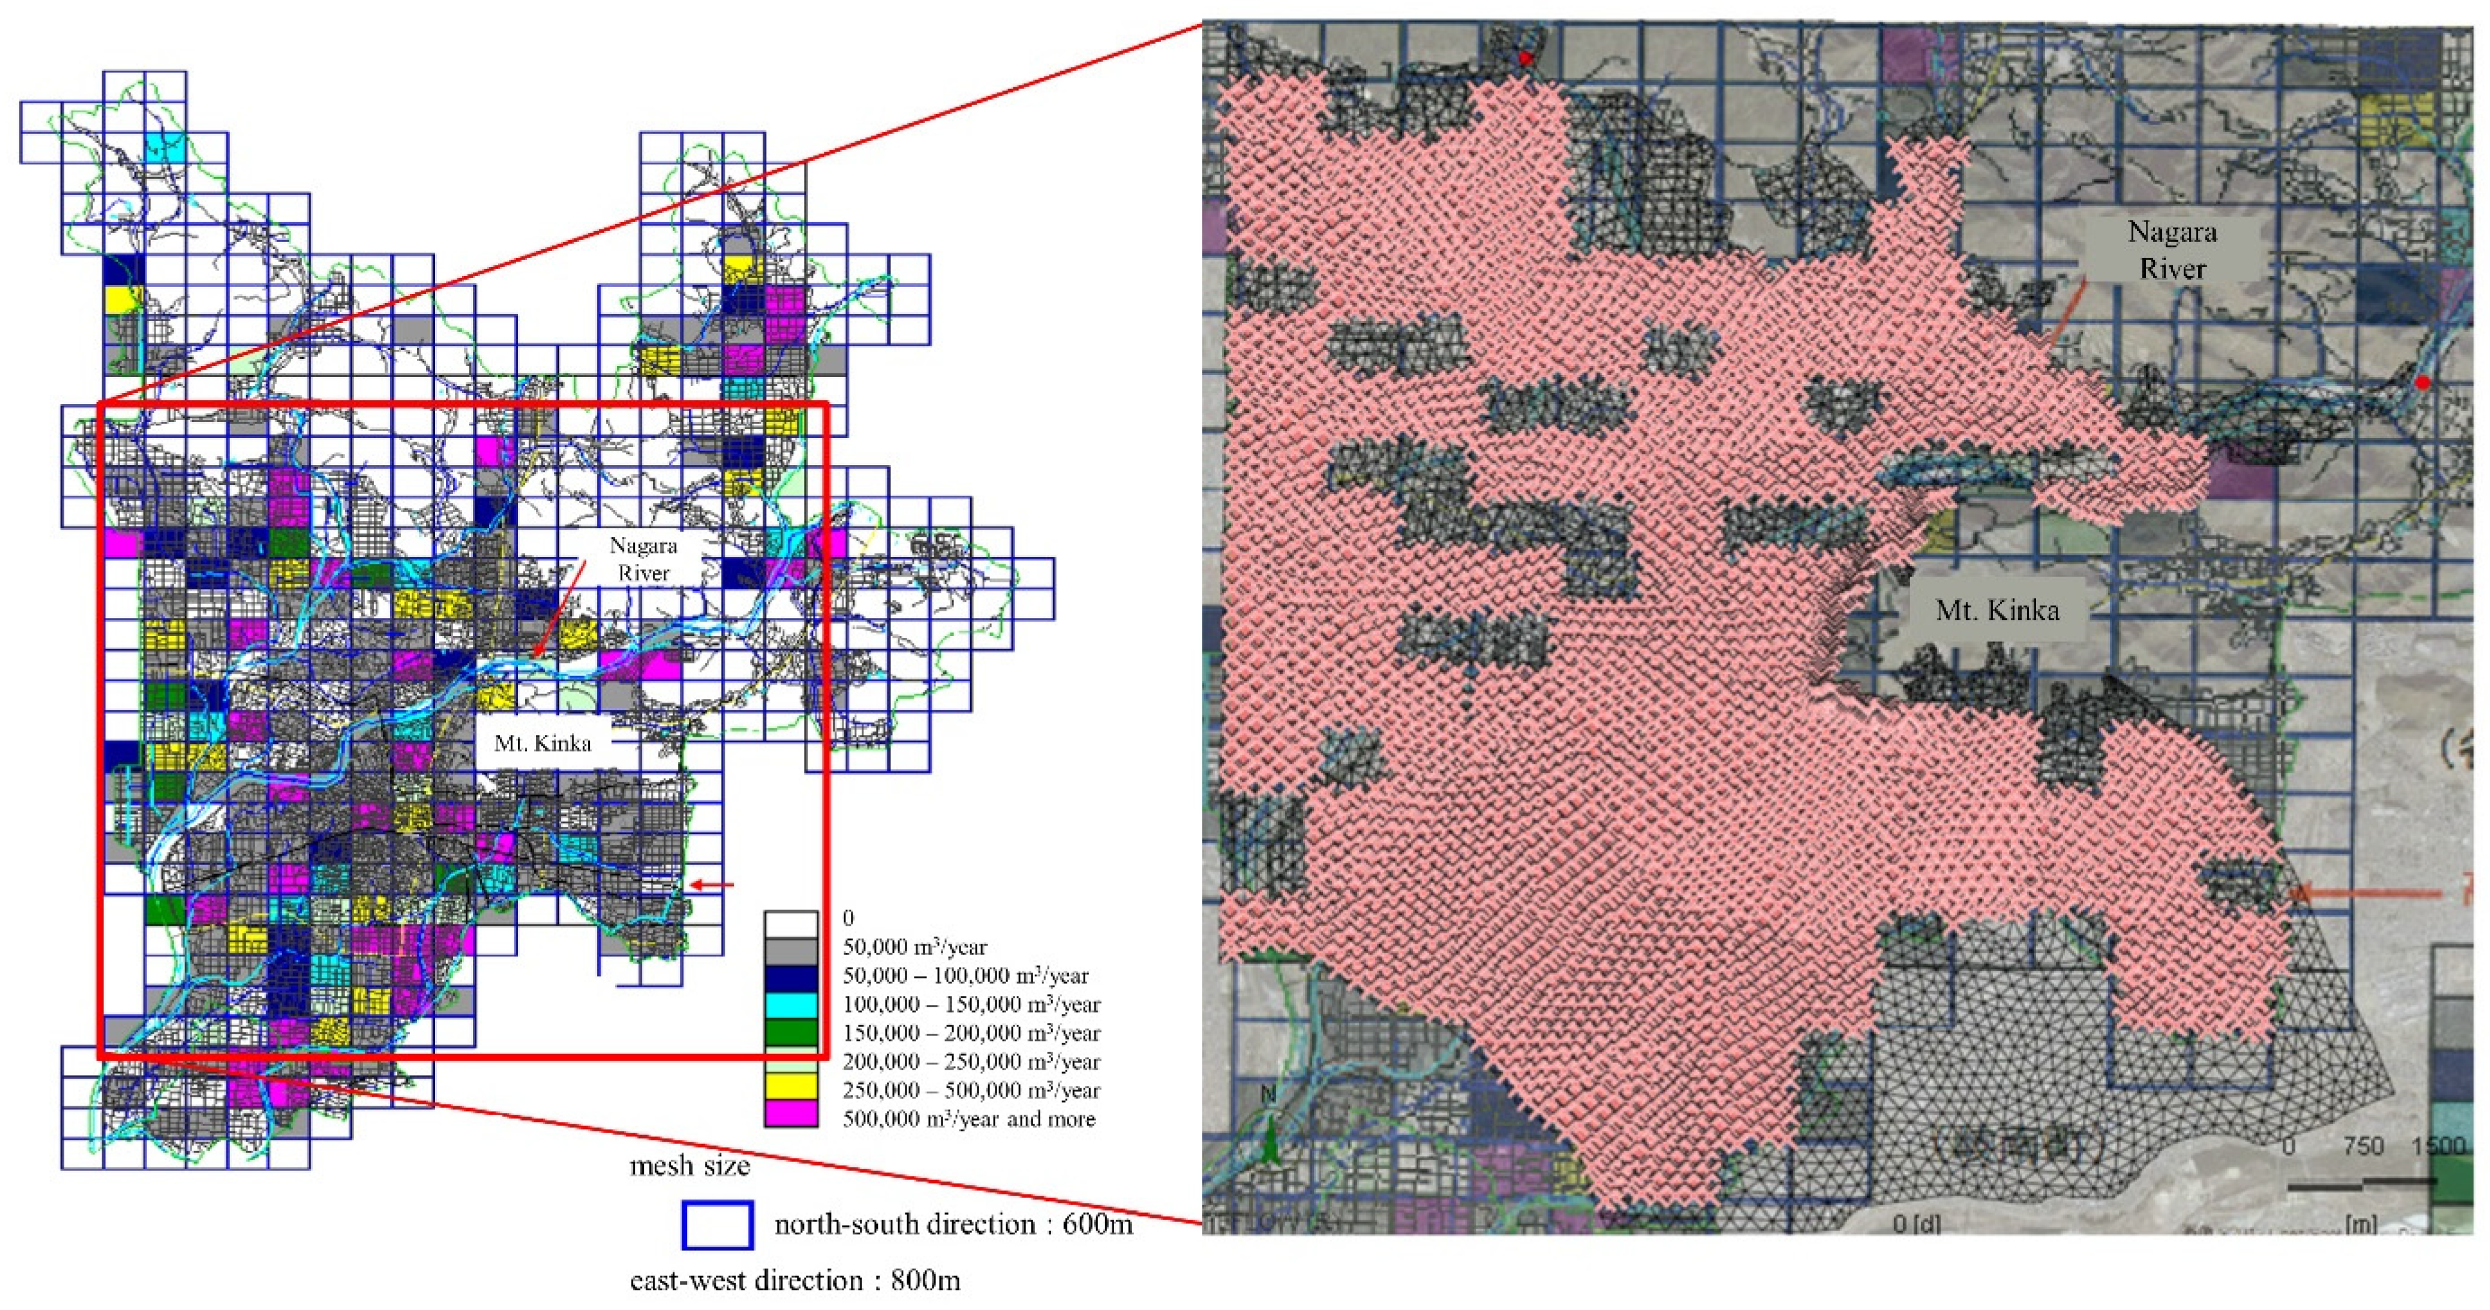
Figure 5.
(Left) Reported pumping rate in each mesh of Gifu City (Adapted from Gifu Prefecture, Gifu City, Teikoku Construction Consultant (2011), Report on feasibility study of geothermal heat pumps, 201p. [14]). (Right) Setting of pumping-rate boundary condition.
The underground and river water temperatures were set as the boundary conditions for heat transport, and constant temperature boundaries were fixed at the top and bottom of the model. The top of the model, which is the ground surface, is affected by ambient temperature, while the bottom of the model is affected by basement rocks. The temperature of the boundary conditions was set constant at 18 °C at the top and bottom of the model. The top of the model considers the thermal effects of land use, such as asphalt and buildings, whereas the bottom model considers the thermal gradient. The temperature change of the Nagara River was fitted to a sine curve for the boundary condition setting of the recharge area. The recharge zone in the alluvial fan of the Nagara River was estimated to be around the upstream section of the Nagara River, as seen in Figure 6. Parameters for flow and heat transport can be seen in Table 1. The values of volumetric heat capacity of fluid (2.52 MJ/m³/K), the volumetric heat capacity of solid (4.2 MJ/m³/K), the thermal conductivity of fluid (0.65 J/m/s/K), and thermal conductivity of solid (3 J/m/s/K) were given in the model layers. These parameters were set in the 3D model according to reference data and the trial-and-error method.
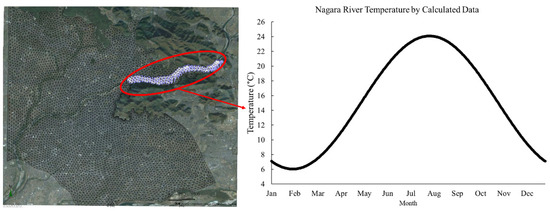
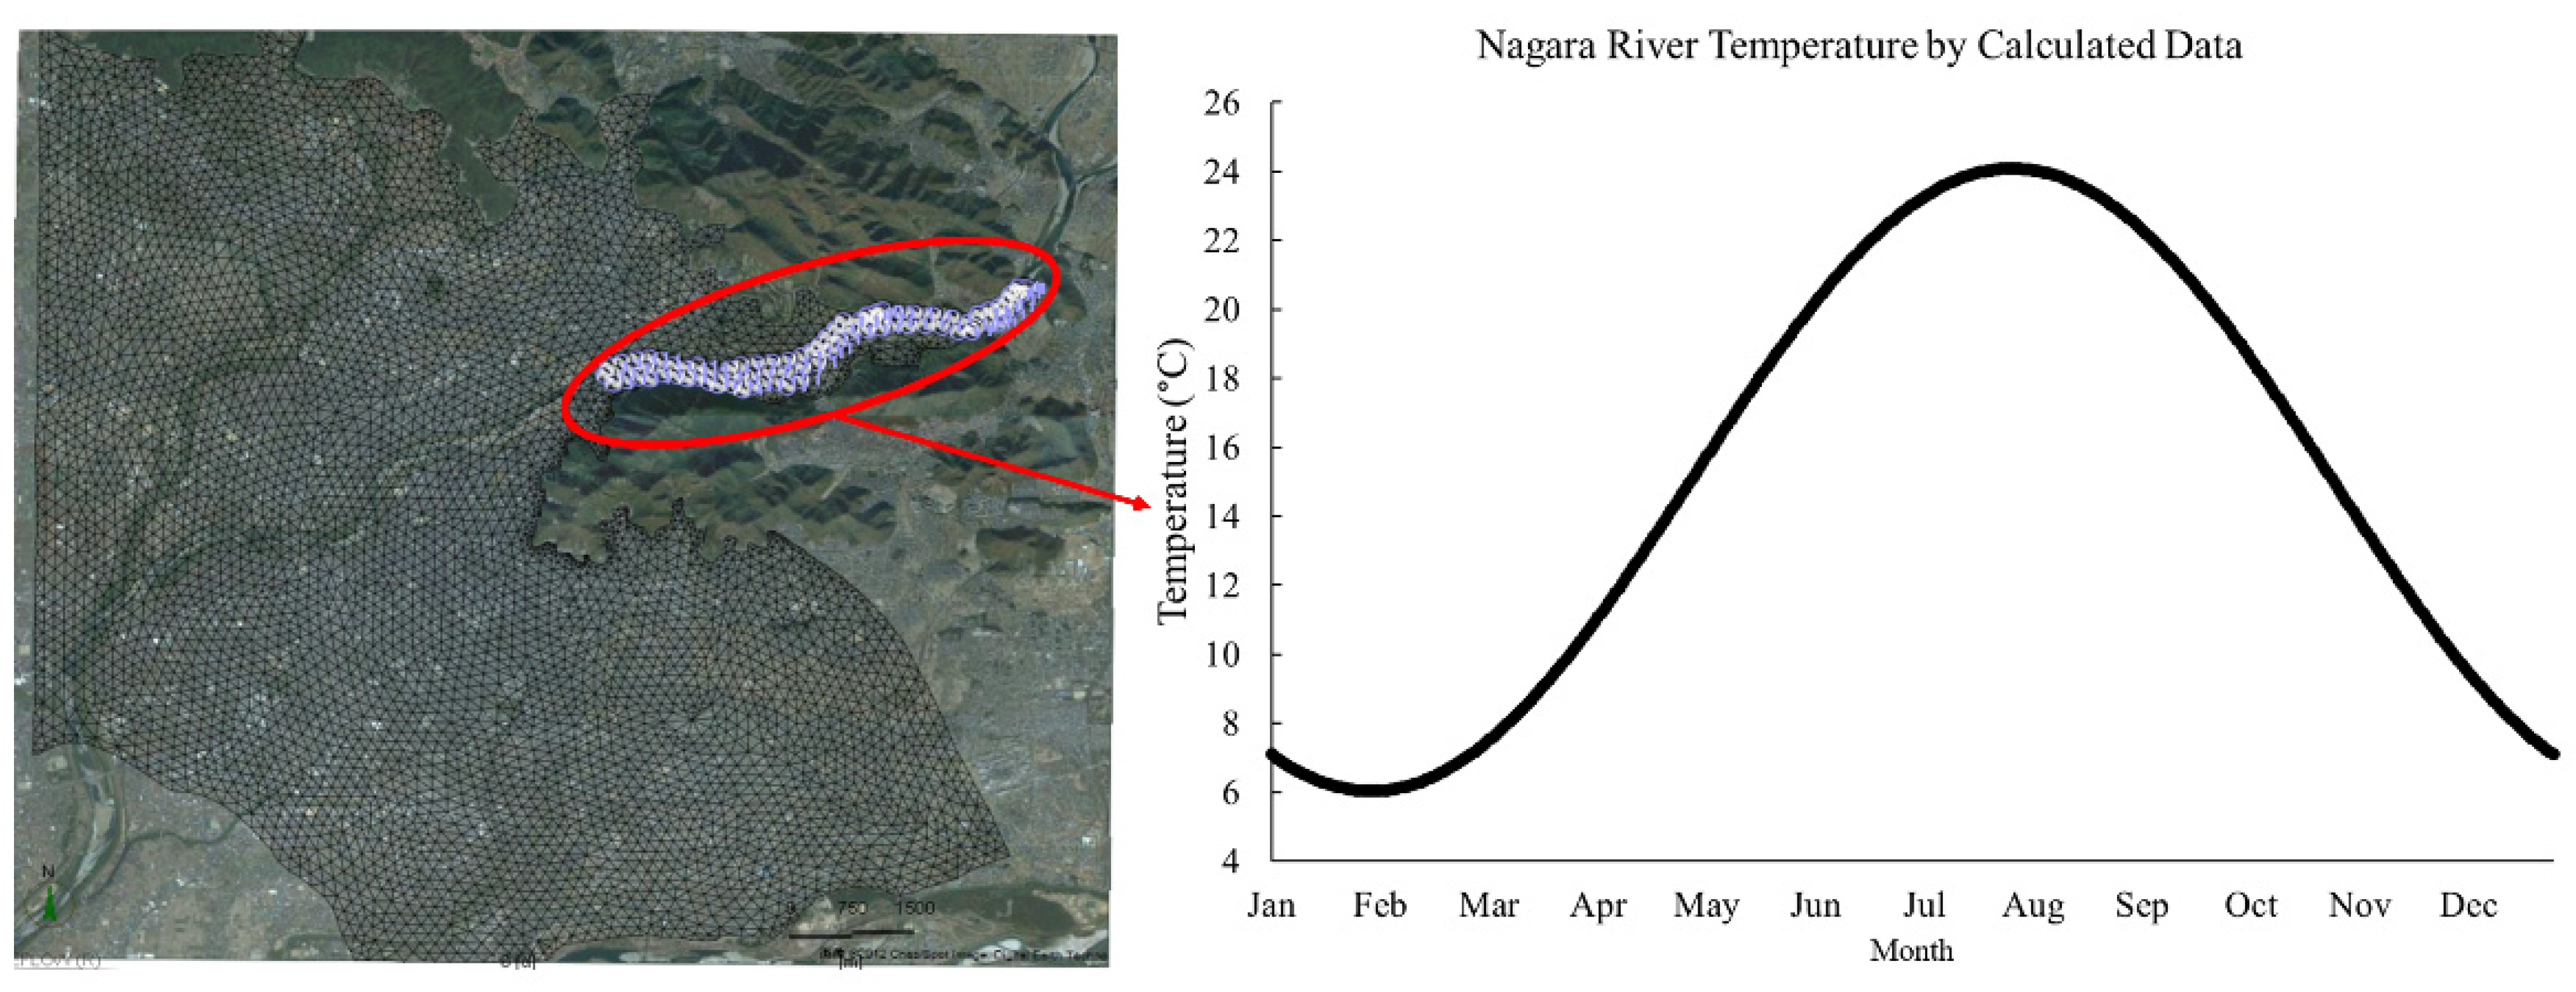
Figure 6.
(Left) The area setting the Temperature Boundary Condition as a recharge zone, (Right) Temperature change of the recharge zone.

Table 1.
Material properties for flow and heat transport.
The simulation results were calibrated against measured hydraulic heads and temperatures in the observation wells. Observation points were added to the model based on the location of the observation wells. For parameters not in agreement with the validation results, they were determined using the trial-and-error method. Calibration is highly required for hydraulic conductivity and dispersivity variables since they have greater degrees of uncertainty. If the validation results agreed, the local simulation model was built using the regional model parameter values.
2.3. Local Simulation Model Settings
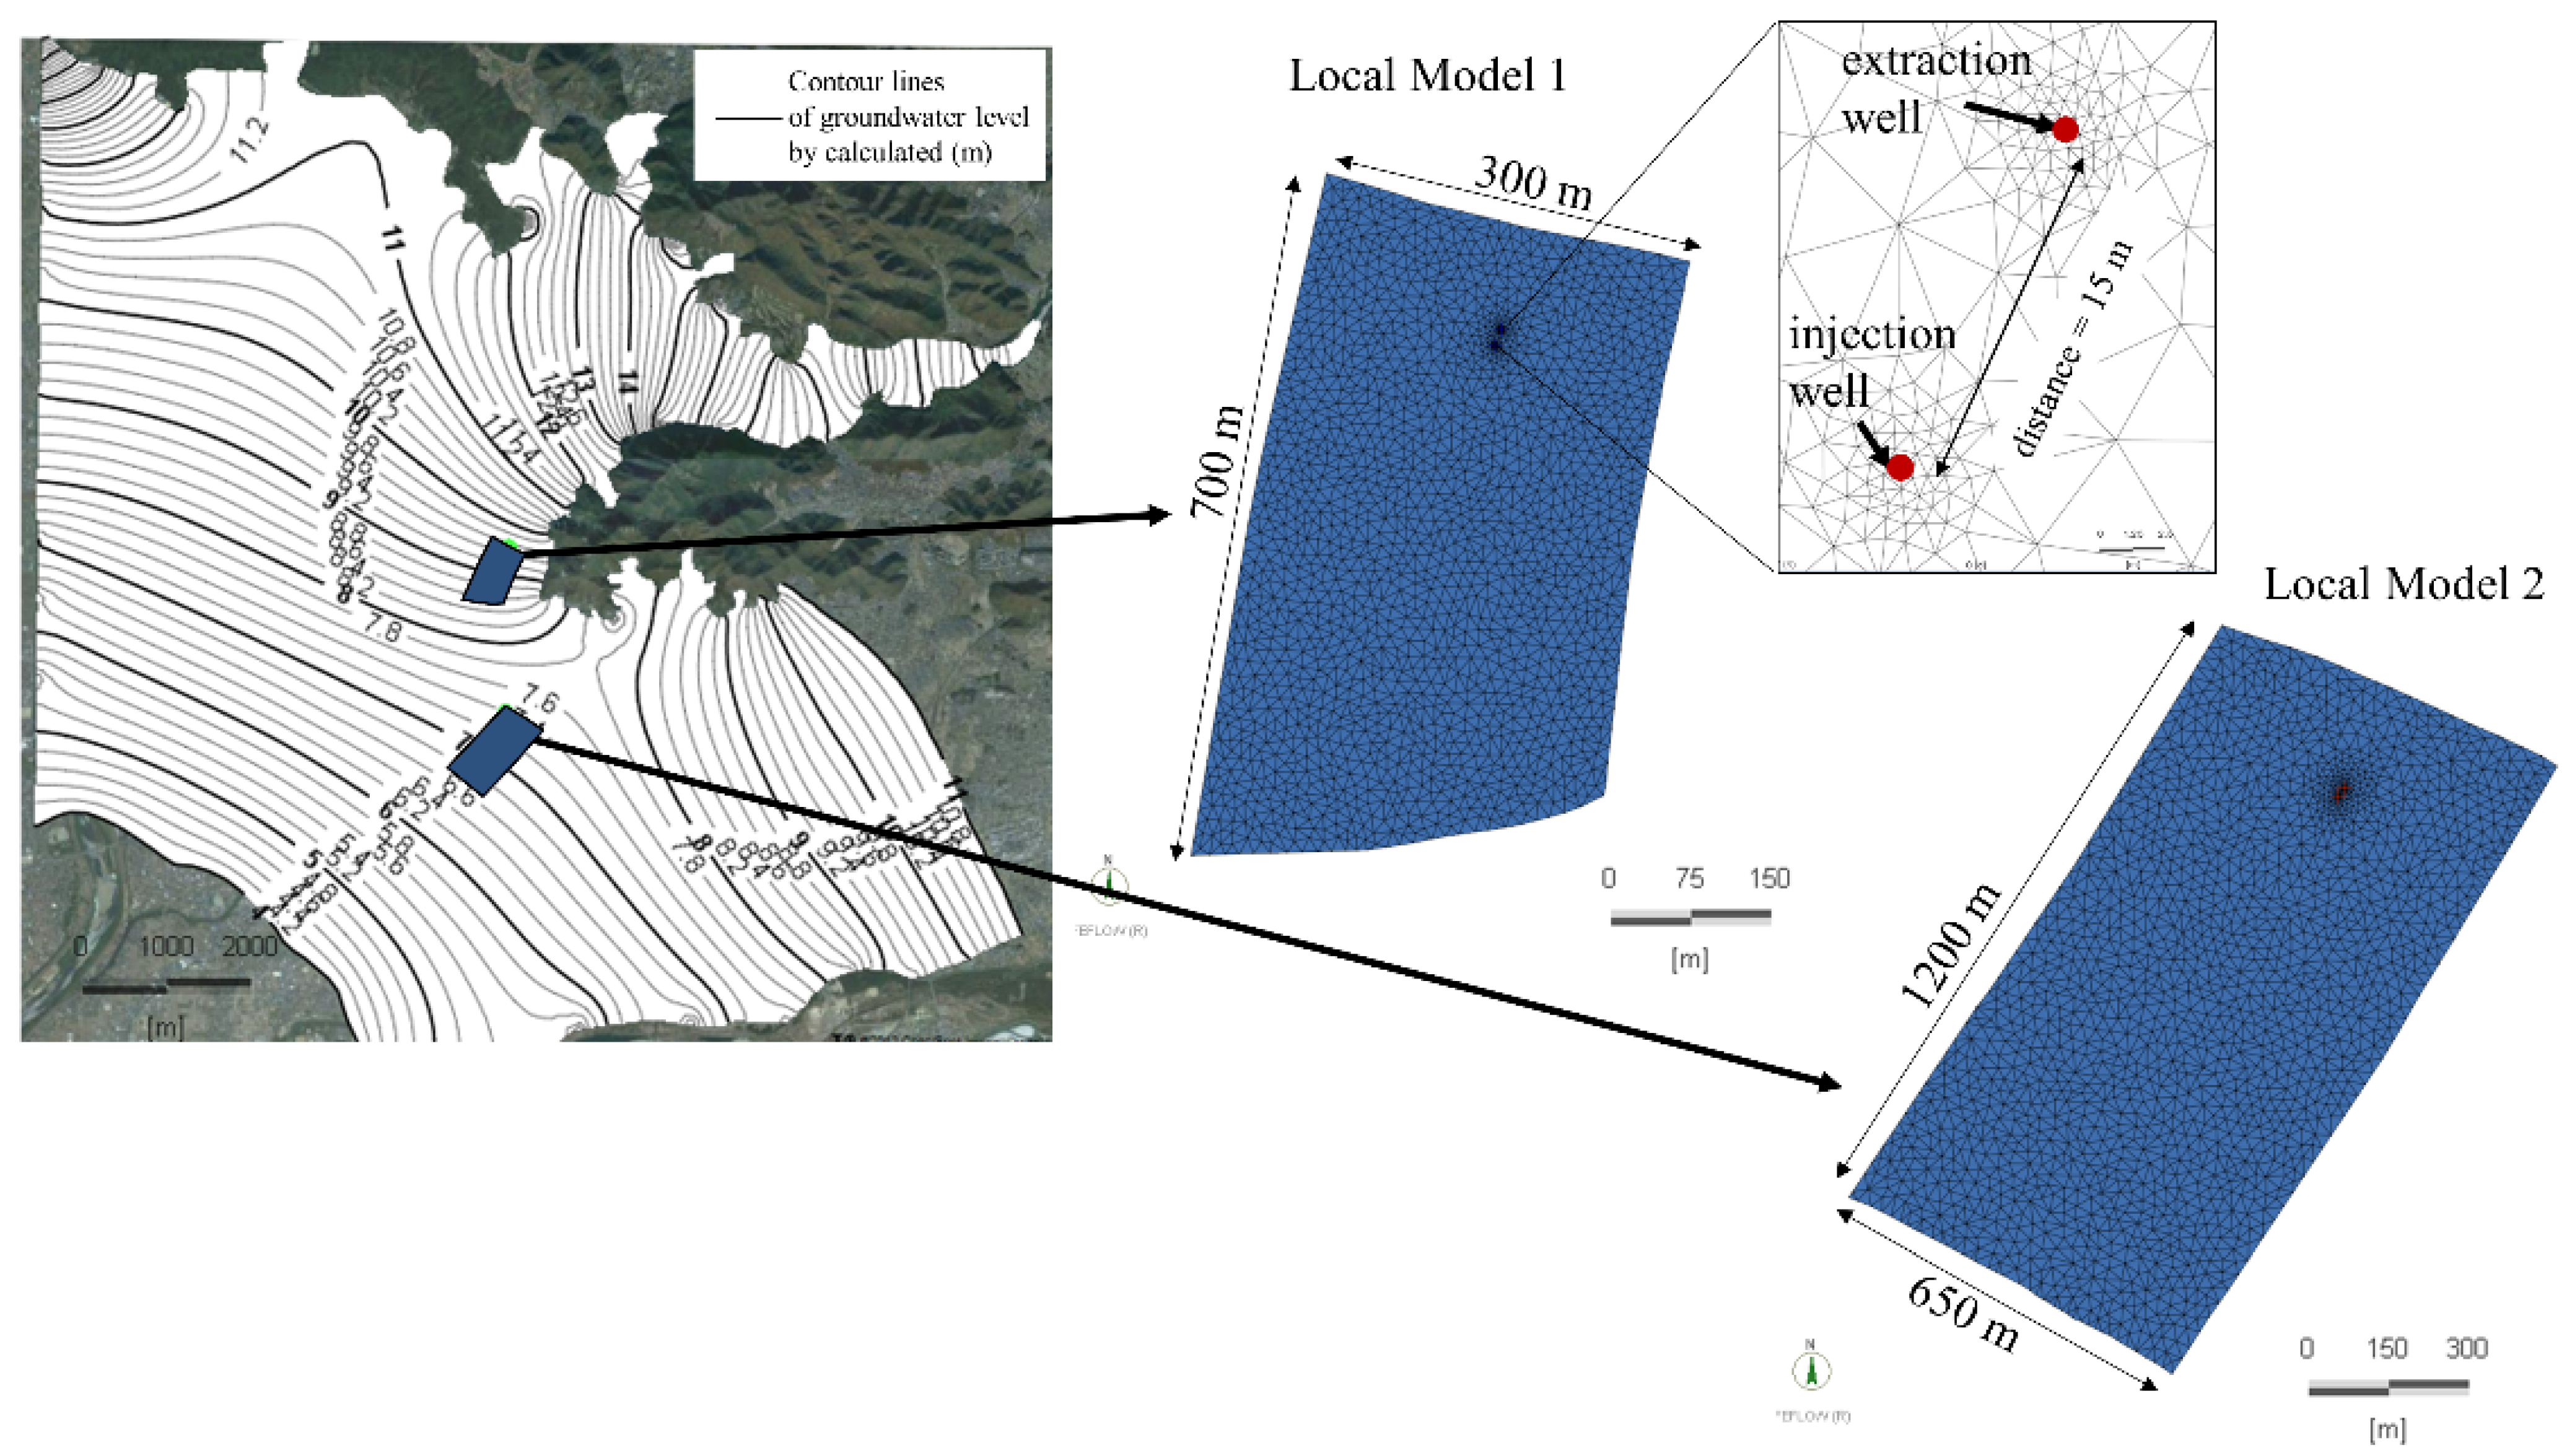
Two local models were constructed based on the 3D regional model (Figure 7). These local model areas were selected based on groundwater flow velocity and the influence of natural temperature changes in the groundwater system. The area of local model 1 had a fast groundwater flow velocity and a natural temperature change in the groundwater system recharged from the Nagara River. The area of local model 2 had a slow groundwater flow velocity and a very small natural temperature change in the groundwater system located on the toe of the alluvial fan of the Nagara River. The local model boundaries were consistent with the contour line of the hydraulic head of the calculated results by the regional simulation model. The material properties for flow and heat transport were consistent with the regional simulation model settings.

Figure 7.
Local simulation models 1 and 2.
The meshes of the local models were refined with finer meshes to calculate the details of groundwater flow and heat transport near the extraction and injection wells. Local model 1 had 300 m (EW), 700 m (NS), and 400 m (depth). There were 1802 nodes per slice (1 node per 8 m length and 1 node per 0.5 m length on the surrounding open-loop GHP system applied). Local model 2 had 650 m (NW-SE), 1200 m (NE-SW), and 400 m (depth). There were 1831 nodes per slice (1 node per 15 m length and 1 node per 0.5 m length on the surrounding open-loop GHP system applied). The local simulation results were validated against the regional simulation results to confirm whether the settings were correct. After agreement, the open-loop GHP system was implemented in the local models.
The thermal impact of the open-loop system was calculated using the two local models. The open-loop system consisted of one extraction and one injection well separated by 15 m, with the extraction well located upstream. The wells were screened in the Holocene and Pleistocene gravel layers from 3–15. The operation mode was applied for heating from January to March and cooling from July to September. The simulation was performed for ten years. The water temperatures were returned to the injection well with three variant values: 0, 5, and 10 °C higher and lower than the groundwater temperature for the cooling and heating periods of the open-loop GHP system, respectively. The flow rates of pumping and injecting were 0 m3/s (non-active), 3.33 × 10⁻³ m3/s, 6.67 × 10⁻³ m3/s, 1.67 × 10⁻² m3/s, and 3.33 × 10⁻² m3/s.
3. Results
3.1. Regional Simulation
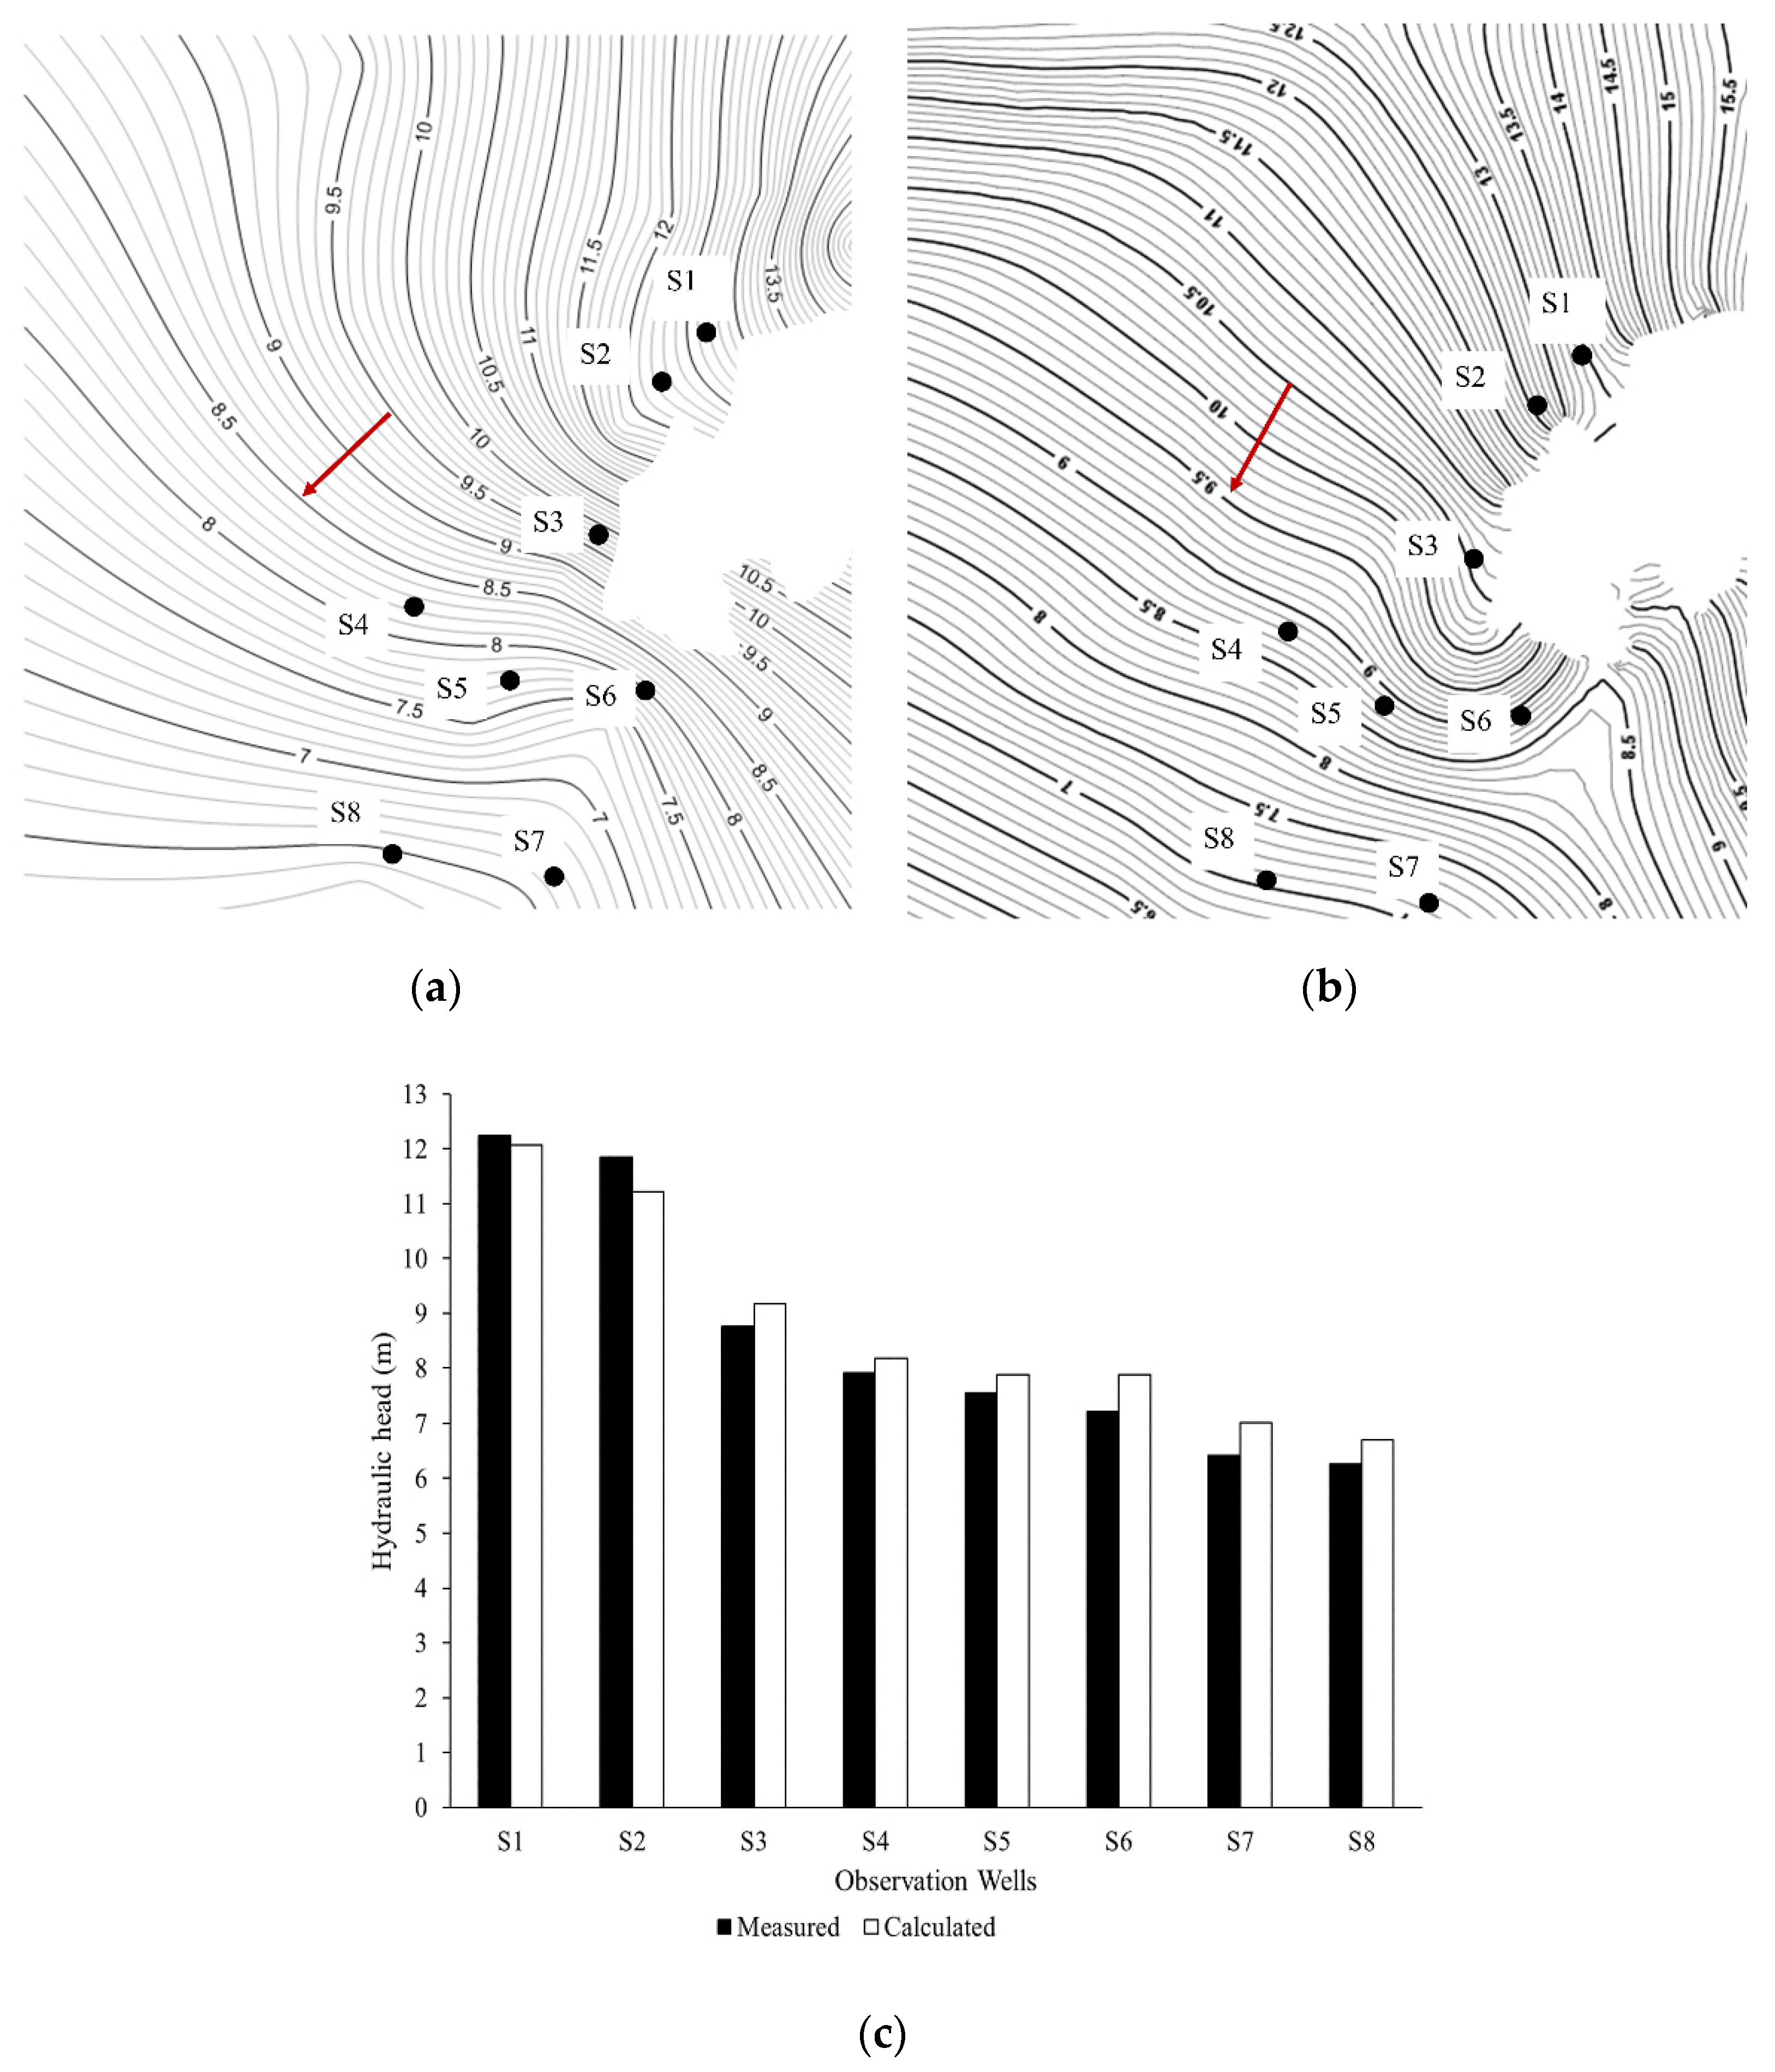
In the regional simulation, we compared hydraulic head and groundwater temperatures between the calculated results and the measured data from the study by Ohtani et al. [10]. Figure 8 shows that the calculated hydraulic heads are relatively close to the measured ones. However, a little discrepancy was noted at each observation point due to slightly different hydraulic head gradient directions between calculated and measured data, as shown in Figure 8a,b. The calculated hydraulic heads were lower than the measured ones in S1 and S2, and higher than the others.

Figure 8.
(a) Distribution of hydraulic head in the Nagara River alluvial fan by measured data from (Ohtani et al. [10]), (b) Distribution of hydraulic head in the Nagara River alluvial fan by simulation results, (c) Comparison of the hydraulic head between the calculated and measured data.
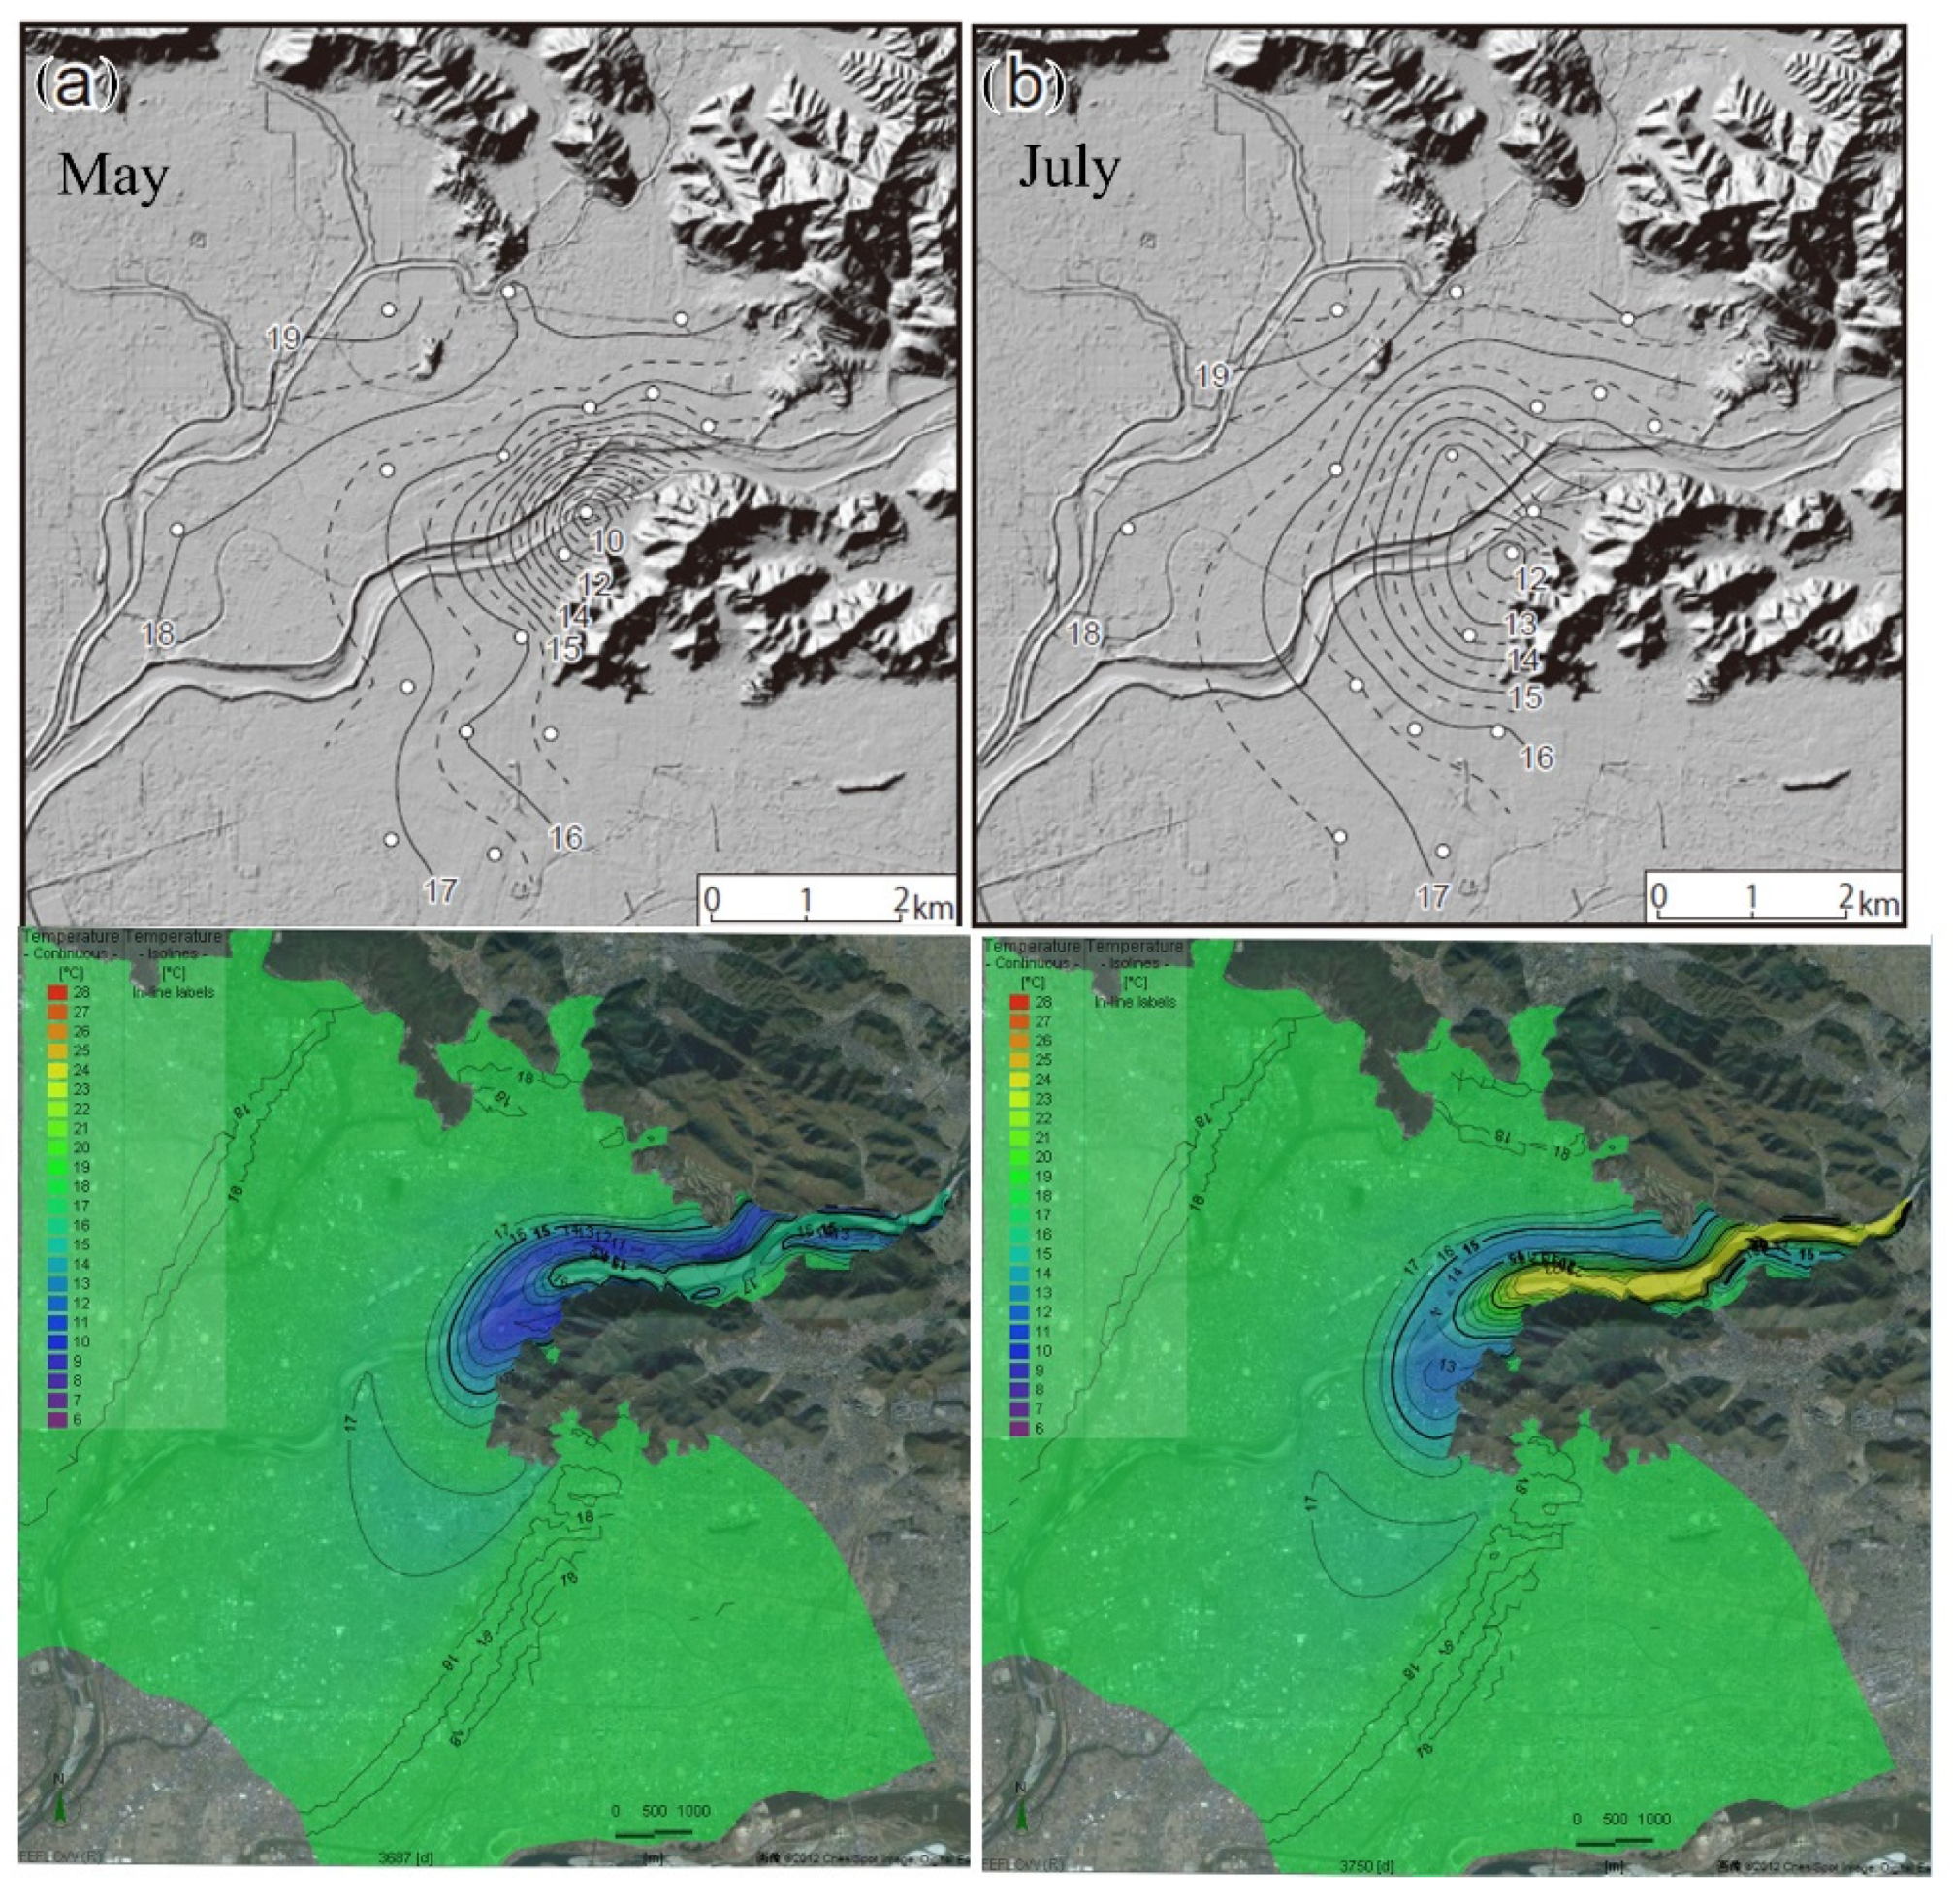
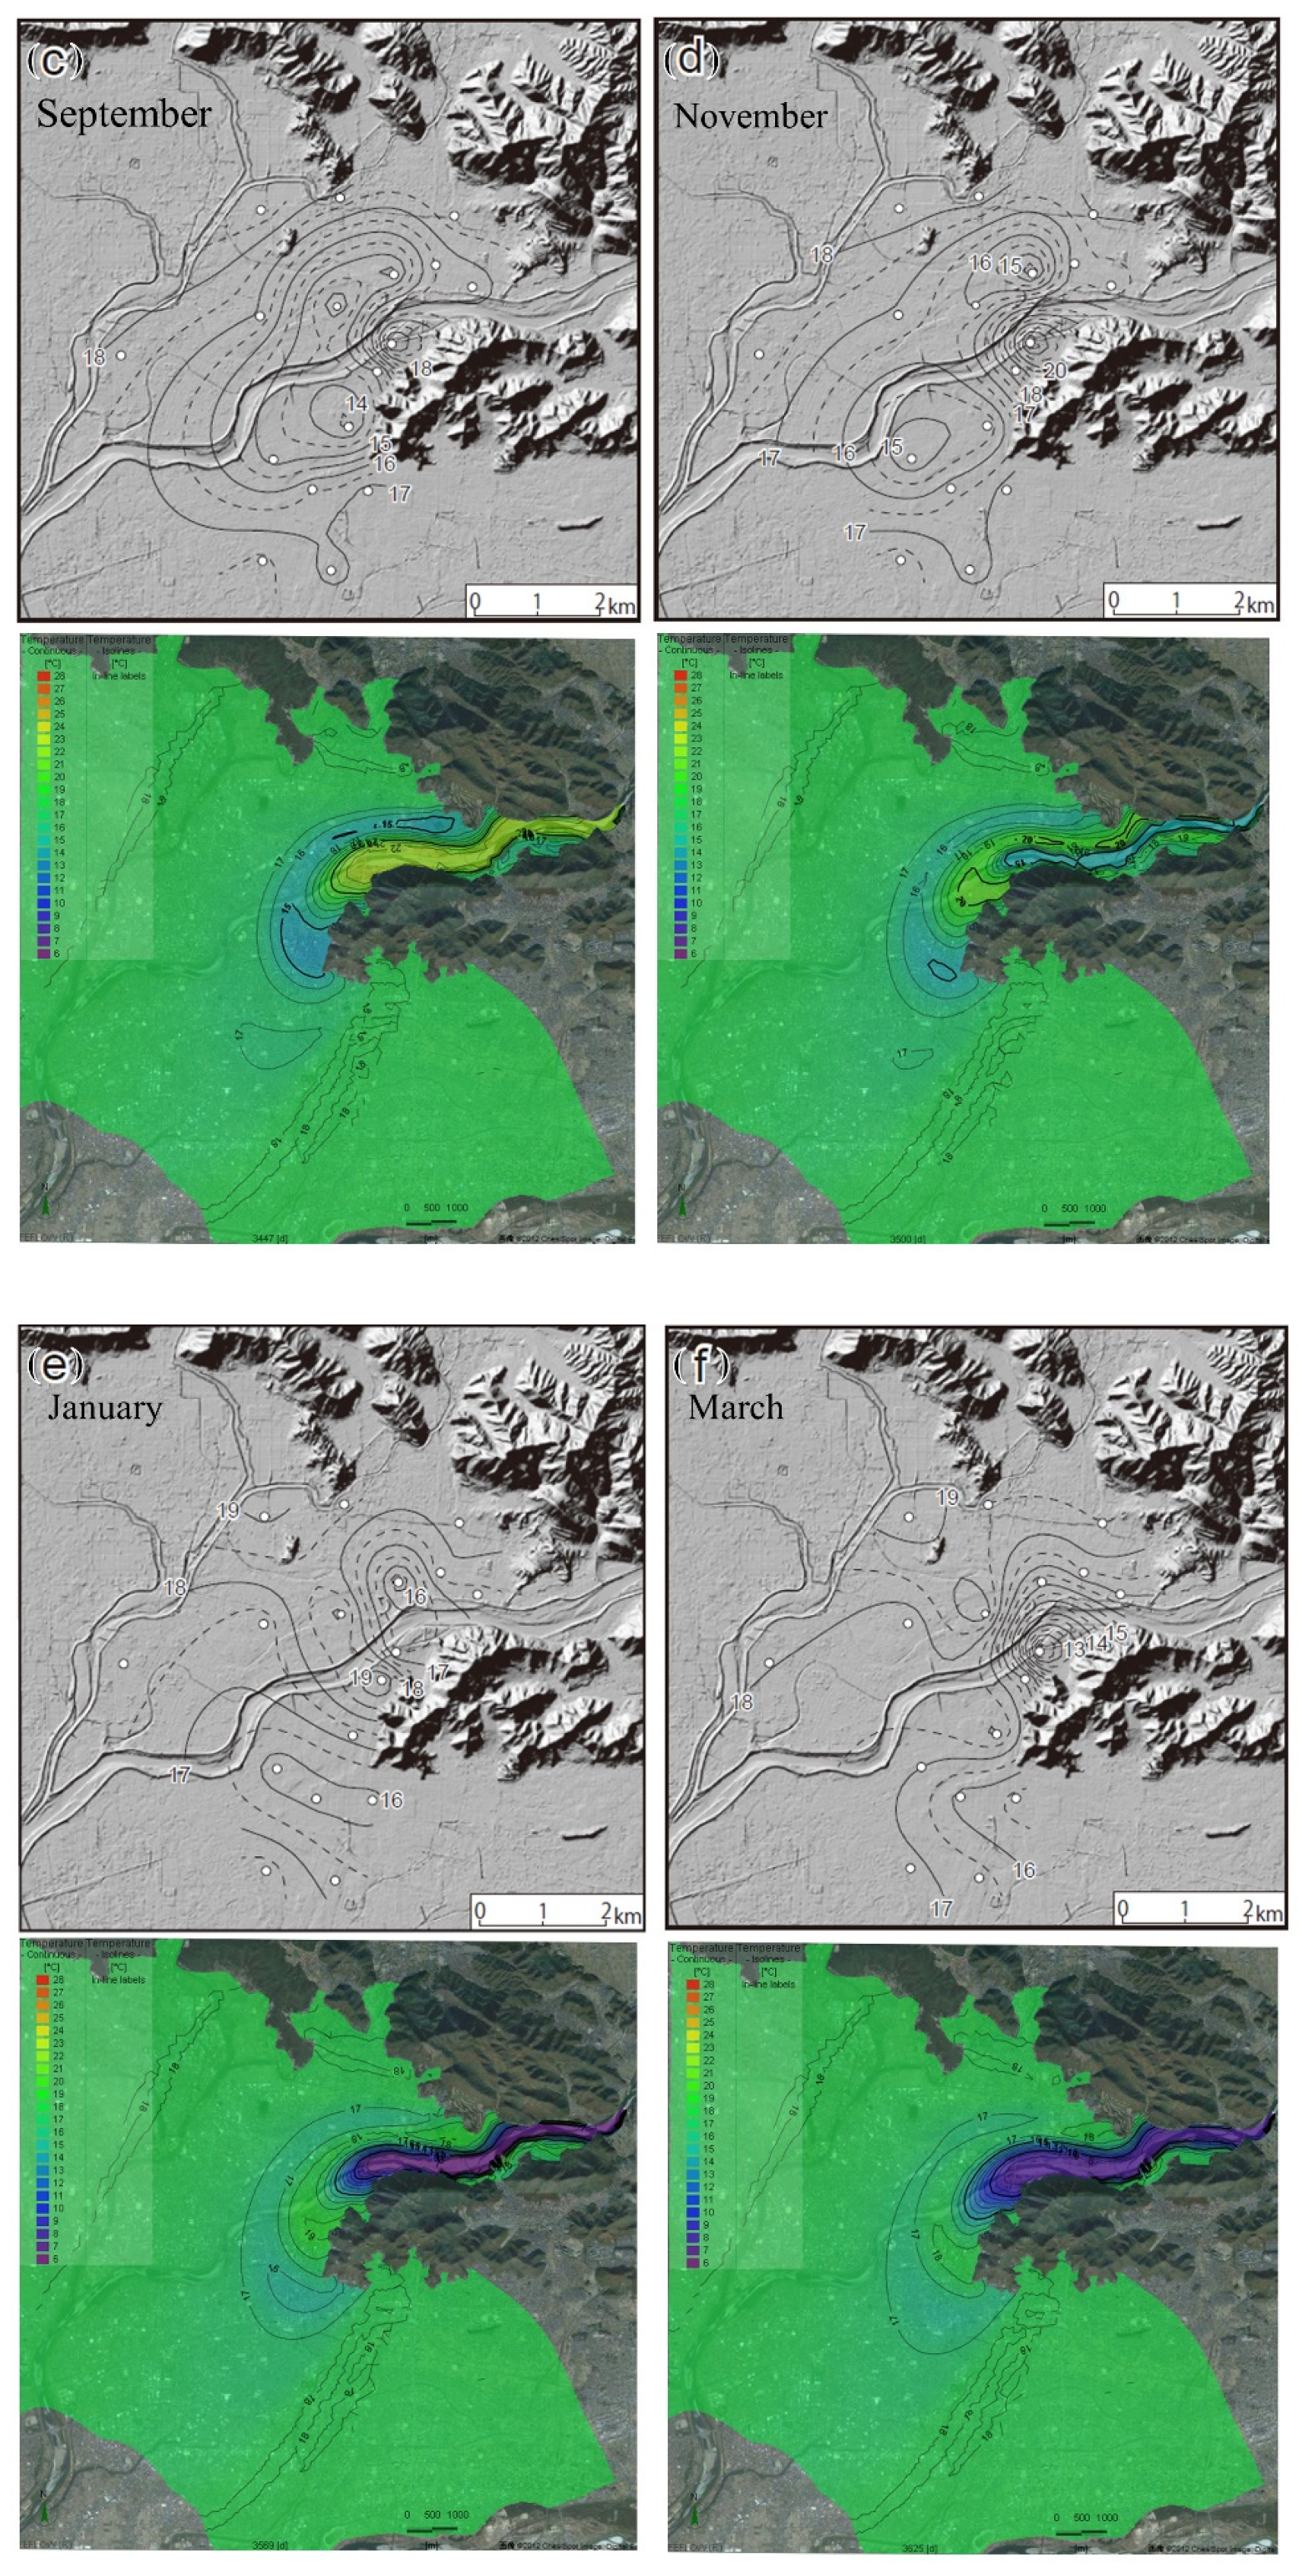
Figure 9 depicts the groundwater temperature distribution in the Holocene gravel layer. The upper part is the measured data (black and white), and the lower part is the calculated results by simulation (colorful). The groundwater temperature distribution of the measured data was obtained from 18 observation wells in the study by Ohtani et al. [10]. There are many similarities in the contour line of groundwater temperature between the measured and calculated results from every two months. This can be seen clearly by the similarities around Mount Kinka and confirmed by groundwater flow to the south of the alluvial fan. In May, the groundwater temperature around Mount Kinka is cooler than its surroundings. Groundwater temperature rises during the summer (July and September) and falls during the winter (November, January, and March). The phenomenon of lateral groundwater flow from the apex to the toe of the alluvial fan can be described well with regional simulation results toward the south of each month’s difference. However, it was discovered that there were discrepancies between the measured and calculated results in western areas. This difference may have been due to the limited number of observation wells in the measurement data.
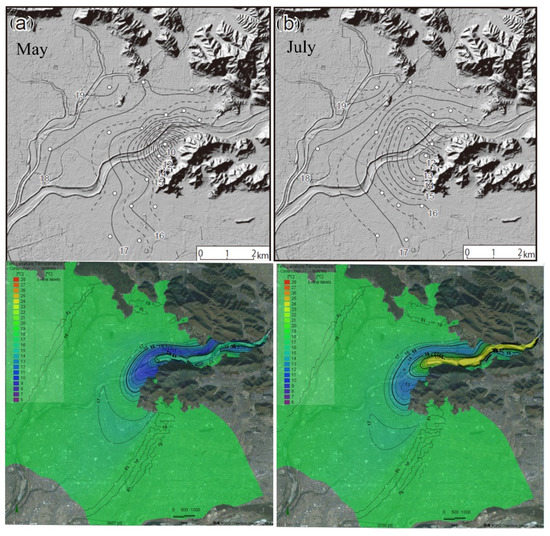
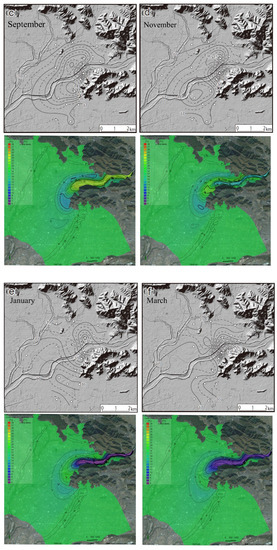
Figure 9.
Groundwater temperature results by measured (gray) and calculated (color) data for (a) May, (b) July, (c) September, (d) November, (e) January, and (f) March.
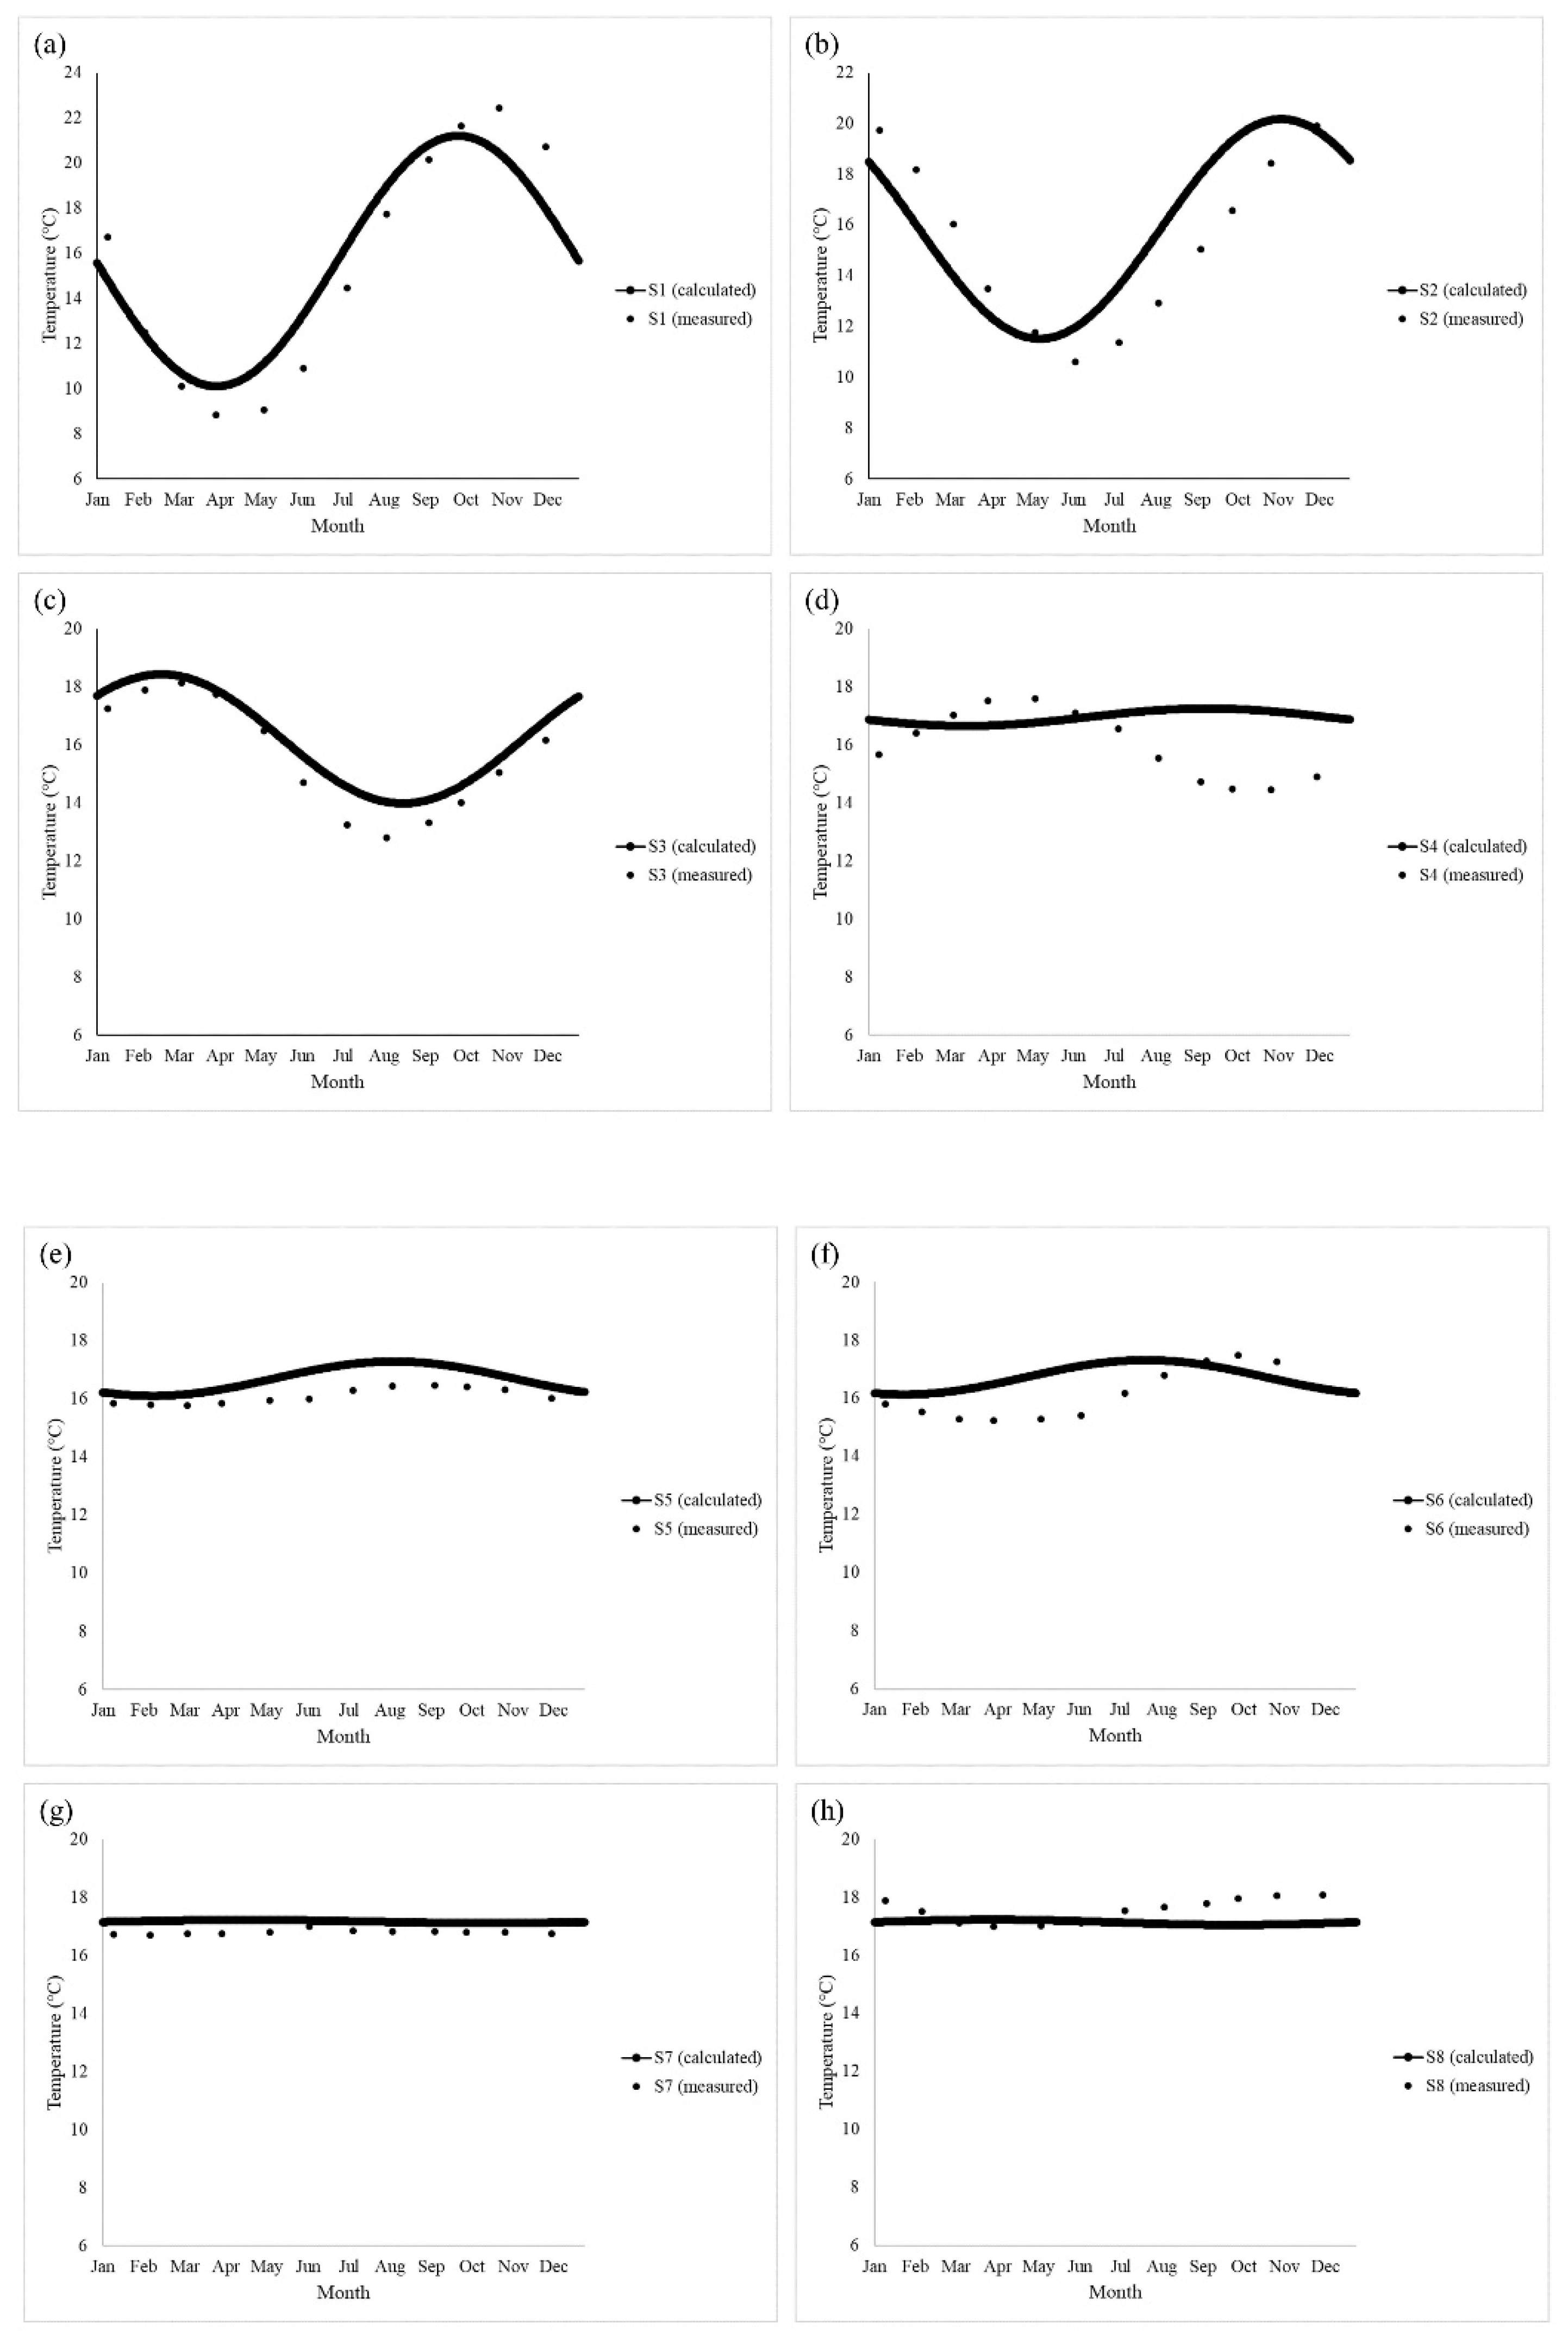
Figure 10 shows a comparison of the annual groundwater temperature changes in the 8 observation wells between calculated and measured results in the Holocene gravel layer. As seen in Figure 10a–h, the calculated (smooth line) data are almost consistent with the measured (dot) data. However, there are noticeable differences between the measured and calculated data on wells S4 (Figure 10d) and S6 (Figure 10f). We suspect this difference arose due to the slight difference in the hydraulic head gradient found earlier, thus changing groundwater flow. From Figure 9, the direction of groundwater flow in the measured results is almost to the west, while the calculated results are almost to the southwest. This change influenced groundwater temperature in wells 4 and 6, which were only slightly affected by natural groundwater changes from the recharge area and lateral flow.
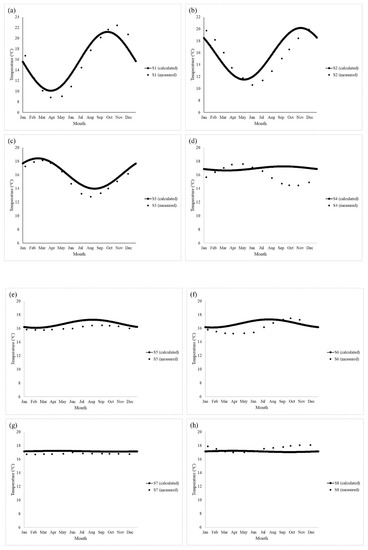
Figure 10.
Comparison of the annual groundwater temperature change between the calculated and measured values on the Holocene gravel layer.
The details of the phase difference, maximum and minimum groundwater temperatures, and average groundwater temperature are shown in Figure 11. The term “phase difference of groundwater temperature change” in a well refers to the time difference in temperature between the same positions as the wave temperature change cycles in groundwater in a well and river water. Observation points at wells 4, 6, 7, and 8 were non-linear from the graphs. Observation wells 4 and 6 were different because they were slightly affected by the natural change in the recharge area and the slightly different lateral flow directions. The observation wells 7 and 8 were non-linear because they had a constant groundwater temperature, so it was almost difficult to find the phase difference. The effect of different natural temperature changes at several observation points can also be seen from the graph of the max-min groundwater temperature change, where it is found that the measured data value is higher than the calculated one. In the graph of the average groundwater temperature, the natural temperature change of groundwater makes the average groundwater temperature value from the measured results lower than the calculated data. However, in general, the regional simulation has well-represented groundwater flow and heat transport, which are influenced by natural change and lateral groundwater flow in the alluvial fan of the Nagara River area.
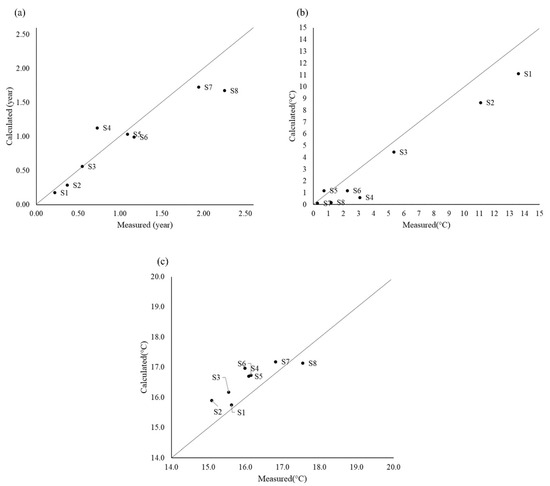
Figure 11.
Phase difference (a), maximum-minimum (b), and average groundwater temperature (c) between measured and calculated.
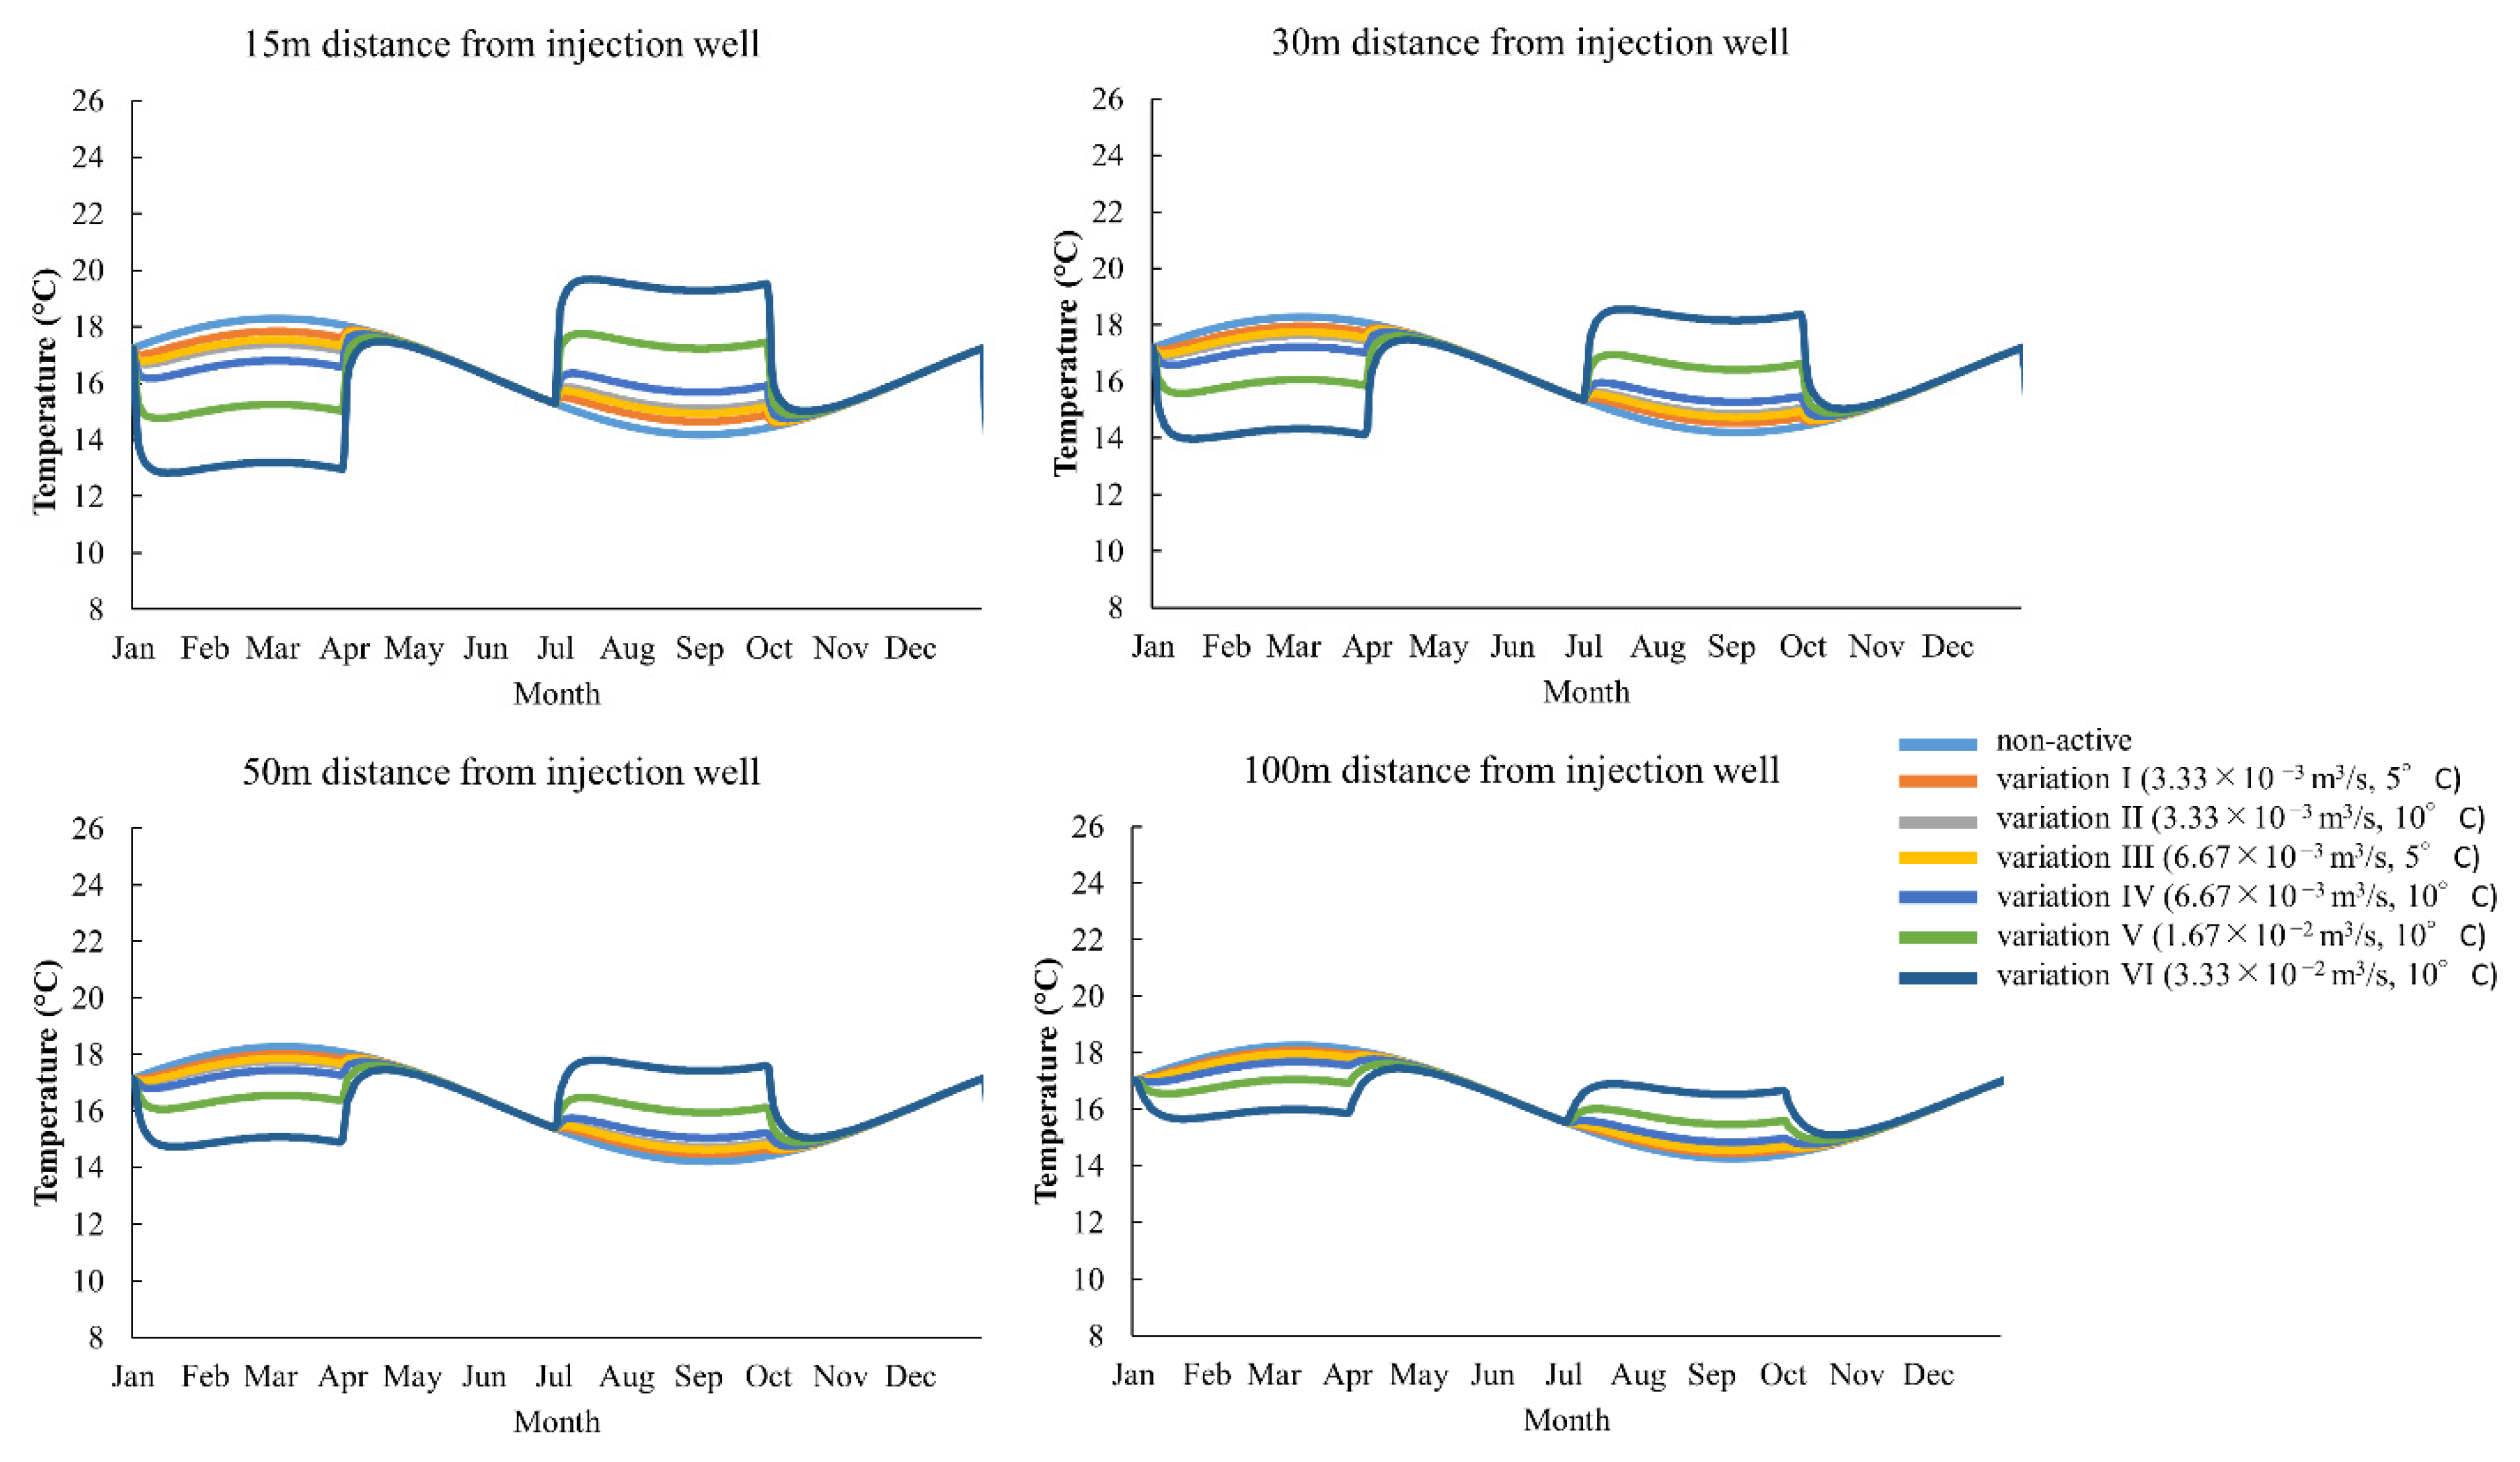
3.2. Local Simulation and Open-Loop Operation
The results of local simulations on 2 different models for thermal changes caused by heating and cooling operations are shown in Figure 12 and Figure 13. To examine the thermal environmental impact on the downstream area, we varied the pumping rate and injection temperatures. As shown in Figure 12, the ‘non-active’ indicates an inactive open-loop operation (0 m3/s, 0 °C), while the variation I (3.33 × 10⁻³ m3/s, 5 °C) shows a pumping rate of 3.33 × 10⁻³ m3/s with a temperature difference of 5 °C, and so does the other variation. Figure 12 and Figure 13 depict groundwater temperature changes due to open-loop GHP use in the downstream region at distances of 15, 30, 50, and 100 m from the injection well, with these variations.
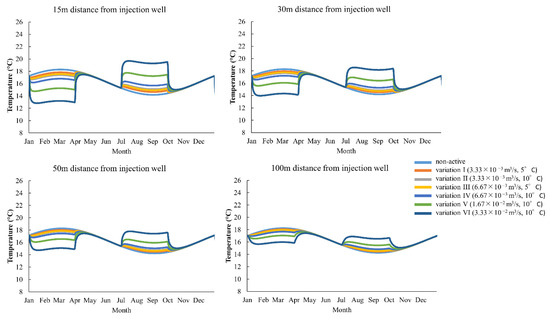
Figure 12.
Thermal changes in local model 1 by open-loop GHP used in the downstream region at distances of 15, 30, 50, and 100 m from the injection well, with a variation of pumping rate and water injected temperature.
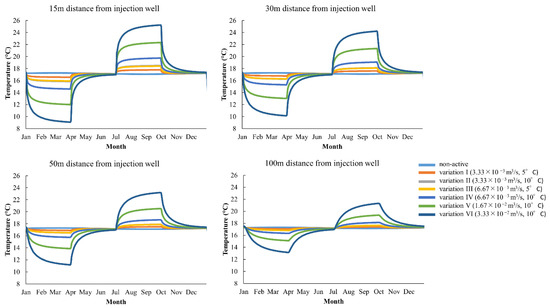
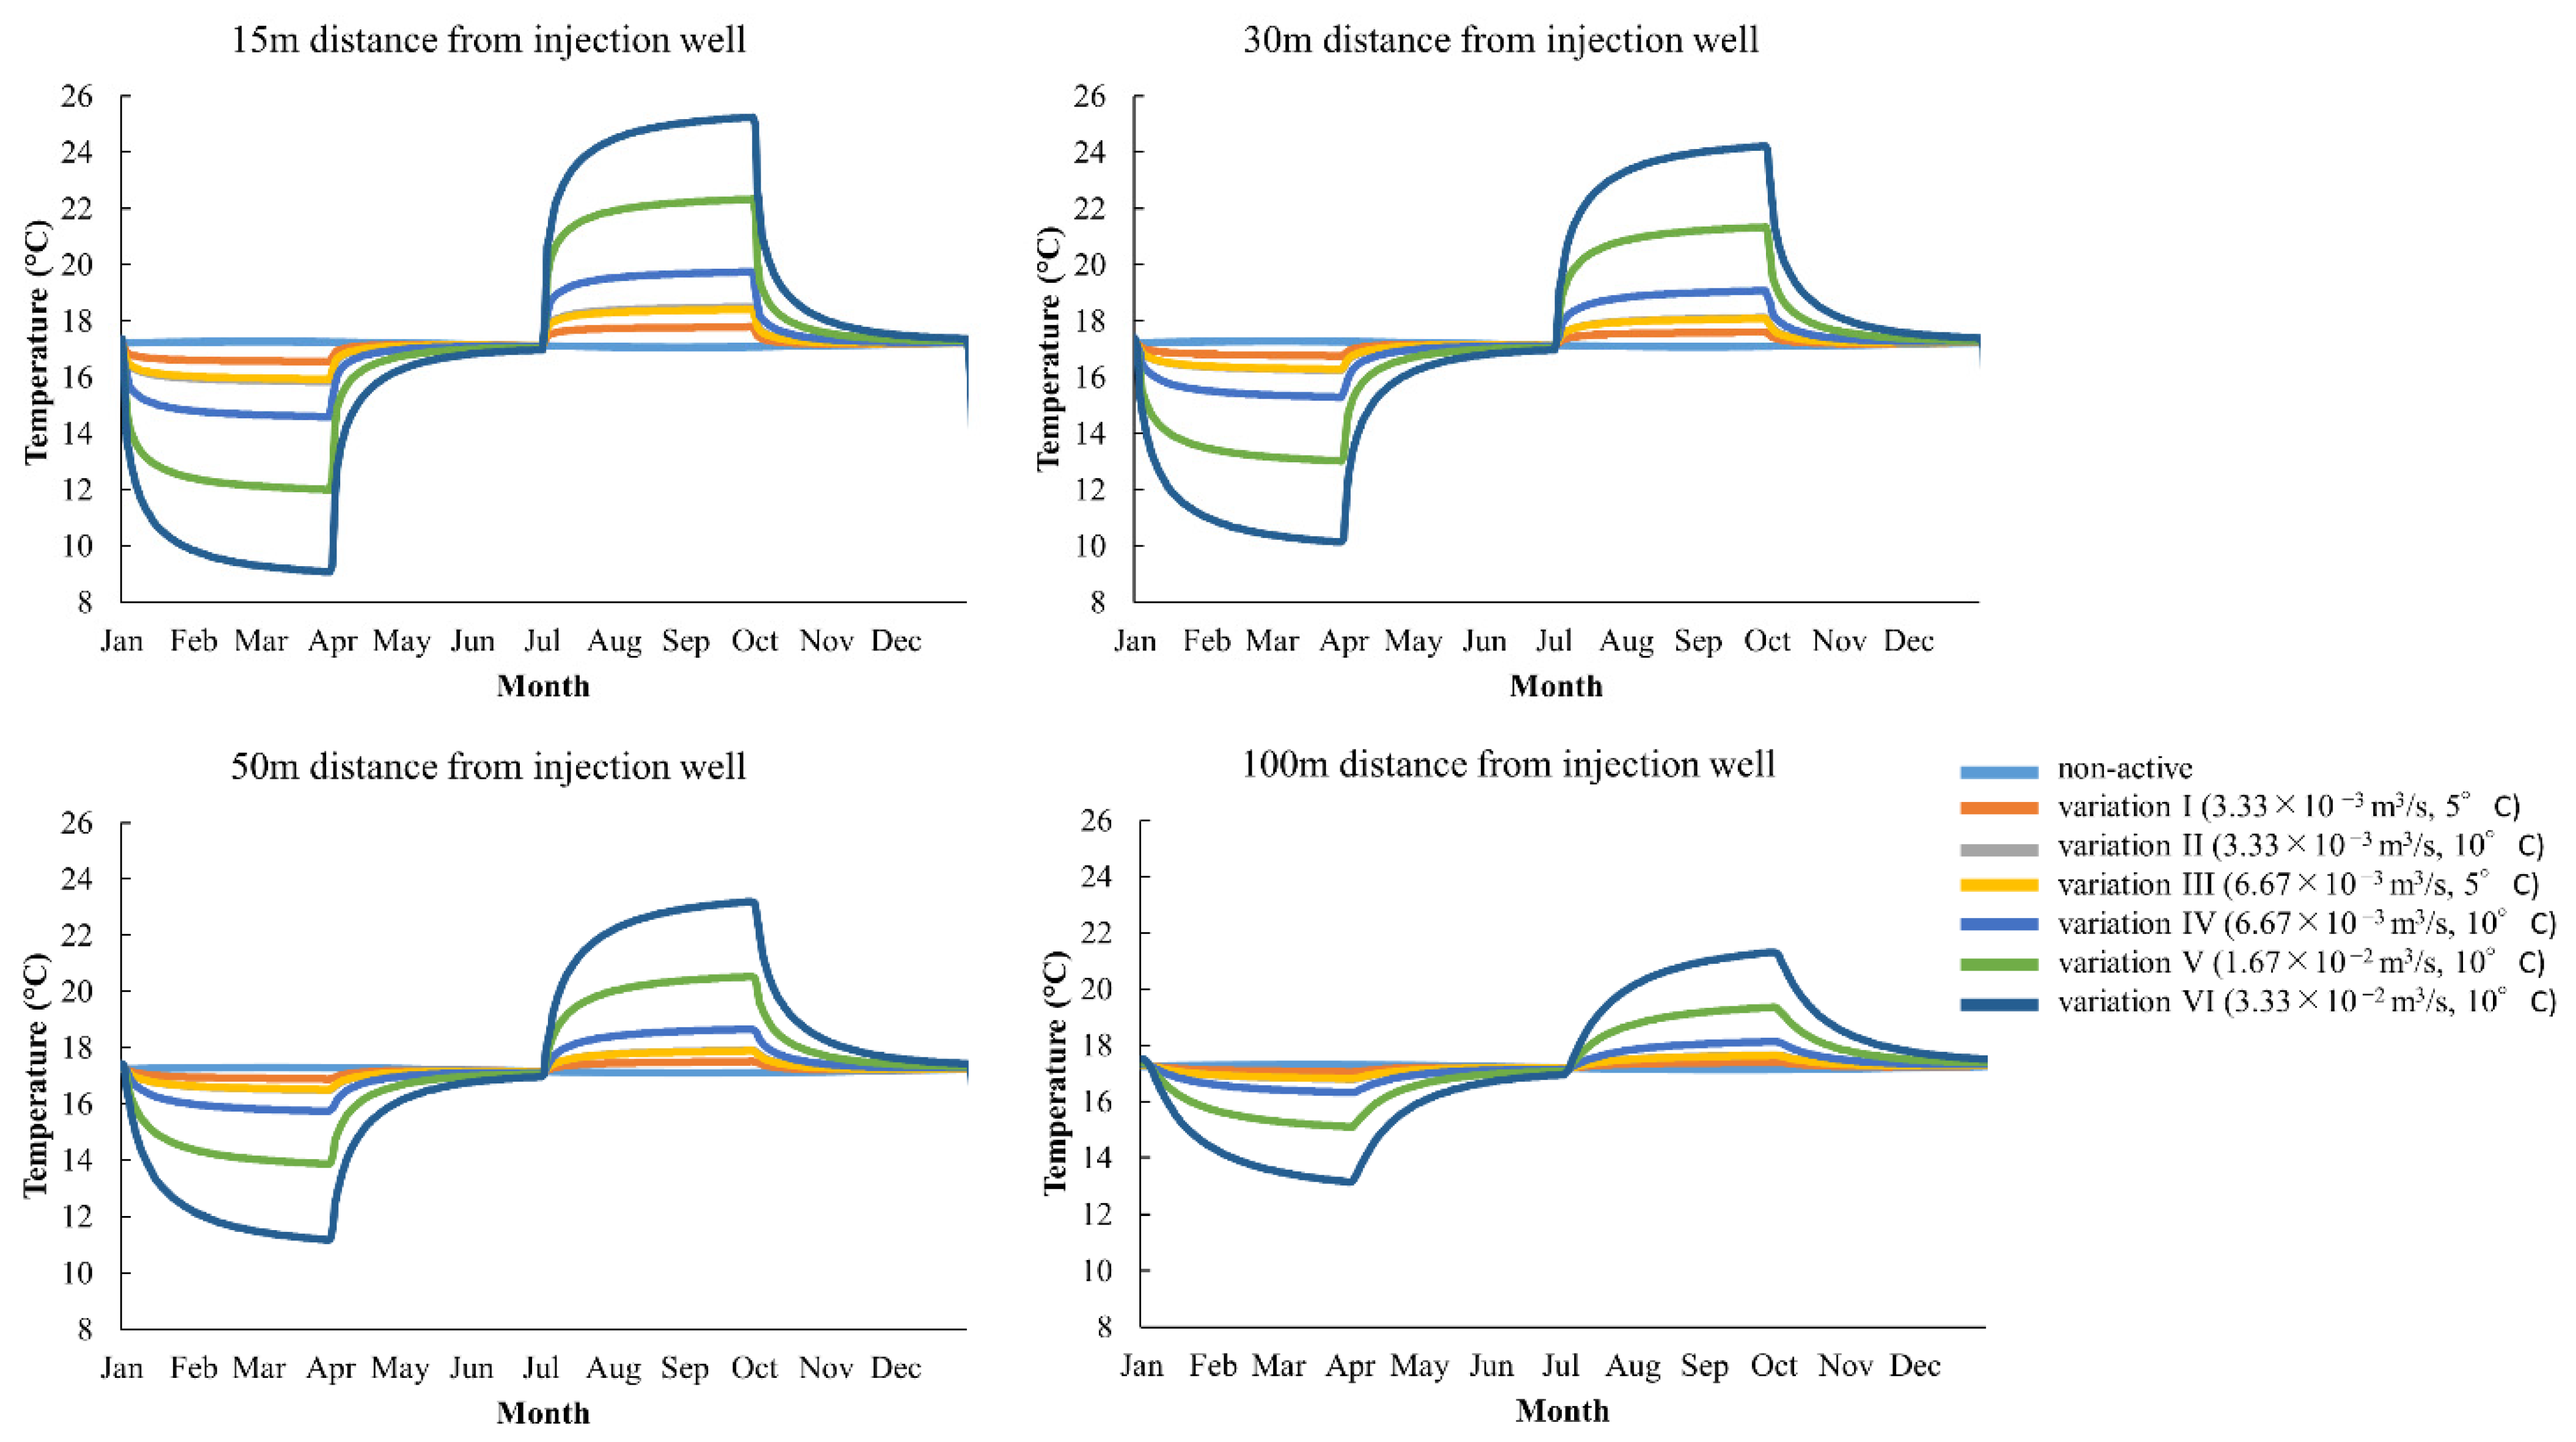
Figure 13.
Thermal changes in local model 2 by open-loop GHP used in the downstream region at distances of 15, 30, 50, and 100 m from the injection well, with a variation of pumping rate and water injected temperature.
Overall, the thermal change decreased with the increased distance from the injection well. The largest temperature change in groundwater in local model 1 was 5 °C relative to non-active temperature using the highest variation, variation VI (3.33 × 10⁻² m3/s, 10 °C) at a 15 m distance from the injection well, whereas it was 7 °C in the local model 2. These results show that local model 1 has a lower temperature change than local model 2 at the same distance from the injection well. In local model 1, a slight slope of groundwater temperature change was found in the heating and cooling periods. This was caused by the effect of the natural temperature change of groundwater, where groundwater temperature was lower in summer and higher in winter. Therefore, the thermal change in local model 1 decreased slightly. As for model 2, thermal change continued to increase until the end of the period due to the small influence of natural changes in the groundwater. We also found differences after heating and cooling at the end of March and September, respectively. Local model 1 had a good ability to recover quickly compared to local model 2. Local model 2 requires a slightly slower time to the undisturbed groundwater temperature.
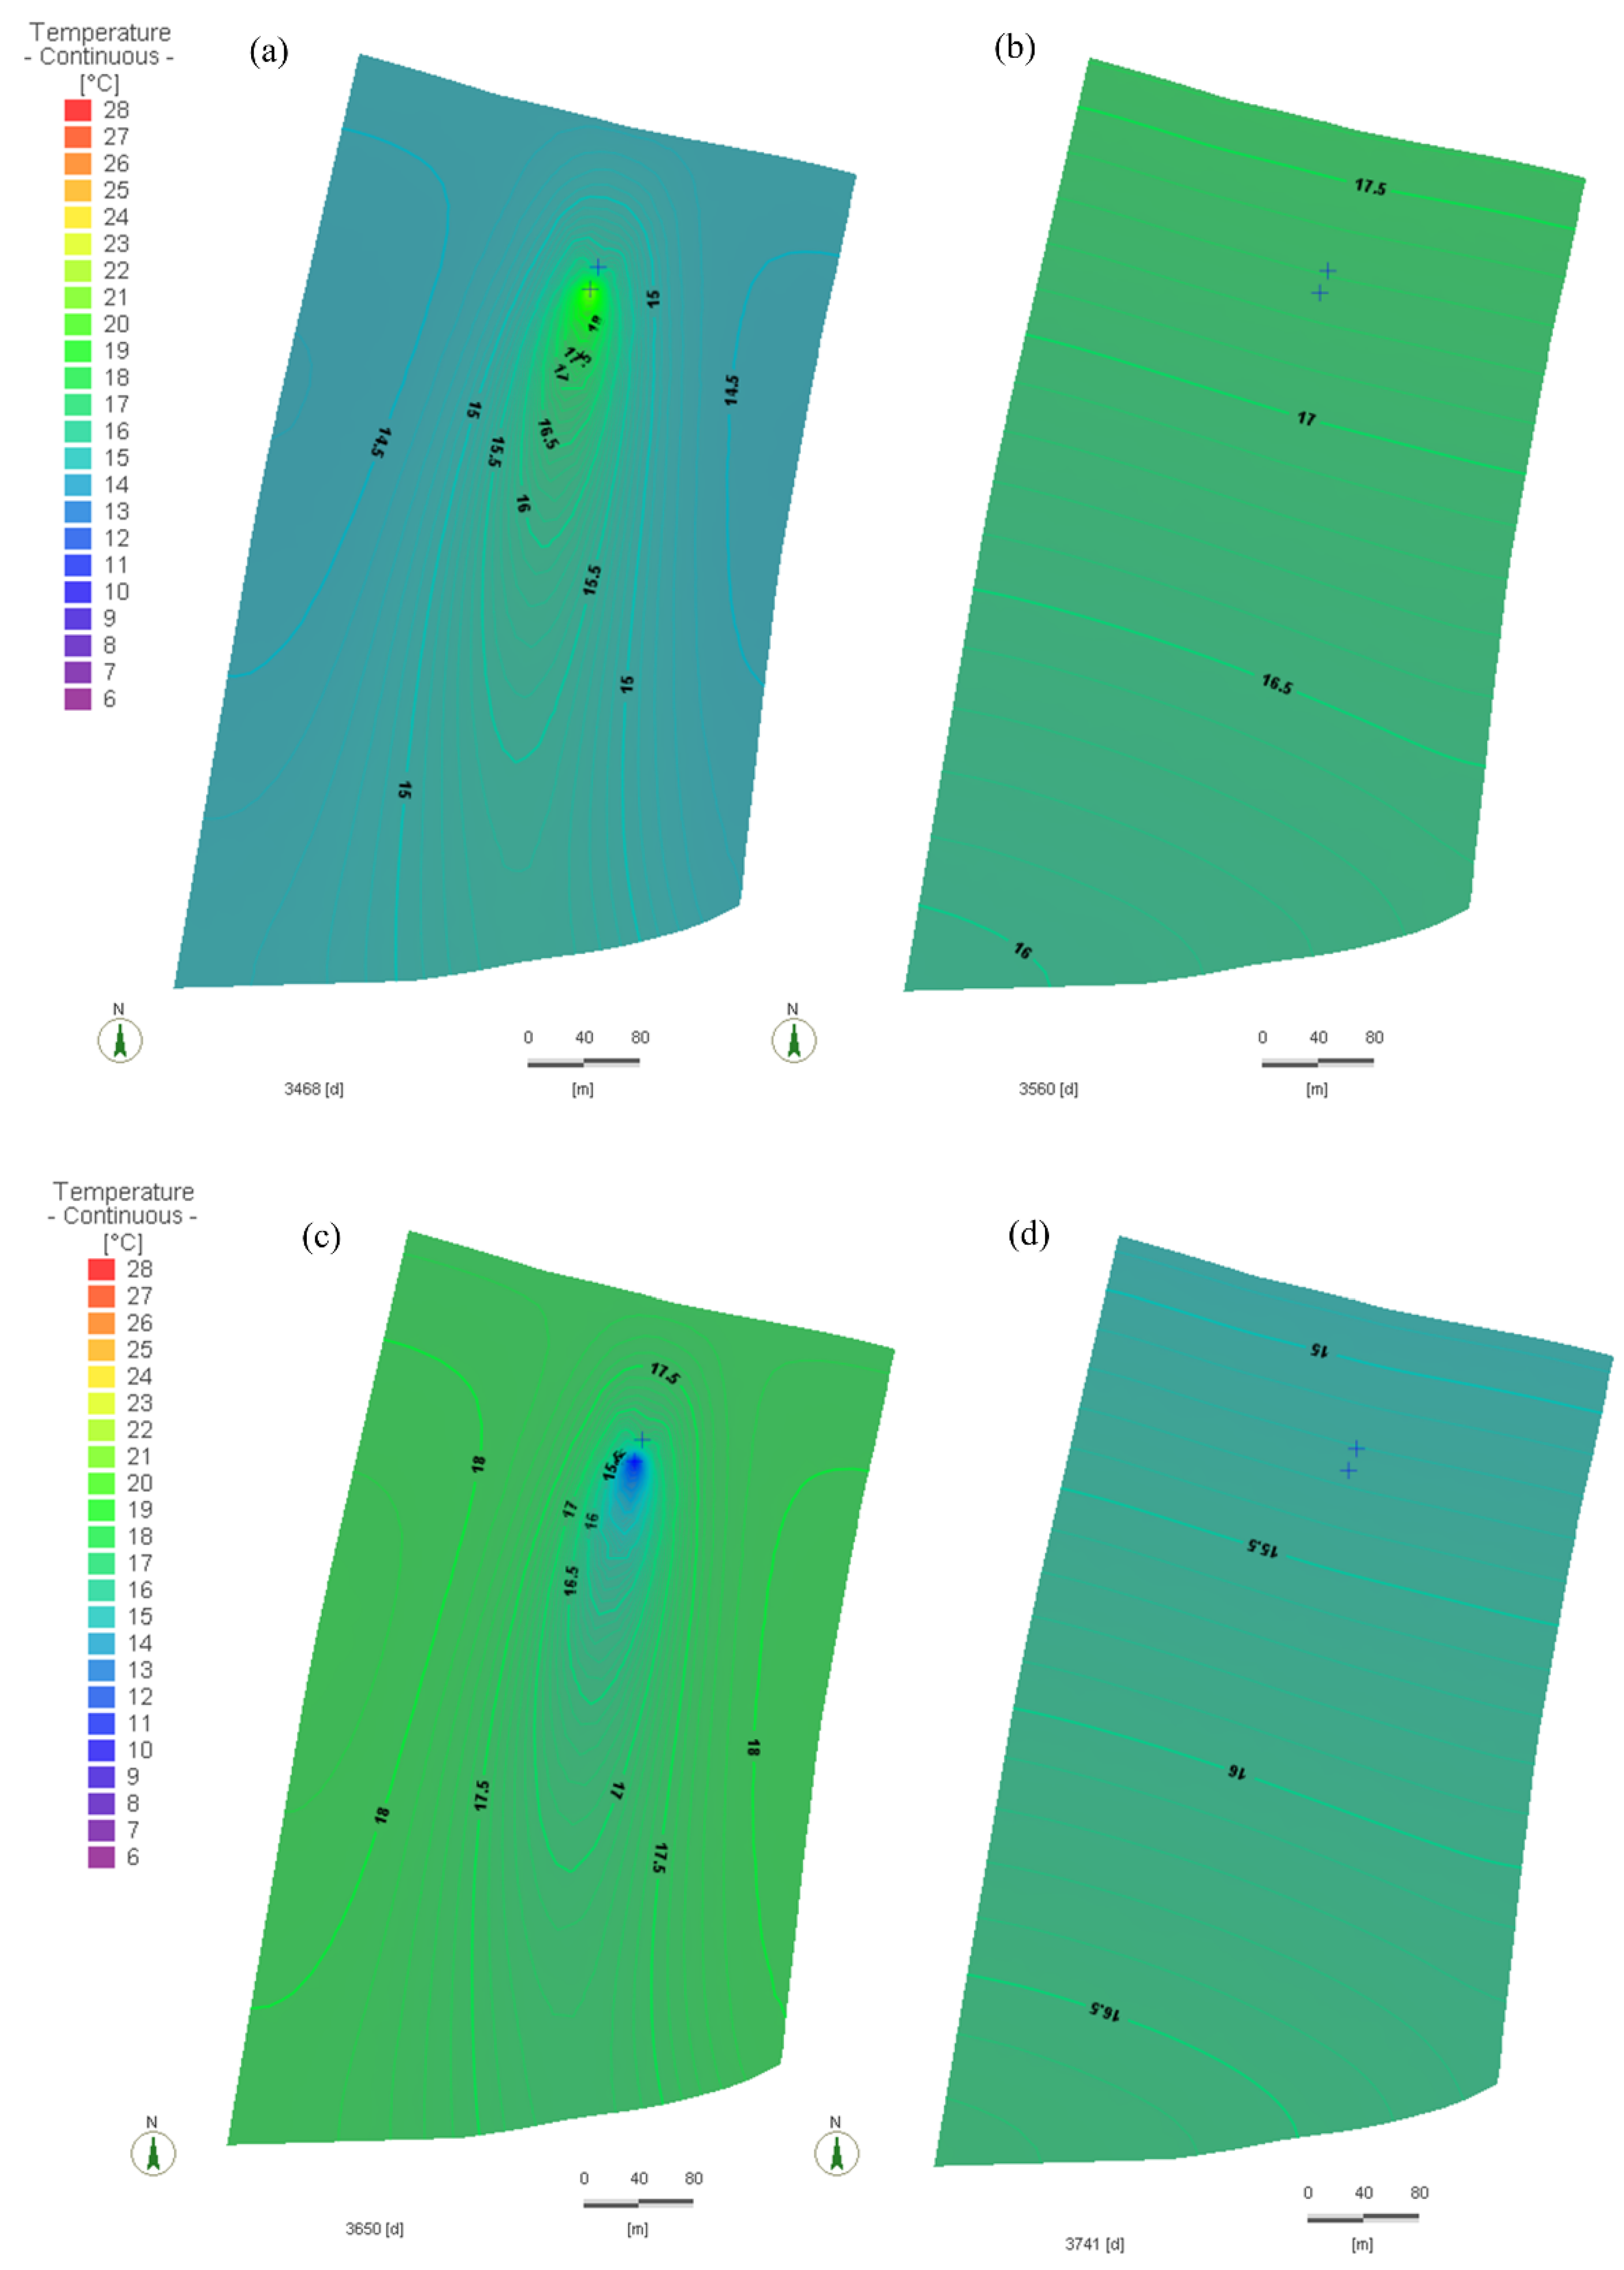
The extent of thermal change and recovery after operation differed between the two local models. Due to the lateral groundwater flow downstream, elongated areas with thermal changes were found in these two local models. Local model 1’s elongated area was larger than local model 2’s, as illustrated in Figure 14. However, due to the fast groundwater flow velocity in local model 1, the thermal change recovered quickly after the heating and cooling operations. Local model 2, on the other hand, as seen in Figure 15, required a long time to recover after heating and cooling. Even 90 days after the operation, thermal changes were still found in the downstream area. The open-loop system in local model 2 took longer to recover from the operation. Due to the slow groundwater flow velocity, recovery was slower.
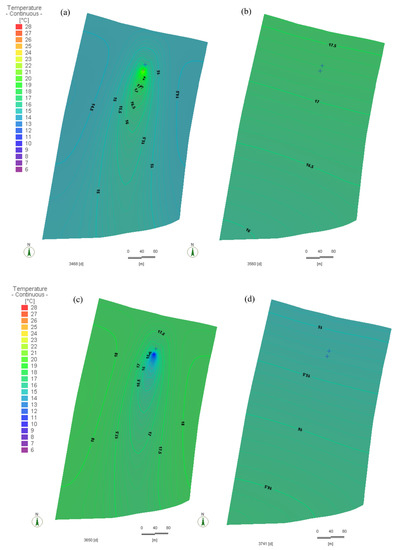
Figure 14.
Thermal changes on variation VI (3.33 × 10⁻² m3/s, 10 °C) pumping rate 3.33 × 10⁻² m3/s and injection temperature 10 °C on local model 1, (a) during cooling operation, (b) after 90 days of cooling operation, (c) during heating operation, and (d) after 90 days of heating operation.
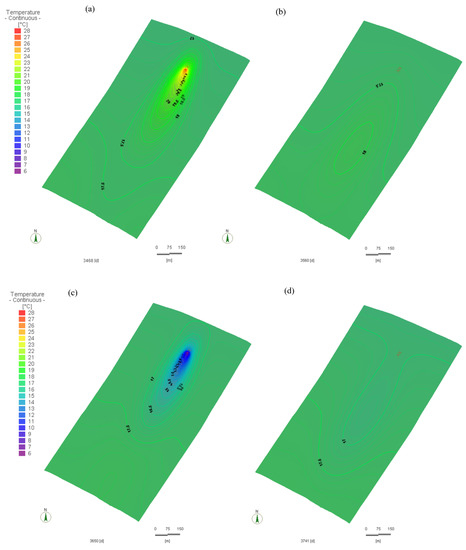
Figure 15.
Thermal changes on variation VI (3.33 × 10⁻² m3/s, 10 °C) pumping rate 3.33 × 10⁻² m3/s and injection temperature 10 °C on local model 2, (a) during cooling operation, (b) after 90 days of cooling operation, (c) during heating operation, and (d) after 90 days of heating operation.
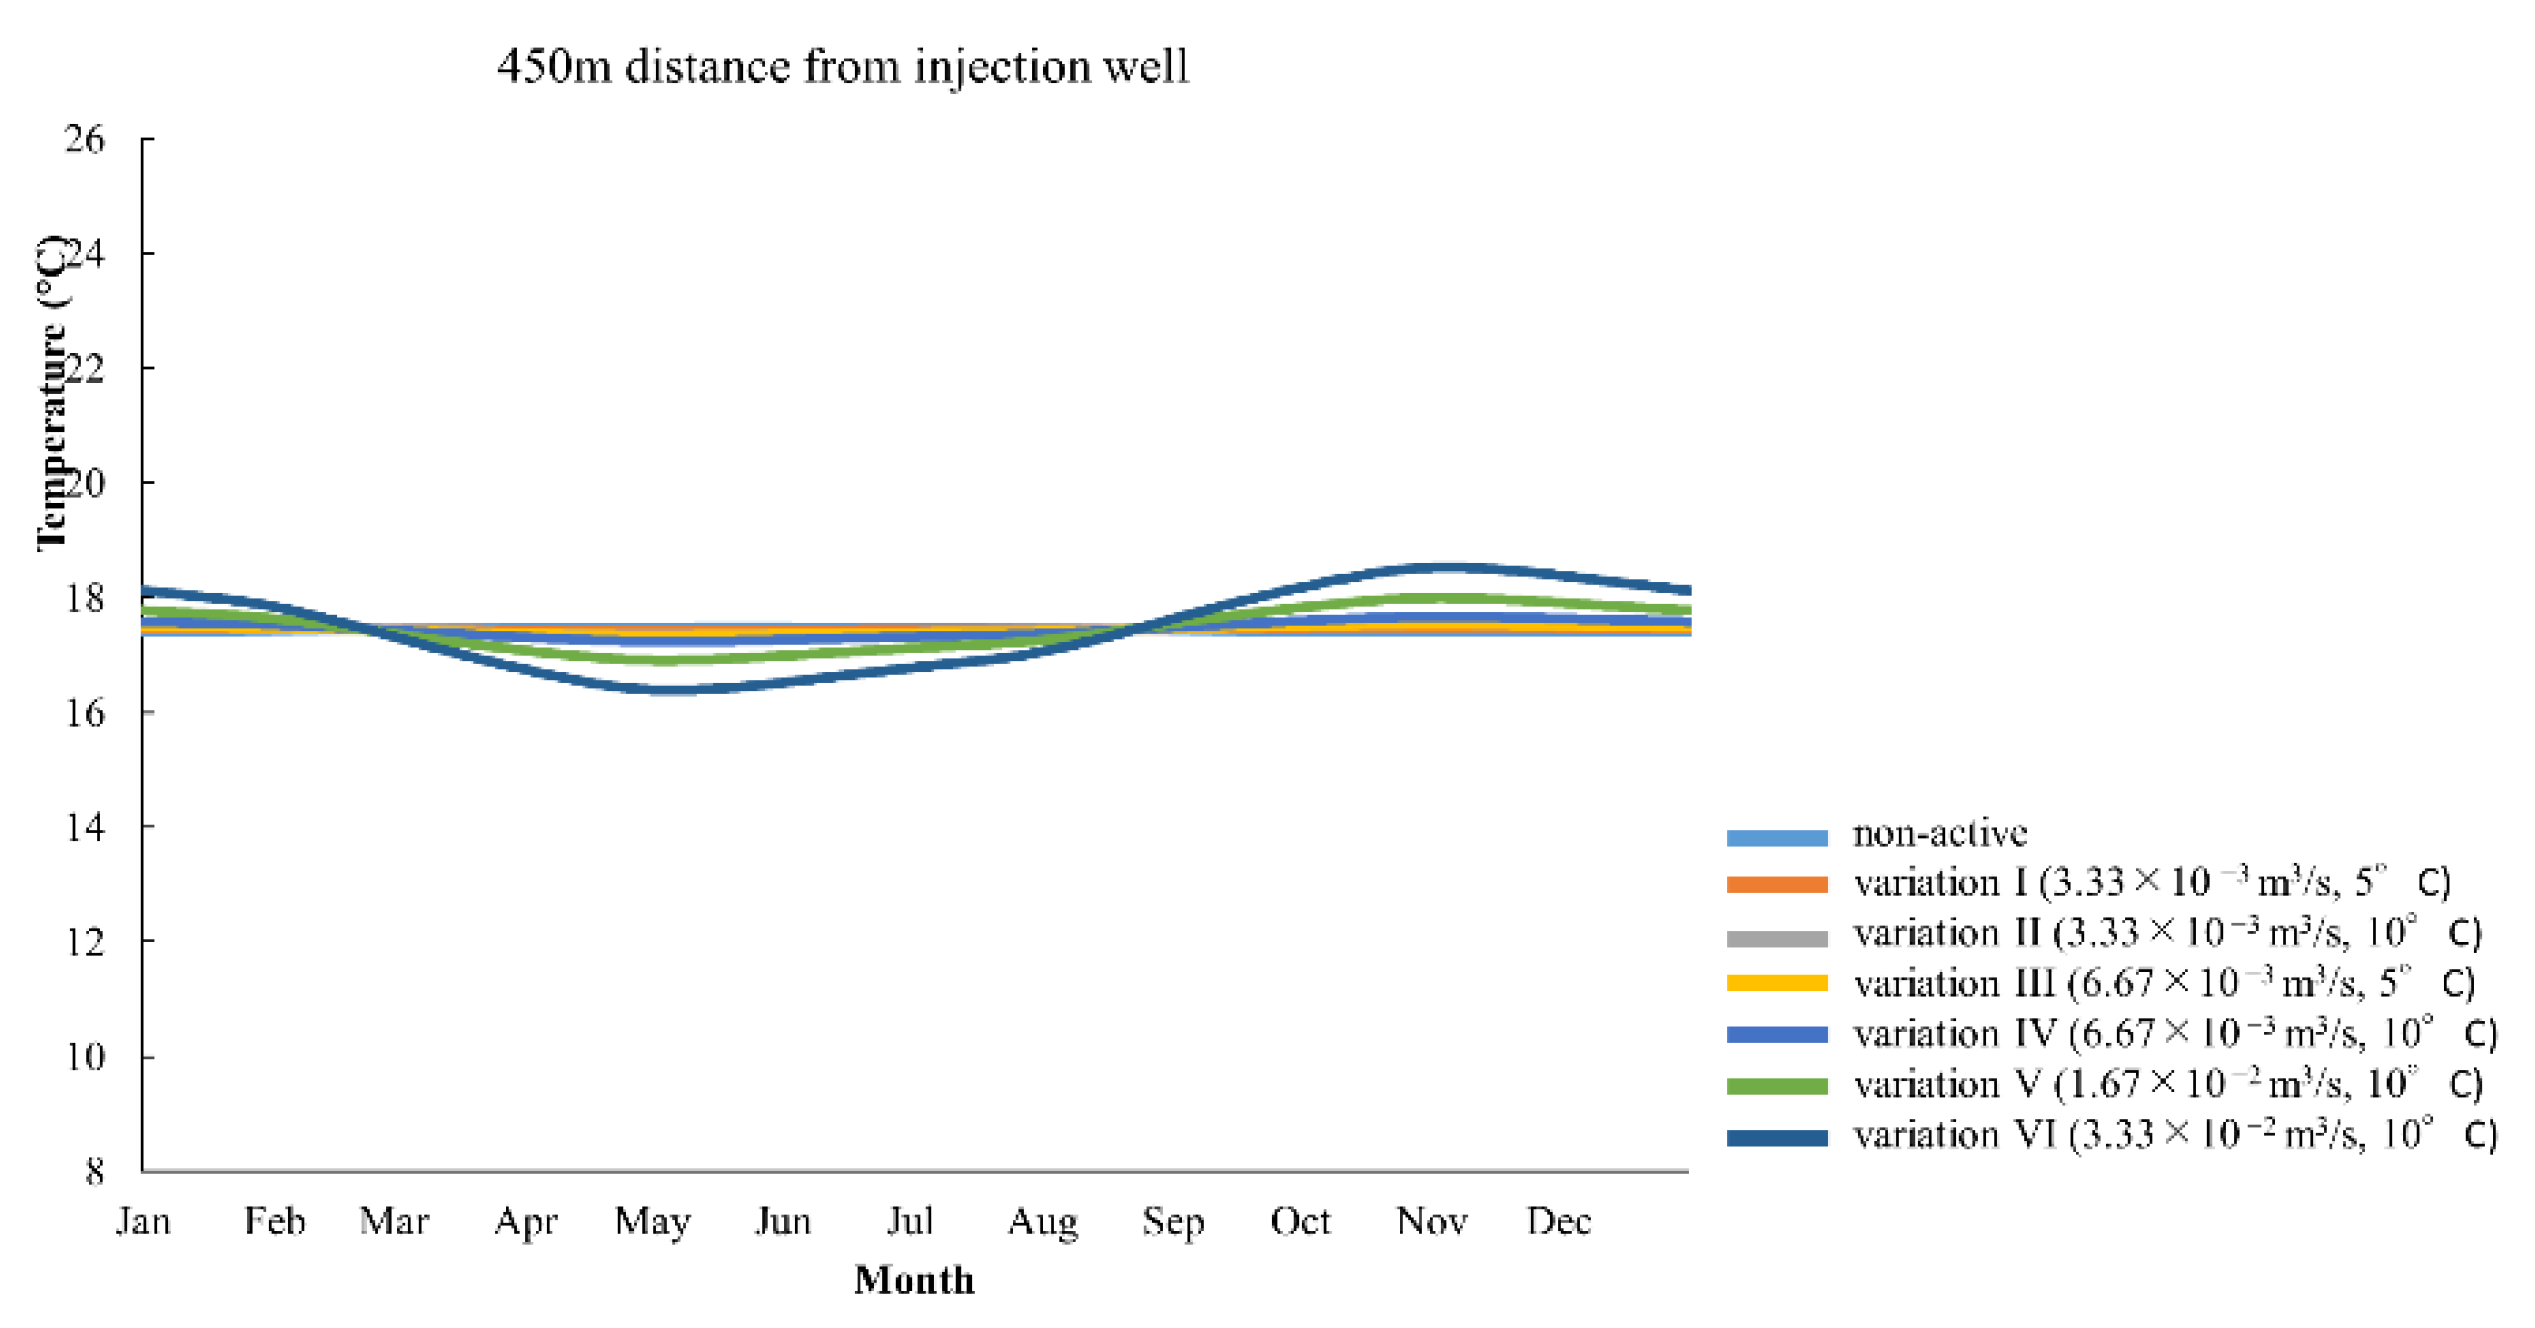
In addition, thermal changes could still be observed in the 450 m downstream area in local model 2, even after 90 days of heating and cooling operations. This situation gives the advantage of building an open-loop system around a 450 m downstream area as groundwater temperature becomes lower in summer and higher in winter, as seen in Figure 16.
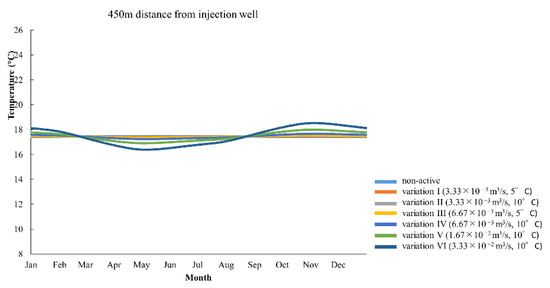
Figure 16.
Thermal changes in local model 2 at 450 m distance from the injection well.
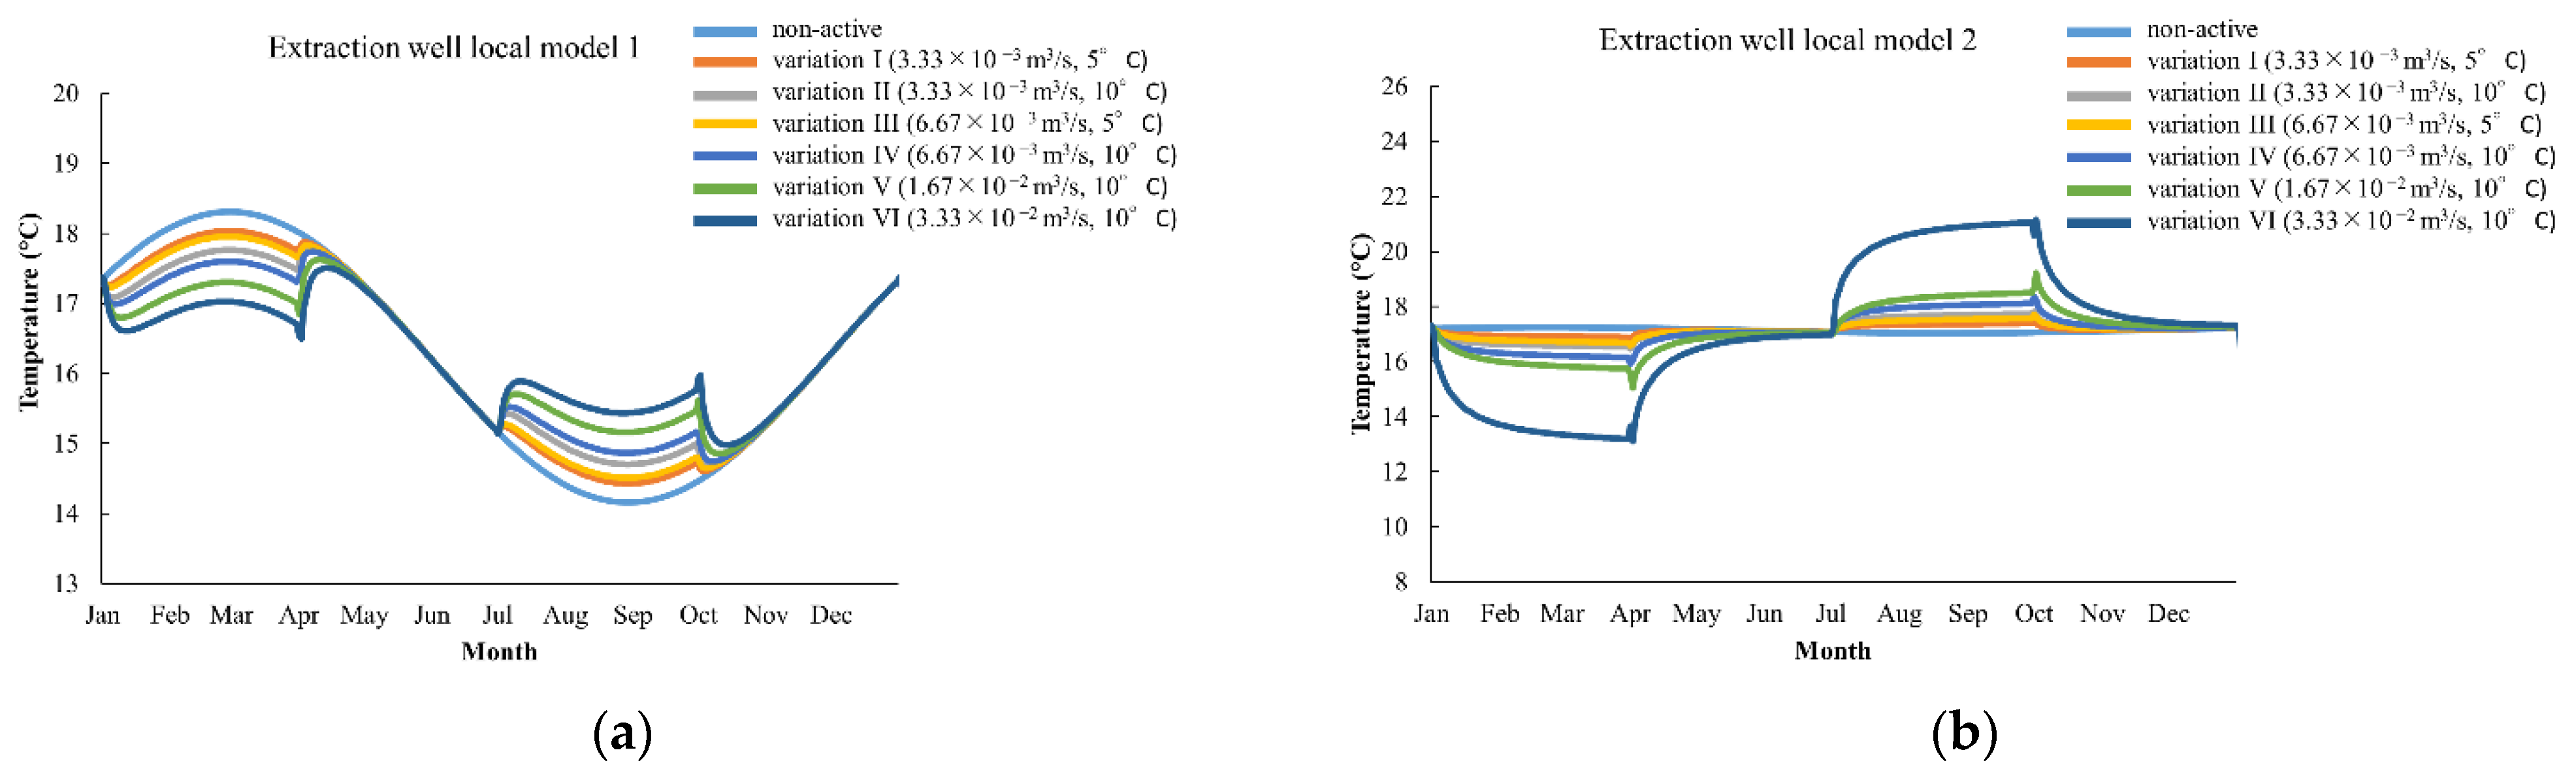
Figure 17 shows the groundwater temperatures of the extraction well at each variation in pumping rate and water-injected temperatures. The extraction well was 15 m upstream from the injection well. The increase in groundwater temperature around the extraction well was caused by an increase in the steepness of the mounds around the injection wells and the drawdown cones at the extraction wells. The higher the pumping rates applied, the greater the impact on the thermal feedback to the injection well. In this figure, we can also see that the impact of thermal feedback depends not only on the pumping rate but also on water-injected temperatures. It was discovered that the impact of thermal feedback on the extraction well at variation II (3.33 × 10⁻³ m3/s, 10 °C) was greater than that at variation III (6.67 × 10⁻³ m3/s, 5 °C).
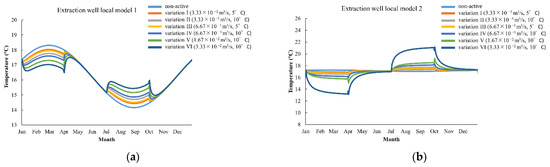
Figure 17.
Groundwater temperature at extraction well on local models 1 (a) and local model 2 (b).
4. Discussion
4.1. Regional Simulation
The calculated results of the regional simulation were almost consistent with the measured ones. The hydraulic head of the groundwater became lower toward the south, and the warm thermal plume in the aquifer was transferred toward the south of both the calculated and measured results. Although the calculated hydraulic heads show a small discrepancy from the measured ones, this small difference is acceptable for the following reasons. First, the hydrological data used for the hydraulic head boundary conditions were derived from water level measurements taken at 195 observation wells in 20–21 February 2014, while the measured data used as a comparison were derived from the annual average value of the study by Ohtani et al. [10]. Second, the boundary condition of the hydraulic head was constant, and transient flow was not treated in this study. Third, the parameter of the hydraulic conductivity of the Holocene gravel layer was a constant value, which was therefore different from the actual setting. Neton et al. [15] described the horizontal heterogeneity of the hydraulic conductivity of the aquifer in alluvial fans and introduced a down-fan fining trend, trending heterogeneity, and humped heterogeneity. Although the alluvial fan of the Nagara River is distributed along the margin of the Nobi Plain, the river has several basins on its upstream side, and debris flows do not reach this alluvial fan. This suggests that the distribution of hydraulic conductivity in the Holocene gravel layer shows a down-fan fining trend. This is consistent with the small discrepancy in hydraulic heads between the calculated and measured data.
4.2. Comparison between Local Models 1 and 2
This study showed the thermal impact of the open-loop geothermal system with local model 1 with fast groundwater flow velocity, influenced by a natural change in the groundwater system, and local model 2 with slow groundwater flow velocity, influenced by a very small natural change in the groundwater system. The differences in the calculated results on the thermal impact between the local models were the maximum thermal change from the natural one, the recovery period after the heating/cooling operation, and the temperature change during the heating/cooling operation.
The maximum thermal change from the natural one in local model 1 was 5 °C and that in local model 2 was 7 °C in the case of variation VI, which had a 3.33 × 10⁻² m3/s pumping rate and a 10 °C temperature difference between the extraction and injection water. The recovery period for local model 1 was about 15 days after the operation, whereas for local model 2, it took more than one month to reach an undisturbed groundwater temperature. The temperature change during the heating and cooling operations on local model 1 slightly decreased, whereas, on local model 2, thermal change continued to increase until the end of the operation period. The results of the first two came from the difference in groundwater flow velocity, and the third result was from the existence of a natural temperature change. The thermal impact of local model 1 was lower than that of local model 2. This means that an open-loop system can be installed densely in an area with rapid groundwater flow.
The thermal impact of local model 2 is not negligible for geothermal use on the downstream side. Previous studies have also mentioned this point. For example, Meng et al. [6] examined the thermal impact and long-term sustainability of the GHP, which is used on a small scale in the alluvial fan area, where vertical groundwater temperature variation is roughly 0.15 K. It has been demonstrated through long-term simulations that the accumulation of cold caused by heating occurs in the downstream area. The cold accumulations were carried out by many installations in the upstream region. Downstream installations were found to be unsustainable from an economic perspective due to the consumption of more electrical energy and a lower COP (Coefficient of Performance).
In this research, we conducted several numerical experiments by varying the pumping rate with the injection temperature to determine the maximum thermal change. According to Freedman et al. [7], a higher pumping rate and lower water injection resulted in smaller thermal plumes in the downstream area. This is consistent with our finding that variation II has a greater thermal impact (3.33 × 10⁻³ m3/s, 10 °C) than variation III (6.67 × 10⁻³ m3/s, 5 °C). However, the higher pumping rate resulted in higher thermal feedback at the extraction well, where the extraction well was a distance of 15 m from the injection well. The 15 m distance was less than the ideal distance for minimizing thermal feedback in local model 2, but it was acceptable in local model 1. The pumping rate was 3.33 × 10⁻³ m3/s with water injected at a temperature of 5 °C or 10 °C higher or lower than the groundwater temperature. The 10 °C temperature difference of injected water caused higher thermal plumes in the downstream area since the increase in water injected temperature into the injection well must be considered for its impact on the downstream area.
However, Meng et al. [6] and Freedman et al. [7] studied the thermal impact in areas without natural temperature changes. The Nagara River alluvial fan area has rapid groundwater flow and is influenced by natural groundwater changes. These conditions are advantageous for the sustainability of the GHP system. The COP of the heat pumps depends on groundwater temperature. In cooling, the lower the groundwater temperature, the more efficient and economical the heat pump operates. Natural temperature change in the Nagara River alluvial fan causes local model 1 groundwater temperature to be lower in summer and higher in winter. Therefore, the open-loop GHP in this area becomes more efficient. The thermal impact of local model 1 is lower than that of local model 2. This means that an open-loop system can be installed densely in an area with rapid groundwater flow. A lower pumping rate can also be applied with a higher injected water temperature in local model 1 for a higher SCOP (Seasonal Coefficient of Performance) because the higher injected water temperature is still sustainable for the downstream area.
4.3. Geothermal Heat Pump Use in the Alluvial Fan
This research can be consulted before installing an open-loop system in the Nagara River alluvial fan since we can calculate the thermal impact on groundwater heat pump use and its influence on the surrounding area or nearby installation. In this study, the thermal impact of open-loop GHP systems between local models 1 and 2 differed. This result showed that the temperature change caused by open-loop GHP systems was smaller in local model 1 than in local model 2. Local model 1 provides little thermal impact due to fast groundwater velocity and the existence of natural groundwater change. Due to the lateral groundwater flow, the groundwater temperature in this zone is slightly colder in the summer and warmer in the winter.
In addition, if multiple GHP system applications are installed upstream in local model 2, this would have a thermal impact on the downstream area. More installations in the downstream region of local model 2 would make it unsustainable, and the temperature of its groundwater would be considerably affected. However, this condition, on the other hand, is advantageous to the downstream area at 450 m. We can take advantage of this condition by implementing artificial thermal energy storage, where many installations in the upstream area provide thermal benefits in the downstream area.
5. Conclusions
Regional and local simulations of groundwater flow and heat transport were created to determine the distribution of the flow velocity and temperature of groundwater and to assess the thermal environmental impacts of an open-loop GHP system in the alluvial fan of the Nagara River, Gifu City, Central Japan. The results indicated that local model 1 with a faster groundwater flow velocity had a smaller thermal impact than local model 2 with a slow groundwater flow velocity. The existence of the natural temperature change causes local model 1 groundwater temperature to be lower in the summer and higher in winter during the operation. As a result, while the open-loop GHP system is operating, the thermal impact of local model 1 gradually decreases relative to that of local model 2.
Furthermore, the thermal impact of local model 1 recovers more quickly than that of model 2. The groundwater temperature distribution in local model 1 returned to normal after 90 days of heating and cooling. Thermal changes were still observed downstream in the 450 m area in local model 2. This condition, on the other hand, is advantageous to this zone for regional thermal energy storage because the groundwater temperature in this zone is slightly colder in the summer and slightly warmer in the winter.
For the open-loop GHP system, faster flow and natural temperature changes in groundwater provide higher efficiency and lower thermal impact advantages. This study is highly valuable for simulating the thermal impact that may be produced in the alluvial fan of the Nagara River when many GHPs are installed. The distance between individual installations can be checked to see whether thermal feedback occurs, and long-term sustainability, particularly in the downstream area, can be checked to see if numerous systems are applied in the upstream area.
Author Contributions
Conceptualization, T.O.; methodology, T.O. and R.P.; software, R.P.; validation, T.O., and R.P.; simulation, R.P.; writing—original draft preparation, R.P.; writing—review and editing, T.O.; supervision, T.O. All authors have read and agreed to the published version of the manuscript.
Funding
This research was funded by the New Energy and Industrial Technology Development Organization (NEDO), project JPNP19006.
Acknowledgments
This work is based on results obtained from a project, JPNP19006, commissioned by the New Energy and Industrial Technology Development Organization (NEDO). Special thanks to the City of Gifu for providing borehole data. Additionally, I would like to express my sincere thanks for the remarks and guidance given by Satoru Kojima and Kohji Kamiya.
Conflicts of Interest
The authors declare no conflict of interest.
References
- Sanner, B.; Karytsas, C.; Mendrinos, D.; Rybach, L. Current status of ground source heat pumps and underground thermal energy storage in Europe. Geothermics 2003, 32, 579–588. [Google Scholar] [CrossRef]
- Haehnlein, S.; Bayer, P.; Blum, P. International legal status of the use of shallow geothermal energy. Renew. Sustain. Energy Rev. 2010, 14, 2611–2625. [Google Scholar] [CrossRef]
- Blum, P.; Campillo, G.; Munch, W.; Kolbel, T. CO2 savings of ground source heat pump systems—A regional analysis. Renew. Energy 2010, 35, 122–127. [Google Scholar] [CrossRef]
- Lo Russo, S.; Gnavi, L.; Roccia, E.; Taddia, G.; Verda, V. Groundwater Heat Pump (GWHP) System Modeling and Thermal Affected Zone (TAZ) Prediction Reliability: Influence of Temporal Variations in Flow Discharge and Injection Temperature. Geothermics 2014, 51, 103–112. [Google Scholar] [CrossRef]
- Casasso, A.; Sethi, R. Assessment and minimization of potential environmental impacts of ground source heat pump (GSHP) systems. Water 2019, 11, 1573. [Google Scholar] [CrossRef]
- Meng, B.; Vienken, T.; Kolditz, O.; Shao, H. Evaluating the Thermal Impacts and Sustainability of Intensive Shallow Geothermal Utilization on a Neighborhood Scale: Lessons Learned from a Case Study. Energy Convers. Manag. 2019, 199, 111913. [Google Scholar] [CrossRef]
- Freedman, V.L.; Waichler, S.R.; Mackley, R.D.; Horner, J.A. Assessing the Thermal Environmental Impacts of an Groundwater Heat Pump in Southeastern Washington State. Geothermics 2012, 42, 65–77. [Google Scholar] [CrossRef]
- Pophillat, W.; Bayer, P.; Teyssier, E.; Blum, P.; Attard, G. Impact of Groundwater Heat Pump Systems on Subsurface Temperature under Variable Advection, Conduction and Dispersion. Geothermics 2020, 83, 101721. [Google Scholar] [CrossRef]
- Piga, B.; Casasso, A.; Pace, F.; Godhio, A.; Sethi, R. Thermal Impact Assessments of Groundwater Heat Pumps (GWHPs): Rigorous vs. Simplified Models. Energies 2017, 10, 1385. [Google Scholar] [CrossRef]
- Ohtani, T.; Mizuno, T.; Kouda, A.; Kojima, S. Seasonal Change of Underground Temperature and its Geothermal Utilization in Gifu City, Japan. In Proceedings of the World Geothermal Congress, Melbourne, Australia, 19–25 April 2015; pp. 19–25. [Google Scholar]
- Banks, D. Thermogeological assessment of open-loop well-doublet schemes: A review and synthesis of analytical approaches. Hydrogeol. J. 2009, 17, 1149–1155. [Google Scholar] [CrossRef]
- Lo Russo, S.; Taddia, G.; Baccino, G.; Verda, V. Different design scenarios related to an open loop groundwater heat pump in a large building: Impact on subsurface and primary energy consumption. Energy Build. 2011, 43, 347–357. [Google Scholar] [CrossRef]
- Pophillat, A.; Attard, G.; Bayer, B.; Hecht-Mendez, J. Analytical solutions for predicting thermal plumes of groundwater heat pump systems. Renew. Energy 2020, 147, 2696–2707. [Google Scholar] [CrossRef]
- Gifu Prefecture, Gifu City, Teikoku Construction Consultant. Report on feasibility study of geothermal heat pumps. 2011; 201p.
- Neton, M.J.; Dorsch, J.; Olson, C.D.; Young, S.C. Architecture and Directional Scales of Heterogeneity in Alluvial-Fan Aquifers. J. Sediment. Res. 1994, 64B, 245–257. [Google Scholar] [CrossRef]


Publisher’s Note: MDPI stays neutral with regard to jurisdictional claims in published maps and institutional affiliations. |
© 2022 by the authors. Licensee MDPI, Basel, Switzerland. This article is an open access article distributed under the terms and conditions of the Creative Commons Attribution (CC BY) license (https://creativecommons.org/licenses/by/4.0/).