Abstract
Determining the demand for heat power for domestic hot water preparation is necessary to perform a building energy assessment. For this, we need to predict domestic hot water consumption. Considering the number of factors influencing domestic hot water consumption, it is difficult to develop a highly accurate methodology. The aim of the study was to compare the real domestic hot water consumption and heat power for its preparation with the values calculated based on the available prediction methods in multi-family buildings. The analysis was carried out based on annual monitoring (2021 year) of domestic hot water consumption and the actual demand for heat power in eight multi-family buildings located in Grudziądz, in Central Poland. The results of these measurements were compared with the values determined based on the available methodologies for forecasting the demand for heat power and domestic hot water consumption: Sander’s, Recknagel’s, the standard method and the method according to Polish regulations from 2008 and 2015. The real average demand for heat power for domestic hot water was 89.8 ± 8.5 W/person, 211.2 ± 13.7 W/apartment and 4.8 ± 0.3 W/m2, and the daily domestic hot water consumption was 26.7 ± 3.6 dm3/person·day, 62.6 ± 5.8 dm3/apartment·day and 1.4 ± 0.1 dm3/m2·day. The real demand for heat power for domestic hot water was lower than that determined by the analyzed methods. The values obtained from the modified standard method based on Standard PN-92/B-01706/A1: 1999, with mean relative error of 10.5 ± 4.1%, were the closest to the real values. The current ordinance method (Regulation 2015) is characterized by an error of 45.4 ± 10.2%. The predicted domestic hot water consumption using the current ordinance was the closest to the real consumption. On average, it was higher by 7.7 ± 5.0%.
1. Introduction
Human population growth, economic expansion and the increase in the quality of life have resulted in an increased demand for energy in many sectors: industrial, residential, transport, agriculture and others. Globally, this energy most often comes from the combustion of fossil fuels, which has a negative impact on the environment. This method of energy production causes water, soil and, above all, air pollution. Increasing greenhouse gas concentrations cause global warming, which leads to climate change. The effects of this are an increase in temperature and more droughts, and thus a reduction in water resources throughout the world.
Buildings are responsible for 40% of the total primary energy consumption in the European Union and for one third of the total European greenhouse gas emissions [1]. The research on energy consumption in buildings [2,3,4] and analyses performed by international institutions such as the International Energy Agency [5] indicate that between 7.5% and 40% of the energy consumption in buildings is heat used for the preparation of domestic hot water (DHW).
For many years, one of the main goals of the climate policy implemented by the EU has been to reduce greenhouse gas emissions, which is strictly associated with reducing energy consumption, as well as energy efficiency improvement in construction and industry [6,7]. This is reflected in many documents developed and implemented in the European Union. These are, among others, the “Conclusions on 2030 Climate and Energy Policy Framework”, assuming GHG reduction by at least 40% by 2030 [8], and the currently binding provisions of “The European Green Deal”, which assume a reduction in net greenhouse gas emissions in the EU by at least 55% by 2030 (compared to 1990 levels) [9]. One of the methods to reduce energy consumption in construction is the obligatory energy certification of buildings in accordance with the EU directive [10]. Since 2010, EU Member States have been obliged to perform energy assessment in terms of primary energy. For this, the primary energy demand for various purposes is calculated, among others, for the DHW preparation using various methodologies. One of them was the European standard EN 13790 “Energy performance of buildings—Calculation of energy use for space heating and cooling”. However, EU Member States may use characteristic national indicators, which better represent the specific conditions of each country [11].
The DHW consumption and energy for its preparation depends on many factors and they are characterized by strong daily and monthly fluctuations. These include location, weather and climate conditions, number of inhabitants, usable floor area, type of building, economic situation of inhabitants, age of inhabitants, their individual habits and social and cultural norms, etc. Finnish researchers showed differences in the DWH consumption between weekdays and weekend days. They also observed that the morning peak of DHW consumption is lower than the evening peak [12]. The same relations between week and weekend days’ DHW consumption were also observed in South Africa. During this study, it was additionally noted that there was a dependence between DHW consumption and season [13]. Similar results were published by Pérez-Fargallo et al. [14]. They observed an increase in DHW consumption by 0.2 dm3/day and 0.08 dm3/person/day with an increase of 1 °C. On the other hand, during studies conducted in a temperate climate in Switzerland, no statistically significant differences were found between the week and weekend days and the seasons of the year [15]. The research also showed the effect of the size of the household (the number of persons and the usable floor area) on water consumption [16]. During a comparative study of the behaviors of Polish and Greek consumers, it was determined that the DHW consumption is influenced by the national habits, the sex and age of consumers and the type of apartment ownership (owned or rented) [17]. Another important factor is also the DHW fee payment method in multifamily buildings, with either a flat rate or according to meter readings. Terés-Zubiaga et al. [18] noted a 15–20% decrease in DHW consumption in two years after equipping all apartments in the studied building with an individual metering system. In some publications, authors present a review of parameters influencing DHW consumption [19]. Other factors influencing, firstly, the energy consumption for DHW preparation are the type of heat source and the age and technical condition of the DWH system. It may be reduced by using technical and technological innovations—for example, new materials and modern technical solutions [20,21,22].
To determine the demand for heat power for DHW preparation, necessary to perform a building energy assessment, we focused on the prediction of DHW consumption. Considering the number of factors influencing DHW consumption, it is difficult to develop a highly accurate methodology for this aim. In many published works, based on real DHW consumption, authors developed new prediction models or improved the existing ones [23,24,25,26]. These models are usually developed based on research on a relatively small population, which significantly affects their fit with real consumption. Usually, in this model, artificial neural network [27,28] prediction or machine learning [29] is used.
There are several methodologies for calculating the DHW and the heat power demand for its preparation, which are included in the legal acts [30,31], standards [32] or engineers’ handbooks [33]. Besides developing new methods to predict DHW consumption, it is also important to verify the existing ones.
The aim of the study was to compare the real DHW consumption and the heat power for its preparation with the values calculated based on the available prediction methods in multi-family buildings.
2. Materials and Methods
The analysis was carried out based on annual monitoring (in 2021) of DHW consumption and the actual demand for heat power. The results of these measurements were compared with the values determined based on the available methodologies for forecasting the demand for heat power and DHW consumption. These were methods published in engineers’ handbooks and in legal acts.
2.1. Studied Buildings
The research was conducted in 8 multi-family buildings located in Grudziądz, in the Kuyavian-Pomeranian Voivodeship, in Central Poland. They were supplied from the heating network through a dual-function compact heat substation with plate heat exchangers and a capacitive heat accumulator. All studied buildings were built in the 1980s and then underwent complex thermal modernization. Buildings differed in terms of staffing, cubature and number of apartments (Table 1).

Table 1.
Data on the analyzed buildings.
2.2. Methods of Predictiong the DHW Consumption and Heat Power Demand
2.2.1. Sander’s Method (M1)
In this method, the predicted DHW consumption and the heat power demand for preparing DHW are calculated based on the number of DHW points of use in the building [33].
The maximum demand for heat power is determined from Equation (1):
where the coefficient of heat loss (20%) and 3600 is due to the conversion of hours to seconds.
The maximum demand for DHW is calculated from Formula (2):
The average demand for heat power for DHW preparation is calculated using Equation (3):
where 24 is the number of hours in the day.
The maximum, daily and annual DHW consumption with the assumed time of DHW tank loading and time of water heating in the DHW tank are determined from Equations (4) and (5):
where 0.365 is the result of conversion of days to years and dm3 to m3.
The coefficient of simultaneous consumption of DHW depends on the number of devices in the building, and its values are presented in Table 2.
Table 2.
Coefficient of simultaneous consumption [33].
2.2.2. Recknagel’s Method (M2)
The nominal amount of heat power demand in a building with n apartments is determined from Equation (6):
where constant 3.5 person/apartment denotes the number of inhabitants, and 5860 Wh is the heat consumption per one bath, which corresponds to an apartment with a nominal number N = 1. The number of inhabitants is determined based on statistical or real data. Heat demand is different for each type of DHW point of use and the values are given in Table 3.
Table 3.
Heat demand for DHW points of use [33].
After calculating the nominal number and determining the time of DHW consumption Z, heat power demand in kilowatts can be obtained, as shown in Figure 1.
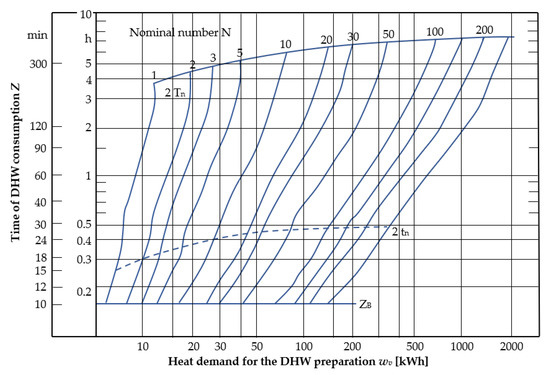
Figure 1.
The dependence of the heat demand for DHW, the nominal number and the time of DHW consumption [33].
The average demand for heat power for DHW is calculated from Equation (7):
where 24 is the number of hours in the day.
2.2.3. Standard Method (M3)
The method involves calculating the average and maximum hourly DHW demand using the hourly coefficient of irregularity [32]. The maximum and average demand for heat power for DHW can then be calculated from the following Equations (8) and (9):
Maximum and average hourly DHW flow is calculated from Equations (10) and (11):
2.2.4. Method According to the Regulation of the Minister of Infrastructure 2008 (M4)
Using this method, the demand for heat power for DHW is calculated based on the number of people living in the building [30]. Average heat power is calculated from the following relationship (13):
The useable energy demand for DHW preparation is calculated from Equation (14);
where 1000 and 3600 are the results of conversion of dm3 to m3 and hours to seconds, respectively. The values of average daily DHW demand per person for a temperature of 55 °C and correction factor are presented in Table 3 and Table 4. The values are included in the regulation [30].
Table 4.
Average daily DHW demand per person for temperature of 55 °C—; Correction factor— [30].
The average annual efficiency of the DHW system is determined from Formula (15):
The annual water consumption is calculated from Formula (16):
2.2.5. Method According to the Regulation of the Minister of Infrastructure and Development 2015 (M5)
Using this method, the demand for heat power for DHW is calculated based on the apartment area [31]. Average heat power is calculated from Equation (17):
The average annual efficiency of the DHW system is calculated from Equation (15). The efficiency values , , and should be taken as the values in Table 5, in accordance with the regulation [31].
Table 5.
Selected efficiencies for the heat substation [30].
Usable energy demand for DHW preparation is determined from Formula (18):
where 1000 and 3600 are the results of the conversion of dm3 to m3 and hours to seconds, respectively.
The annual water consumption is calculated from Formula (19):
where 1000 is the result of conversion from dm3 to m3.
2.2.6. Comparison of Real and Forecasted Consumption of Domestic Hot Water and Demand for Heat Power
To compare the real and forecasted consumption of domestic hot water and demand for heat power, for both DHW heat power and DHW consumption, the relative errors of approximation were determined according to Equations (20) and (21):
The relative errors were calculated for each studied building and for each forecasting method. Based on these values, we determined the relative errors of forecasting, which were the average values of all buildings. To illustrate the variability of forecasting, the standard deviation was also calculated. For comparison with other published values, DHW consumption and heat power for DHW were related to 1 apartment, 1 person and to 1 m2.
2.3. The Real Demand for Heat Power for DHW and DHW Consumption
The real demand for heat power for DHW and DHW consumption was obtained from the OPEC Group for 2021. This is a power company whose main goal is to meet the thermal needs of Grudziądz city. The heating system is equipped with a telemetry system from VECTOR SMART DATA Sp. z o.o. Substations in each building are equipped with a heat meter that allows the user to read the measured parameters—for example, a heat meter, cold water meter, water meter to supplement the heating network, pressure transducer, heat substation controller, circulation pumps, control valves, etc. Depending on the device (heat meter), GPRS, LTE Cat M1, NB IoT and radio are used for data transmission to the monitoring center via the server. The data can be made available via the ODBC protocol, issued to the OPC, HTTPS server. Readings are made with an interval of 1 h. Figure 2 shows an example graphic report generated in the telemetry system.
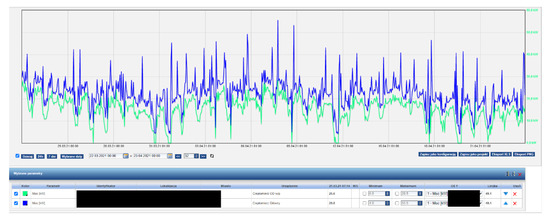
Figure 2.
Sample reading of data from the heat substation.
3. Results and Discussion
During the calculations, all methods assumed the initial water temperature of 10 °C, which is the average temperature of tap water during the year, and the final DHW temperature of 55 °C, which is the minimal DWH temperature considering Polish regulations and sanitary requirements.
3.1. Method M1
It was assumed that 50% of the apartments were equipped with bathtubs and the rest with showers. Water consumption of 140 dm3/h was used for bathtubs, and 40 dm3/h for showers. The DHW tank loading and time of water heating in the DHW tank were assumed to be 2 h. These values were in line with the current Sander’s method recommendations included in the handbook [33]. Table 6 shows the results of the Sander method calculations for the studied buildings.
Table 6.
The demand for heat power for DHW and predicted DHW consumption according to M1.
3.2. Method M2
The calculations assume that 50% of the apartments are equipped with a bathtub, washbasin and sink, and the remaining ones have a shower, washbasin and sink. The number of inhabitants was obtained from the housing association managing the buildings (Table 1). The required heat demand was obtained from Figure 1, assuming Z = 2 h, which was the recommended value. Table 7 presents the results of calculations of the demand for heat power using Recknagel’s method for the analyzed buildings.
Table 7.
The demand for heat power for DHW according to M2.
3.3. Method M3
In the calculations using method M3, the average daily DHW demand per person was adopted on two levels: 110 dm3/person·day and 40 dm3/person·day. The first value is according to the standard. It was applied when DHW charges were of a flat rate, which caused high DHW consumption. The second value (40 dm3/person·day) corresponds to the currently assumed level of DHW consumption. The time of DHW system use was assumed as 18 h a day. The determined DHW consumption and the demand for heat power are presented in Table 8.
Table 8.
The demand for heat power for DHW and predicted DHW consumption according to M3.
3.4. Method M4
For the calculations, it was assumed that the average daily water demand per person was 38.4 dm3/person·day. This is the value for multi-family buildings reduced by 20%. This reduction is due to equipping all apartments with water meters. Additionally, the correction coefficient kt = 1 was assumed. The number of days of apartment use was 328.5 days (10% share of annual holidays was considered). All assumed values were in accordance with the regulation [30], where this method was described. The average annual efficiency of the DHW system was determined from Equation (15) and data from Table 5. It was 0.4998. Table 9 shows the calculated values, forecast of DHW consumption and heat power demand.
Table 9.
The demand for heat power for DHW and predicted DHW consumption according to M4.
3.5. Method M5
During the calculations, the daily demand for DHW was assumed as 1.6 dm3/m2·day, because all buildings were equipped with water meters. The correction factor for both multi-family and single-family buildings was the same and amounted to 0.9. In this method, the number of days was assumed to be 365 (holiday breaks were not considered). These assumptions were due to the regulations, which partly included a description of these methods. The average annual total efficiency of the domestic hot water preparation system was determined from Formula (15) and amounted to 0.4998. Table 10 shows the determined values of heat power demand for DHW and forecasted DHW consumption.
Table 10.
The demand for heat power for DHW and predicted DHW consumption according to M5.
3.6. Comparison of Real and Forecasted Consumption of Domestic Hot Water and Demand for Heat Power
Table 11 compares the real average heat power with the results of calculating the demand for heat power for DHW according to the analyzed forecasting methods. The table also includes the relative error of calculations for each of the analyzed buildings.
Table 11.
Real average heat power for DHW and forecast of heat power demand.
The comparison of the real results with the forecasted values was also performed for the demand for heat power for the preparation of DHW per person per day (Figure 3). The results are presented in the form of a box plot. The line inside the box represents the median (Me), the top and bottom lines are the upper (Q3) and lower (Q1) quartiles, respectively, and the so-called whiskers are the minimum and maximum values. The designation x indicates the value of the arithmetic mean. Figure 4 shows the average relative error in forecasting the demand of heat power for DHW preparation.
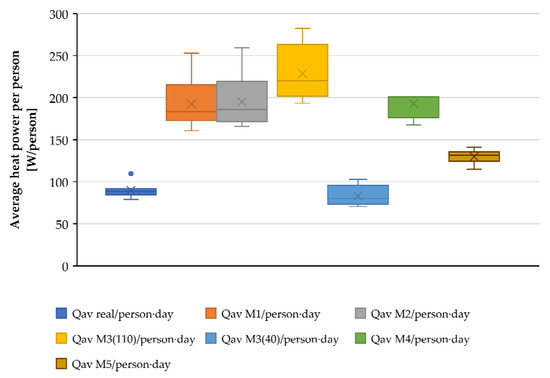
Figure 3.
Average heat power for the preparation of DHW per person per day.
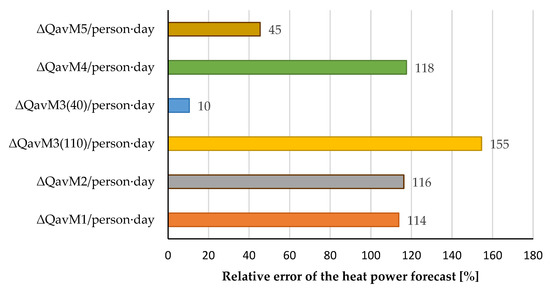
Figure 4.
Relative error of forecast of heat power for DHW.
Based on the values of the relative forecasting error, it can be concluded that the average heat power for DHW calculated using the third method (M3) is the most similar to real values. Although this is a method that was developed using a flat-rate charge for domestic hot water, it gives the best results after using the current DHW consumption per person per day. The error ranges from 4.1% to 16.7% (mean 10.5 ± 4.1%). In the case of assuming the DHW consumption resulting from the standard at the level of 110 dm3/person·day, this method has the greatest error—on average, 155 ± 23%. Regarding the demand for average heat power for DHW, determined in accordance with the regulation currently in force, method M5 is the second best forecasting model, with a relative error ranging from 28.6% to 58.5% (mean 45.4 ± 10.2%). The other three methods (M1, M2, M4) have a similar level of relative error. The mean relative error of the forecast was 114 ± 16%, 116 ± 18% and 118 ± 31%, respectively. The high values of relative errors and small standard deviations for these methods may result from incorrectly adopted values of the coefficient of simultaneity and the nominal number and others. They were developed several dozen years ago, with a completely different value of DHW consumption per person and a different number of people living in one apartment, which may not reflect the current conditions. For most methods, the increase in the forecast error increases with the number of apartments in the building.
The comparison of the forecasted consumption of DHW with the real consumption and the error of the relative forecasts is included in Table 12.
Table 12.
Real domestic hot water consumption and forecast demand.
Figure 5 shows the comparison of the real daily DHW consumption per person with the forecasted values. The relative error of forecasts is presented in Figure 6.
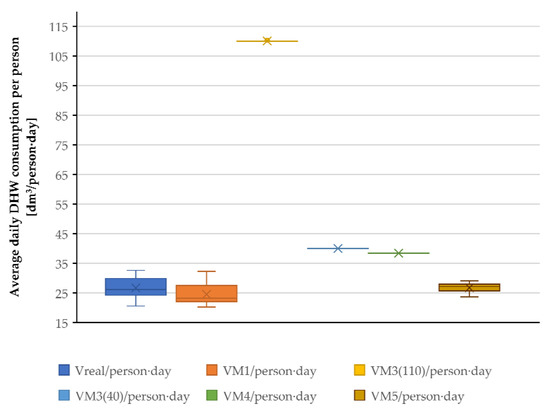
Figure 5.
Average daily DHW consumption per person.
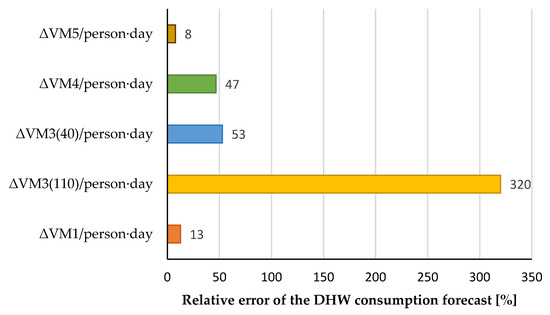
Figure 6.
Relative error of forecast of the DHW consumption per person.
For forecasting DHW consumption, the best model was the method M5, according to actual regulations. The relative error ranged from 1% to 15.2% (mean 7.7 ± 5.0%). M1 also has a very good fit with real consumption, for which the mean error ranges from 1.1 to 26.3 (mean 12.6 ± 7.0%). The results that differ the most from real consumption were obtained using the method M3, which assumed the daily DHW consumption per person of 110 dm3/day·person. The relative mean error was 320 ± 58%. The calculations obtained by the remaining methods, M4 and M340, were characterized by errors of several dozen percent, and the relative error was 47 ± 20% and 53 ± 21%, respectively.
There are few works comparing the real heat power for DHW and DHW consumption with forecast values. Chmielewska et al. [34] monitored DHW consumption in 16 multi-family buildings (626 apartments) for two years, located in Wrocław. They proposed their own model of forecasting DHW consumption, and they compared real DHW consumption with values calculated using method M5. The average forecasting error was 17% [34]. Ratajczak et al. 2021 [11], based on a four-year study on the consumption of DHW in three single-family houses, found that the real DHW consumption was 21% lower than the estimate according to the 2008 regulation (method M4) and 39% from the results obtained based on the 2015 regulation (method M5).
3.7. Comparison of the Real Heat Power for DHW and DHW Consumption with Other Works
To compare the results of this study with published values, the heat power for DHW and DHW consumption was related to person, apartment and per 1 m2 of usable floor area of the apartment. The results are presented in Table 13.
Table 13.
Real domestic hot water consumption and forecasted DHW demand.
The real average demand for heat power for DHW ranged from 79 to 110 W/person (average 89.8 ± 8.5 W/person). The obtained values are comparable with those published in other papers. Ahmed et al. [12] noted the real demand for heat power for DWH was from 140 to 200 W/person. In turn, Terés-Zubiaga et al. [18] recorded 150 W/person of average real heat power for DHW. Knight et al. [35] published average heat power values for DHW preparation for several countries. The values ranged from 77 W/person in Great Britain to 246 W/person in Canada. In Poland, research in this area was conducted by Szlugowska-Zgrzywa et al. [36], who recorded the real demand for heat power at the level of 138.71 W/person. Comparing the results with other studies, they are within the range of the published average real demand for heat power for DHW. The differences may result from many factors: the DHW consumption, the temperature of cold water and the expected DHW temperature.
The average daily DHW consumption per person for all the examined buildings was 26.7 ± 3.6 dm3/person·day, and it is a value that is similar to other studies. Ratajczak et al. [11], in 2021, recorded the mean real DHW consumption of 27.4 ± 1.4 dm3/person·day based on their monitoring of three single-family buildings. Szaflik [37], conducting annual research in six multi-family buildings, observed DHW consumption at a higher level of 55 dm3/person·day. Moreover, higher values of 39.33 dm3/person·day were published by Szaflik [38]. The real consumption was calculated on the basis of annual research in 65 multi-family buildings located in several housing estates in Szczecin (1.56 people/apartment). In other published studies, the values of daily DHW consumption were also higher. Szlugowska-Zgrzywa et al. [36] determined the average DHW consumption of 43.3 dm3/person·day during three-month measurements in four multi-family tenement houses (13 apartments in each building). Januszewska and Szaflik [39], based on a 14-year study (2006–2020), observed the real DHW consumption in a multi-family building (two persons per apartment), which was 40.2 dm3/person·day.
Results of this study are also comparable with European studies. The DHW consumption obtained by Gutierrez-Escolar et al. [40], based on measurements in 10 apartments in Spain, was 25.7 dm3/person·day. Higher consumption was reported by Ahmad et al. [12] and it was 47.3 dm3/person·day. They conducted a 9-month study in 86 apartments in Finland (2.2 persons per apartment). The results of studies conducted outside Europe are significantly higher. In Canada, the real DHW consumption was 59 dm3/person·day [41]; in North America, 63.9 dm3/person·day [42]; and in Latin America, 79–103 dm3/person·day [43].
4. Conclusions
The results of this research and analysis, concerning DHW consumption and forecasting, can be presented in the form of the following conclusions:
- -
- The real average demand for heat power for DHW was 89.8 ± 8.5 W/person, 211.2 ± 13.7 W/apartment and 4.8 ± 0.3 W/m2. On the other hand, the daily DHW consumption was 26.7 ± 3.6 dm3/person·day, 62.6 ± 5.8 dm3/apartment·day and 1.4 ± 0.1 dm3/m2·day.
- -
- The real demand for heat power for DHW was lower than that determined by the analyzed methods. The values obtained from the modified method M3 (standard method), with a mean relative error of 10.5 ± 4.1%, were closest to the real values. The current ordinance method M5 (Regulation 2015) is characterized by an error of 45.4 ± 10.2%.
- -
- The predicted DHW consumption using the current ordinance (M5) was the closest to the real consumption. On average, it was higher by 7.7 ± 5.0%.
In summary, the current, valid method of forecasting DHW consumption (method M5) allows for a fairly accurate representation of real DHW consumption; however, in the case of forecasting the heat power demand for DHW, the results could be closer to the real values. Taking into account the scope, complexity and multiplicity of factors determining DHW consumption, it seems to be necessary to continue works related to the improvement or development of new methods of estimating DHW consumption. In addition to the technical factors that could be included in the methodologies, socio-economic factors and consumer habits are important elements that are difficult to implement. All these parameters should be included in future studies aimed at modeling the consumption of DHW.
Author Contributions
Conceptualization, W.R. and I.R.; methodology, W.R., I.R. and P.H.; validation, W.R. and I.R.; formal analysis, W.R., I.R. and P.H.; investigation, W.R. and I.R.; resources, W.R. and P.H.; data curation, W.R. and I.R.; writing—original draft preparation, W.R. and I.R.; writing—review and editing, W.R. and I.R.; visualization, W.R. and I.R.; supervision, W.R., I.R. and P.H.; funding acquisition, W.R. and I.R. All authors have read and agreed to the published version of the manuscript.
Funding
This research was funded by the Polish Ministry of Science and Higher Education, grant number 5300101/0713/0010/ND.
Data Availability Statement
Not applicable.
Conflicts of Interest
The authors declare no conflict of interest.
Nomenclature
| maximum demand for heat power for DHW, [kW] | |
| maximum demand for DHW, [dm3/h] | |
| specific heat of water, [kJ/kg·K] | |
| density of water, [kg/dm3] | |
| temperature of domestic hot water, [° C] | |
| temperature of cold water, [° C] | |
| DHW consumption for bath/shower, [dm3/h] | |
| number of baths/showers in building, [-] | |
| coefficient of simultaneous consumption of DHW in apartment with bath/shower, [-] | |
| average demand for heat power for DHW, [kW] | |
| time of DHW tank loading, [h] | |
| time of water heating in DHW tank, [h] | |
| number of peaks of DHW consumption per day, [-] | |
| daily DHW consumption, [dm3/day] | |
| annual DHW consumption, [m3/year] | |
| nominal value of heat power demand, [-] | |
| average daily DHW demand per person, [dm3/person·day] | |
| time of using DHW system, [h] | |
| hourly coefficient of irregularity, [-] | |
| number of days in the year, [day] | |
| useable energy demand for DHW preparation, [kWh/year] | |
| average annual efficiency of the DHW system, [-] | |
| correction factor of DHW temperature, [-] | |
| average seasonal efficiency of heat generation from the energy carrier or energy supplied to the heat source, [-] | |
| average seasonal efficiency of heat accumulation in capacitive elements of the DHW system, [-] | |
| average seasonal efficiency of heat transfer from the heat source to the tap valves, [-] | |
| average seasonal efficiency of heat use, [-] | |
| average daily DHW demand per 1 m2 of area, [dm3/m2·day] | |
| area of rooms with regulated temperature, [m2] | |
| correction factor of interruptions in the use of DHW, [-] | |
| real heat power for DHW, [kW] | |
| forecasted heat power for DHW by method Mi, [kW] | |
| relative error of DHW heat power forecasting by method Mi, [%] | |
| real DHW consumption, [m3/year] | |
| forecasted DHW consumption by method Mi, [m3/year] | |
| relative error of DHW consumption forecasting by method Mi, [%] |
References
- European Commission. Energy, Transport and Environment Indicators; Eurostat: Luxembourg, 2012. [Google Scholar]
- Pérez-Lombard, L.; Ortiz, J.; Coronel, J.F.; Maestre, I.R. A review of HVAC systems requirements in building energy regulations. Energy Build. 2011, 43, 255–268. [Google Scholar] [CrossRef]
- Barteczko-Hibbert, C.; Gillott, M.; Kendall, G. An artificial neural network for predicting domestic hot water characteristics. Int. J. Low Carbon Technol. 2009, 4, 112–119. [Google Scholar] [CrossRef]
- Negnevitsky, M.; Wong, K. Demand-Side Management Evaluation Tool. IEEE Trans. Power Syst. 2015, 30, 212–222. [Google Scholar] [CrossRef]
- International Energy Agency. World Energy Outlook 2018; IEA: Paris, France, 2018; p. 661. [Google Scholar]
- Bertelsen, N.; Vad Mathiesen, B. EU-28 Residential Heat Supply and Consumption: Historical Development and Status. Energies 2020, 13, 1894. [Google Scholar] [CrossRef]
- Marszal, A.J.; Heiselberg, P.; Bourrelle, J.S.; Musall, E.; Voss, K.; Sartori, I.; Napolitano, A. Zero Energy Building—A review of definitions and calculation methodologies. Energy Build. 2011, 43, 971–979. [Google Scholar] [CrossRef]
- European Council. Conclusions on 2030 Climate and Energy Policy Framework; European Council: Brussels, Belgium, 2014. [Google Scholar]
- EGD—Communication from the Commission to the European Parliament, the European Council, the Council, the European Economic and Social Committee and the Committee of the Regions. The European Green Deal, COM (2019) 640 Final; European Commission: Brussels, Belgium, 12 December 2019. [Google Scholar]
- Directive 2010/31/EU of the European Parliament and of the Council of 19 May 2010 on the Energy Performance of Buildings. Available online: https://eur-lex.europa.eu/legal-content/EN/TXT/?uri=celex%3A32010L0031 (accessed on 18 August 2022).
- Ratajczak, K.; Michalak, K.; Narojczyk, M.; Amanowicz, Ł. Real Domestic Hot Water Consumption in Residential Buildings and Its Impact on Buildings’ Energy Performance—Case Study in Poland. Energies 2021, 14, 5010. [Google Scholar] [CrossRef]
- Ahmed, K.; Pylsy, P.; Kurnitski, J. Hourly consumption profiles of domestic hot water for different occupant groups in dwellings. Solar Energy 2016, 137, 516–530. [Google Scholar] [CrossRef]
- Meyer, P.J.; Tshimankinda, M. Domestic hot water consumption in South African apartments. Energy 1998, 23, 61–66. [Google Scholar] [CrossRef]
- Pérez-Fargallo, A.; Bienvenido-Huertas, D.; Contreras-Espinoza, S.; Marín-Restrepo, L. Domestic hot water consumption prediction models suited for dwellings in central-southern parts of Chile. J. Build. Eng. 2022, 49, 104024. [Google Scholar] [CrossRef]
- De Santiago, J.; Rodriguez-Villalón, O.; Sicre, B. The generation of domestic hot water load profiles in Swiss residential buildings through statistical predictions. Energy Build. 2017, 141, 341–348. [Google Scholar] [CrossRef]
- Papakostas, T.K.; Papageorgiou, E.N.; Sotiropoulo, A.B. Residential hot water use patterns in Greece. Sol. Energy 1995, 54, 369–374. [Google Scholar] [CrossRef]
- Shan, Y.; Yang, L.; Perren, K.; Zhang, Y. Household Water Consumption: Insight from a Survey in Greece and Poland. Procedia Eng. 2015, 119, 1409–1418. [Google Scholar] [CrossRef]
- Terés-Zubiaga, J.; Pérez-Iribarren, E.; González-Pino, I.; Sala, J.M. Effects of individual metering and charging of heating and domestic hot water on energy consumption of buildings in temperate climates. Energy Convers. Manag. 2018, 171, 491–506. [Google Scholar] [CrossRef]
- Fuentes, E.; Arce, L.; Salom, J. A review of domestic hot water consumption profiles for application in systems and buildings energy performance analysis. Renew. Sustain. Energy Rev. 2018, 81, 1530–1547. [Google Scholar] [CrossRef]
- Nagpal, H.; Spriet, J.; Murali, M.K.; McNabola, A. Heat Recovery from Wastewater—A Review of Available Resource. Water 2021, 13, 1274. [Google Scholar] [CrossRef]
- Brunk, M.F.; Seybold, C. Dezentrale Abwasserwärmerückgewinnung zur Steigerung der Energieeffizienz von Gebäuden. In Endbericht; Fraunhofer IRB Verlag: Stuttgard, Germany, 2015; p. 70. [Google Scholar]
- Słyś, D.; Kordana, S. Financial analysis of the implementation of a Drain Water Heat Recovery unit in residential housing. Energy Build. 2014, 71, 1–11. [Google Scholar] [CrossRef]
- Lomet, A.; Suard, F.; Chèze, D. Statistical Modeling for Real Domestic Hot Water Consumption Forecasting. Energy Procedia 2015, 70, 379–387. [Google Scholar] [CrossRef]
- Lutz, J.D.; Xiaomin, L.; McMahon, J.E.; Dunham, C.; Shown, L.J.; McCure, Q.T. Modeling Patterns of Hot Water Use in Households; Lawrence Berkeley National Lab.: Berkeley, CA, USA, 1996. Available online: https://www.osti.gov/servlets/purl/821315 (accessed on 20 August 2022). [CrossRef]
- Gelažanskas, L.; Gamage, K.A.A. Forecasting Hot Water Consumption in Residential Houses. Energies 2015, 8, 12702–12717. [Google Scholar] [CrossRef]
- Maltais, L.G.; Gosselin, L. Energy management of domestic hot water systems with model predictive control and demand forecast based on machine learning. Energy Convers. Manag. X 2022, 15, 100254. [Google Scholar] [CrossRef]
- Delorme-Costil, A.; Bezian, J.J. Forecasting Domestic Hot Water Demand in Residential House Using Artificial Neural Networks. In Proceedings of the 2017 16th IEEE International Conference on Machine Learning and Applications (ICMLA), Cacun, Mexico, 18–21 December 2017. [Google Scholar] [CrossRef]
- Belany, P.; Hrabovsky, P.; Bednarcikova, K.; Kolkova, Z.; Kantova, N.C. Domestic Hot Water Heating Prediction with the Utilization of Artificial Neural Network. In Proceedings of the 2022 ELEKTRO, Kraków, Poland, 23–26 May 2022. [Google Scholar] [CrossRef]
- Lee, J.Y.; Yim, T. Energy and flow demand analysis of domestic hot water in an apartment complex using a smart meter. Energy 2021, 229, 120678. [Google Scholar] [CrossRef]
- Regulations of the Minister of Infrastructure of 6 November 2008 on the Methodology for Calculating the Energy Performance of a Building Constituting an Independent Technical and Operational Whole and the Method of Drawing up and Specimen Energy Performance Certificates (Journal of Laws 201/2008 Item 1240). Available online: http://isap.sejm.gov.pl/isap.nsf/DocDetails.xsp?id=wdu20082011240 (accessed on 18 August 2022).
- Regulation of the Minister of Infrastructure and Development of 27 February 2015 on the Methodology for Determining the Energy Performance of a Building or Part of a Building and Energy Performance Certificates (Journal of Laws of 2015. Item 376). Available online: http://isap.sejm.gov.pl/isap.nsf/DocDetails.xsp?id=WDU20140000888 (accessed on 18 August 2022).
- PN-92/B-01706/A1: 1999 Water Supply Installations. Design Requirements.Polski Komitet Normalizacyjny, Warsaw, Poland, 18 March 1999 (Revoked in May 2009). Available online: https://sklep.pkn.pl/pn-b-01706-1992-az1-1999p.html. (accessed on 18 August 2022).
- Albers, K.J. Recknagel, Taschenbuch für Heizung + Klimatechnik 2017/2018; Deutscher Industrieverlag: Munchen. Germany, 2016; p. 2600. [Google Scholar]
- Chmielewska, A.; Szulgowska-Zgrzywa, M.; Danielewicz, J. Domestic hot water consumption in multi-apartment buildings. In E3S Web of Conferences; EDP Sciences: Les Ulis, France, 2017; p. 17. [Google Scholar] [CrossRef]
- Knight, I.K.; Manning, N.; Swinton, M.; Hajo, M.R. European and Canadian non-HVAC electric and DHW load profiles for use in simulating the performance of residential cogeneration systems. Energy conservation in buildings and community systems programme. IEA Annex 2007, 42, 84. [Google Scholar]
- Szulgowska-Zgrzywa, M.; Stefanowicz, E.; Piechurski, K.; Chmielewska, A.; Kowalczyk, M. Impact of Users’ Behavior and Real Weather Conditions on the Energy Consumption of Tenement Houses in Wroclaw, Poland, Energy Performance Gap Simulation Based on a Model Calibrated by Field Measurements. Energies 2020, 13, 6707. [Google Scholar] [CrossRef]
- Szaflik, W. Projektowanie Instalacji Ciepłej Wody w Budynkach Mieszkalnych; Ośrodek Informacji Technika Instalacyjna w Budownictwie: Warszawa, Poland, 2011; pp. 138–144. [Google Scholar]
- Szaflik, W. Zużycie wody w budynkach mieszkalnych wielorodzinnych. Instal 2020, 10, 18–21. [Google Scholar]
- Jaszewska, M.; Szaflik, W. Zużycie ciepłej i zimnej wody w gospodarstwach domowych w Szczecinie w latach 2006–2019. Instal 2020, 4, 22–25. [Google Scholar]
- Gutierrez-Escolar, A.; Castillo-Martinez, A.; Gomez-Pulido, J.M.; Gutierrez-Martinez, J.-M.; Stapic, Z. A New System to Estimate and Reduce Electrical Energy Consumption of Domestic Hot Water in Spain. Energies 2014, 7, 6837–6855. [Google Scholar] [CrossRef]
- Edwards, S.; Beausoleil-Morrison, I.; Laperrière, A. Representative hot water draw profiles at high temporal resolution for simulating the performance of solar thermal systems. Sol. Energy 2015, 111, 43–52. [Google Scholar] [CrossRef]
- Parker, D.S.; Fairey, P.W.; Lutz, J.D. Estimating Daily Domestic Hot-Water Use in North American Homes. ASHRAE Trans. 2015, 121, 258–270. Available online: https://www.fsec.ucf.edu/en/Publications/pdf/FSEC-PF-464-15.pdf. (accessed on 18 August 2022).
- Aguirre, F.; Magnago, F.; Alemany, J. Constructing HotWater Load Profile: An Agent-Based Modeling Approach. IEEE Trans. Sustain. Energy 2019, 10, 790–799. [Google Scholar] [CrossRef]


Publisher’s Note: MDPI stays neutral with regard to jurisdictional claims in published maps and institutional affiliations. |
© 2022 by the authors. Licensee MDPI, Basel, Switzerland. This article is an open access article distributed under the terms and conditions of the Creative Commons Attribution (CC BY) license (https://creativecommons.org/licenses/by/4.0/).