Article

Reward–Penalty vs. Deposit–Refund: Government Incentive Mechanisms for EV Battery Recycling

1
College of Economics and Management, Shanghai Polytechnic University, Shanghai 201209, China
2
College of Economics and Management, Huainan Normal University, Huainan 232038, China
*
Author to whom correspondence should be addressed.
Energies 2022, 15(19), 6885; https://doi.org/10.3390/en15196885
Submission received: 1 August 2022 / Revised: 4 September 2022 / Accepted: 16 September 2022 / Published: 20 September 2022
(This article belongs to the Special Issue Advances in Energy and Resource Efficiency and Sustainable Policy)

Abstract

:
With the rapid development of electric vehicles (EVs), many EV batteries have entered the retirement stage, leading to increasing concerns about the impact of resource recycling and environmental sustainability. Some countries have successfully applied reward–penalty and deposit–refund mechanisms in similar fields, such as lead-acid and waste portable batteries. However, whether these mechanisms are conducive to collecting waste EV batteries is unclear. This study aims to comprehensively analyze the influence of reward–penalty and deposit–refund mechanisms in EV battery collection by developing a Stackelberg game theoretical model. In the model, the recycling enterprise is the leader and the EV manufacturer is the follower. Furthermore, the total social welfare is used as the indicator to select the optimal incentive mechanisms. The results show that (1) both mechanisms could improve collection rates and recycling enterprises’ profits, though the collection rate is lower under the reward–penalty mechanism than the deposit–refund mechanism unless the reward/penalty coefficient takes a very high value. (2) Regardless of government focus on increasing the sales volume of new EV batteries, collection rates, or social welfare, the boundary conditions of the choice of the two mechanisms are obtained. Additionally, the boundary conditions are related to the trade-in discount and refund coefficient. (3) Under the deposit–refund mechanism, even if the refund coefficient is less than 1, the mechanism may still lead to a higher collection rate than the reward–penalty mechanism.

1. Introduction

The use of electric vehicles (EVs) is not only an effective solution to the resource crisis and environmental pollution but also a requirement to meet fuel economy and emission standards [1]. It has become the most attractive alternative tool for the sustainable development of the transportation industry in the world [2,3,4]. EV batteries are among the essential core components of EVs, so the high demand for EVs is accompanied by a high demand for EV batteries [5].
Usually, when the capacity of EV batteries decreases to 70–80% of their original level, they can no longer meet the performance requirements of EVs [5,6]. However, EV batteries have a high value even after retirement. It is vital to alleviate the shortage of resources and realize green cycling if they can be effectively recycled. On 29 October 2020, the international environmental organization Greenpeace and China Environmental Protection Federation together proposed that passenger EV lithium-ion batteries will face a massive retirement of a total of 463 GWh by 2030 globally. The total value will reach RMB 100 billion, about 25 times more than in 2019 [7]. However, due to the imperfections in the current recycling and governmental regulatory systems, many EV batteries are in informal recycling channels. The formal recycling volume is less than 20% [8].
To promote collection of retired EV batteries, various countries have developed relevant recycling mechanisms. The reward–penalty and deposit–refund mechanisms have been widely used. As early as 2006, the European Union adopted Directive 2006/66/EC, which requires adoption of a reward–penalty mechanism for the recycling of portable batteries and mandates a minimum collection rate. The approach has received positive feedback from the market [9]. In addition, Germany uses a fund-and-deposit mechanism and mandates lead-acid batteries manufacturers to implement the “sell one, collect one” method in the sales and collection process. Consumers buy lead-acid batteries and return the old at the same time (otherwise, they need to pay a deposit). The mechanism makes the collection rate of lead-acid batteries close to 100%.
The American International Battery Association has also developed a deposit–refund mechanism. The mechanism requires consumers to pay a recycling deposit when purchasing a lead-acid battery. This forces consumers to hand over their end-of-life batteries to designated recycling points for recycling, which has enabled the collection rate of lead-acid batteries to reach 97% [10]. Norway and Sweden have a deposit–refund mechanism for complete retired vehicles. Through this mechanism, the collection rate of used cars in Sweden can reach between 90% and 99% and Norway can reach over 60%.
China has also been developing relevant collecting mechanisms for EV batteries in recent years. For example, Shenzhen, China, also proposes to adopt a deposit–refund mechanism to recycle EV batteries. The government provides a certain amount of EV battery recycling funds to retailers in advance, and offers subsidies based on the EV battery recycling situation [11,12,13]. Additionally, the National People’s Congress deputy suggested developing a reward–penalty mechanism according to the number or capacity of EV batteries. However, the currently proposed policy mechanisms remain at the level of guidance and recommendations. They do not form an effective binding force on the recycling market. Therefore, the collecting situation of waste EV batteries is still not optimistic.
To explore the above situations, we propose the following core research questions: (1) Are the reward–penalty and deposit–refund mechanisms effective for collection of waste EV batteries? (2) In different situations, which mechanisms should the government adopt to better facilitate the EV battery collection rate as well as social welfare?
The remainder of the paper is structured as follows. Section 2 presents a comprehensive literature review. Section 3 establishes and describes a game model on a closed-loop supply chain and Section 4 calculates the equilibrium results of the game model under the two mechanisms. Section 5 compares the equilibrium results from different perspectives and Section 6 details a numerical study. Finally, the main contents of this study and future research directions are summarized in Section 7.

2. Literature Review

2.1. EV Battery Recycling

Research on EV battery recycling has focused primarily on recycling technology, recycling network optimization design, economic benefits, and the environmental impact of recycling. Regarding recycling technology, Li and Zhao [14] proposed a closed-loop supply chain network model applicable to lithium-ion battery remanufacturing and analyzed the impact of remanufacturing technology and battery parameters on the supply chain. Harper et al. [15] assessed the current methods of recycling lithium batteries. They found that it is necessary to develop more efficient recycling technologies to improve the environmental and economic viability of recycling.
Ciez and Whitacre [16] compared the carbon emissions of three recycling technologies (thermal, wet, and anode recycling). They found that anode recycling has the potential to reduce emissions. Beaudet et al. [17] proposed that increased innovation and financial support are essential tools that can create a favorable economic and regulatory environment for the EV battery recycling market.
In terms of recycling network optimization design, Kannan et al. [18] developed a multi-level, multi-cycle closed-loop supply chain model based on waste lead-acid battery recycling. They analyzed the production, distribution, disposal, and recycling levels of different facilities. Wang et al. [19] considered an EV battery recycling network model based on carbon emission constraints for handling different quality levels at different disposal centers. They concluded that transportation cost, carbon tax, and the number of used batteries are the three main factors affecting the optimization of the recycling network.
In terms of economic benefits and environmental impact, Li et al. [20] developed a two-channel recycling game model. They concluded that improving environmental benefits under government governance mechanisms depends on subsidies and consumers’ preferences for channels. Gu et al. [21] studied the optimal pricing strategy for the closed-loop supply chain of EV batteries. They found that the recycling of used EV batteries is detrimental to the profits of EV battery manufacturers. Qiao et al. [22] discussed the economic and environmental benefits of EV recycling in China. They suggested that the recycling of battery materials will become even more valuable as the EV market grows by leaps and bounds.

2.2. Closed-Loop Supply Chain Incentives

The government has played an essential role in forming and operating closed-loop supply chains [23]. Therefore, it is essential to introduce government incentives in closed-loop supply chains [24]. Regarding the research on the incentive mechanism of the closed-loop supply chain, domestic and foreign scholars mainly focus on research subsidy, reward–penalty, and deposit–refund mechanisms. Based on the existing studies, with the gradual regulation and expansion of the recycling market, there are limitations to the contribution of the subsidy mechanism. For example, when contrasted with a single subsidy mechanism, a hybrid subsidy mechanism is more advantageous in promoting recycling. However, it also brings higher costs [25]. The marginal effect of government subsidies is not significant in the high quality of collected products [26]. Moreover, when there is a gap between the subsidy cap and the optimal subsidy to maximize social welfare, a high subsidy does not necessarily lead to greater social welfare [27].
In terms of the reward–penalty mechanism, Wang et al. [28] have found that it can motivate companies to expand the production of environmentally friendly products and reduce pollutant emissions. Zhang et al. [29] compared two biofuel companies. They concluded that whether a company is subject to punitive regulation is a crucial determinant of its waste collection rate. Li et al. [30] and Wang et al. [31] found that the government’s implementation of a reward–penalty mechanism is conducive to increasing the profits of e-waste recycling enterprises and manufacturers. Tang et al. [12] concluded that the reward–penalty mechanism is more appropriate for models with higher collection rates. They suggested that the government must set a reasonable minimum collection rate. Song et al. [32] uses the social analysis network method to analyze the industrial symbiosis in Gujiao, and found that formulating more preferential policies is crucial.
In terms of the deposit–refund mechanism, the earliest dates back 35 years [33]. Bohm [34] first proposed that a deposit–refund mechanism could reduce pollution levels and promote environmental protection. Subsequently, the deposit–refund mechanism was widely used to collect packaging such as beverage containers, beer bottles, and used tires [10]. Buffington [35] explored a voluntary deposit–refund mechanism and it proved to be effective in reducing operating costs, increasing collection rates.
Gong et al. [36] explored a closed-loop supply chain of a manufacturer and an online platform. They concluded that implementing a deposit–refund mechanism has advantages for online platforms. Wang et al. [24] explored government implementation of deposit–refund mechanisms for manufacturers and collection companies, respectively. They concluded that collection rate and supply chain profits are higher with a deposit–refund mechanism for collection companies.
With the development of the deposit–refund mechanism, the research area began to expand to include home appliances and e-waste. For example, Xie et al. [37] explored the impact of a deposit–refund mechanism under dual-channel competition for e-waste. They found that if the deposit–refund amount for consumers is high enough, e-waste can be fully processed and recycled by formal recyclers. Linderhof et al. [33] explored implementing a mandatory deposit–refund mechanism for appliance and battery recycling consumers. They concluded that the deposit–refund mechanism could increase the collection rate for both products. Wang et al. [13] comprehensively analyzed the influence of the deposit–refund mechanism on household appliances and EVs.

2.3. Trade-In Strategy

The trade-in strategy is another essential theme related to this study. In the modern manufacturing industry, the trade-in strategy is widely implemented by offering trade-in discounts to encourage customers to return their old products. The approach has become a standard business practice [38,39]. Research has revealed that the trade-in strategy can increase willingness of consumers to pay for new products [40,41] and attract consumers to repeat purchases [42,43,44]. In addition, some scholars have also analyzed from the perspective of environmental benefits. For example, Miao et al. [43] compared three trade-in strategies. When the marginal effect of the product on the environment is more significant in the continued use phase, they found that the trade-in strategy could promotes environmental benefits. Subsequently, Miao et al. [45] further analyzed the pricing decisions and optimal trades for new and remanufactured products in the presence of “carbon tax and cap-and-trade” regulations. Zhang and Zhang [38] investigated the effects of consumers’ purchase behavior on the environment under the trade-in strategy.
The above literature plays a vital role in this study. Both reward–penalty and deposit–refund mechanisms are studied by domestic and foreign scholars. However, most focus on a single incentive mechanism. Additionally, few studies combine the trade-in strategy with incentives and apply it to EV battery collection.
Based on the existing literature, this study innovatively compares the effects of the reward–penalty and deposit–refund mechanisms on the sale quantity of EV batteries, the collection rate of waste EV batteries, the economic benefits, and social welfare. In addition, we also explore the impact of the trade-in strategy implemented by the EV manufacturer for consumers on the optimal decision.

3. Stackelberg Game Model

Local governments, such as China, are promoting the implementation of extended producer responsibility (EPR) policies among EV manufacturers and raising attention to the residual value of waste EV batteries (e.g., cobalt, nickel). Closed-loop supply chains for used EV batteries are becoming more common. In this supply chain, EV manufacturers purchase EV batteries from battery manufacturers and then assemble them in EVs for sale to consumers in the market. At the end of the EV battery lifecycle, consumers go to the repair points of EV manufacturers to replace the batteries. The EV manufacturers collect the replaced waste batteries and sell them to the corresponding recycling enterprises. These enterprises carry out the process of discharging, dismantling, separating, and extracting to recycle the waste batteries. The extracted regenerated materials are sold to the battery manufacturers to enter the battery production process as alternative materials. Here, the EV manufacturers play a key role in the recycling of used batteries, and the recycling strategy they adopt (e.g., recycling promotion, trade-in discount strength) directly affects the collection amount of waste batteries. Therefore, in this model, we focus on an EV manufacturer, the nearest node in the supply chain to consumers, and the responsible party that local governments focus on in the EPR policies. We also analyze the decision of a recycling enterprise to reflect the impact of the residual value of waste EV batteries on the EV manufacturer’s collection decision. The closed-loop supply chain process is shown in Figure 1.
In our model, the EV manufacturer purchases new EV batteries at cost c 1 per unit (including purchase price and transportation costs, etc.) and sells them in the EV market at price p n per unit. Here, as a new EV with an EV battery, the market capacity of the EV battery is similar to that of the new EV [12]. In replacing the battery, consumers are also price-sensitive, so we use the inverse demand function to express the demand for new EV batteries [46], i.e., D ( p ) = a p n where a is the potential market demand for the new EV batteries
Similar to the previous literature [13,47,48], the EV manufacturer attempts to offer a trade-in strategy with effort cost b τ 2 to encourage consumers to return the waste EV batteries where b is the effort cost coefficient. In this situation, the consumers could receive a trade-in discount β for purchasing a new EV battery if they return the retired one. After that, the EV manufacturer will transfer the waste batteries collected to the recycling enterprise at a price of p r per unit, and then the latter discharges, disassembles, separates, and extracts for recycling. The recycling cost is c 2 per unit, and the residual value of the waste EV batteries is f per unit. The notations are summarized in Table 1.
To better focus the research questions in this paper, we make the following assumptions about the model. First, both the EV manufacturer and the recycling enterprise are completely rational and risk-neutral, and the information in the market is perfectly informative [12]. Both the EV manufacturer and the recycling enterprise aim to maximize their own benefits. Although the batteries of different EV types differ in capacity, shape, and size, we study only one type of battery to avoid complexity in the model [4,11,12,21]. This is also in line with the trend of unified production standards for EV batteries in the future. Considering that the secondary use of batteries is very difficult and is not widely practiced in the current market, this model focuses on the recycling of batteries, i.e., all collected EV batteries go through the process of being discharged, dismantled, and extracted from recycled materials. Finally, c 2 < f must be satisfied; otherwise, the recycling enterprise has no desire to recycle. Similarly, p r < p n is assumed to indicate that the EV manufacturer is willing to collect the waste batteries.
In addition, the government attempts to offer proper incentives (either reward–penalty or deposit–refund mechanisms) to motivate the EV manufacturer to improve the waste batteries’ collection volume as much as possible. With the reward–penalty mechanism, the primary method for the government is to set a collection rate baseline for the EV manufacturer (i.e., τ 0 ) and a reward/penalty coefficient (i.e., s ). If the EV manufacturer’s collection rate exceeds the baseline (i.e., τ > τ 0 ), the government gives a corresponding reward for the excess, and the reward is s · ( τ τ 0 ) · Q ; however, if the EV manufacturer’s collection is less than the baseline (i.e., τ < τ 0 ), the government penalty for the unmet portion is s · ( τ 0 τ ) · Q . In this situation, the profits of the EV manufacturer and the recycling enterprise are
m R = ( p n c 1 ) · ( a p n ) + ( ( 1 β ) · p n c 1 + p r ) · τ Q + s · ( τ τ 0 ) · Q b τ 2
and
r R = ( f p c 2 ) · τ Q
Moreover, the government’s concern for social welfare mainly consists of the economic benefits and environmental impacts (environmental benefits and environmental damage) [4,49,50]. Social welfare, then, is
g o v R = m R + r R + e b · τ Q e p · ( 1 τ ) · Q s · ( τ τ 0 ) · Q
Further, with the deposit–refund mechanism, the government collects a certain deposit from the EV manufacturer when it sells the new EV (for one unit sold, the deposit is t), and promises to refund the corresponding amount when the EV manufacture collects some waste batteries at the end of the battery’s lifecycle (i.e., for one unit collected, k t is returned). Then, the EV manufacturer’s profit, the recycling enterprise’s profit, and social welfare are, respectively,
m D = ( p n c 1 t ) · ( a p n ) + ( ( 1 β ) · p n c 1 + p r + k t ) · τ Q b τ 2 ,
r D = ( f p r c 2 ) · τ Q ,
and
g o v D = m D + r D + e b ·   τ   Q e p · ( 1 τ ) · Q + t · ( a p n ) k t τ Q .  
Based on any of the mechanisms, the recycling enterprise makes decisions first, and its decision problem is to determine the optimal collection price per unit for the waste EV batteries (i.e., p r ) to maximize its own profit. Then, the EV manufacturer decides on the optimal selling price of the new EV batteries (i.e., p n ) and collection rate of the waste EV batteries (i.e., τ ) to maximize its own profit. Finally, the government will determine the better incentive mechanism by comparing the social benefits under the different mechanisms.

4. Equilibrium Analysis

4.1. Reward–Penalty Mechanism

With the reward–penalty mechanism, according to Equations (1) and (2), we use the inverse derivation method to find the equilibrium solution of the Stackelberg game between the EV manufacturer and the recycling enterprise, as shown in Proposition 1. The proofs of all propositions in this paper can be found in the Supplementary Materials.
Proposition 1.
Based on  4 b Q 2 · ( 1 β ) 2 > 0 , the equilibrium solution under the reward—penalty mechanism is  ( p n R ,   τ R , p r R ) where the EV manufacturer’s price is
p n R = 1 4 · ( 2 · ( a + c 1 ) + Q 2 · ( 1 β ) · ψ + 2 s 4 b ( 1 β ) 2 · Q 2 ) ,
the actual collection rate is
τ R = ( ψ + 2 s ) · Q 2 · ( 4 b ( 1 β ) 2 · Q 2 ) ,
and the recycling enterprise’s recycling price is
p r R = 1 4 · ( ψ + 2 ( 1 + β ) · c 1 2 a · ( 1 β ) 2 s ) .
Here,
ψ = 2 · ( f c 2   ) + ( 1 β ) · a ( 1 + β ) · c 1 .
According to the equilibrium solution under the reward–penalty mechanism, we discuss the effect of the reward/penalty coefficient as follows.
Proposition 2.
Under the reward—penalty mechanism, based on  4 b Q 2 · ( 1 β ) 2 > 0 , we have  p n R s > 0 , τ R s > 0 , and  p r R s < 0 .
Proposition 2 shows that, as the reward/penalty coefficient increases, the collection rate increases, which means that the EV manufacturer will actively collect the waste EV batteries to increase the government’s rewards or reduce the penalty. Considering that a higher collection rate means a higher collection cost, the EV manufacturer must raise the selling price to balance the cost caused by improving the collection rate. Moreover, as the collection rate increases, the number of waste batteries the EV manufacturer collected also increases. In this situation, the recycling enterprise may lower the recycled price to reduce the procurement costs.
Moreover, by substituting p n R , τ R , and p r R into Equations (1)–(3), the profits of the EV manufacturer and the recycling enterprise under the reward–penalty mechanism are obtained, i.e.,
m R * = 1 4 · ( a c 1 ) 2 s τ 0 Q + ( ψ + 2 s ) 2 · Q 2 16 · ( 4 b ( 1 β ) 2 · Q 2 )
r R * = Q 2 · ( ψ + 2 s ) 2 8 · ( 4 b ( 1 β ) 2 · Q 2 )
With Equations (10) and (11) in hand, the social welfare under the reward–penalty mechanism is
g o v R * = 1 16 · ( 4 · ( a c 1 ) 2 16   e p Q + 8 Q 2 · ( e b + e p s ) · ( 2 s + ψ ) + 3 Q 2 · ( 2 s + ψ ) 2 4 b ( 1 β ) 2 · Q 2 ) .
Another important theory in this article is the trade-in strategy, which directly affects the collection enthusiasm of the EV manufacturer. Therefore, the trade-in discount is selected as a parameter to explore the effect of the two different mechanisms. Based on Proposition 1 and Equations (10)–(12), the effect of the trade-in discount set by the EV manufacturer is discussed, as shown in Proposition 3.
Proposition 3.
Under the reward–penalty mechanism, based on  4 b Q 2 · ( 1 β ) 2 > 0 , we have  τ R β < 0 and  p r R β > 0 . Moreover, if 0 < β < min { 1 ,   Γ 1 ,   Γ 2 } , we have  p n R β < 0 , m R * β < 0 , and  r R * β < 0 where Γ 1 = 1 + 2 · f + s c 1 c 2 a + c 1 and Γ 2 = 1 + 2 · b · ( a + c 1 ) + b 2 · ( a + c 1 ) 2 b Q 2 · ( f + s c 1 c 2 ) 2 Q 2 · ( f + s c 1 c 2 ) .
Proposition 3 shows that, under the reward–penalty mechanism, as the trade-in discount increases, the collection rate decreases, and the recycling price increases. This suggests that the adoption of the trade-in strategy reduces the marginal profit of the EV manufacturer in selling new EV batteries. Leading to a lack of enthusiasm to collect the waste batteries. In this situation, the recycling enterprise must increase the recycling price to promote the incentive of the EV manufacturer and then increase the collection quantity.
In addition, an interesting phenomenon is that, in a special area, the selling price of new batteries decreases with the increase in the trade-in discount, which results in a reduction in profits for the EV manufacturer and, in turn, for the recycling enterprise. This means that increasing the trade-in discount is likely to result in a loss of profits for both the EV manufacturer and the recycling enterprise.

4.2. Deposit–Refund Mechanism

Similar to the situation with the reward–penalty mechanism, according to Equations (4) and (5), the Stackelberg equilibrium with the deposit–refund mechanism is solved, as shown in Proposition 4.
Proposition 4.
With the deposit–refund mechanism, the Stackelberg equilibrium is  ( p n D ,   τ D , p r D ) where the EV manufacturer’s price is
p n D = 1 4 · ( 2 · ( a + c 1 + t ) + Q 2 · ( 1 β ) · ψ + ( 1 β + 2 k ) · t 4 b ( 1 β ) 2 · Q 2 ) ,
the actual collection rate is
τ D = Q 2 · ψ + ( 1 β + 2 k ) · t 4 b ( 1 β ) 2 · Q 2 ,
and the recycling enterprise’s recycling price is
p r D = 1 4 · ( ψ + 2 ( 1 + β ) · c 1 2 a · ( 1 β ) ( 1 β + 2 k ) · t ) .
Moreover, substituting p n D , τ D , and p r D into Equations (4)–(6), we could solve the profits of the EV manufacturer and recycling enterprise, which are
m D * = 1 4 · ( a c 1 ) 2 + 1 4 · t · ( t 2 · ( a c 1 ) ) + Q 2 · ( ψ + ( 1 β + 2 k ) · t ) 2 16 · ( 4 b ( 1 β ) 2 · Q 2 )
and
r D * = Q 2 · ( ψ + ( 1 β + 2 k ) · t ) 2 8 · ( 4 b ( 1 β ) 2 · Q 2 ) .
Then, based on Equations (16) and (17), the social welfare with the reward–penalty mechanism is
g o v D * = 1 16 · ( 4 · ( a c 1 ) 2 16   e p Q 4 t 2 + Q 2 · ( t + 2 k t t β + ψ ) · ( 8 · ( e b + e p ) + 3 ψ ( 1 β + 2 k ) · t ) 4 b ( 1 β ) 2 · Q 2 )
Based on Proposition 4, with the deposit–refund mechanism, the effect of the deposit amount per unit for the new EV batteries is discussed, as shown in Proposition 5.
Proposition 5.
Under the deposit–refund mechanism, based on  4 b Q 2 · ( 1 β ) 2 > 0 , we have   p n D t > 0 , τ D t > 0 , and  p r D t < 0 .
Proposition 5 illustrates that, under the deposit–refund mechanism, as the deposit amount increases, the EV manufacturer increases the selling price of the new batteries to offset the deposit collected by the government; at the same time, the manufacturer also actively collects the waste batteries to improve the collection rate to get the refund from the government. Moreover, as the collection rate increases, the number of waste batteries collected by the EV manufacturer increases, and then the recycling enterprise must reduce the recycling price accordingly to reduce the procurement cost, as occurs under the reward–penalty mechanism.
Proposition 6.
Under the deposit–refund mechanism, based on  4 b Q 2 · ( 1 β ) 2 > 0 , we have  τ D β < 0 and p r D β > 0 , and, if 0 < β < min { 1 ,   Γ 3 ,   Γ 4 } , we have  p n D β < 0 , m D * β < 0 , and  r D * β < 0 where Γ 3 = 1 + 2 · f + k · t c 1 c 2 a + t + c 1 and  Γ 4 = 1 + 2 · b · ( a + c 1 + t ) + b 2 · ( a + c 1 + t ) 2 b Q 2 · ( f + k · t c 1 c 2 ) 2 Q 2 · ( f + k · t c 1 c 2 ) .
The results of Proposition 6 are similar to Proposition 3. Both indicate that an increase in the trade-in discount reduces the collection rate of the waste EV batteries and, in the special area, also hurts the profits of both the EV manufacturer and the recycling enterprise.

5. Comparisons and Analysis

In this section, the equilibrium results under the two mechanisms are compared from three perspectives: the sales market for the new batteries, the collection and recycling of waste batteries, and social welfare from the government’s perspective.

5.1. Sales of the New Batteries

As the environmental benefits of driving EVs are increasingly apparent, some countries, such as China and Germany, are beginning to focus on the EVs’ environmental benefits over their lifecycle. Consumers are encouraged to replace the battery such as using trade-in strategies to extend the lifecycle of their own EVs when the original battery capacity cannot meet the travel demand. In other words, from an environmental perspective, it is important to promote the sale of new EV batteries instead of just scrapping the whole EV. Therefore, we must answer the question, “Which mechanisms of reward–penalty or deposit–refund will lead to more new battery sales?”
According to Propositions 1 and 4, the EV manufacturer’s sale quantity is q R = a p n R + τ R Q under the reward–penalty mechanism and is q D = a p n D + τ D Q under the deposit–refund mechanism. By simplifying, we have
q R = a 1 2 · ( a + c 1 ) + 1 + β 4 · ψ + 2 s 4 b ( 1 β ) 2 · Q 2 · Q 2 ,
and
q D = a 1 2 · ( a + c 1 + t ) + 1 + β 4 · ψ + ( 1 β + 2 k ) · t 4 b ( 1 β ) 2 · Q 2 · Q 2 .  
Based on Equations (19) and (20), we compare the new EV batteries’ sale quantities under the two mechanisms, and the results are dependent on the reward/penalty coefficient ( s ) and the deposit amount ( t ), as shown in Proposition 7.
Proposition 7.
Based on  4 b Q 2 · ( 1 β ) 2 > 0 , if 0 < s < χ 1 · t , we have  q R < q D ; if s = χ 1 · t , we have  q R = q D ; and if s > χ 1 · t , we have  q R > q D . Here,  χ 1 = k + Q 2 · ( 3 4 β + β 2 ) 8 b 2 Q 2 ( 1 + β ) , and  χ 1 increases with  k .
If the reward/penalty coefficient is small and the deposit amount is high such that s < χ 1 · t , the implementation of the deposit–refund mechanism could lead to a higher sales volume of the new batteries; otherwise, the implementation of the reward–penalty mechanism can lead to higher sales volume. Here, the value of the boundary χ 1 is critical, and it increases with the refund coefficient ( k ) in the deposit–refund mechanism. Therefore, if the government wants to improve the sales volume of the new EV batteries, it could choose a suitable incentive mechanism by regulating the values of the reward/penalty coefficient ( s ), the deposit amount ( t ), and the refund coefficient ( k ).

5.2. Collection and Recycling of Waste Batteries

With the widespread use of EVs, the number of waste EV batteries has increased dramatically. EV batteries contain nickel, cobalt, lithium, and other heavy metal elements while the electrolyte itself or its conversion products contain some harmful substances. If the replaced waste EV batteries are not formally or properly collected and recycled, then, it will lead to serious environmental pollution and waste of resources. Therefore, we now focus on the recycling market and analyze which incentive mechanism can lead to a higher collection volume and could raise recycling enterprises’ profits.
Proposition 8.
Based on  4 b Q 2 · ( 1 β ) 2 > 0 , if  0 < s < χ 2 · t , we have τ R < τ D , p r R > p r D , and  r R * < r D * ; if  s = χ 2 · t , we have  τ R = τ D , p r R = p r D , and r R * = r D * ; and if  s > χ 2 · t , we have  τ R > τ D , p r R < p r D , and  r R * > r D * . Here,  χ 2 = k + 1 β 2 .
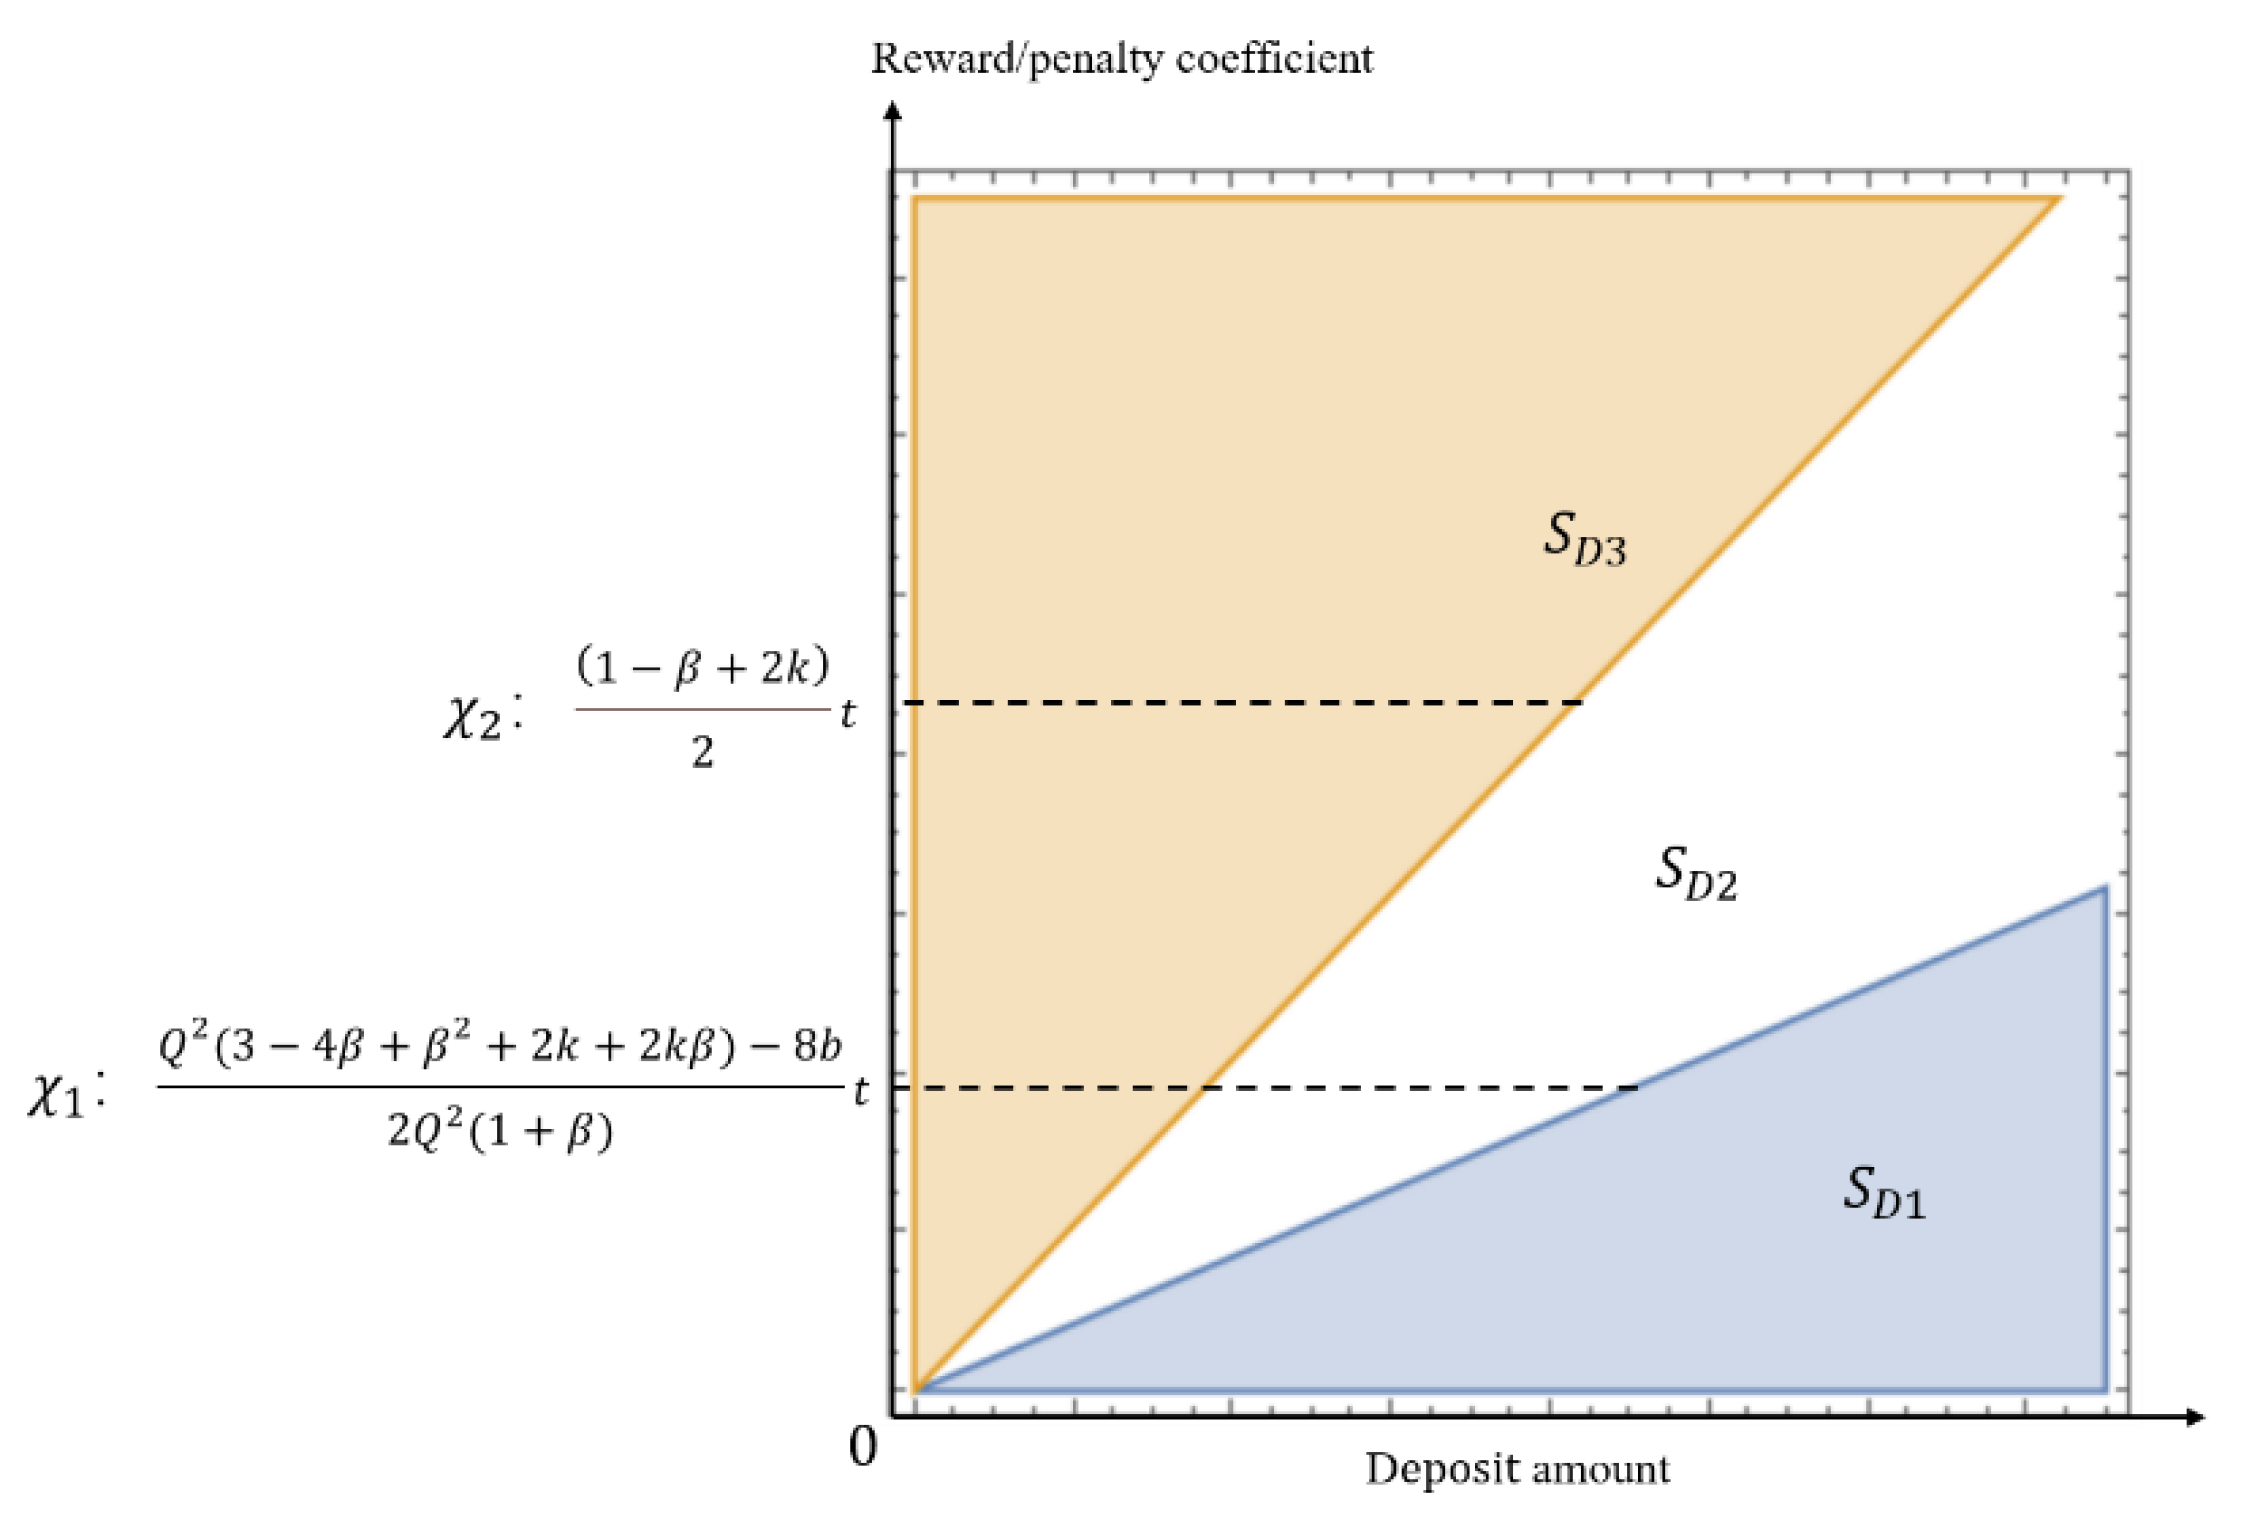
Based on 4 b Q 2 · ( 1 β ) 2 > 0 , we have χ 1 χ 2 = Q 2 · ( 1 β ) 2 4 b Q 2 ( 1 + β ) < 0 , then χ 1 < χ 2 . Therefore, the results of Propositions 7 and 8 are integrated in Table 2. Figure 2 is drawn based on Table 2, specifying three regions (i.e., S D 1 , S D 2 , and S D 3 ) to visually represent the results of our comparisons.
According to Table 2 and Figure 2, in the region S D 1 ( 0 < s < χ 1 · t ), the collection rate and the recycling enterprise’s profit under the reward–penalty mechanism are lower than those under the deposit–refund mechanism. In the region S D 2 ( χ 1 · t < s < χ 2 · t ), the collection rate and the recycling enterprise’s profit with the reward–penalty mechanism are lower than those under the deposit–refund mechanism; the collection price with the reward–penalty mechanism is greater than that under the deposit–refund mechanism. In the region S D 3 ( s > χ 2 · t ), the collection rate and the recycling enterprise’s profit are greater under the reward–penalty mechanism than under the deposit–refund mechanism; the recycling price is lower under the reward–penalty mechanism than under the deposit–refund mechanism. Here, the boundary coefficients χ 1 and χ 2 decrease with the trade-in discount and increase with the refund coefficient ( k ).
Next, to clearly compare the two mechanisms, a special case is discussed here, i.e., the reward/penalty coefficient under the reward–penalty mechanism is equal to the deposit amount under the deposit–refund mechanism. The scenario could be found in Shanghai and Shenzhen, China. The government of Shanghai gives a subsidy/reward of RMB 1000 (the unit of money involved in this research is RMB, RMB 1 = USD 0.1449) for each set of waste EV batteries collected [51]; the government of Shenzhen adopts the deposit–refund mechanism for selling new EVs at a rate of 20 RMB/kWh for EV battery recycling and disposal funds [52]. Since the capacity of an EV battery is about 15 to 60 kWh [53], and we refer to [12], the amount of deposit in Shenzhen is close to the amount of subsidy in Shanghai. Given this situation, we discuss the collection rate of the waste batteries as follows.
Proposition 9.
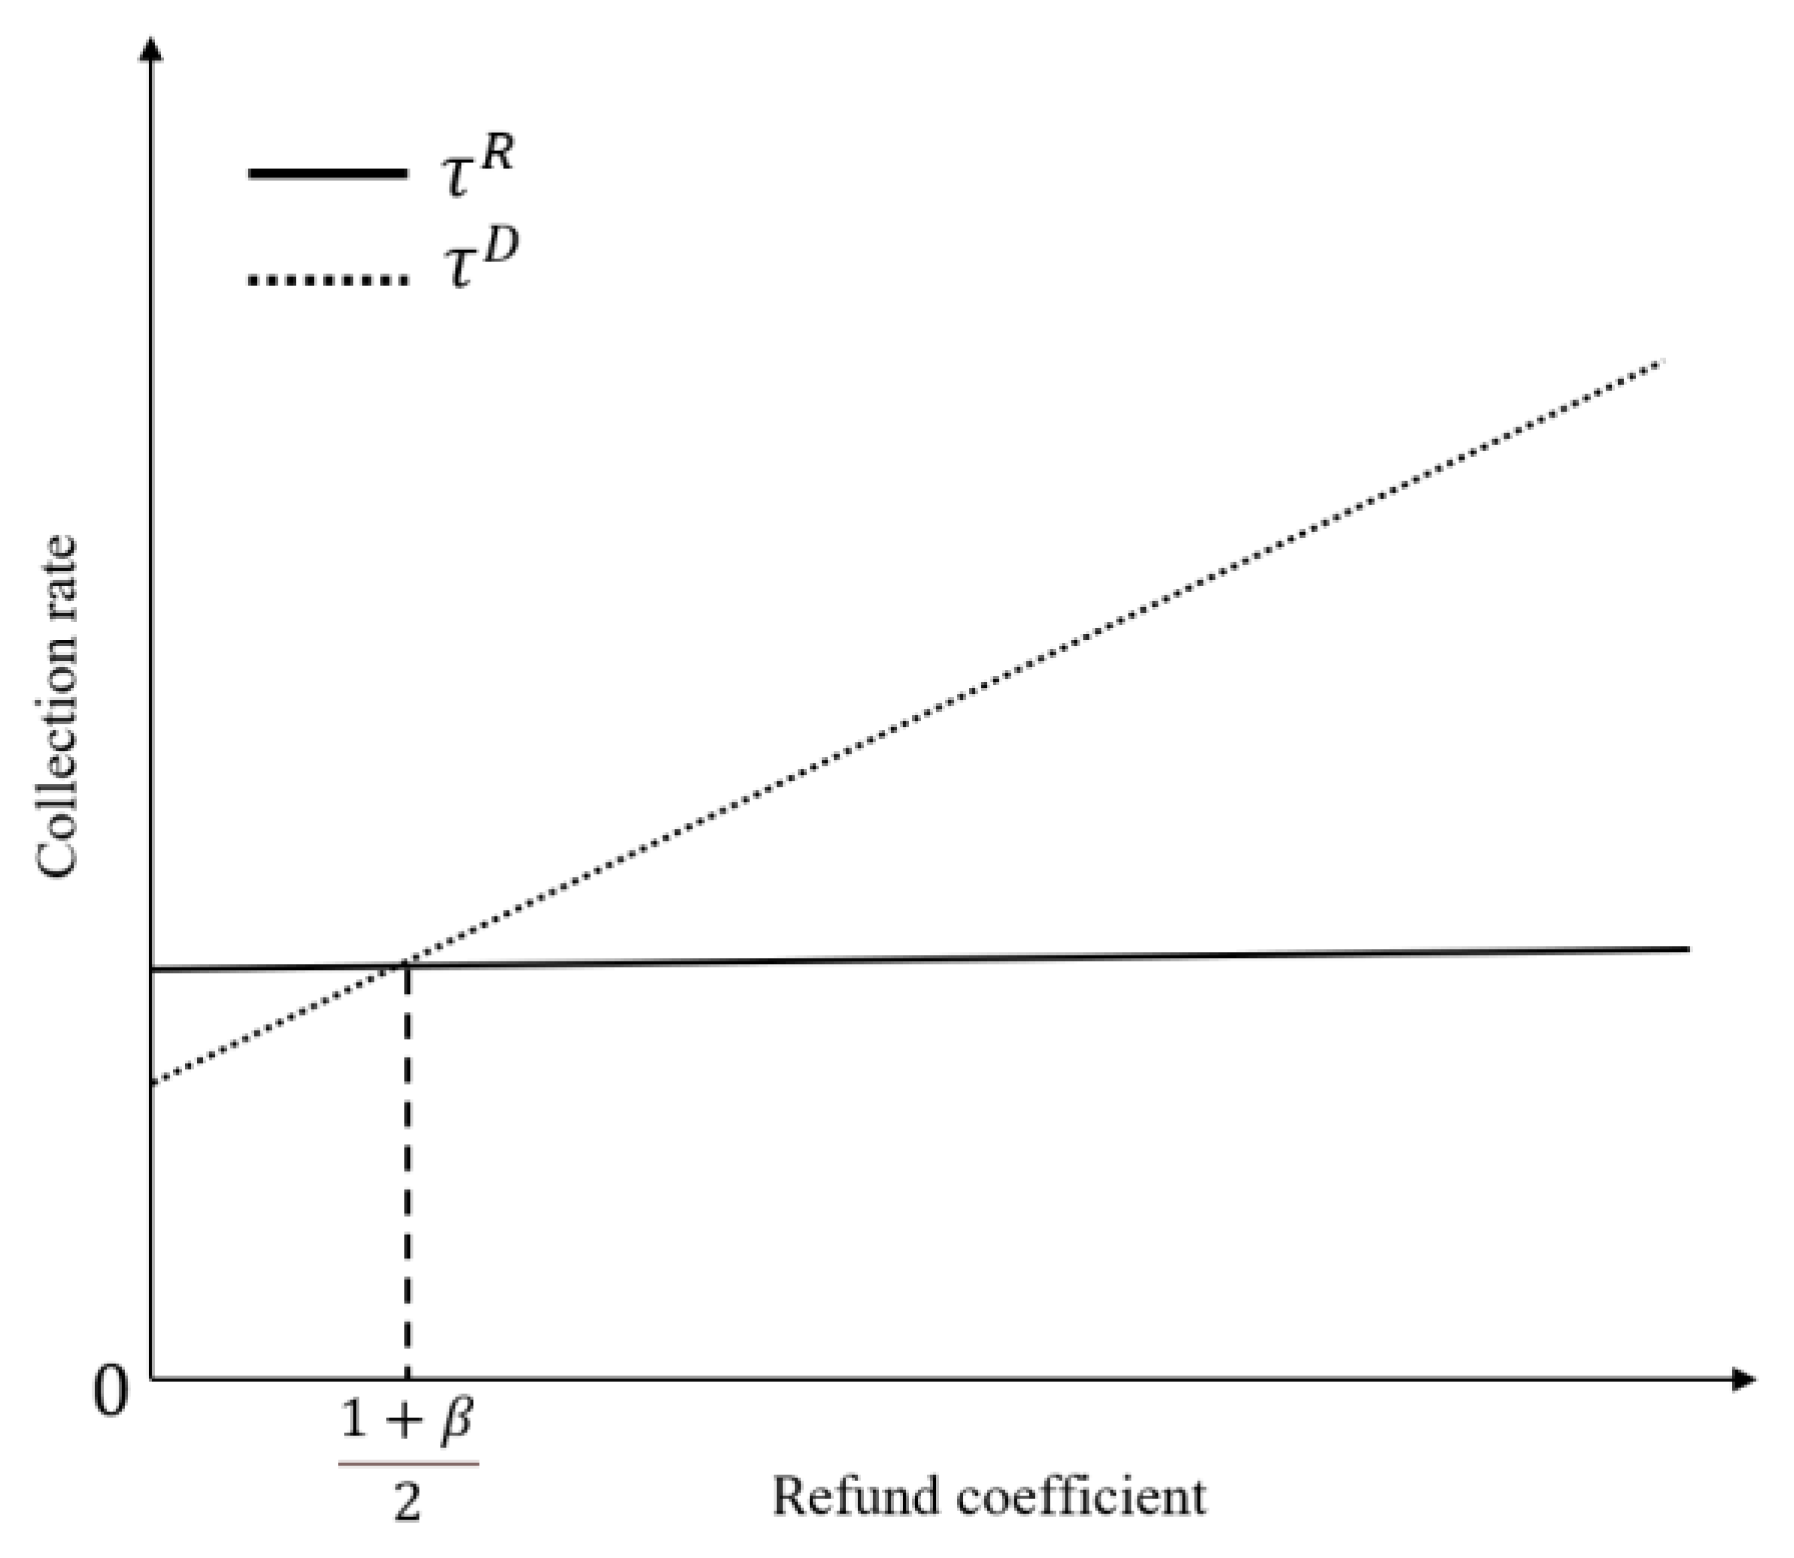
Based on  4 b Q 2 · ( 1 β ) 2 > 0 and  s = t , if 0 < k < 1 + β 2 , we have  τ R > τ D ; if  k = 1 + β 2 , we have  τ R = τ D ; and if  k > 1 + β 2 , we have  τ R < τ D .
Proposition 9 illustrates that, when the government sets the reward/penalty coefficient under the reward–penalty mechanism equal to the deposit amount under the deposit–refund mechanism, the result of comparing the collection rate of the waste EV batteries under the two mechanisms depends entirely on the refund coefficient and the trade-in discount, as shown in Figure 3. In the actual cases, the trade-in discount is very small and does not change considerably. Therefore, the main factor affecting the collection rate here is the refund coefficient. The refund coefficient directly affects the deposit–refund amount received by the government. Therefore, under the deposit–refund mechanism, with the increase in the refund coefficient, the collection rate gradually increases. If the refund coefficient is little such that k < 1 + β 2 , it means that the deposit-refund amount is small. At this time, the EV manufacturer’s collecting enthusiasm is not as high as that under the reward–penalty mechanism. Therefore, the collection rate under the reward–penalty mechanism is higher than that under the deposit–refund mechanism. However, as the refund coefficient gradually increases, when it exceeds a critical point, the collection rate under the deposit–refund mechanism begins to exceed that under the reward–penalty mechanism. Even if the refund coefficient is less than 1, as long as k > 1 + β 2 is satisfied, the deposit–refund mechanism is more effective than the reward–penalty mechanism at collecting as many waste batteries as possible. This conclusion is similar to the plan proposed by Shenzhen, China (“Shenzhen 2018 Financial Support Policy for the Promotion and Application of New Energy Vehicles”): a special provision for EV battery recycling and disposal funds should be made at the standard of 20 RMB/kWh. For those who have accrued funds for the collection and disposal of waste EV batteries as required, 50% of the accrued amount will be subsidized [51].
This conclusion shows that the government’s mechanism of charging deposits in advance can stimulate the EV manufacturers more to collect waste EV batteries. This provides an idea for the government in terms of determining the refund coefficient.

5.3. Social Welfare

Compared with collection amount, collection rate, and the recycling enterprise’s profit, social welfare embodies a broader perspective. It is selected as a comparative indicator to further explore the effect of the two different mechanisms. According to Equations (12) and (18), Proposition 10 is obtained as follows.
Proposition 10.
Based on  4 b Q 2 · ( 1 β ) 2 > 0 , if  0 < t < t 1 or t > t 2 , we have  g o v R * > g o v D * ; if  t 1 < t < t 2 , we have  g o v R * < g o v D * . Here,
t 1 = Q 2 · A · ( 1 + 2 k β ) Q 4 · A · ( 1 + 2 k β ) 2 4 · L 2 · Q 2 · s · ( A s ) L 2 , t 2 = Q 2 · A · ( 1 + 2 k β ) + Q 4 · A · ( 1 + 2 k β ) 2 4 · L 2 · Q 2 · s · ( A s ) L 2 , A = 4 e p + 4 e b + ψ ,
and
L = 16 b + Q 2 ( 4 k · ( 1 β + k ) 3 ( 1 β ) 2 ) .
Proposition 10 illustrates that if the deposit amount is set to be either too high or too low, social welfare is greater under the reward–penalty mechanism than under the deposit–refund mechanism; if the deposit amount is set to be a moderate value within the interval [ t 1 ,   t 2 ] , the reverse is true.

6. Numerical Study

In this section, we further analyze the effects of the reward coefficient, the deposit amount, and the refund coefficient on the collection rate of waste batteries, the profits of manufacturers and recycling enterprises, and the social welfare with the help of some special values taken.

6.1. Data Collection

According to some related literature, the relevant data on EV battery recycling are collected and are shown in Table 3. Here, the Beijing New Energy Vehicle (BJEV) is taken as an example. Public data show that the market sales of the BJEV in 2021 reached 2.61 × 10 4 . To simplify the calculation, we uniformly adjust the data unit to 10,000 (as below). The potential market size of the new EV batteries is 2.61, i.e., a = 2.61 .
According to the Annual Production and Sales Snapshot of BJEV (2019–2021, three-year average sales), we estimate that the potential volume of the waste EV batteries in 2021 is 6.75 × 10 4 , i.e., Q = 6.75 . The production cost of the EV battery capacity is about 1.2–1.5 RMB/Wh [54], and the EV battery capacity is close to 60 kWh, as mentioned previously. We estimate, then, that the EV manufacturer’s purchasing cost for an EV battery is 7.2 × 10 4 , i.e., c 1 = 7.2 .
According to [55], the uniform residual value of the waste EV batteries is 2.9 × 10 4 , i.e., f = 2.9 . Referring to [4], the target collection rate set by the government is τ 0 = 20 % , and the unit disposal cost of EV batteries is c 2 = 0.034 × 10 4 , i.e., c 2 = 0.034 . Moreover, the discount factor in the trade-in strategy is β = 0.08 [56], the EV manufacturer’s effort cost coefficient for the trade-in strategy is b = 20 , and the refund coefficient under the deposit–refund mechanism is k = 0.5 [11]. According to [51,52], we restrict the reward/penalty coefficient and the deposit amount to vary in the range of [ 0 ,   2.5 ] .
Finally, the environmental benefit of recycling a waste EV battery is assumed to be 0.4, and the environmental damage caused by a waste EV battery that is not recycled is assumed to be 0.6, i.e., e b = 0.4 and e p = 0.6 .

6.2. Collection Rate Analyses

Now, based on the above data collection, we analyze the effects of reward/penalty coefficient and the deposit amount on the collection rate of waste EV batteries, as shown in Figure 4. The collection rate under both mechanisms increases with increasing reward/penalty coefficient or deposit amount, suggesting that both mechanisms can improve the waste EV battery collection rate by increasing the reward/penalty coefficient or the deposit amount. This is consistent with the conclusion obtained from Propositions 2 and 5.
In addition, Figure 4 shows that, when k = 0.5, the slope of the collection rate with increasing deposit amount under the deposit–refund mechanism (the dashed line in Figure 4a) is lower than the slope of the collection rate with an increasing reward/penalty coefficient under the reward–penalty mechanism (see the solid line in Figure 4a). However, as the value of k increases, the former (see the dashed lines in Figure 4b,c) will be larger than the latter (see the solid lines in Figure 4b,c). Therefore, the government could increase the value of the refund coefficient ( k ) to promote the incentive of the EV manufacturer to collect the waste EV batteries and thus improve the degree of impact of the deposit–refund mechanism on the collection rate.
An interesting finding is that the deposit–refund mechanism leads to a higher collection rate than the reward–penalty mechanism even if the refund coefficient is less than 1 (i.e., when k = 0.8 , see Figure 4b). This is also consistent with the analysis of Proposition 9.

6.3. Profit Analyses for the EV Manufacturer and the Recycling Enterprise

The effect of the reward/penalty coefficient and the deposit amount on the profits of the EV manufacturer and the recycling enterprise is shown in Figure 5. First, under the reward–penalty mechanism, according to Figure 5a, the EV manufacturer’s collection rate is less than the baseline set by the government when k = 0.5 . If the government sets a high collection rate baseline so that the EV manufacture cannot meet it, the EV manufacturer is penalized, and the manufacturer’s profit decreases with the reward/penalty coefficient (see the solid line in Figure 5a). This also shows that if the government has already established a high collection rate target, it is not recommended that it goes further to increase the reward/penalty coefficient.
On the other hand, if the government is setting up the deposit–refund mechanism, the profit of the EV manufacturer rises rapidly as the deposit amount increases (see the dashed line in Figure 5a). The EV manufacturer collects the waste EV batteries and receives refunds. The more the deposit amount increases, the more often the deposit is returned, and the greater the profit gained by the manufacturer.
Moreover, the recycling enterprise’s profit increases under the two mechanisms with the increase in the reward/penalty coefficient or the deposit amount. This results from the dependence of the recycling enterprise’s profit on the collection rate; the latter increases with the reward/penalty coefficient and the deposit amount.

6.4. Social Welfare Analyses

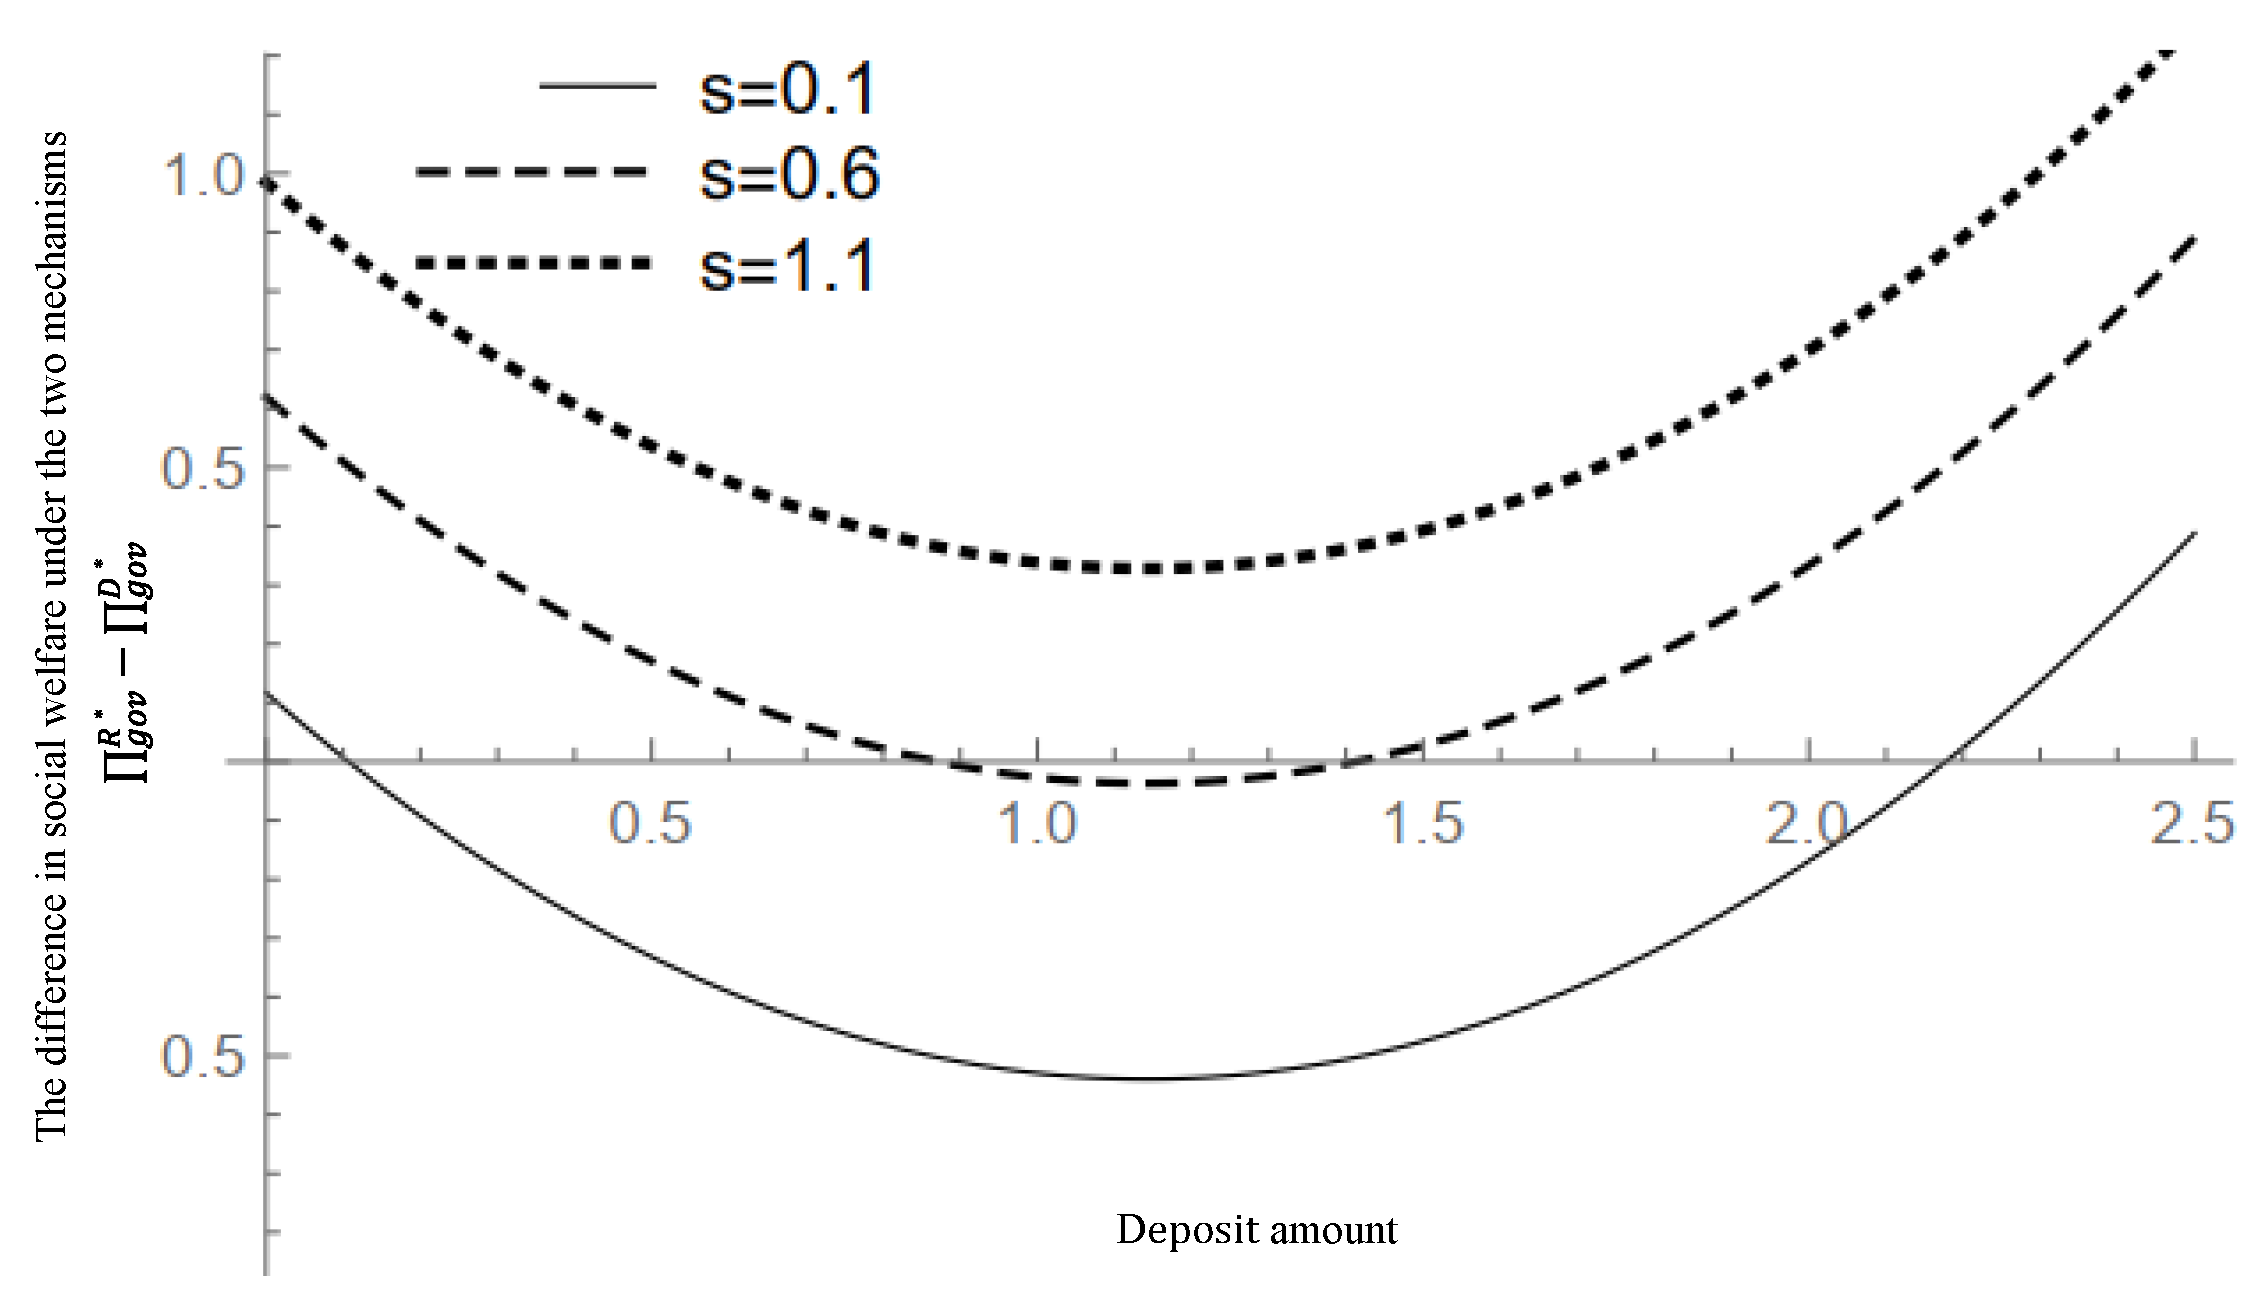
The effect of the reward/penalty coefficient and the deposit amount on social welfare is shown in Figure 6. The y-axis represents the difference between the social welfare under the reward–penalty mechanism and that under the deposit-refund mechanism ( g o v R * g o v D * ). If the government wants to improve social welfare, the reward–penalty mechanism is better than the deposit–refund mechanism only if the reward/penalty coefficient is small and the deposit amount takes an intermediate value (e.g., s = 0.1 and 0.1 < t < 2.2 ). In addition, as the reward/penalty coefficient increases (e.g., when s > 0.6 ), the reward–penalty mechanism outperforms the deposit–refund mechanism regardless of the value of the deposit amount.

7. Conclusions

Based on the reward–penalty and deposit–refund mechanisms, this study compares the equilibrium results of the two mechanisms by constructing a closed-loop supply chain model consisting of an EV manufacturer and a recycling enterprise. The study aims to provide a reference for governments who need to choose an appropriate incentive mechanism for improving the collection of waste EV batteries.
The specific findings are as follows: (1) Both mechanisms could improve the collection rate of the waste EV batteries, and the collection rate is lower under the reward–penalty mechanism than under the deposit–refund mechanism unless the reward/penalty coefficient takes a very high value. (2) The deposit–refund mechanism could lead to a higher sales volume of new EV batteries when the reward/penalty coefficient is small and the deposit amount is high so that the special condition is satisfied; otherwise, the reward–penalty mechanism can lead to a higher sales volume. (3) In the recycling market, we obtain clear comparative results between the two mechanisms for the collection rate, collection price, and recycling enterprise’s profit, and the boundary values decrease with the trade-in discount and increases with the refund coefficient. (4) We found that the expression for the region where social welfare is greater under the reward–penalty mechanism than under the deposit–refund mechanism; the numerical analysis illustrates that the region expands with increased deposit amounts.
The research can be further extended in several directions to achieve broader insights. First, the models are limited to a supply chain consisting of an EV manufacturer and a recycling enterprise. Future research could extend this to closed-loop supply chains consisting of multiple subjects. Second, in studying the government incentive mechanism, we only focus the manufacturer’s adoption of the trade-in strategy for the collection of waste EV batteries. The design of government incentives under multiple recycling methods (e.g., recycling by third-party recycling enterprises) can be explored in the future.

Supplementary Materials

The following supporting information can be downloaded at: https://www.mdpi.com/article/10.3390/en15196885/s1.

Author Contributions

Conceptualization, H.H. and W.X.; Data curation, W.X., F.W. and C.W.; Funding acquisition, H.H. and F.W.; Methodology, W.X. and F.W.; Project administration, H.H. and F.W.; Software, C.W.; Supervision, H.H.; Validation, Z.X.; Visualization, Z.X.; Writing—original draft, W.X. and F.W.; Writing—review & editing, H.H. and F.W. All authors have read and agreed to the published version of the manuscript.

Funding

This research was funded by the National Social Science Foundation of China (No. 20BGL200), the Key Projects of Shanghai Soft Science Research Program (No. 21692194800), and the Natural Science Foundation of China (No. 72004130).

Institutional Review Board Statement

Not applicable.

Informed Consent Statement

Not applicable.

Data Availability Statement

All data, models generated or used during the study appear in the submitted article.

Conflicts of Interest

The authors declare that they have no competing interest.

References

  1. Li, Y.; Wen, Z.; Li, Q.; Li, S. Research on Energy Management Strategies for Electric Vehicles. In Proceedings of the 2011 Asia-Pacific Power and Energy Engineering Conference, Shanghai, China, 27–29 March 2012; pp. 1–4. [Google Scholar]
  2. Hu, X.; Wang, H.; Tang, X. Cyber-Physical Control for Energy-Saving Vehicle Following With Connectivity. IEEE Trans. Ind. Electron. 2017, 64, 8578–8587. [Google Scholar] [CrossRef]
  3. Pei, H.; Hu, X.; Yang, Y.; Tang, X.; Hou, C.; Cao, D. Configuration optimization for improving fuel efficiency of power split hybrid powertrains with a single planetary gear. Appl. Energy 2018, 214, 103–116. [Google Scholar] [CrossRef]
  4. Tang, Y.; Zhang, Q.; Li, Y.; Li, H.; Pan, X.; McLellan, B. The social-economic-environmental impacts of recycling retired EV batteries under reward-penalty mechanism. Appl. Energy 2019, 251, 113313. [Google Scholar] [CrossRef]
  5. Gu, X.; Ieromonachou, P.; Zhou, L.; Tseng, M.-L. Optimising quantity of manufacturing and remanufacturing in an electric vehicle battery closed-loop supply chain. Ind. Manag. Data Syst. 2018, 118, 283–302. [Google Scholar] [CrossRef]
  6. Saxena, S.; Le Floch, C.; MacDonald, J.; Moura, S. Quantifying EV battery end-of-life through analysis of travel needs with vehicle powertrain models. J. Power Sources 2015, 282, 265–276. [Google Scholar] [CrossRef]
  7. China Internet Data and Information Network. New Energy Vehicle Battery Circular Economy Potential Study. Available online: http://www.199it.com/archives/1188970.html (accessed on 12 January 2021).
  8. Administration, N.E. Speed up to Solve the Problem of Power Battery Industry. Available online: http://www.nea.gov.cn/2018-09/10/c_137457800.htm (accessed on 10 September 2018).
  9. Union, E. Disposal of Spent Batteries and Accumulators. Available online: https://eur-lex.europa.eu/legal-content/EN/TXT/?uri=LEGISSUM:l21202 (accessed on 9 June 2020).
  10. Walls, M. Deposit-Refund Systems in Practice and Theory. Resour. Future Discuss. Pap. 2011, 11–47. [Google Scholar] [CrossRef]
  11. Li, X.; Mu, D.; Du, J.; Cao, J.; Zhao, F. Game-based system dynamics simulation of deposit-refund scheme for electric vehicle battery recycling in China. Resour. Conserv. Recycl. 2020, 157, 104788. [Google Scholar] [CrossRef]
  12. Tang, Y.; Zhang, Q.; Li, Y.; Wang, G.; Li, Y. Recycling mechanisms and policy suggestions for spent electric vehicles’ power battery -A case of Beijing. J. Clean. Prod. 2018, 186, 388–406. [Google Scholar] [CrossRef]
  13. Wang, J.; Li, W.; Nozomu, M.; Adachi, T. Closed-loop supply chain under different channel leaderships: Considering different deposit–refund systems practically applied in China. J. Mater. Cycles Waste Manag. 2021, 23, 1765–1776. [Google Scholar] [CrossRef]
  14. Li, L.; Dababneh, F.; Zhao, J. Cost-effective supply chain for electric vehicle battery remanufacturing. Appl. Energy 2018, 226, 277–286. [Google Scholar] [CrossRef]
  15. Harper, G.; Sommerville, R.; Kendrick, E.; Driscoll, L.; Slater, P.; Stolkin, R.; Walton, A.; Christensen, P.; Heidrich, O.; Lambert, S.; et al. Recycling lithium-ion batteries from electric vehicles. Nature 2019, 575, 75–86. [Google Scholar] [CrossRef]
  16. Ciez, R.E.; Whitacre, J.F. Examining different recycling processes for lithium-ion batteries. Nat. Sustain. 2019, 2, 148–156. [Google Scholar] [CrossRef]
  17. Beaudet, A.; Larouche, F.; Amouzegar, K.; Bouchard, P.; Zaghib, K. Key Challenges and Opportunities for Recycling Electric Vehicle Battery Materials. Sustainability 2020, 12, 5837. [Google Scholar] [CrossRef]
  18. Kannan, G.; Sasikumar, P.; Devika, K. A genetic algorithm approach for solving a closed loop supply chain model: A case of battery recycling. Appl. Math. Model. 2010, 34, 655–670. [Google Scholar] [CrossRef]
  19. Wang, L.; Wang, X.; Yang, W. Optimal design of electric vehicle battery recycling network–from the perspective of electric vehicle manufacturers. Appl. Energy 2020, 275, 115328. [Google Scholar] [CrossRef]
  20. Li, Y.; Xu, F.; Zhao, X. Governance mechanisms of dual-channel reverse supply chains with informal collection channel. J. Clean. Prod. 2017, 155, 125–140. [Google Scholar] [CrossRef]
  21. Gu, X.; Ieromonachou, P.; Zhou, L.; Tseng, M.-L. Developing pricing strategy to optimise total profits in an electric vehicle battery closed loop supply chain. J. Clean. Prod. 2018, 203, 376–385. [Google Scholar] [CrossRef]
  22. Qiao, Q.; Zhao, F.; Liu, Z.; Hao, H. Electric vehicle recycling in China: Economic and environmental benefits. Resour. Conserv. Recycl. 2018, 140, 45–53. [Google Scholar] [CrossRef]
  23. Ma, W.-M.; Zhao, Z.; Ke, H. Dual-channel closed-loop supply chain with government consumption-subsidy. Eur. J. Oper. Res. 2013, 226, 221–227. [Google Scholar] [CrossRef]
  24. Wang, W. Deposit-refund System of a Closed-loop Supply Chain under Competition between Manufacturers. Chin. J. Manag. Sci. 2021, 29, 179–188. [Google Scholar] [CrossRef]
  25. Wang, Y.; Chang, X.; Chen, Z.; Zhong, Y.; Fan, T. Impact of subsidy policies on recycling and remanufacturing using system dynamics methodology: A case of auto parts in China. J. Clean. Prod. 2014, 74, 161–171. [Google Scholar] [CrossRef]
  26. Liu, H.; Lei, M.; Deng, H.; Leong, G.K.; Huang, T. A dual channel, quality-based price competition model for the WEEE recycling market with government subsidy. Omega 2016, 59, 290–302. [Google Scholar] [CrossRef]
  27. Zhou, W.; Zheng, Y.; Huang, W. Competitive advantage of qualified WEEE recyclers through EPR legislation. Eur. J. Oper. Res. 2017, 257, 641–655. [Google Scholar] [CrossRef]
  28. Wang, W.; Zhang, Y.; Fan, L.; He, L.; Da, Q. Research on the premium and penalty mechanism of the reverse supply chain considering various goals of government. Chin. J. Manag. Sci. 2015, 23, 68–76. [Google Scholar] [CrossRef]
  29. Zhang, H.; Zheng, Y.; Cao, J.; Qiu, Y. Has government intervention effectively encouraged the use of waste cooking oil as an energy source? Comparison of two Chinese biofuel companies. Energy 2017, 140, 708–715. [Google Scholar] [CrossRef]
  30. Li, X.; Zuo, H. Impacts of government double intervention on dual-sale-channel closed-loop supply chain. Syst. Eng. Theory Pract. 2017, 37, 2600–2610. [Google Scholar]
  31. Wang, W.; Ding, J.; Sun, H. Reward-penalty mechanism for a two-period closed-loop supply chain. J. Clean. Prod. 2018, 203, 898–917. [Google Scholar] [CrossRef]
  32. Song, X.; Geng, Y.; Dong, H.; Chen, W. Social network analysis on industrial symbiosis: A case of Gujiao eco-industrial park. J. Clean. Prod. 2018, 193, 414–423. [Google Scholar] [CrossRef]
  33. Linderhof, V.; Oosterhuis, F.H.; van Beukering, P.J.; Bartelings, H. Effectiveness of deposit-refund systems for household waste in the Netherlands: Applying a partial equilibrium model. J. Environ. Manag. 2018, 232, 842–850. [Google Scholar] [CrossRef]
  34. Bohm, P. Deposit-Refund Systems: Theory and Applications to Environmental, Conservation, and Consumer Policy; Resources for the Future, Inc.: Washington, DC, USA, 1981. [Google Scholar]
  35. Buffington, J. The viability of a “Voluntary Refund-Deposit System” for Aluminum can Recycling in the US. In Light Metals 2014; Springer: Berlin/Heidelberg, Germany, 2014; pp. 913–918. [Google Scholar]
  36. Gong, Y.; Chen, M.; Wang, Z.; Zhan, J. With or without deposit-refund system for a network platform-led electronic closed-loop supply chain. J. Clean. Prod. 2020, 281, 125356. [Google Scholar] [CrossRef]
  37. Xie, T.; Zhang, J.; Wang, F. Decision-Making Models and Effects of Deposit-Refund System for E-Waste in China. Oper. Reserch Manag. Sci. 2017, 26, 182–189. [Google Scholar]
  38. Zhang, F.; Zhang, R. Trade-in remanufacturing, customer purchasing behavior, and government policy. Manuf. Serv. Oper. Manag. 2018, 20, 601–616. [Google Scholar] [CrossRef]
  39. Dou, G.; Choi, T.-M. Does implementing trade-in and green technology together benefit the environment? Eur. J. Oper. Res. 2021, 295, 517–533. [Google Scholar] [CrossRef]
  40. Park, S.; Mowen, J.C. Replacement purchase decisions: On the effects of trade-ins, hedonic versus utilitarian usage goal, and tightwadism. J. Consum. Behav. Int. Res. Rev. 2007, 6, 123–131. [Google Scholar] [CrossRef]
  41. Liu, J.; Zhai, X.; Chen, L. Optimal pricing strategy under trade-in program in the presence of strategic consumers. Omega 2018, 84, 1–17. [Google Scholar] [CrossRef]
  42. Ray, S.; Boyaci, T.; Aras, N. Optimal prices and trade-in rebates for durable, remanufacturable products. Manuf. Serv. Oper. Manag. 2005, 7, 208–228. [Google Scholar] [CrossRef]
  43. Miao, Z.; Fu, K.; Xia, Z.; Wang, Y. Models for closed-loop supply chain with trade-ins. Omega 2017, 66, 308–326. [Google Scholar] [CrossRef]
  44. Hu, S.; Ma, Z.-J.; Sheu, J.-B. Optimal prices and trade-in rebates for successive-generation products with strategic consumers and limited trade-in duration. Transp. Res. Part E Logist. Transp. Rev. 2019, 124, 92–107. [Google Scholar] [CrossRef]
  45. Miao, Z.; Mao, H.; Fu, K.; Wang, Y. Remanufacturing with trade-ins under carbon regulations. Comput. Oper. Res. 2018, 89, 253–268. [Google Scholar] [CrossRef]
  46. Ferrer, G.; Swaminathan, J.M. Managing New and Remanufactured Products. Manag. Sci. 2006, 52, 15–26. [Google Scholar] [CrossRef]
  47. Wei, J.; Zhao, J. Pricing and remanufacturing decisions in two competing supply chains. Int. J. Prod. Res. 2014, 53, 258–278. [Google Scholar] [CrossRef]
  48. Hong, X.; Govindan, K.; Xu, L.; Du, P. Quantity and collection decisions in a closed-loop supply chain with technology licensing. Eur. J. Oper. Res. 2017, 256, 820–829. [Google Scholar] [CrossRef]
  49. Luo, C.; Leng, M.; Tian, X.; Wang, S. Subsidizing purchases of public interest products: A duopoly analysis under a subsidy scheme. Oper. Res. Lett. 2017, 45, 543–548. [Google Scholar] [CrossRef]
  50. Esenduran, G.; Kemahlıoğlu-Ziya, E.; Swaminathan, J.M. Impact of Take-Back Regulation on the Remanufacturing Industry. Prod. Oper. Manag. 2017, 26, 924–944. [Google Scholar] [CrossRef]
  51. Administration, N.E. Interim Measures to Encourage the Purchase and Use of New EVs in Shanghai. Available online: http://www.nea.gov.cn/2014-05/23/c_133356393.htm (accessed on 23 May 2014).
  52. Development and Reform Commission of Shenzhen Municipality. Finance Support Policy for the Promotion of New Energy Vehicle in Shenzhen. Available online: http://fgw.sz.gov.cn/zwgk/qt/tzgg/content/post_4584163.html (accessed on 18 January 2019).
  53. Network, P.A. What is the Capacity of Electric Vehicle Power Battery? Available online: https://www.pcauto.com.cn/jxwd/1596/15963515.html (accessed on 9 May 2019).
  54. High-Tech Lithium Battery. THE Price of Power Battery System Will Drop to 1.5 yuan/wh within 4 Years. Available online: https://www.gg-lb.com/asdisp2-65b095fb-25053-.html (accessed on 26 October 2016).
  55. Xie, J. Pareto Equilibrium of New Energy Vehicle Power Battery Recycling Based on Extended Producer Responsibility. Chin. J. Manag. Sci. 2022, 28, 1–12. [Google Scholar] [CrossRef]
  56. News, G. Subsidies Will be Available for the Purchase of Home Appliances Trade-in. Available online: http://www.gxnews.com.cn/staticpages/20190622/newgx5d0d8566-18440517.shtml (accessed on 22 June 2019).
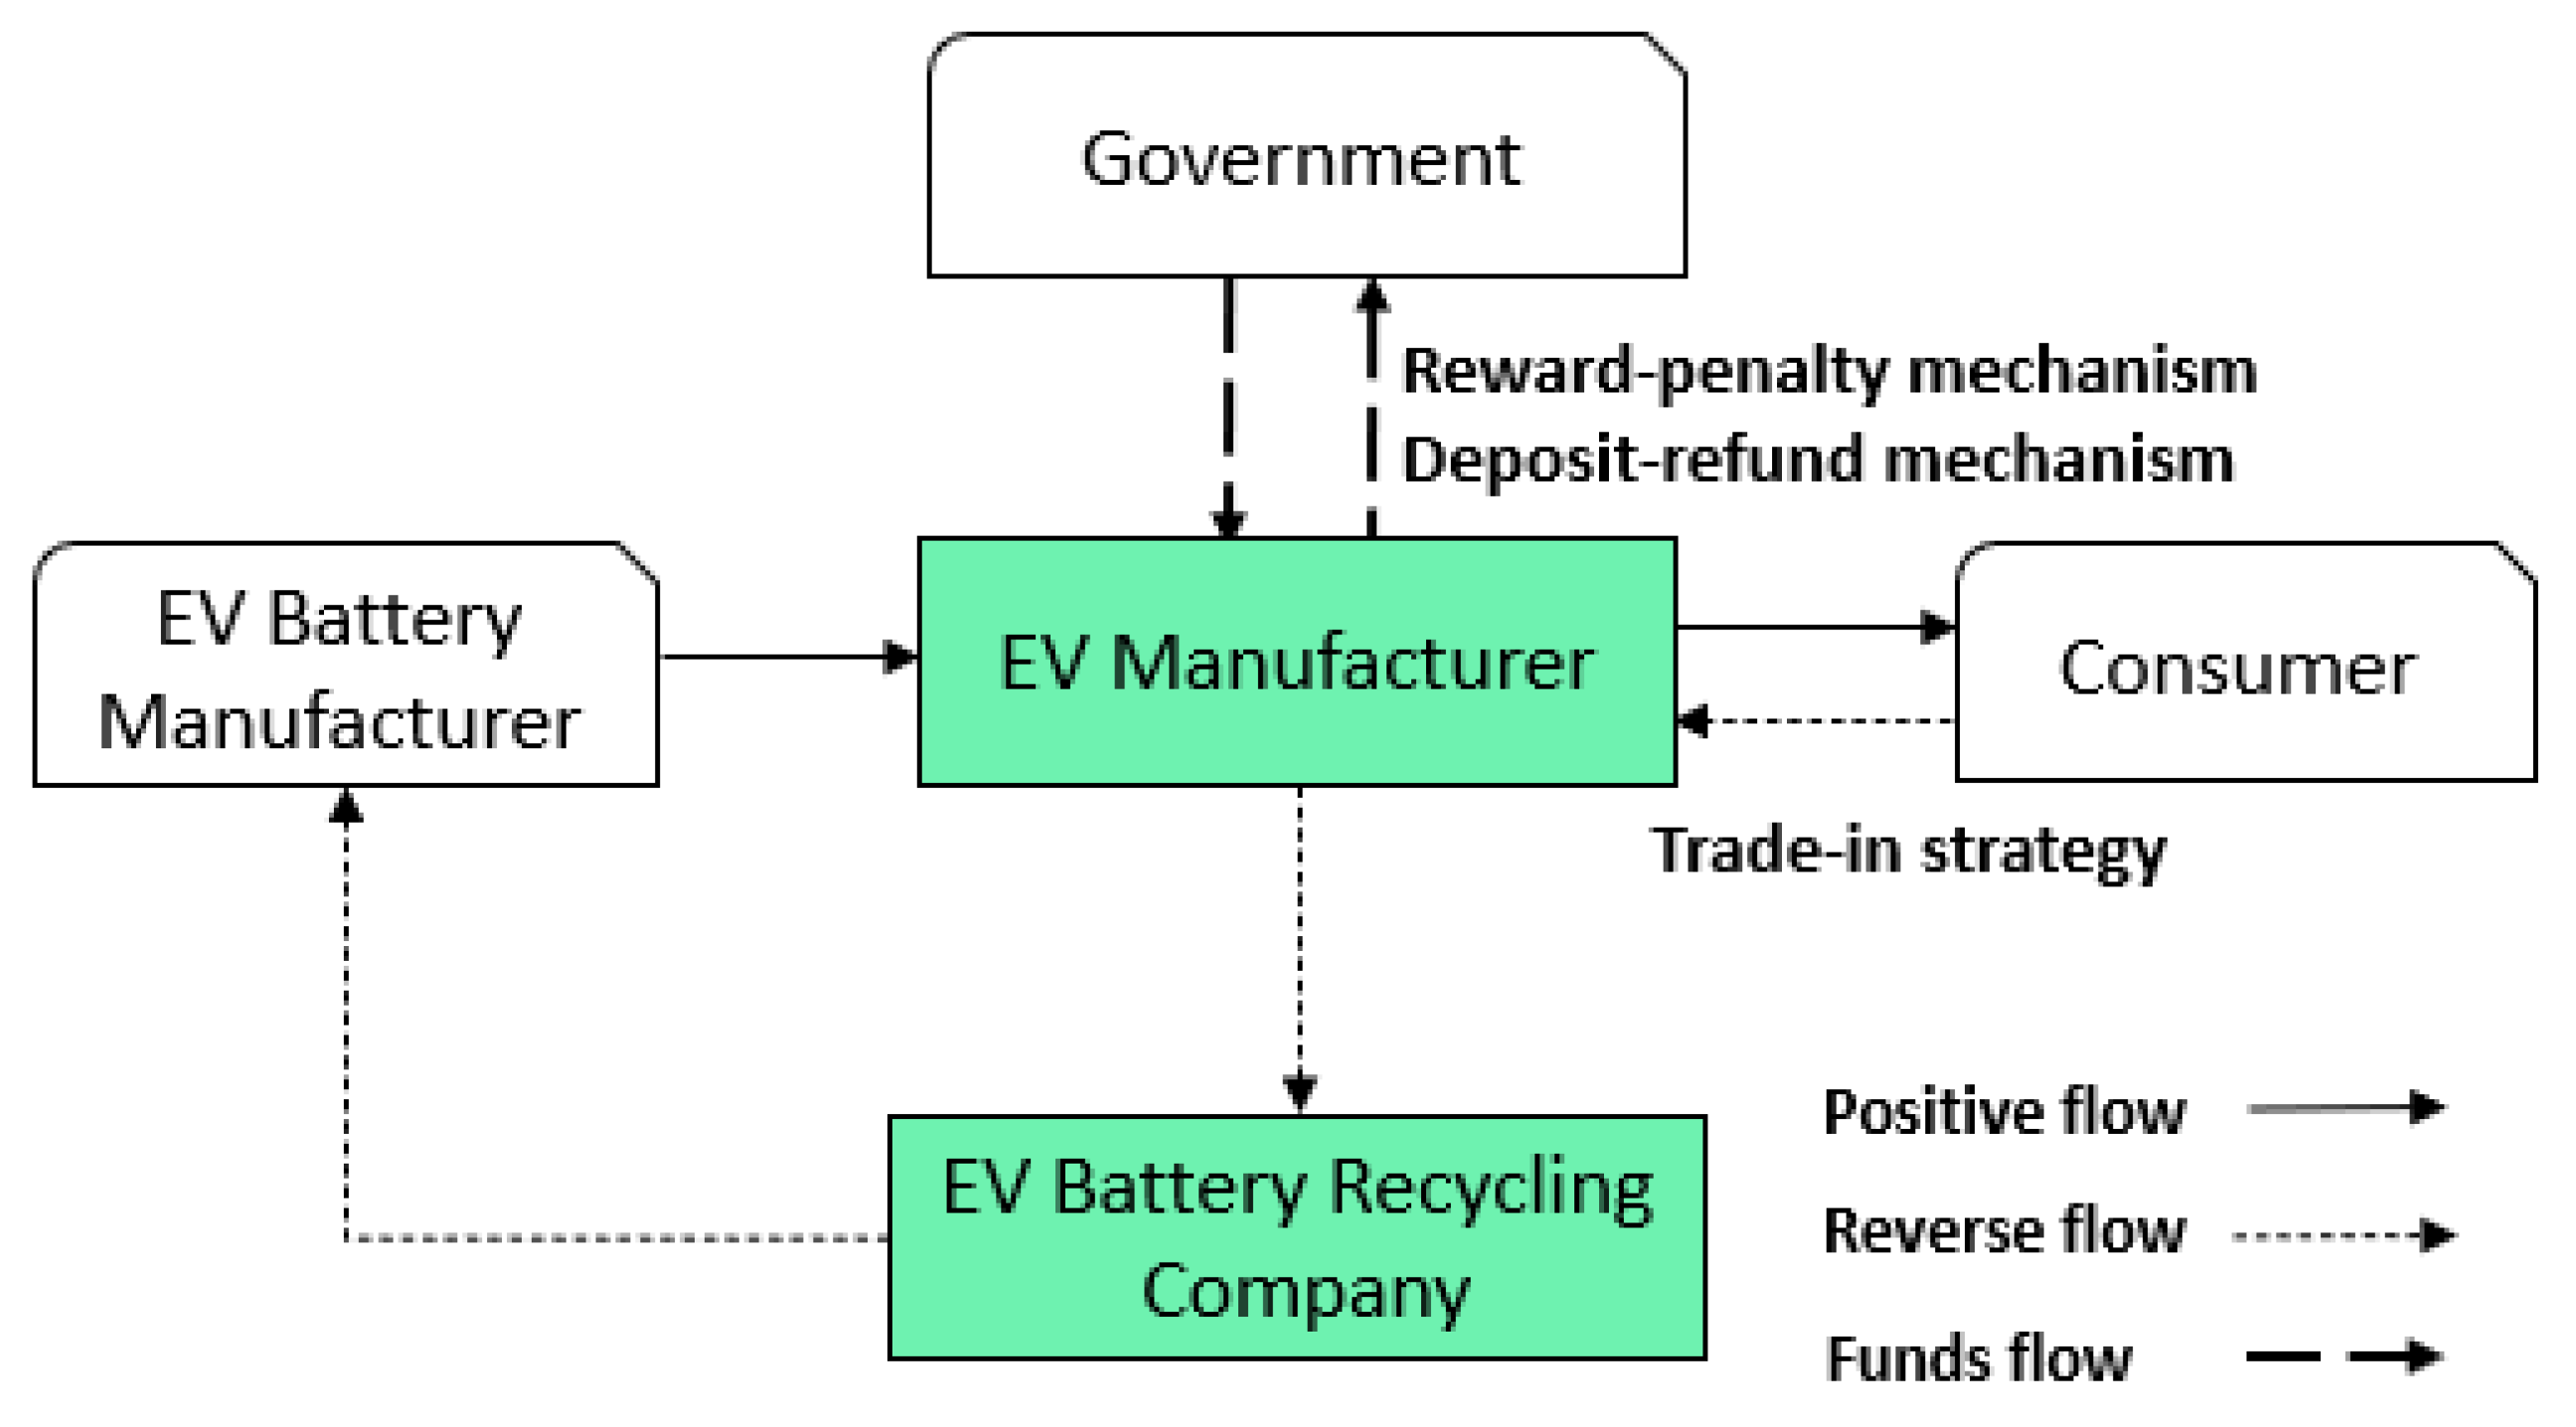
Figure 1. The framework of the recycling process.
Energies 15 06885 g001
Figure 2. Impact of the reward/penalty coefficient and deposit amount.
Energies 15 06885 g002
Figure 3. Impact of the refund coefficient on the collection rate.
Energies 15 06885 g003
Figure 4. The impact of reward/penalty coefficient or deposit amount on collection rate (The variation of collection rate at k = 0.5 (a), the variation of collection rate at k = 0.8 (b) and the variation of collection rate at k = 1.1 (c)).
Energies 15 06885 g004
Figure 5. The effect of reward/penalty coefficient or deposit amount on the profits of the EV manufacturer and the recycling enterprise (The trends in manufacturer’s profit (a) and the recycling enterprise’s profit (b) at k = 0.5 ).
Energies 15 06885 g005
Figure 6. Impact of reward/penalty coefficient and deposit amount on the social welfare ( k = 0.5 ).
Energies 15 06885 g006
Table 1. The notations.
SymbolsDescription
p n The selling price per unit for the new EV batteries
p r The recycling price per unit for the waste EV batteries
a Potential market demand of the new EV batteries
f The residual value per unit for the waste EV batteries
b The EV manufacturer’s effort cost coefficient for trade-in strategy
c 1 The purchasing cost per unit for the new EV batteries
c 2 The recycling cost per unit for the waste EV batteries
q The sale quantity of the new EV batteries
Q Potential volume of the waste EV batteries
τ 0 The collection rate baseline set by the government ( τ 0 > 0 )
τ The actual collection rate of the EV manufacturer
β The trade-in discount set by the EV manufacturer ( 0 < β < 1 )
s The reward/penalty coefficient with the reward–penalty mechanism ( s > 0 )
t The deposit amount per unit for the new EV batteries with deposit–refund mechanism ( t > 0 )
k The refund coefficient with the deposit–refund mechanism ( k > 0 )
e b The environmental benefits of recycling a waste EV battery
e p The environmental damage caused by a waste EV battery that is not recycled
m R The profit of the EV manufacturer with the reward–penalty mechanism
r R The profit of the recycling enterprise with the reward–penalty mechanism
g o v R Government’s concern for social welfare with the reward–penalty mechanism
m D The profit of the EV manufacturer with the deposit–refund mechanism
r D The profit of the recycling enterprise with the deposit–refund mechanism
g o v D Government’s concern for social welfare with the deposit–refund mechanism
Table 2. Comparison of variables.
Variable Range 0 < s < χ 1 · t χ 1 · t < s < χ 2 · t   s > χ 2 · t
q q R < q D q R > q D q R > q D
τ τ R < τ D τ R < τ D τ R > τ D
p r p r R > p r D p r R > p r D p r R < p r D
r r R < r D r R < r D r R > r D
Note: χ 1 = k + Q 2 · ( 3 4 β + β 2 ) 8 b 2 Q 2 ( 1 + β ) and χ 2 = k + 1 β 2 .
Table 3. Summary of parameter values.
Parameter a f Q τ 0 c 1 c 2 β k s t
Value2.612.96.7520%7.20.0340.080.5[0, 2.5][0, 2.5]
Publisher’s Note: MDPI stays neutral with regard to jurisdictional claims in published maps and institutional affiliations.