Abstract
Increasing climate change, through its impact on the economy, results in measures to reduce its negative effects. In agriculture, the expected positive effects may come from the implementation of practices with high carbon sequestration potential (e.g., straw incorporation). The idea of using straw as an energy feedstock requires an in-depth analysis of the impact of this practice on the organic carbon content of arable soils. Straw incorporation combined with the use of biopreparations can provide an attractive alternative to conventional fertilization and plant protection systems. This study aimed to assess the effect of straw, effective microorganisms preparation, and biostimulant on the physicochemical and biological soil parameters. The analyses included organic carbon, available P, K, and Mg, total and mineral nitrogen content, pH, bulk density, soil penetration resistance, and the number of soil-culturable heterotrophic bacteria, actinobacteria, and fungi determination. It was found that straw and EM addition resulted in the highest SOC content. Statistically lower values of bulk density and soil penetration resistance were also observed after straw incorporation. The results of our research revealed that, while the addition of straw beneficially affects soil quality, the impact of biopreparations application on soil parameters varies depending on the experimental combination used.
1. Introduction
Threats associated with climate change are increasingly affecting many sectors of the human economy, influencing the search for solutions to reduce the adverse effects of these phenomena. Agriculture, as a sector of key importance for a functioning global economy, is also affected []. As envisioned by the Paris Agreement, reducing global warming will require the widespread use of low-carbon technology agriculture [], where economic benefits are accompanied by environmental ones. These technologies should primarily result in beneficial changes in GHG emissions and restrict the use of energy-intensive technologies. The implementation of practices with high carbon sequestration potential, which include the application of organic residues produced in agriculture (e.g., cereal straw) to the soil, may also have beneficial effects [].
The management of crop residues is considered an important part of a strategy to promote soil carbon sequestration []. It is estimated that approximately 33% of the C introduced into soil with straw can be sequestered []. Such use of residues is considered economically and environmentally attractive, thus fitting in with the principles of sustainable agriculture strategies []. Beneficial changes in the chemical composition and structure of straw-implemented soils directly affect yield increases. However, many other factors (climate, cropping system) have a significant impact on the final effect of straw implementation. Furthermore, the potential possibility of straw use in the energy sector leads to questioning the validity of field straw residues incorporation. Taking into account the current geopolitical situation (the military conflict in Ukraine) and its impact on the fossil fuel market, the perspective of acquiring a substantial amount of readily available and cheap energy feedstock is undoubtedly attractive. In addition, cereal straw can also be used for biofuel production [,]. However, before making a final decision on non-agricultural application of straw, an overall analysis of the effects of reducing the amount of carbon delivered to the soil with crop residues is required. A decrease in soil organic carbon content not only negatively affects soil fertility and crop yields; crop residue management practices that increase the input of organic matter can also effectively support soil carbon sequestration [].
Implementing the principles of sustainable agriculture into practice, alternative methods of plant protection and fertilization based on the application of biopreparations are also introduced as part of farming systems []. By reducing the number of harmful xenobiotics entering the environment, biopreparations are also an attractive proposition for producers focusing on the growing group of eco-friendly consumers who value food obtained with minimal use of conventional pesticides and fertilizers.
Formulations based on the activity of so-called effective microorganisms (EM) include lactic fermentation bacteria, photosynthetic bacteria, actinobacteria, yeast, and mold fungi [,]. The effectiveness of biopreparations has been tested in various areas of the economy and human activity, including waste management, medicine, and agriculture []. Despite the inconclusive results of research on their effects on the soil environment, crop yields, and quality, the possibility of implementing them in agriculture as a substitute for traditional pesticides or fertilizers encourages scientists to advance their knowledge in this area [,,,].
Biostimulants are a group of synthetic or natural substances that may positively influence the properties of the soil environment and cultivated plants. By increasing the efficiency of plants’ vital processes, biostimulants increase their productivity, allowing them to produce a high yield of good quality with reduced fertilizer needs. An analysis of literature sources revealed a relatively small number of studies on the effect of incorporating straw combined with the application of an active microbial preparation and biostimulator on soil parameters. Since the use of such practices can be considered environmentally friendly technology positively affecting soil and crops quality, research on their efficiency seems justified and valuable for the purpose of sustainable agriculture.
The aim of the research was to analyze the effect of straw incorporation combined with application of effective microorganisms preparation and Asahi SL biostimulant on the soil physicochemical properties, including organic carbon (SOC), total (TN), and mineral nitrogen (N), (N-NO3 and N-NH4), available phosphorous (P), potassium (K), and magnesium (Mg) content, and soil-culturable heterotrophic bacteria, actinobacteria, and fungi number in barley monoculture.
It was hypothesized that the incorporation of straw with the additional use of EM and a biostimulant would increase the beneficial effects on organic carbon content and other selected soil parameters.
2. Materials and Methods
2.1. Experiment Location
The study was carried out during a three-year period from 2012 to 2014 on a spring barley field on a farm in Kruszwica Region, Kuyavian-Pomeranian Voivodeship in northern Poland (52°61′18.1″ N; 18°44′12.4 E). The farmland is located on the Inowrocław plain at an altitude of 89 m. a.s.l. The experimental plots were located on the soil Cambic Stagnic Phaeozem []. The soil was qualified as loam: 44.3% sand fraction (2.0–0.05 mm), 41.5% silt fraction (0.05–0.002 mm), and 14.2% clay fraction []. The average content of SOC in soil was 28.8 g kg−1 and pH 7.12 (in 1M KCl). Soil texture was measured applying the Mastersizer 2000 Analyzer (Malvern Instrument, Malvern, UK).
The static (2nd and 3rd year of spring barley short-time cultivation) three-way experiment in three replications was set up in a split-plot/split-block design.
The following experimental factors were adopted:
R—stubble management method
- R1—crop residues in the field during post-harvest cultivation and EM introduced into the soil during post-harvest cultivation in autumn at a dose of 40 dm3∙ha−1 (1 × EM).
- R2—crop residues left in the field during post-harvest cultivation and EM introduced into the soil during post-harvest cultivation in autumn at a dose of 20 dm3∙ha1 and EM applied on leaves at a dose of 20 dm3∙ha−1 at BBCH 20–22 (2 × EM),
- R3—crop residues left in the field during post-harvest cultivation without EM application and (0 × EM).
- R4—crop residues removed from the field during post-harvest cultivation and EM introduced into the soil during post-harvest cultivation in autumn at a dose of 40 dm3∙ha−1 (1 × EM).
- R5—crop residues removed from the field during post-harvest cultivation and EM introduced into the soil during post-harvest cultivation in autumn at a dose of 20 dm3∙ha−1 and EM applied on leaves at a dose of 20 dm3∙ha−1 at BBCH 20–22 (2 × EM).
- R6—crop residues removed from the field during post-harvest cultivation and without EM application (0 × EM).
A factor—methods of applying biostimulant Asahi (3 levels):
- 7.
- A1—1 × A (biostimulant Asahi SL applied once on leaves at a dose of 1.0 dm3∙ha−1 at BBCH 20–22).
- 8.
- A2—2 × A (biostimulant Asahi SL applied twice on leaves in two doses of 0.5 dm3∙ha1 at BBCH 20-22 and BBCH 27–29).
- 9.
- A3—0 × A (without biostimulant Asahi SL application).
The commercial preparation EM “Naturally Active” is a suspension of effective microorganisms (Greenland Technologia EM sp. z o.o.). It has the PZH/HT-1448/2002 certificate and the Institute of Soil Science and Plant Cultivation qualification certificate No. NE/1/2004. EM is a safe product for people, animals, and the environment. According to the information of manufacturer, the preparation consists of photosynthetic, lactic acid bacteria, yeast, actinobacteria, Azotobacter spp. bacteria, and cane molasses. It does not contain GMO components. It is manufactured under license from EMRO-EM Research Organization Japan.
The biostimulant Asahi SL, in accordance with the annex to the decision of the Ministry of Agriculture and Rural Development No. R-357/2010d of 27.12.2010 in the description of operation, is a stimulator of growth and yielding of plants in the form of a liquid for dilution with water. It contains the active substances (compounds from the group of nitrophenol derivatives): sodium para-nitrophenolate (0.3%), sodium orthonitrophenolate (0.2%), and sodium 5-nitroguayacolate (0.1%).
EM “Naturally Active” and Asahi SL products were applied using a self-propelled sprayer. Tillage practices were typical for medium-intensive cultivation of the cereal plant. A ploughing tillage system was used; nitrogen fertilization was at a dose of 150 kg N∙ha−1. Phosphorus and potassium fertilization was determined based on the soil richness in absorbable forms of these macronutrients. The qualified seed material of spring barley dressed in JOCKEY 201 FS (fluquinconazole) at a rate of 450 mL of product with 150 mL of water for ·100 kg−1 of grain was sown at a density of 300 grains·m−2 in the first week of April. Over the years of the research, in spring after the start of growth (BBCH 25–29), a herbicide tank-mixture (Sekator Pak) was used: Sekator 125 OD (amidosulfuron + iodosulfuron-methyl-sodium) at a dose of 100 mL∙ha−1 + Esteron 600 EC (2,4-D) at a dose of 300 mL∙ha−1.
Rainfall-thermal conditions during the period of implementation of field studies and agrotechnical treatments, as well as grain yield of spring barley [t∙ha−1], were described in detail in the work of Lamparski []. During the plant growth, 140 kg·N·ha−1, 30 kg·P2O5·ha−1, and 60 kg·K2O·ha−1 were applied.
2.2. Soil Samples
Ten soil samples collected from each experimental plot were mixed to form a pooled test sample. The soil samples were tested in triplicate. The material for studies was taken from the period 2012–2014, the first time after harvesting the pre-crop (before stubble cultivation) and the final time after crop harvesting (before starting post-harvest treatments). At each site, soil samples were taken from the cultivated layer (0 to 30 cm horizon). Simultaneously, samples were taken for chemical analysis: K, Mg, P, soil pH, TN, and SOC. Determination of mineral nitrogen and its forms was carried out in autumn and spring, in successive years of the experiment, using the averaged values from three replicates.
2.3. Physical and Chemical Analyses
The bulk density was determined using the method of applying volume cylinders (100 cm3) []. A hydraulic depth probe (Eijkelkamp) was used to measure soil penetration resistance []. Determination of soil pH was conducted using the potentiometric method (1 M KCl) []. To determine soil organic carbon and total nitrogen values, soil samples were air-dried, then sieved through a sieve (⌀2 mm) and analyzed on a Vario Max CN apparatus (Elementar Analysensysteme GmbH, Langenselbold, Germany). The Egner-Riehm method was used to determine the available forms of potassium (K) [] and phosphorus (P) []. Bioavailable magnesium (Mg) was analyzed using the Schachtschabel method []. Determination of plant-available forms was carried out using atomic absorption spectroscopy and atomic emission spectroscopy methods with a Solaar S4 spectrometer. The ammonium and nitrate forms of mineral nitrogen were determined by flow colorimetry after extracting the soil sample in a 1% K2SO4 solution using a Skalar apparatus. Based on the results, the index of relative change was determined for selected physicochemical values (BD, SOC, TN, K, P, Mg, and soil pH). The index of relative change (Ic) was calculated as the quotient of the values of a given parameter at the beginning and end of research in a given experimental plot. An index above 1.0 indicates a favorable effect of a given combination of levels of the analyzed factors, while values lower than 1.0 indicate the opposite [].
2.4. Microbiological Analysis
The total number of culturable heterotrophic aerobic bacteria (B), actinobacteria (A), and filamentous fungi (F) was calculated using the plate count method. The test material was diluted in a series of 10-fold dilutions (from 10−1 to 10−6): 10 g of the test sample was mixed in 90 mL of sterile Ringer’s solution. Inoculation onto selective microbiological media was then carried out. Yeast–peptone medium (YPS) [] was used to determine bacteria. Actinobacteria were determined on yeast extract glucose agar (YGA) supplemented with 100 μg mL−1 nystatin []. Filamentous fungi were detected on Rose Bengal agar supplemented with 30 μg mL−1 streptomycin []. Incubation (25 °C) lasted for 10 days (rays) and 5 days (bacteria and fungi). Microbiological analyses were conducted in 4 replicates, and, after incubation, colonies were counted so that the number of colony-forming units (cfu) in 1 g of soil dry weight (cfu·g−1 soil) was determined. The index of relative changes (Ic) for the analyzed groups of microorganisms was calculated after 2 years of exposure to experimental factors. The Ic index was calculated as the quotient number of microorganisms from each experimental plot at the beginning and end of research. The values of the index above 1.0 indicate a favorable impact of a given combination of levels of the analyzed factors, and the values lower than 1.0- the opposite.
2.5. Data Analysis
Statistica.PL 12 software was used for statistical analysis []. The final results are averages of three replicates (for each experimental plot, on each sampling date). Results for soil properties had a normal distribution and were subjected to analysis of variance for multiple experiments according to a model appropriate for a randomized sub-block design. An analysis of variance (two-way ANOVA) was used, where the first factor was straw management (R) and the second factor was the application of Asahi biostimulant at different rates (A). The Tukey test was used to test the significance of differences between plot means (p ≤ 0.05). Principal component analysis (PCA) was used to evaluate the soil parameters studied. The results of this analysis are presented in the form of a graphic that shows the traits in the configuration of the first two principal components, which synthetically represent mutually correlated variables. The similarity of the influence of the experimental factors (R and A) on the physical, chemical, and biological properties of the soil was evaluated by cluster analysis using Ward’s method and presented in the form of a dendrogram.
3. Results
3.1. Bulk Density and Soil Penetration Resistance
The practice of incorporation of crop residues in spring barley cultivation significantly affected the physical parameters of the soil environment. Straw incorporation caused a statistically significant decrease in soil bulk density to a value not exceeding 1.40 g·cm−3, while, in plots where straw was removed, it ranged from 1.42 to 1.43 g·cm−3 (Table 1). The values of the index of relative change of this parameter, which, in the experimental variants R1-R3, were below 1, and, in the variants without the addition of straw R4-R6 ≥ 1, confirm the observed trend. The highest value of soil bulk density was observed in the experimental combinations, excluding the application of EM, but the differences between the variants assuming their application were not statistically significant.

Table 1.
Soil bulk density (BD) (g·cm−3) depending on the management of plant residues with the addition of the biopreparation EM (R factor) and the application of the biostimulant Asahi (A factor) in spring barley cultivation, with the index of relative change for individual factors (Ic).
Similar relations determining the effect of straw addition on the properties of cultivated soil were observed in the case of penetration resistance of the studied soils. Its average values after the straw incorporation treatment were statistically significantly lower, with a maximum of 1.39 MPa, while, in the soil without straw addition, they ranged from 1.63 MPa to 1.64 MPa (Table 2).
Table 2.
Soil penetration resistance (SPR) (MPa) depending on the management of plant residues with the addition of the biopreparation EM (R factor) and the application of the biostimulant Asahi (A factor) in spring barley cultivation.
3.2. Soil Organic Carbon and Total Nitrogen Content
The content of SOC after the introduction of straw ranged from 33.15 g·kg−1 to 35.47 g·kg−1 and was higher, compared to the results obtained in the soil without the addition of straw, where the values of this parameter ranged from 29.90 g·kg−1 to 33.33 g·kg−1. It was observed that the amount of SOC was statistically significantly higher in soil samples with a double dose of the bacterial EM inoculum than in soils where the biopreparation was not used. This applied both to soils enriched with straw and without straw addition. On the other hand, a double dose of the biostimulant Asahi resulted in a statistically significantly lower SOC content compared to the soil samples where a single dose or no biostimulant was applied. In the experimental variants with the addition of straw, an increase in the amount of SOC in the soil during the experiment was recorded, with the value of the coefficient of relative change >1 (Table 3).
Table 3.
Content of SOC, TN, and Ic in the soil, depending on the management of plant residues with the addition of the biopreparation EM (R factor) and the application of the biostimulant Asahi (A factor) in spring barley cultivation.
Similar trends were observed in the studied soils for TN, the amount of which in the two variants including the addition of straw (R2, R3) was statistically significantly higher than the corresponding variants in the soil without the introduced biomass. The highest content of this component was 2.04 g·kg−1 (R2A, R3A1), while the lowest was 1.11 g·kg−1 (R5A2). Removal of straw from the soil surface resulted in relative change index values below 1, indicating a reduction in TN concentration in the soils cultivated in this system during the entire experimental cycle (Table 3).
3.3. Mineral Nitrogen Content
The highest average content of mineral forms of nitrogen in the studied soils, determined in autumn and spring, was 26.7 and 18.5 mg·kg−1, respectively. The analysis of the effect of crop residue management in spring barley cultivation on the average content of N-NO3 and N-NH4 in the soil in autumn proved that straw incorporation resulted in lower concentrations of these compounds in the soil. However, statistically significant differences between the soils cultivated in the two systems were observed only with the application of a double dose of EM. An inverse relation in the dynamics of changes in the concentration of mineral nitrogen in the soil was observed in spring; however, the amount of this component in the samples of soils without straw addition was not lower than the others in a statistically significant manner. In both spring and autumn, no statistically significant effect of the biostimulant on the content of mineral forms of nitrogen in the soil was confirmed (Table 4).
Table 4.
Mineral forms nitrogen (N) content (mg·kg−1 N-NO3 N-NH4) in the arable layer, depending on the management of plant residues with the addition of the biopreparation EM (R factor) and the application of the biostimulant Asahi (A factor) in spring barley cultivation.
3.4. Soil pH, P, K, and Mg Content
The pH value of the tested soils after two years of exposure to the experimental factors ranged from 6.8 to 7.5 and was slightly lower in samples from plots where shredded straw was left (Table 5). The highest values of the coefficient of relative change were observed in the soil after application of a double dose of EM, regardless of the variant of the crop residue management system used. The content of available phosphorus in soil from straw-enriched plots was lower, compared to those from which biomass was removed, but the values of the relative rate of change indicate lower losses of this element in soils where crop residues were left. The maximum content of P was 184.4 mg·kg−1, and the minimum was 110.2 mg·kg−1. In the case of bioavailable forms of potassium and magnesium, the values were 192.0 and 119.6 mg·kg−1 and 32.9 and 15.3 mg·kg−1, respectively. Both the average amount of these elements and the values of its relative change index were higher in soils cultivated in systems with straw incorporation. In the case of K, the differences were particularly high, and the values of Ic > 1 demonstrate an increase in its amount in soil cultivated with the addition of shredded straw. Analysis of changes in the concentration of bioavailable forms of P, K, and Mg in the soil did not show clear trends regarding the effect of EM and biostimulant application (Table 5).
Table 5.
Soil phosphorus (P), potassium (K), and magnesium (Mg) (mg·kg−1) content, and pH of the soil, depending on the management of plant residues with the addition of the biopreparation EM (R factor) and the application of the biostimulant Asahi (A factor) in spring barley cultivation.
3.5. Density of Microorganisms
The results of the change in soil-culturable heterotrophic bacteria, actinobacteria, and fungi show an increase in the number of these microorganisms after straw incorporation. The maximum average abundance of bacteria in the soil studied was 26.4 × 10⁶ cfu·g−1. However, a statistically significant difference compared to soil without biomass incorporation was observed only in the variant involving simultaneous application of a double dose of EM biopreparation. Moreover, application of the Asahi biostimulant resulted in a statistically significant increase in the abundance of soil bacteria (Figure 1). The index of relative change in straw-enriched soils, reaching values of 1.58, confirms stronger stimulation of bacterial growth after the crop residue incorporation (Table 6).
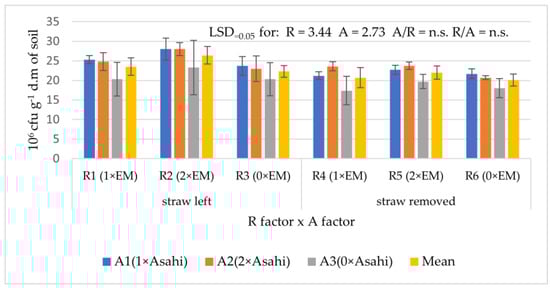
Figure 1.
The number of bacteria in the soil, depending on the management of plant residues with the addition of the biopreparation EM (R factor) and the application of the biostimulant Asahi (A factor) in spring barley cultivation. Error bars represent standard deviation (abbreviations: see Table 1).
Table 6.
Index of relative changes (Ic) in the abundance of the analyzed groups of microorganisms in the soil after 2 years of exposure to experimental factors.
Leaving shredded straw on the surface of the plots also positively affected the increase in the abundance of actinobacteria, but the differences observed within the corresponding levels of the R factor were not statistically significant (Figure 2). The highest value of this biological parameter, at 40.0 × 10⁵ cfu·g−1, was recorded in the cultivation variant combining the application of straw, a double dose of EM, and a single dose of biostimulant (R2A1). It is noteworthy that, in soil enriched with straw, the exceptionally high values (>2) of the index of relative change in the number of actinobacteria were observed (Table 6).
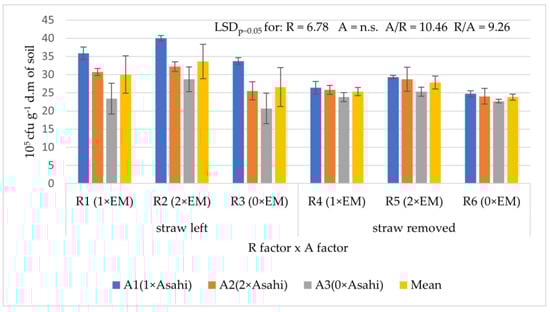
Figure 2.
The number of actinobacteria in the soil, depending on the management of plant residues with the addition of the biopreparation EM (R factor) and the application of the biostimulant Asahi (A factor) in spring barley cultivation. Error bars represent standard deviation (abbreviations: see Table 1).
The stimulatory effect of the straw introduced into the soil on the average abundance of fungi, ranging from 14.4 × 10⁴ cfu·g−1 to 23.1 × 10⁴ cfu·g−1, was not statistically significant despite the differences observed between the experimental variants (Figure 3). The application of EM and biostimulant, regardless of the dose used, also had no statistically significant effect on the number of these microorganisms in the soil. The average value of the Ic, which ranged from 1.29 to 1.49 in soils from plots with added straw, was lower in soils without straw, ranging from 0.85 to 1.02 (Table 5).
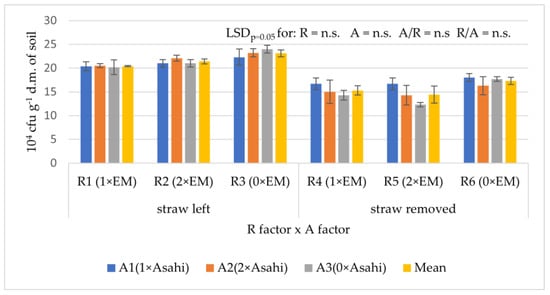
Figure 3.
The number of filamentous fungi in the soil depending on the management of plant residues with the addition of the biopreparation EM (R factor) and the application of the biostimulant Asahi (A factor) in spring barley cultivation. Error bars represent standard deviation (abbreviations: see Table 1).
The average total abundance of culturable microorganisms in the soil after the experimental cycle ranged from 22.4 cfu·g−1 to 29.9 × 10⁶ cfu·g−1 (Figure 4). Similar to the individual groups of tested microorganisms, the abundance of microorganisms and the value of the relative change index were higher in soils where shredded straw was left (Table 5). In contrast, the results indicate the potential of the EM biopreparation and Asahi biostimulant to activate soil microbial growth. In plots with the addition of straw, the application of EM in the variant with a double application of this preparation resulted in a statistically significant higher average abundance of the tested microorganisms compared to the cultivation variants without or with a single dose of EM. On the other hand, the application of the biostimulant Asahi, both in a single- and two-dose variant, resulted in a statistically significant higher average abundance of the tested microorganisms compared to the soil where this agent was not applied.
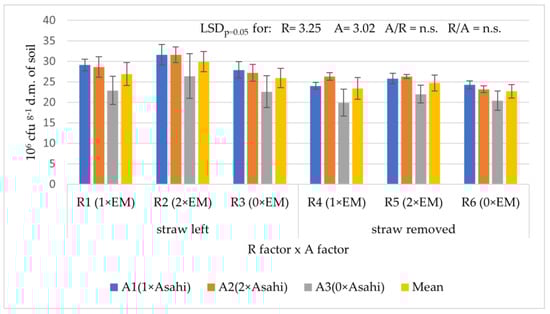
Figure 4.
Total number of microorganisms in the soil depending on the management of plant residues with the addition of the biopreparation EM (R factor) and the application of the biostimulant Asahi (A factor) in spring barley cultivation. Error bars represent standard deviation (abbreviations: see Table 1).
3.6. Principal Component Analysis—PCA
To determine the character and strength of correlations between the investigated soil parameters (bulk density, soil penetration resistance, organic carbon content, content of total nitrogen, mineral nitrogen forms, pH in 1 M KCl (pH), content of available phosphorus, potassium, magnesium, bacteria, actinobacteria, fungi, the total number of microorganisms, and applied straw management with the addition of EM biopreparation and the application of Asahi biostimulant), the method of multivariate principal component analysis—PCA—was applied (Figure 5a). From the available data, two principal components were extracted (PC1 and PC2), which explained a total variance of 67.4%. The majority was explained by PC1 (49.5%) and PC2 (17.9%). PCA analysis demonstrated the first component (PC1) was significantly negatively associated with pH, Pa, B, A, and TNM. The second component (PC2) was significantly positively correlated with SOC, TN, MN, Mg, Ka, and F. Based on the projection of the cases, it is evident that PCA1 includes all the sites with straw that positively influenced all the studied parameters (Figure 5b).
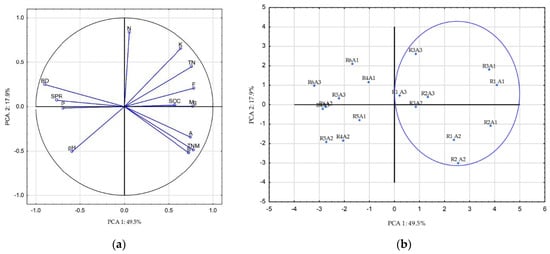
Figure 5.
Principal component analysis derived from the studied soil properties. (a) PCA analysis (principal component analysis PC1, PC2) of soil properties: BD, SPR, SOC, TN, N, pH, P, K, Mg, B, A, F, TMN; (b) projection of the cases on the factor-plane—principal component analysis of the variables: R1-R6: the way of crop residue management; A1-A3: biostimulant application (abbreviations: see Table 1).
Cluster analysis performed on the basis of Euclidean distances (Ward’s method) allowed to separate clusters based on the differentiation of variables (Figure 6). Based on the dendrogram generated from the obtained data, four clusters were distinguished. Cluster 1 grouped only the sites with straw application to the soil, which had the highest SOC, TN, N, and assimilated forms of K, P, and Mg. Three of the six sites in this cluster had the highest abundance of actinobacteria (A) (R1A1, R2A1, R3A1) and soil fungi (F) (R3A1, R3A2, R3A3). Most of the four sites in the second cluster were distinguished by low potassium (K) content (and the lowest values of bulk density (BD) and soil penetration resistance (SPR). Clusters 3 and 4 included sites with removed straw. Clusters 3 and 4 included sites from the surface of which straw was removed. It is noteworthy that all elements of cluster 4 (R5A2, R6A2, R6A3) were characterized by the lowest content of organic forms of SOC and nitrogen TN. In addition, the average abundance of microorganisms of both bacteria, actinobacteria, and fungi for the sites of clusters 3 and 4 was at a relatively lower level than in the other sites. The highest content of bioavailable forms of P (P) and high soil penetration resistance (SPR) was recorded there.
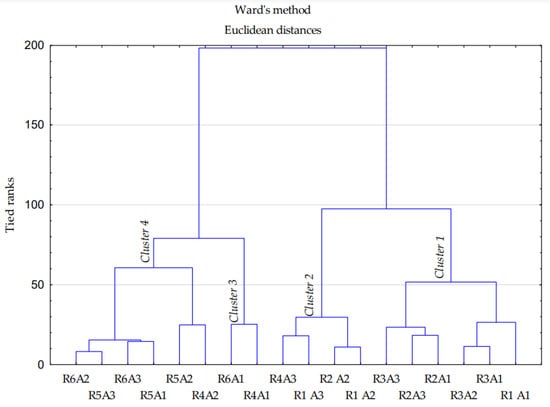
Figure 6.
Dendrogram analysis of physicochemical and microbial soil characteristics (abbreviations: see Table 1).
4. Discussion
The widespread and well-established awareness of agricultural producers of the need to implement the principles of sustainable agriculture results in decisions that enable both the preservation of an adequate level of production and the protection of natural environmental resources.
A decrease in the intensity of agricultural practices and introduction of systems that, for example, minimize or exclude the use of plowing or reduce energy consumption, positively affect key soil physicochemical parameters [,,]. One of the practices that correspond to the principles of sustainable agriculture, ensuring the sustainability of crop production and mitigation of climate change, is the incorporation of crop residues, including cereal straw. Straw addition has a scientifically proven positive effect on many soil properties, but the greatest importance is associated with enriching the soil with organic carbon []. A deficit of this component can lead to disturbances in the proper functioning of the soil environment, resulting in its depletion in nutrients necessary for crops’ growth and yield level [,].
The introduction of biomass into the soil environment not only affects its chemical properties. According to Wang et al. [], the application of high doses of straw for several years resulted in a decrease in soil bulk density as an effect of increased organic matter accumulation. Lower bulk density of straw-enriched soils, compared to the control site, was also observed by Zhang et al. []. Similar results were obtained in our own study.
Jensen et al. [] observed that straw incorporation, practiced for nearly 40 years, variably modified soil chemical properties, resulting in both increases and decreases in spring barley yields. Particularly valuable was the increase in SOC content and related water capacity, which resulted in an increase in yield in a year characterized by long-term drought. Considering the ongoing climate change and the increased risk of long periods of drought in moderate-climate countries as well, incorporation of straw may be one of many ways to protect yields from the adverse effects of water deficiency. An increase in SOC content due to straw incorporation ranging from 5.2 to 13.7% and positively correlated with application rate was also observed by Wang et al. [].
In the study of Zhao et al. [], the increase in SOC content with retention of agricultural residues was 12.3%. According to Powlson et al. [], the average annual increase in SOC after straw application at a rate of 7.5 t fresh weight ha−1 year is 375 kg C ha−1. Jianhua et al. [] demonstrated that mixing straw with soil results in a higher increase in organic carbon and greater C sequestration compared to a method limited to leaving straw in the field.
In our study, an increase in the amount of SOC was observed after two years following the introduction of barley straw to the soil. This trend was confirmed by the values exceeding 1 of the relative change index calculated for experimental combinations taking into account leaving straw in the field (R1–R3). A similar relation between straw left in the field and amount of organic carbon in the soil was also observed in our works on winter and spring wheat cultivation [,]. As suggested by Zhang et al. [], increased concentration and storage of SOC in soil with the addition of straw can offset the negative effects of intensive tillage by improving the physical and chemical characteristics of degraded soil.
However, inadequate soil application of straw and intensive decomposition processes can lead to negative changes in soil chemistry, especially in terms of the amount of the key element for crop development—nitrogen []. Lower barley yields as a result of straw application were observed by Jensen et al. []. According to the authors’ suggestion, the phenomenon observed was directly related to immobilization of plant-available mineral forms of nitrogen and reduced supply of this element. On the other hand, in a study by Akhtar et al. [], the amount of available nitrogen and total nitrogen in soil enriched with wheat straw at 5000 kg·ha−1 increased, compared to soil without straw addition, by 31.9 and 11.8%, respectively. An 8.4 to 10.5% increase in soil assimilable nitrogen, correlated with the amount of straw application, was also reported by Wang et al. []. A relatively weak correlation between wheat straw incorporation and N content was observed in our earlier research [,]. The results of the current study indicate a reduction, generally statistically significant, in TN concentration in soils cultivated in a system involving straw removal from the plot (Table 3). Straw incorporation in autumn resulted in a decrease in the content of mineral forms of nitrogen, while the opposite trend was shown by the results of soil analyses conducted in spring (Table 4). Seasonal changes in soil nitrogen content result from a number of factors of a biological, chemical, and physical nature (e.g., mineralization, leaching, plant uptake, cultivation practices) []. According to Haberle et al. 2009 [], mineralization of nitrogen from organic matter introduced into the soil in autumn can compensate for spring deficits of this element due to leaching. In the study by Arlauskienė et al. 2019 [], the effect of autumn application of chopped straw on changes in mineral N content depended on the type of catch crop whose biomass was introduced into the soil with the straw.
The effect of straw application on other soil chemical parameters, considered indicators of soil quality and productivity, is variable []. Wang et al. [] observed an increase in phosphorus content due to a 5-year soil application of straw, exceeding 10%. Akhtar et al. [] reported that incorporating straw at 6000 kg ha−1 led to an increase in the amount of available forms of phosphorus and potassium in the soil compared to the control, but the highest values were obtained by combining its application with the application of mineral nitrogen fertilization. Lower potassium content in soils from which straw was removed was also observed in our own previous studies [].
Except for a change in the concentration of individual nutrients, the addition of straw also affects the soil pH, leading to its unfavorable, from the point of view of plant cultivation, acidification [,,]. The conducted studies indicate a minor decrease in pH in soils enriched with straw. As the indicators of relative change show, the content of bioavailable forms of P, K, and Mg generally decreased gradually after two years of the experiment regardless of the experimental variant used. The exception was an increase in potassium content, which was observed only in the soil from plots with the addition of straw (Table 5).
The balanced functioning of soil as an ecosystem requires the presence and activity of soil microorganisms. Their biodiversity, mutual interactions, and the intensity of metabolic reactions determine the rate of conversion of organic matter and unabsorbable forms of elements into plant-available forms []. The results of most studies demonstrate that introduction of straw into soil has a stimulating effect on the development of microorganisms, causing an increase in their abundance and activity. This phenomenon is a direct result of enriching the soil, as a habitat for microorganisms, with additional organic matter, which contains essential nutrients and a source of energy. An increase in the concentration of soil microbial biomass carbon as an effect of straw incorporation treatment was observed by Sharma et al. [] and Wang et al. []. A similar trend was observed in our own previous studies comparing the properties of soils cultivated in systems incorporating different stubble management methods []. They showed a positive effect of straw incorporation on microbial abundance, and the total number of microorganisms was significantly correlated with the content of organic carbon and available forms of P, K, and Mg.
Analyzing the role of microorganisms in the carbon cycle, it should be remembered that carbon from their cells constitutes a significant part of the total content of this element in the soil []. In our study, the average abundance of the studied microbial groups was higher in the soil cultivated in the experimental variants with the addition of straw. Particularly strong stimulation of microbial growth after the introduction of crop residues into the soil is also confirmed by the high values of the relative change index (Table 6), which were even higher than 2 (for actinobacteria).
In order to reduce the number of treatments using biologically active chemical compounds, modern sustainable agriculture uses alternatives to conventional pesticides and mineral fertilizer preparations. The composition of these products is based on various genera of active microorganisms, substances of natural origin characterized by a minimized risk of contamination of the environment [,]. The potential positive effects of the application of such preparations on the properties of soil and plants can be considered as factors that minimize the negative impact of the simplifications used in the farming system based on monoculture. EMs, due to their wide spectrum of potential applications, are classified as biostimulants, as well as a type of biofertilizer and biopesticide []. It is considered that they may positively influence the natural fertility of the soil by creating favorable conditions for the development of beneficial microorganisms. Optimizing the nutrition system of plants can lead to an increase in crop yields and also assists in controlling crop pests and diseases [,,,]. The effects of biostimulants applied directly to plant tissues resemble those induced by plant hormones, while they can also be applied as soil adjuvants to enhance the efficacy of soil-applied pesticides and fertilizers []. Biostimulants improve soil structure, increase tolerance of plants to abiotic stresses, and enhance the efficiency of uptake of water and nutrients from soil [,]. Moreover, biostimulators stimulate plants to regenerate damaged tissues, protect against infections, and reduce the growth of some pathogenic fungi []. According to the European Biostimulant Industry Council (EBIC), the major aim of biostimulant application is “to stimulate natural processes to benefit nutrient uptake, nutrient efficiency, tolerance to abiotic stress, and/or crop quality, independently of its nutrient content” []. In our study, we observed different effects of the EM bacterial inoculum and biostimulant on the analyzed soil properties. The application of a double dose of EM increased the amount of SOC both in straw-enriched soils and soil without the addition of straw (Table 3). The application of EM as well as the biostimulant Asahi also led to a stimulation of the total number of microorganisms in the soil (Figure 4). While in our study the index of relative change value >1 clearly confirms an upward trend in the number of soil microorganisms as a result of EM application, due to the high heterogeneity of this environment, the quantitative changes in native soil microorganisms may be specific to the experimental site. The possibility of an increase in the number of soil microorganisms as an effect of the use of EM preparations was questioned by Golec et al. []. Moreover, Vliet et al. [] stated that, in environments with high activity of native microorganisms (e.g., soil, slurry), changes in their numbers following EM application will be temporary.
5. Conclusions
Straw incorporation, in addition to its repeatedly proven positive effects on soil organic carbon content, microbial activity, and bulk density, also increases the soil’s potential for CO2 sequestration, which is particularly valuable with the rapid climate changes currently observed. The results of our study also proved an increase in SOC content in soil to which barley straw was introduced, and its addition also had a positive effect on the physical and microbiological properties of the soil. However, analysis of the results of similar studies indicates that changes in soil due to straw incorporation do not always bring reasonable ecological and economic benefits. Therefore, it seems that, in order to reach a compromise between the possibility of improving the quality of soil and crops through the incorporation of straw into soil and the benefits of using its resources in pro-ecological energy, it is necessary to develop a rational strategy for straw management tailored to the individual region, taking into account its climatic and economic peculiarities.
Author Contributions
Conceptualization, R.L. and B.B.-B.; methodology, R.L. and B.B.-B.; investigation, R.L. and B.B.-B.; data curation—compiled and analyzed the results, B.B.-B., J.B.-K., R.L. and P.K.; writing—original draft preparation, J.B.-K., B.B.-B., R.L. and P.K.; review and editing, B.B.-B., J.B.-K. and P.K.; supervision, B.B.-B. and J.B.-K. All authors have read and agreed to the published version of the manuscript.
Funding
The study was funded by National Science Centre, Poland (grant no. PB-7295/B/P01/2011/40).
Institutional Review Board Statement
Not applicable.
Informed Consent Statement
Not applicable.
Data Availability Statement
Not applicable.
Acknowledgments
The authors would like to express their sincere gratitude to Karol Kotwica (Department of Agronomy, Faculty of Agriculture and Biotechnology, Bydgoszcz University of Science and Technology) for professional preparation of experimental plots and agrotechnical treatments.
Conflicts of Interest
The authors declare no conflict of interest.
References
- Borychowski, M.; Grzelak, A.; Popławski, Ł. What Drives Low-Carbon Agriculture? The Experience of Farms from the Wielkopolska Region in Poland. Environ. Sci. Pollut. Res. 2022, 29, 18641–18652. [Google Scholar] [CrossRef] [PubMed]
- UNFCCC. Adoption of the Paris Agreement, Proposal by the President Draft Decision-/CP.21; UNFCCC: Paris, France, 2015. [Google Scholar]
- Han, M.; Zhao, Q.; Li, W.; Ciais, P.; Wang, Y.-P.; Goll, D.S.; Zhu, L.; Zhao, Z.; Wang, J.; Wei, Y.; et al. Global Soil Organic Carbon Changes and Economic Revenues with Biochar Application. GCB Bioenergy 2022, 14, 364–377. [Google Scholar] [CrossRef]
- Ray, R.L.; Griffin, R.W.; Fares, A.; Elhassan, A.; Awal, R.; Woldesenbet, S.; Risch, E. Soil CO2 Emission in Response to Organic Amendments, Temperature, and Rainfall. Sci. Rep. 2020, 10, 5849. [Google Scholar] [CrossRef]
- Blanco-Canqui, H.; Lal, R. Soil Structure and Organic Carbon Relationships Following 10 Years of Wheat Straw Management in No-Till. Soil Tillage Res. 2007, 95, 240–254. [Google Scholar] [CrossRef]
- Zhang, P.; Wei, T.; Li, Y.; Wang, K.; Jia, Z.; Han, Q.; Ren, X. Effects of Straw Incorporation on the Stratification of the Soil Organic C, Total N and C:N Ratio in a Semiarid Region of China. Soil Tillage Res. 2015, 153, 28–35. [Google Scholar] [CrossRef]
- Monforti, F.; Lugato, E.; Motola, V.; Bódis, K.; Scarlat, N.; Dallemand, J. Optimal Energy Use of Agricultural Crop Residues Preserving Soil Organic Carbon Stocks in Europe. Renew. Sustain. Energy Rev. 2015, 44, 519–529. [Google Scholar] [CrossRef]
- Jensen, J.L.; Thomsen, I.K.; Eriksen, J.; Christensen, B.T. Spring Barley Grown for Decades with Straw Incorporation and Cover Crops: Effects on Crop Yields and N Uptake. Field Crops Res. 2021, 270, 108228. [Google Scholar] [CrossRef]
- Lamparski, R.; Kotwica, K.; Modnicki, D.; Balcerek, M.; Koim-Puchowska, B. The Effect of Pro-Ecological Procedures and Plant Injury on the Content of Free Phenolic Acids in Winter Wheat and on the Feeding and Development of Oulema Melanopus. Arthropod-Plant Interact. 2021, 15, 937–947. [Google Scholar] [CrossRef]
- Iriti, M.; Scarafoni, A.; Pierce, S.; Castorina, G.; Vitalini, S. Soil Application of Effective Microorganisms (EM) Maintains Leaf Photosynthetic Efficiency, Increases Seed Yield and Quality Traits of Bean (Phaseolus vulgaris L.) Plants Grown on Different Substrates. IJMS 2019, 20, 2327. [Google Scholar] [CrossRef]
- Sawicka, B.; Pszczółkowski, P.; Kiełtyka-Dadasiewicz, A.; Barbaś, P.; Ćwintal, M.; Krochmal-Marczak, B. The Effect of Effective Microorganisms on the Quality of Potato Chips and French Fries. Appl. Sci. 2021, 11, 1415. [Google Scholar] [CrossRef]
- Belova, T.A.; Protasova, M.V. Technology of Effective Microorganisms for the Growth of Agricultural Plants of the Fabaceae Family. IOP Conf. Ser. Earth Environ. Sci. 2021, 845, 012050. [Google Scholar] [CrossRef]
- Shin, K.; van Diepen, G.; Blok, W.; van Bruggen, A.H.C. Variability of Effective Micro-Organisms (EM) in Bokashi and Soil and Effects on Soil-Borne Plant Pathogens. Crop Prot. 2017, 99, 168–176. [Google Scholar] [CrossRef]
- Schenck zu Schweinsberg-Mickan, M.; Müller, T. Impact of Effective Microorganisms and Other Biofertilizers on Soil Microbial Characteristics, Organic-matter Decomposition, and Plant Growth. Z. Pflanzenernähr. Bodenk. 2009, 172, 704–712. [Google Scholar] [CrossRef]
- Mayer, J.; Scheid, S.; Widmer, F.; Fliessbach, A.; Oberholzer, H.-R. How Effective Are “Effective Microorganisms (R) (EM)”? Results from a Field Study in Temperate Climate. Appl. Soil Ecol. 2010, 46, 230–239. [Google Scholar] [CrossRef]
- Javaid, A.; Bajwa, R. Field Evaluation of Effective Microorganisms (EM) Application for Growth, Nodulation, and Nutrition of Mung Bean. Turk. J. Agric. For. 2011, 35, 443–452. [Google Scholar] [CrossRef]
- FAO IUSS Working Group WRB. World References Base for Soil Resources; FAO: Rome, Italy, 2015; p. 132. [Google Scholar]
- United States Department of Agriculture. Soil Mechanics Level I Module 3 USDA Soil Textural Classification Study Guide; United States Department of Agriculture: Washington, DC, USA, 1987.
- Lamparski, R. Entomologiczne i Biochemiczne Skutki Stosowania Proekologicznych Zabiegów Agrotechnicznych w Jeczmieniu Jarym; Wydawnictwa Uczelniane Uniwersytetu Technologiczno-Przyrodniczego: Bydgoszcz, Poland, 2016; ISBN 978-83-65603-03-6. [Google Scholar]
- Hao, X.; Ball, B.; Culley, J.; Carter, M.; Parkin, G. Soil Density and Porosity. In Soil Sampling and Methods of Analysis; Carter, M., Gregorich, E., Carter, M., Gregorich, E., Eds.; Canadian Society of Soil Science: Boca Raton, FL, USA, 2008; pp. 743–759. [Google Scholar]
- Nugis, E.; LÜÜS, L.; Kuht, J. Results of Express-Diagnostics Evaluation of Soil Basing on Penetration Resistance Measuring. Ann. Wars. Univ. Life Sci.—SGGW Agric. 2014, 64, 15–24. [Google Scholar]
- PN-ISO 10390; Chemical and Agricultural Analysis—Determining Soil pH. Polish Standards Committee: Warsaw, Poland, 1997.
- PN-R-04022; Chemical and Agricultural Analysis—Determination of the Content Available Potassium in Mineral Soils. Polish Standards Committee: Warsaw, Poland, 1996.
- PN-R-04023; Chemical and Agricultural Analysis—Determination of the Content of Available Phosphorus in Mineral Soils. Polish Standards Committee: Warszawa, Poland, 1996.
- PN-R-04020; Chemical and Agricultural Analysis. Determination of the Content Available Magnesium. Polish Standards Committee: Warsaw, Poland, 1994.
- Kotwica, K.; Breza-Boruta, B.; Bauza-Kaszewska, J.; Kanarek, P.; Jaskulska, I.; Jaskulski, D. The Cumulative Effect of Various Tillage Systems and Stubble Management on the Biological and Chemical Properties of Soil in Winter Wheat Monoculture. Agronomy 2021, 11, 1726. [Google Scholar] [CrossRef]
- Atlas, R.M. Handbook of Microbiological Media; CRC Press: Boca Raton, FL, USA, 2010; ISBN 978-0-429-13049-6. [Google Scholar]
- Crawford, D.L.; Lynch, J.M.; Whipps, J.M.; Ousley, M.A. Isolation and Characterization of Actinomycete Antagonists of a Fungal Root Pathogen. Appl. Environ. Microbiol. 1993, 59, 3899–3905. [Google Scholar] [CrossRef]
- TIBCO® Data Science. Available online: https://www.tibco.com/products/data-science (accessed on 18 July 2022).
- Pagliai, M.; Vignozzi, N.; Pellegrini, S. Soil Structure, and the Effect of Management Practices. Soil Tillage Res. 2004, 79, 131–143. [Google Scholar] [CrossRef]
- Schlesinger, W.H.; Amundson, R. Managing for Soil Carbon Sequestration: Let’s Get Realistic. Glob. Chang. Biol. 2019, 25, 386–389. [Google Scholar] [CrossRef]
- Panasiewicz, K.; Faligowska, A.; Szymańska, G.; Szukała, J.; Ratajczak, K.; Sulewska, H. The Effect of Various Tillage Systems on Productivity of Narrow-Leaved Lupin-Winter Wheat-Winter Triticale-Winter Barley Rotation. Agronomy 2020, 10, 304. [Google Scholar] [CrossRef]
- Wang, Q.; Liu, X.; Li, J.; Yang, X.; Guo, Z. Straw Application and Soil Organic Carbon Change: A Meta-Analysis. Soil Water Res. 2021, 16, 112–120. [Google Scholar] [CrossRef]
- Zhao, X.; Liu, B.-Y.; Liu, S.-L.; Qi, J.-Y.; Wang, X.; Pu, C.; Li, S.-S.; Zhang, X.-Z.; Yang, X.-G.; Lal, R.; et al. Sustaining Crop Production in China’s Cropland by Crop Residue Retention: A Meta-Analysis. Land Degrad. Dev. 2020, 31, 694–709. [Google Scholar] [CrossRef]
- Gerke, J. The Central Role of Soil Organic Matter in Soil Fertility and Carbon Storage. Soil Syst. 2022, 6, 33. [Google Scholar] [CrossRef]
- Wang, X.; Jia, Z.; Liang, L.; Zhao, Y.; Yang, B.; Ding, R.; Wang, J.; Nie, J. Changes in Soil Characteristics and Maize Yield under Straw Returning System in Dryland Farming. Field Crops Res. 2018, 218, 11–17. [Google Scholar] [CrossRef]
- Powlson, D.S.; Bhogal, A.; Chambers, B.; Coleman, K.; Macdonald, A.; Goulding, K.; Whitmore, A. The Potential to Increase Soil Carbon Stocks through Reduced Tillage or Organic Material Additions in England and Wales: A Case Study. Agric. Ecosyst. Environ. 2012, 146, 23–33. [Google Scholar] [CrossRef]
- Li, J.; Li, H.; Zhang, Q.; Shao, H.; Gao, C.; Zhang, X. Effects of Fertilization and Straw Return Methods on the Soil Carbon Pool and CO2 Emission in a Reclaimed Mine Spoil in Shanxi Province, China. Soil Tillage Res. 2019, 195, 104361. [Google Scholar] [CrossRef]
- Breza-Boruta, B.; Kotwica, K.; Bauza-Kaszewska, J. Effect of Tillage System and Organic Matter Management Interactions on Soil Chemical Properties and Biological Activity in a Spring Wheat Short-Time Cultivation. Energies 2021, 14, 7451. [Google Scholar] [CrossRef]
- Akhtar, K.; Wang, W.; Ren, G.; Khan, A.; Feng, Y.; Yang, G. Changes in Soil Enzymes, Soil Properties, and Maize Crop Productivity under Wheat Straw Mulching in Guanzhong, China. Soil Tillage Res. 2018, 182, 94–102. [Google Scholar] [CrossRef]
- Wey, H.; Hunkeler, D.; Bischoff, W.-A.; Bünemann, E.K. Field-Scale Monitoring of Nitrate Leaching in Agriculture: Assessment of Three Methods. Environ. Monit. Assessment 2022, 194, 4. [Google Scholar] [CrossRef]
- Haberle, J.; Kusá, H.; Svoboda, P.; Klír, J. The Changes of Soil Mineral Nitrogen Observed on Farms between Autumn and Spring and Modelled with a Simple Leaching Equation. Soil Water Res. 2009, 4, 159–167. [Google Scholar] [CrossRef]
- Arlauskienė, A.; Cesevičienė, J.; Velykis, A. Improving Mineral Nitrogen Control by Combining Catch Crops, Fertilisation, and Straw Management in a Clay Loam Soil. Acta Agric. Scand. Sect. B—Soil Plant Sci. 2019, 69, 422–431. [Google Scholar] [CrossRef]
- Jacoby, R.; Peukert, M.; Succurro, A.; Koprivova, A.; Kopriva, S. The Role of Soil Microorganisms in Plant Mineral Nutrition—Current Knowledge and Future Directions. Front. Plant Sci. 2017, 8, 1617. [Google Scholar] [CrossRef]
- Sharma, S.; Singh, P.; Kumar, S. Responses of Soil Carbon Pools, Enzymatic Activity, and Crop Yields to Nitrogen and Straw Incorporation in a Rice-Wheat Cropping System in North-Western India. Front. Sustain. Food Syst. 2020, 4, 532704. [Google Scholar] [CrossRef]
- Coonan, E.C.; Kirkby, C.A.; Kirkegaard, J.A.; Amidy, M.R.; Strong, C.L.; Richardson, A.E. Microorganisms and Nutrient Stoichiometry as Mediators of Soil Organic Matter Dynamics. Nutr. Cycl. Agroecosyst. 2020, 117, 273–298. [Google Scholar] [CrossRef]
- Megali, L.; Glauser, G.; Rasmann, S. Fertilization with Beneficial Microorganisms Decreases Tomato Defenses against Insect Pests. Agron. Sustain. Dev. 2014, 34, 649–656. [Google Scholar] [CrossRef]
- Górski, R.; Kleiber, T.; Sobieralski, K. The influence of effective microorganisms application on the chemical composition in lettuce grown under cover. Ecol. Chem. Eng. A 2017, 24, 113–121. [Google Scholar] [CrossRef]
- Feitosa de Vasconcelos, A.C.; Garófalo Chaves, L.H. Biostimulants and Their Role in Improving Plant Growth under Abiotic Stresses. In Biostimulants in Plant Science; Mahyar Mirmajlessi, S., Radhakrishnan, R., Eds.; IntechOpen: London, UK, 2020; ISBN 978-1-83880-161-8. [Google Scholar]
- Soltaniband, V. Effects of Biostimulants on Soil Microbiota, Plant Development, Crop Productivity and Fruit Quality of Protected Strawberries; Université Laval: Québec, QC, USA, 2020. [Google Scholar]
- Lephatsi, M.M.; Meyer, V.; Piater, L.A.; Dubery, I.A.; Tugizimana, F. Plant Responses to Abiotic Stresses and Rhizobacterial Biostimulants: Metabolomics and Epigenetics Perspectives. Metabolites 2021, 11, 457. [Google Scholar] [CrossRef]
- Ricci, M.; Tilbury, L.; Daridon, B.; Sukalac, K. General Principles to Justify Plant Biostimulant Claims. Front. Plant Sci. 2019, 10, 494. [Google Scholar] [CrossRef] [PubMed]
- Cóndor_Golec, A.F.; González Pérez, P.; Lokare, C. Microorganismos Efi Caces: Mito o Realidad? Rev. Peru. Biol. 2013, 14, 315–319. [Google Scholar] [CrossRef]
- van Vliet, P.C.J.; Bloem, J.; de Goede, R.G.M. Microbial Diversity, Nitrogen Loss and Grass Production after Addition of Effective Micro-Organisms® (EM) to Slurry Manure. Appl. Soil Ecol. 2006, 32, 188–198. [Google Scholar] [CrossRef]
Publisher’s Note: MDPI stays neutral with regard to jurisdictional claims in published maps and institutional affiliations. |
© 2022 by the authors. Licensee MDPI, Basel, Switzerland. This article is an open access article distributed under the terms and conditions of the Creative Commons Attribution (CC BY) license (https://creativecommons.org/licenses/by/4.0/).