

Fusion of Vermicompost and Sewage Sludge as Dark Fermentative Biocatalyst for Biohydrogen Production: A Kinetic Study

Abstract
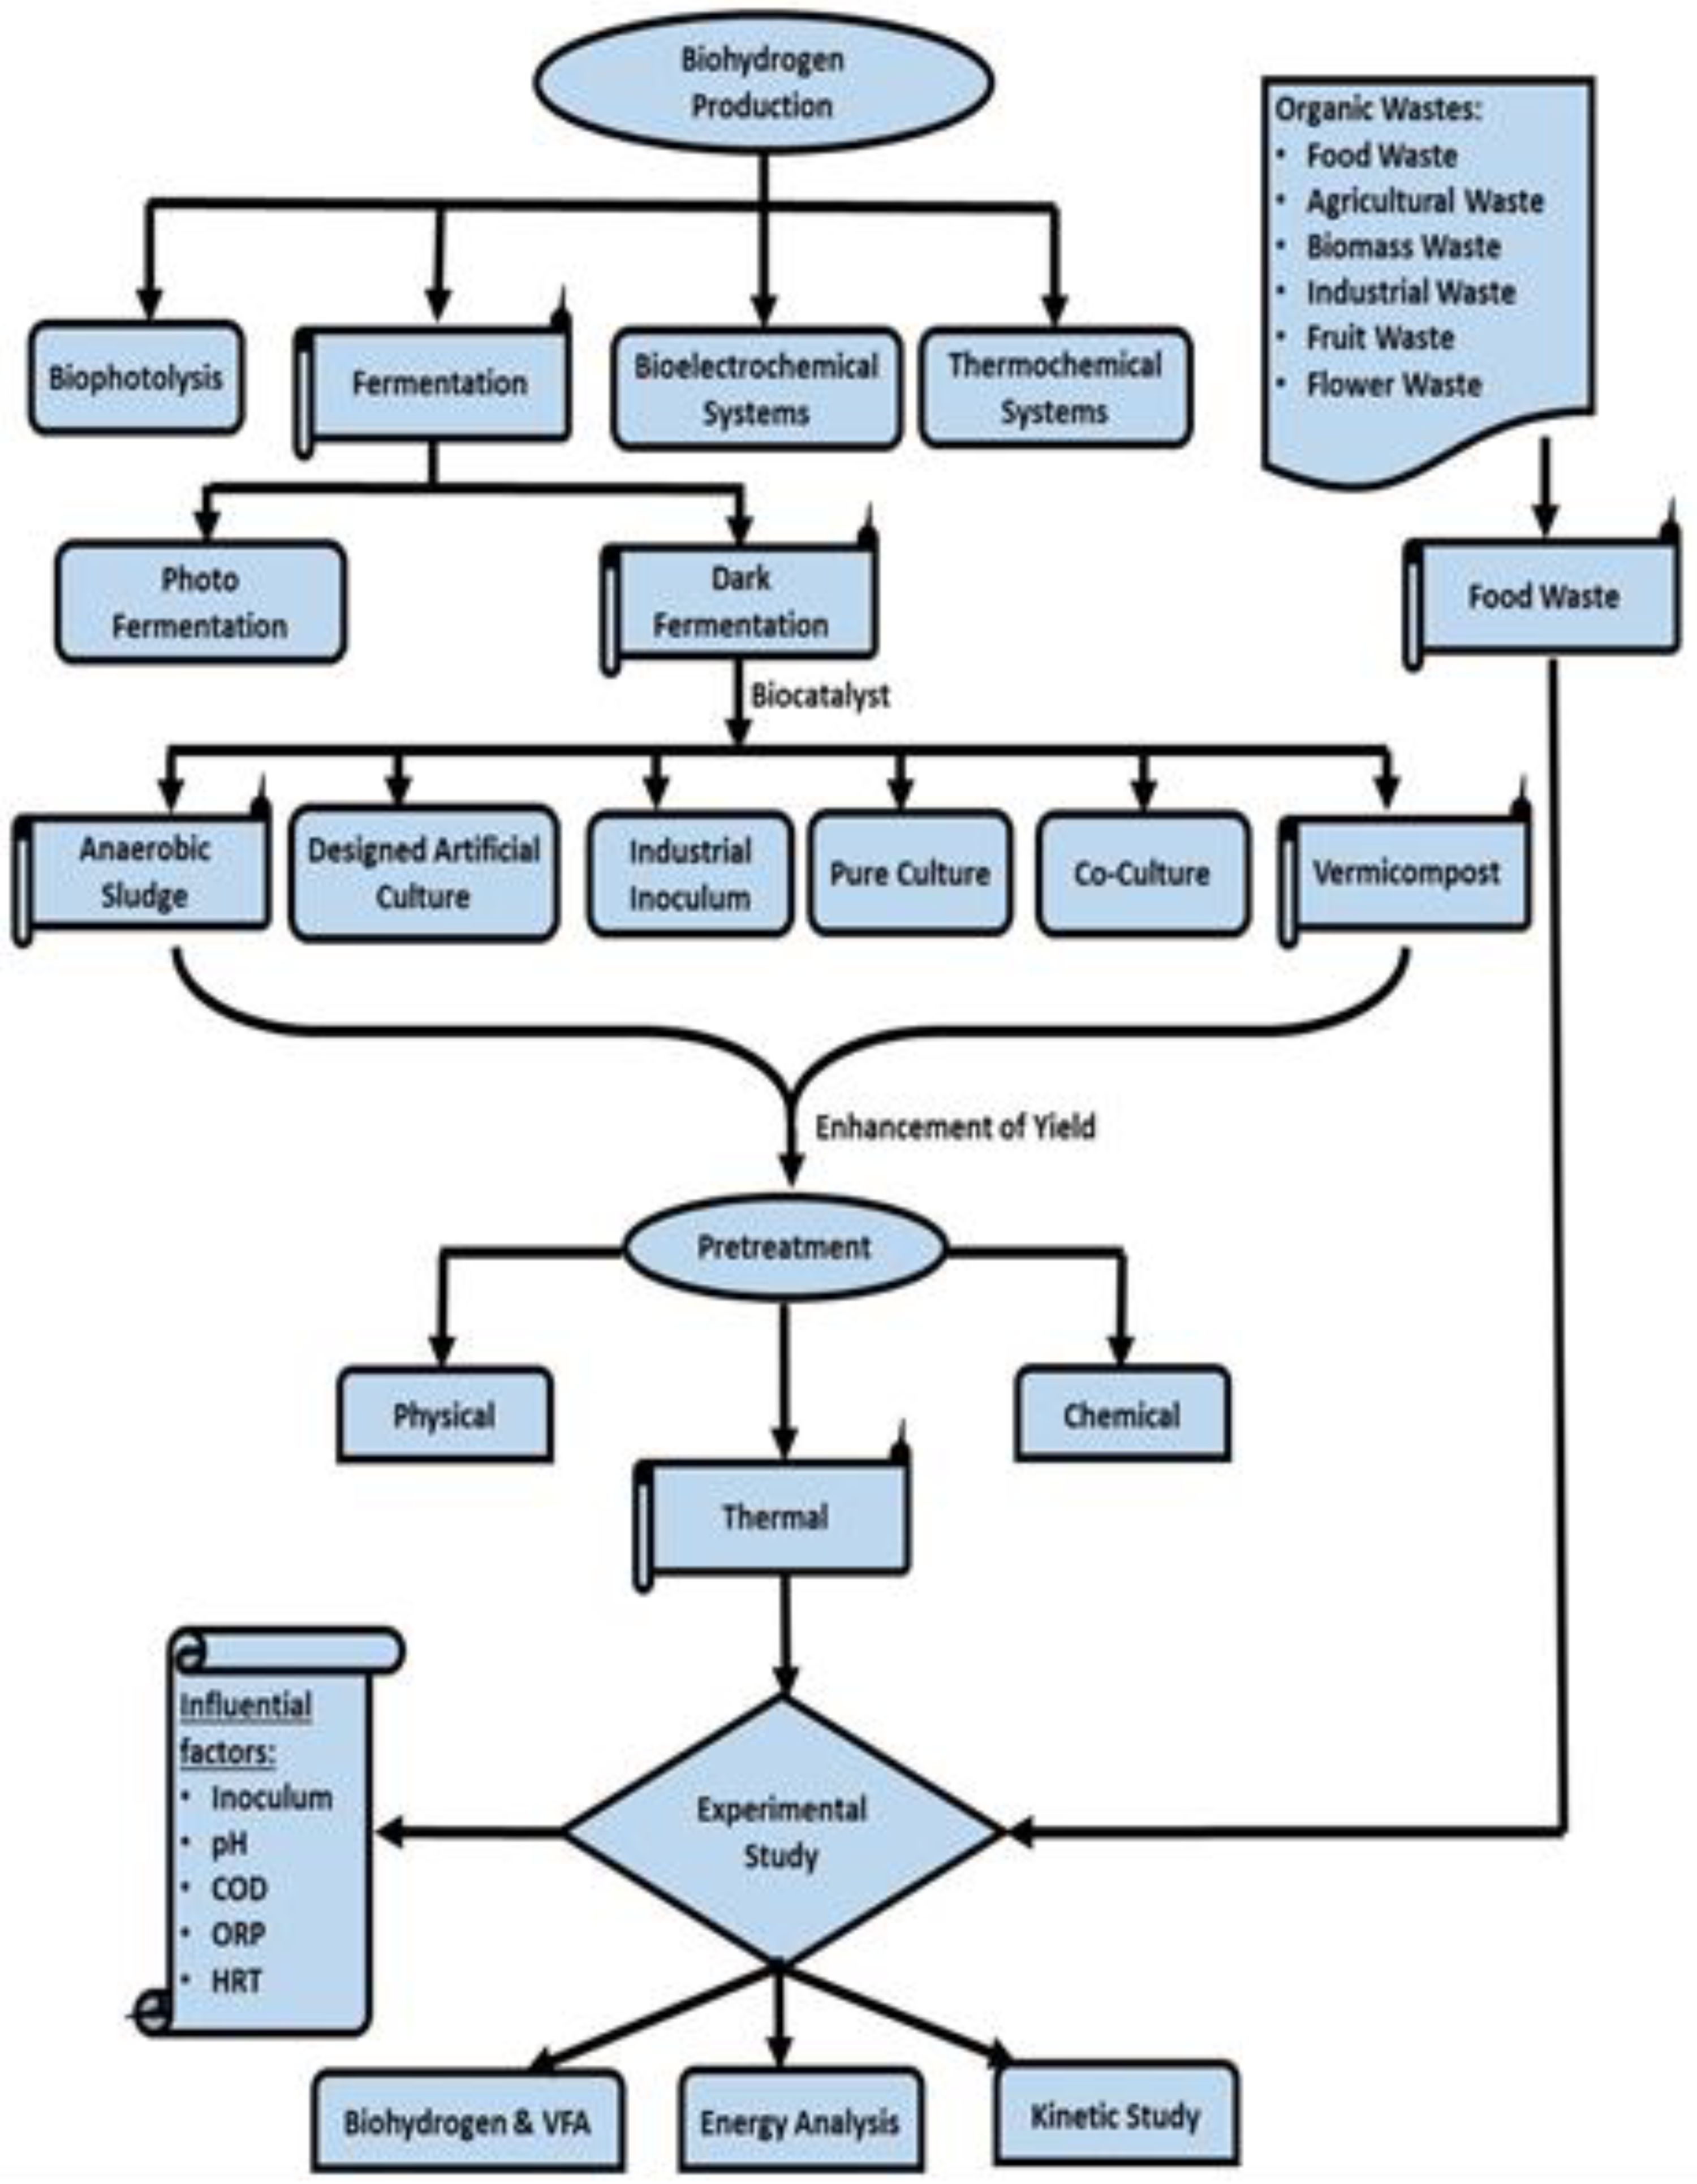
:1. Introduction
2. Materials and Methods
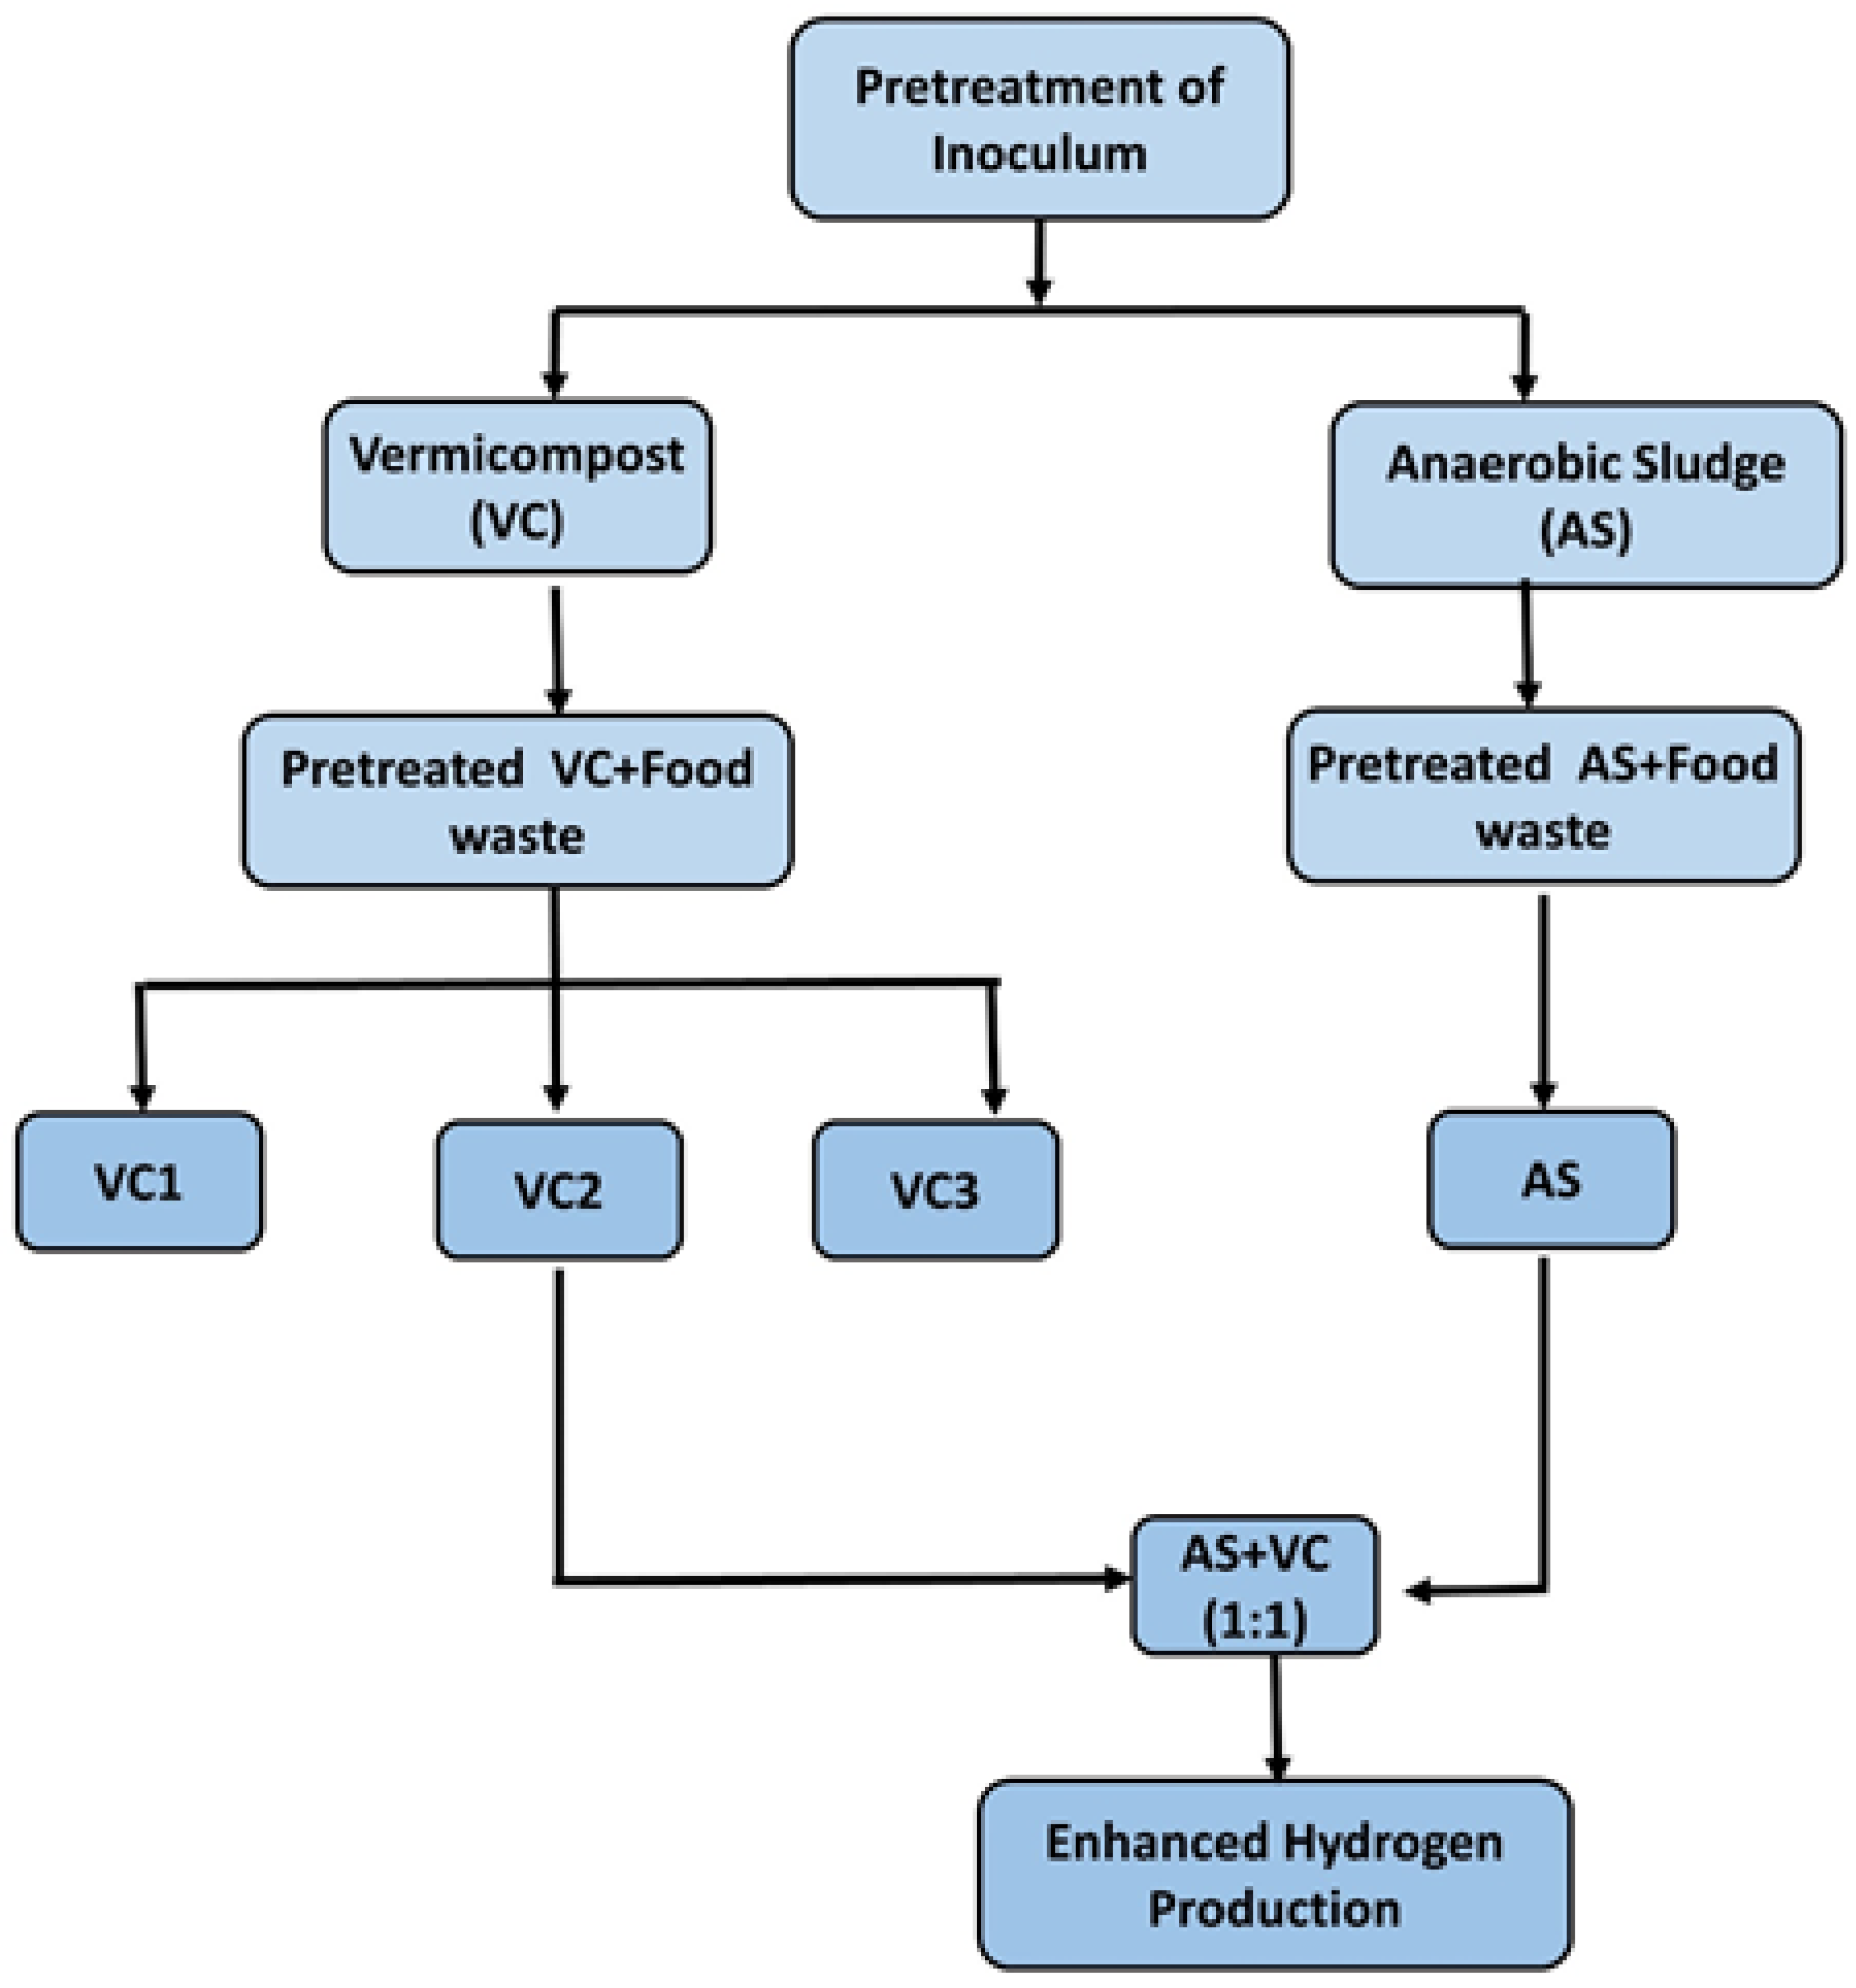
2.1. Substrate and Inoculum
2.2. Experimental Reactor Setup and Analysis
2.3. Analysis
2.4. Calculation of Hydrogen Conversion Efficiency and Energy Analysis
2.5. Mathematical Model and Simulation Analysis
3. Results and Discussion
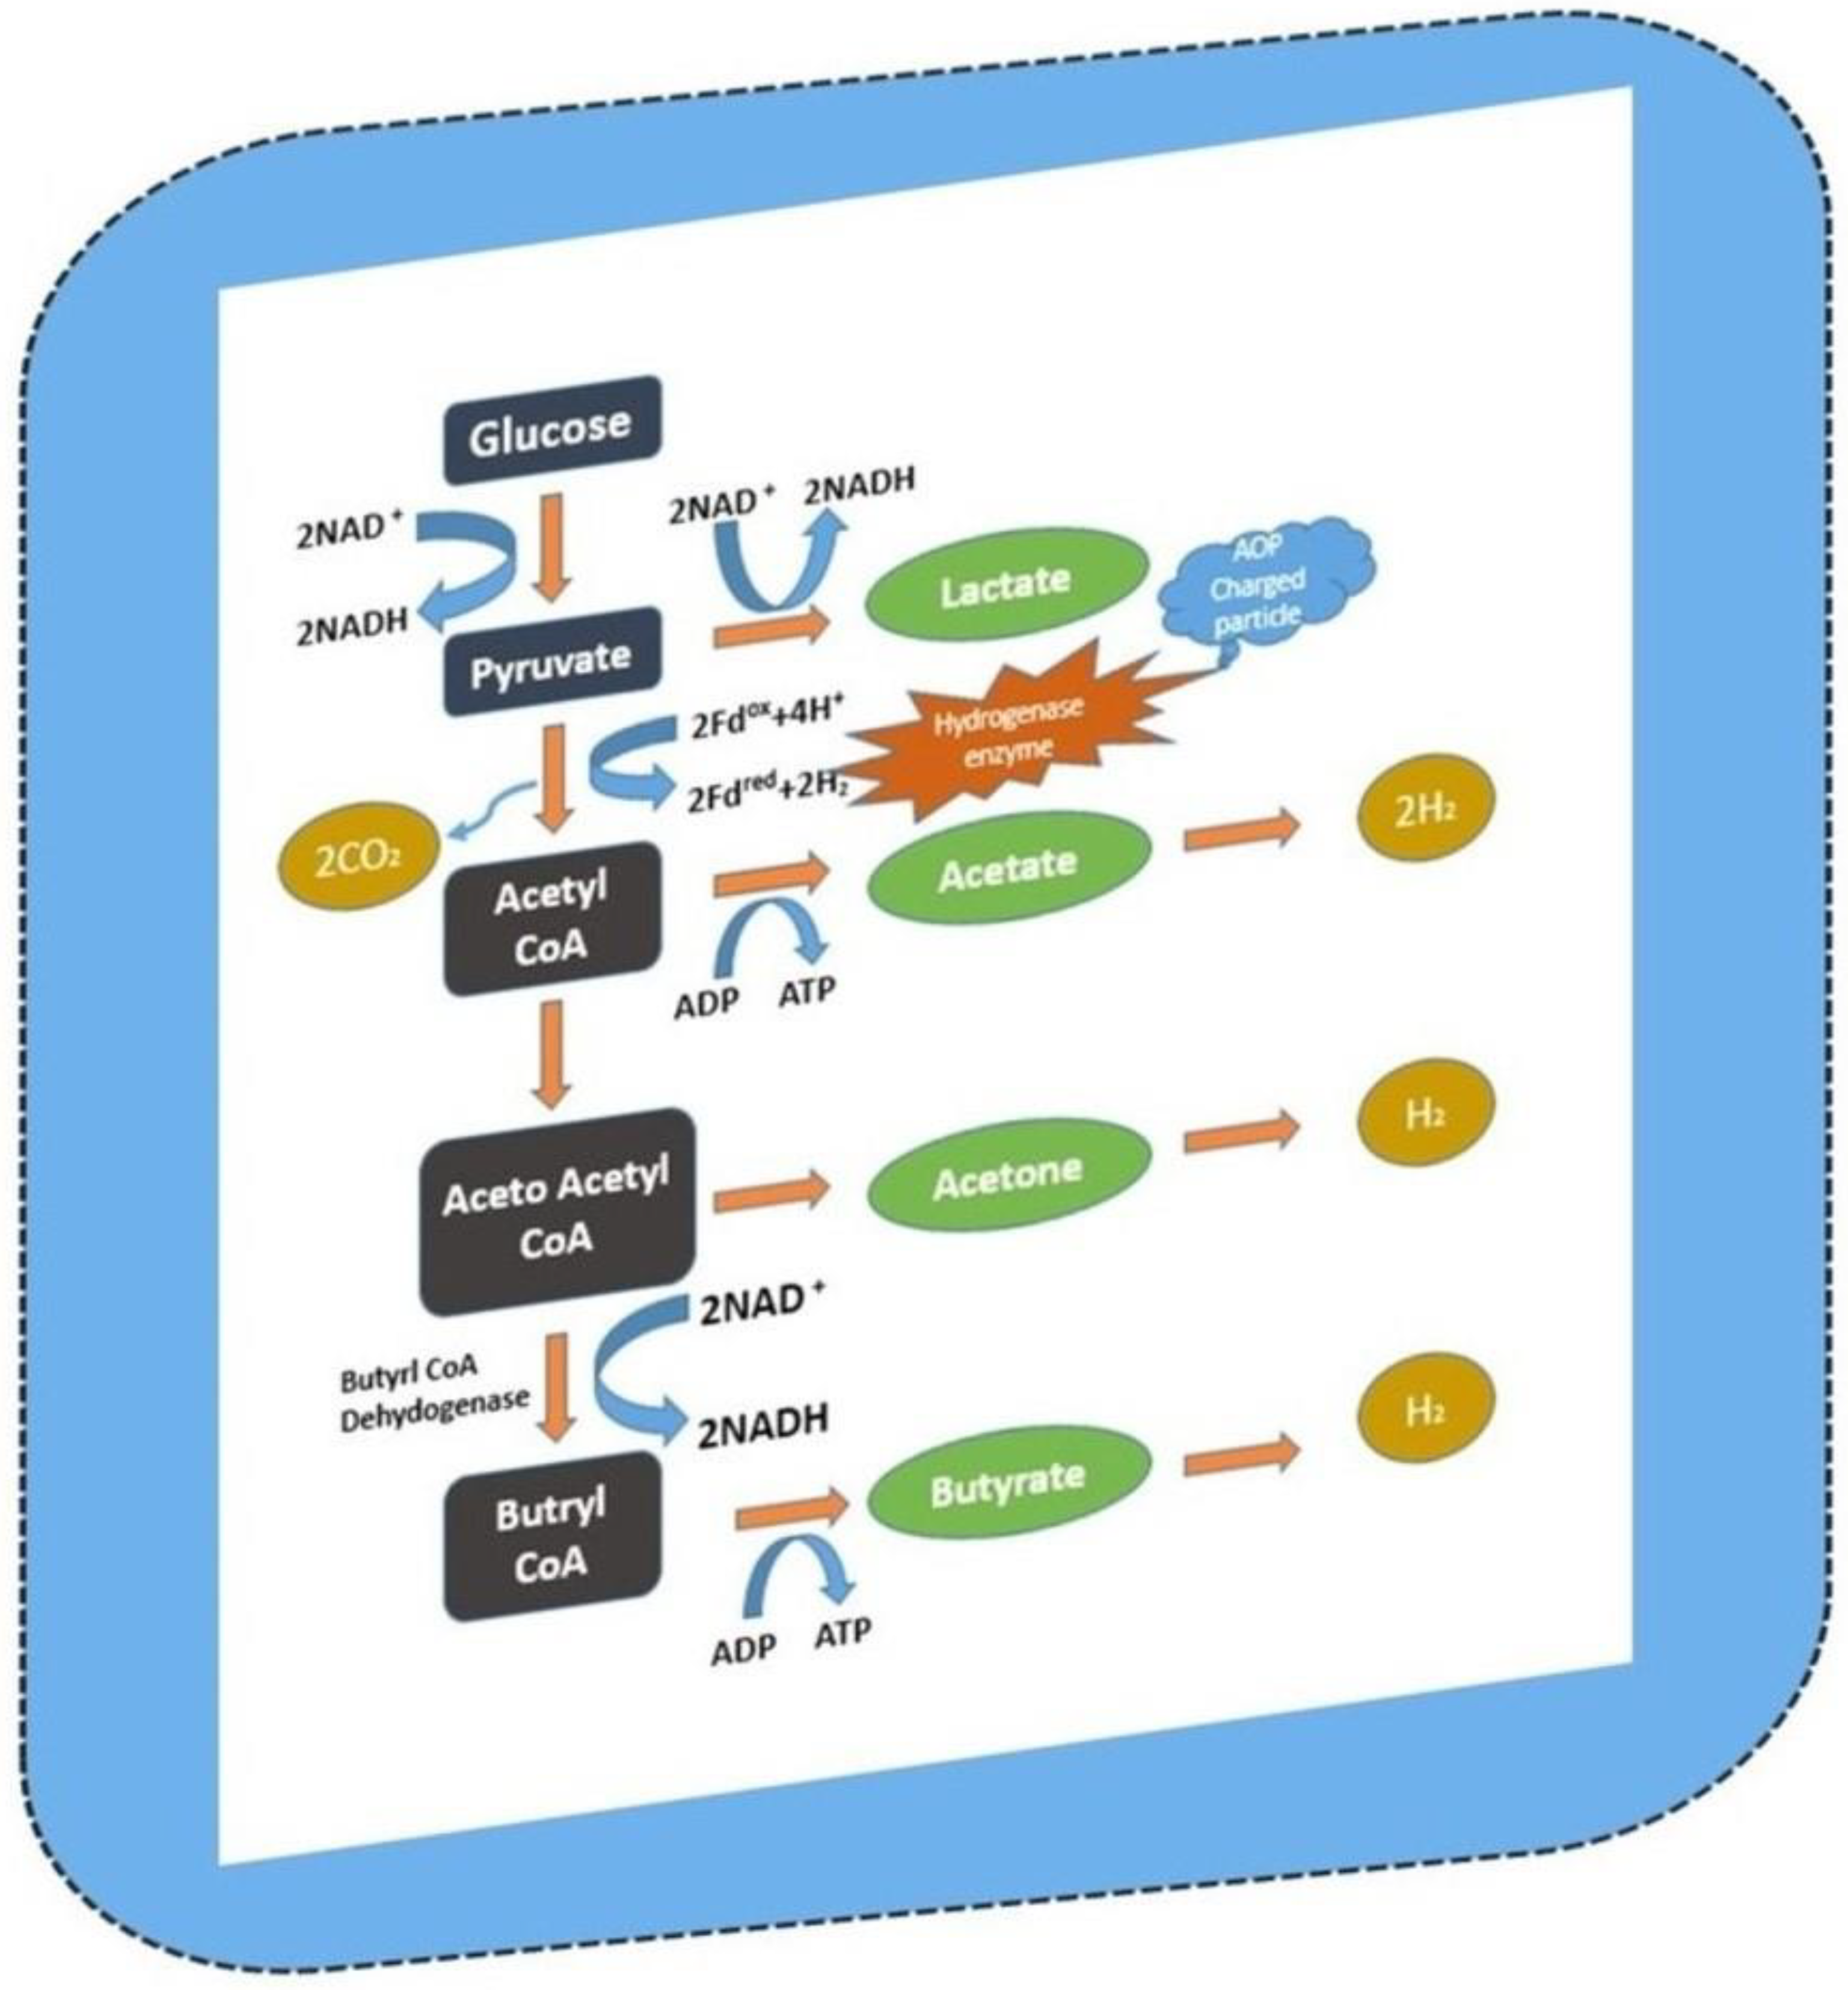
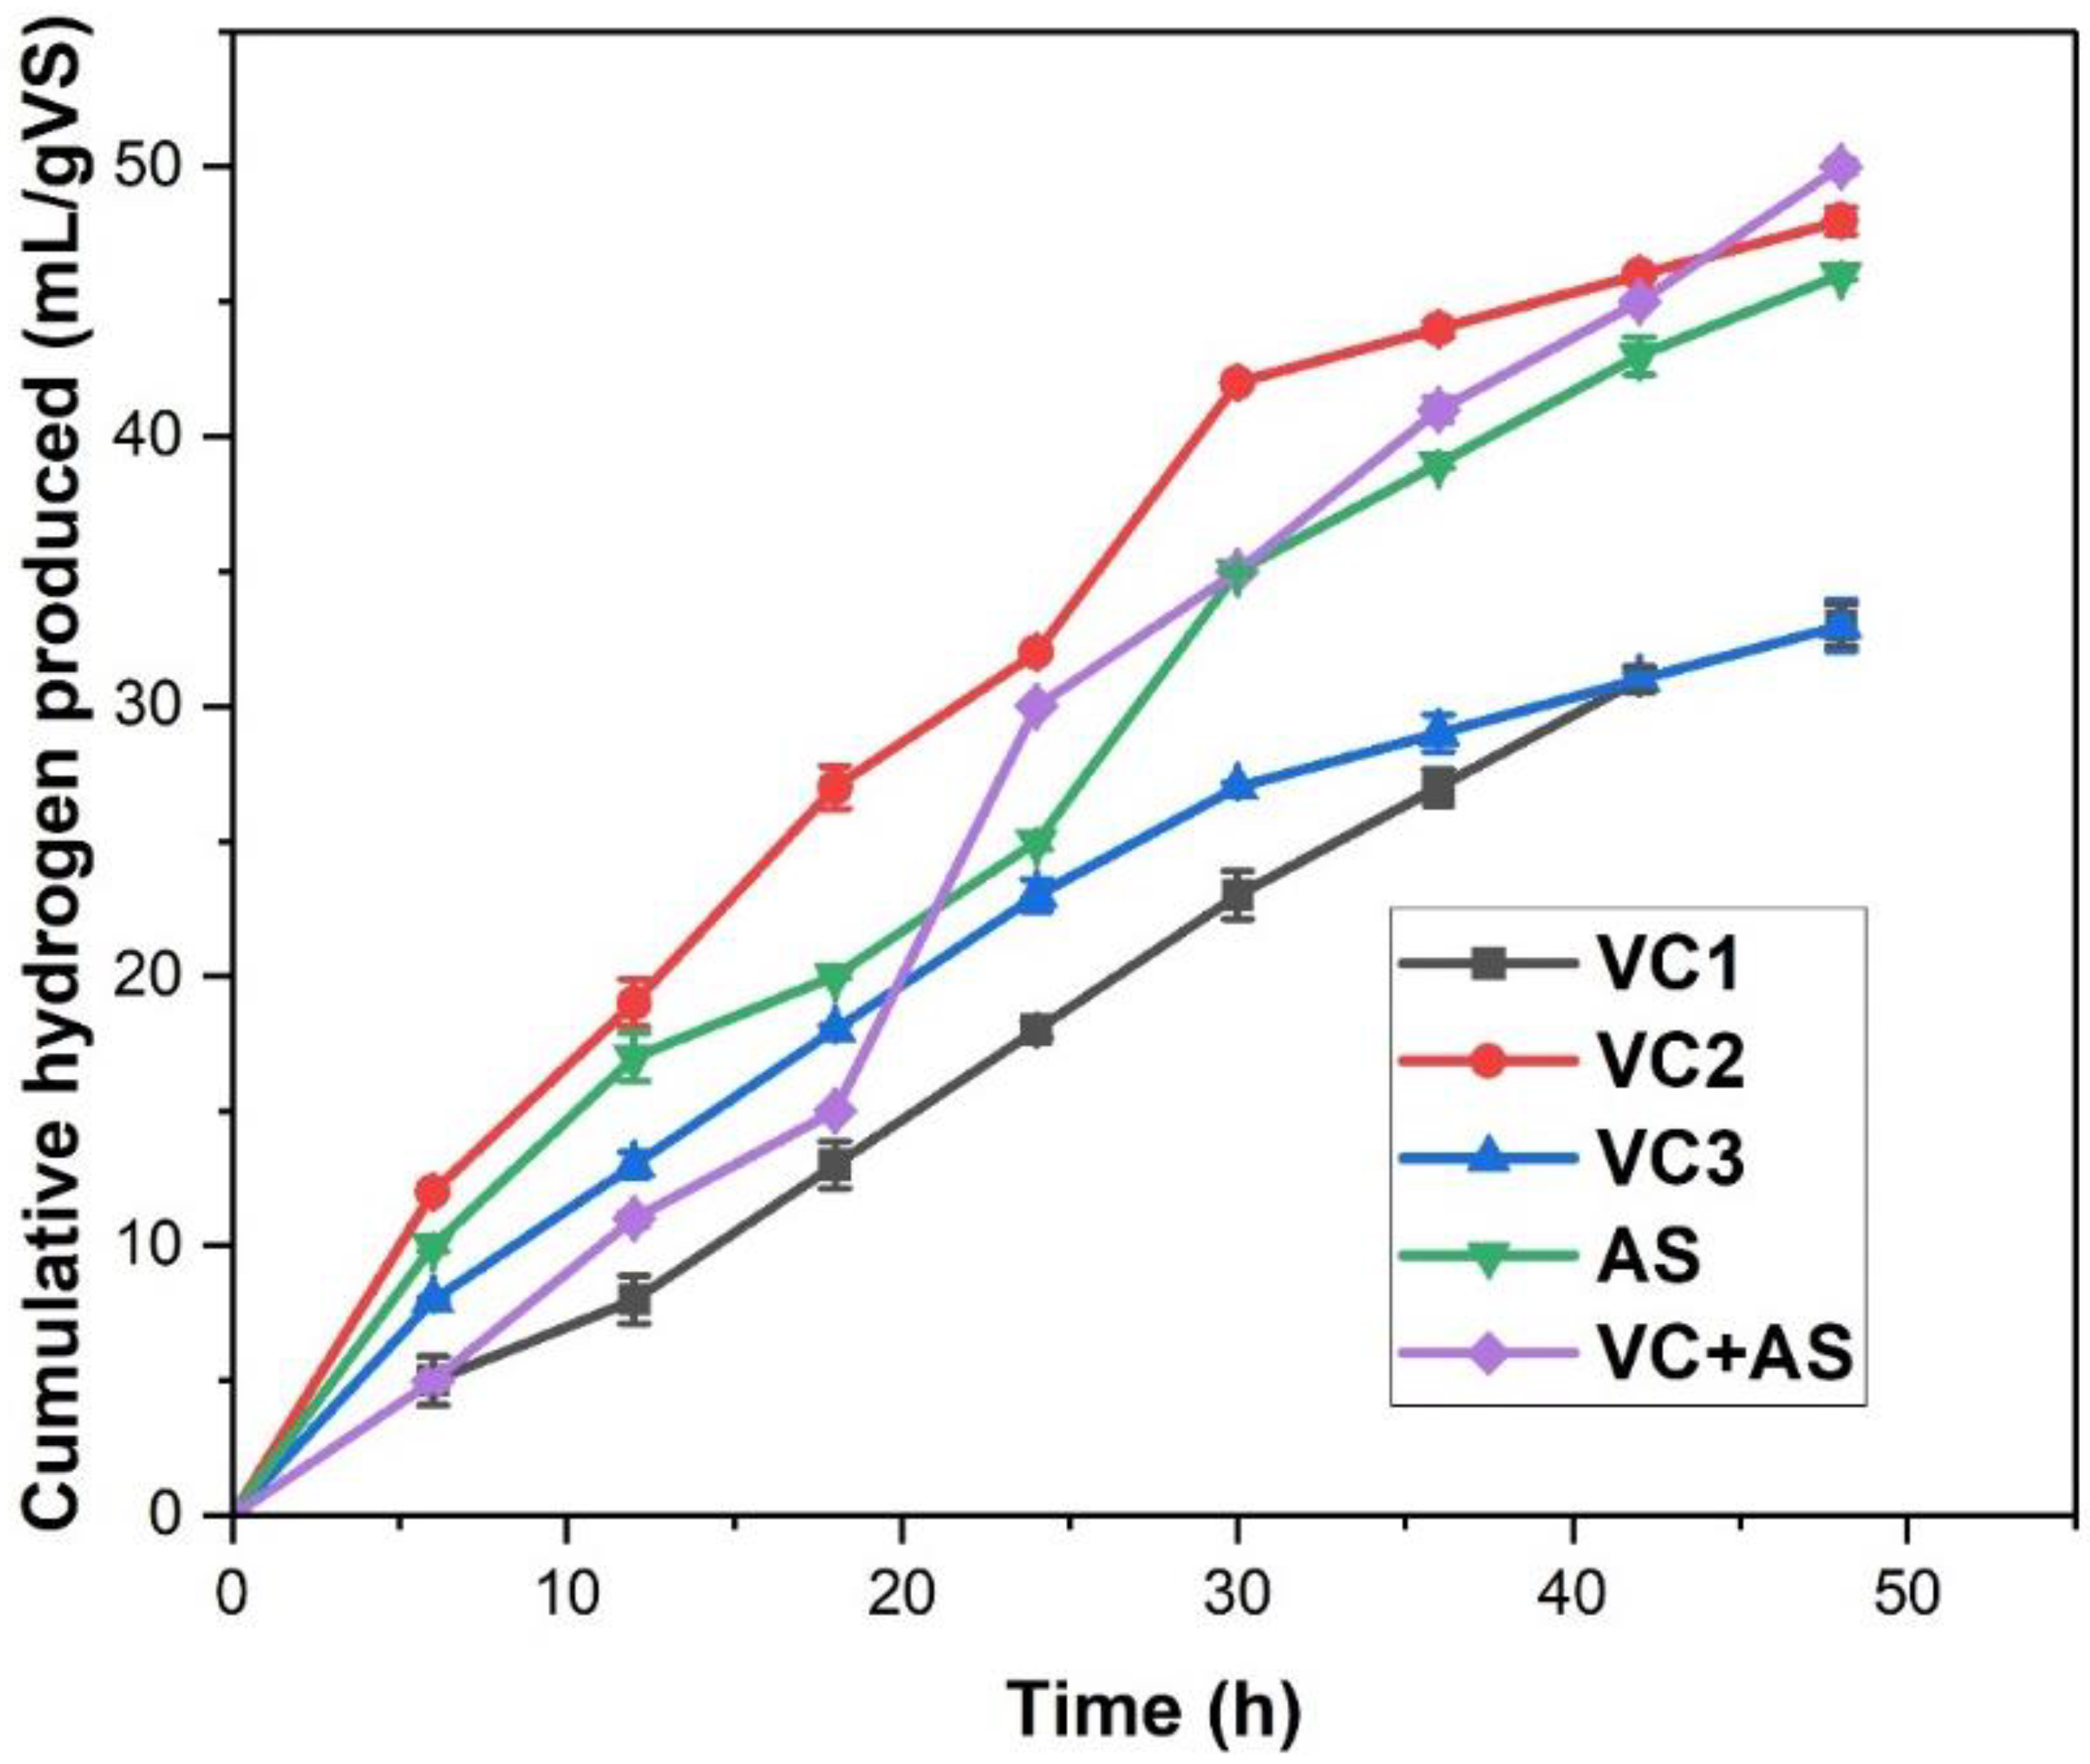
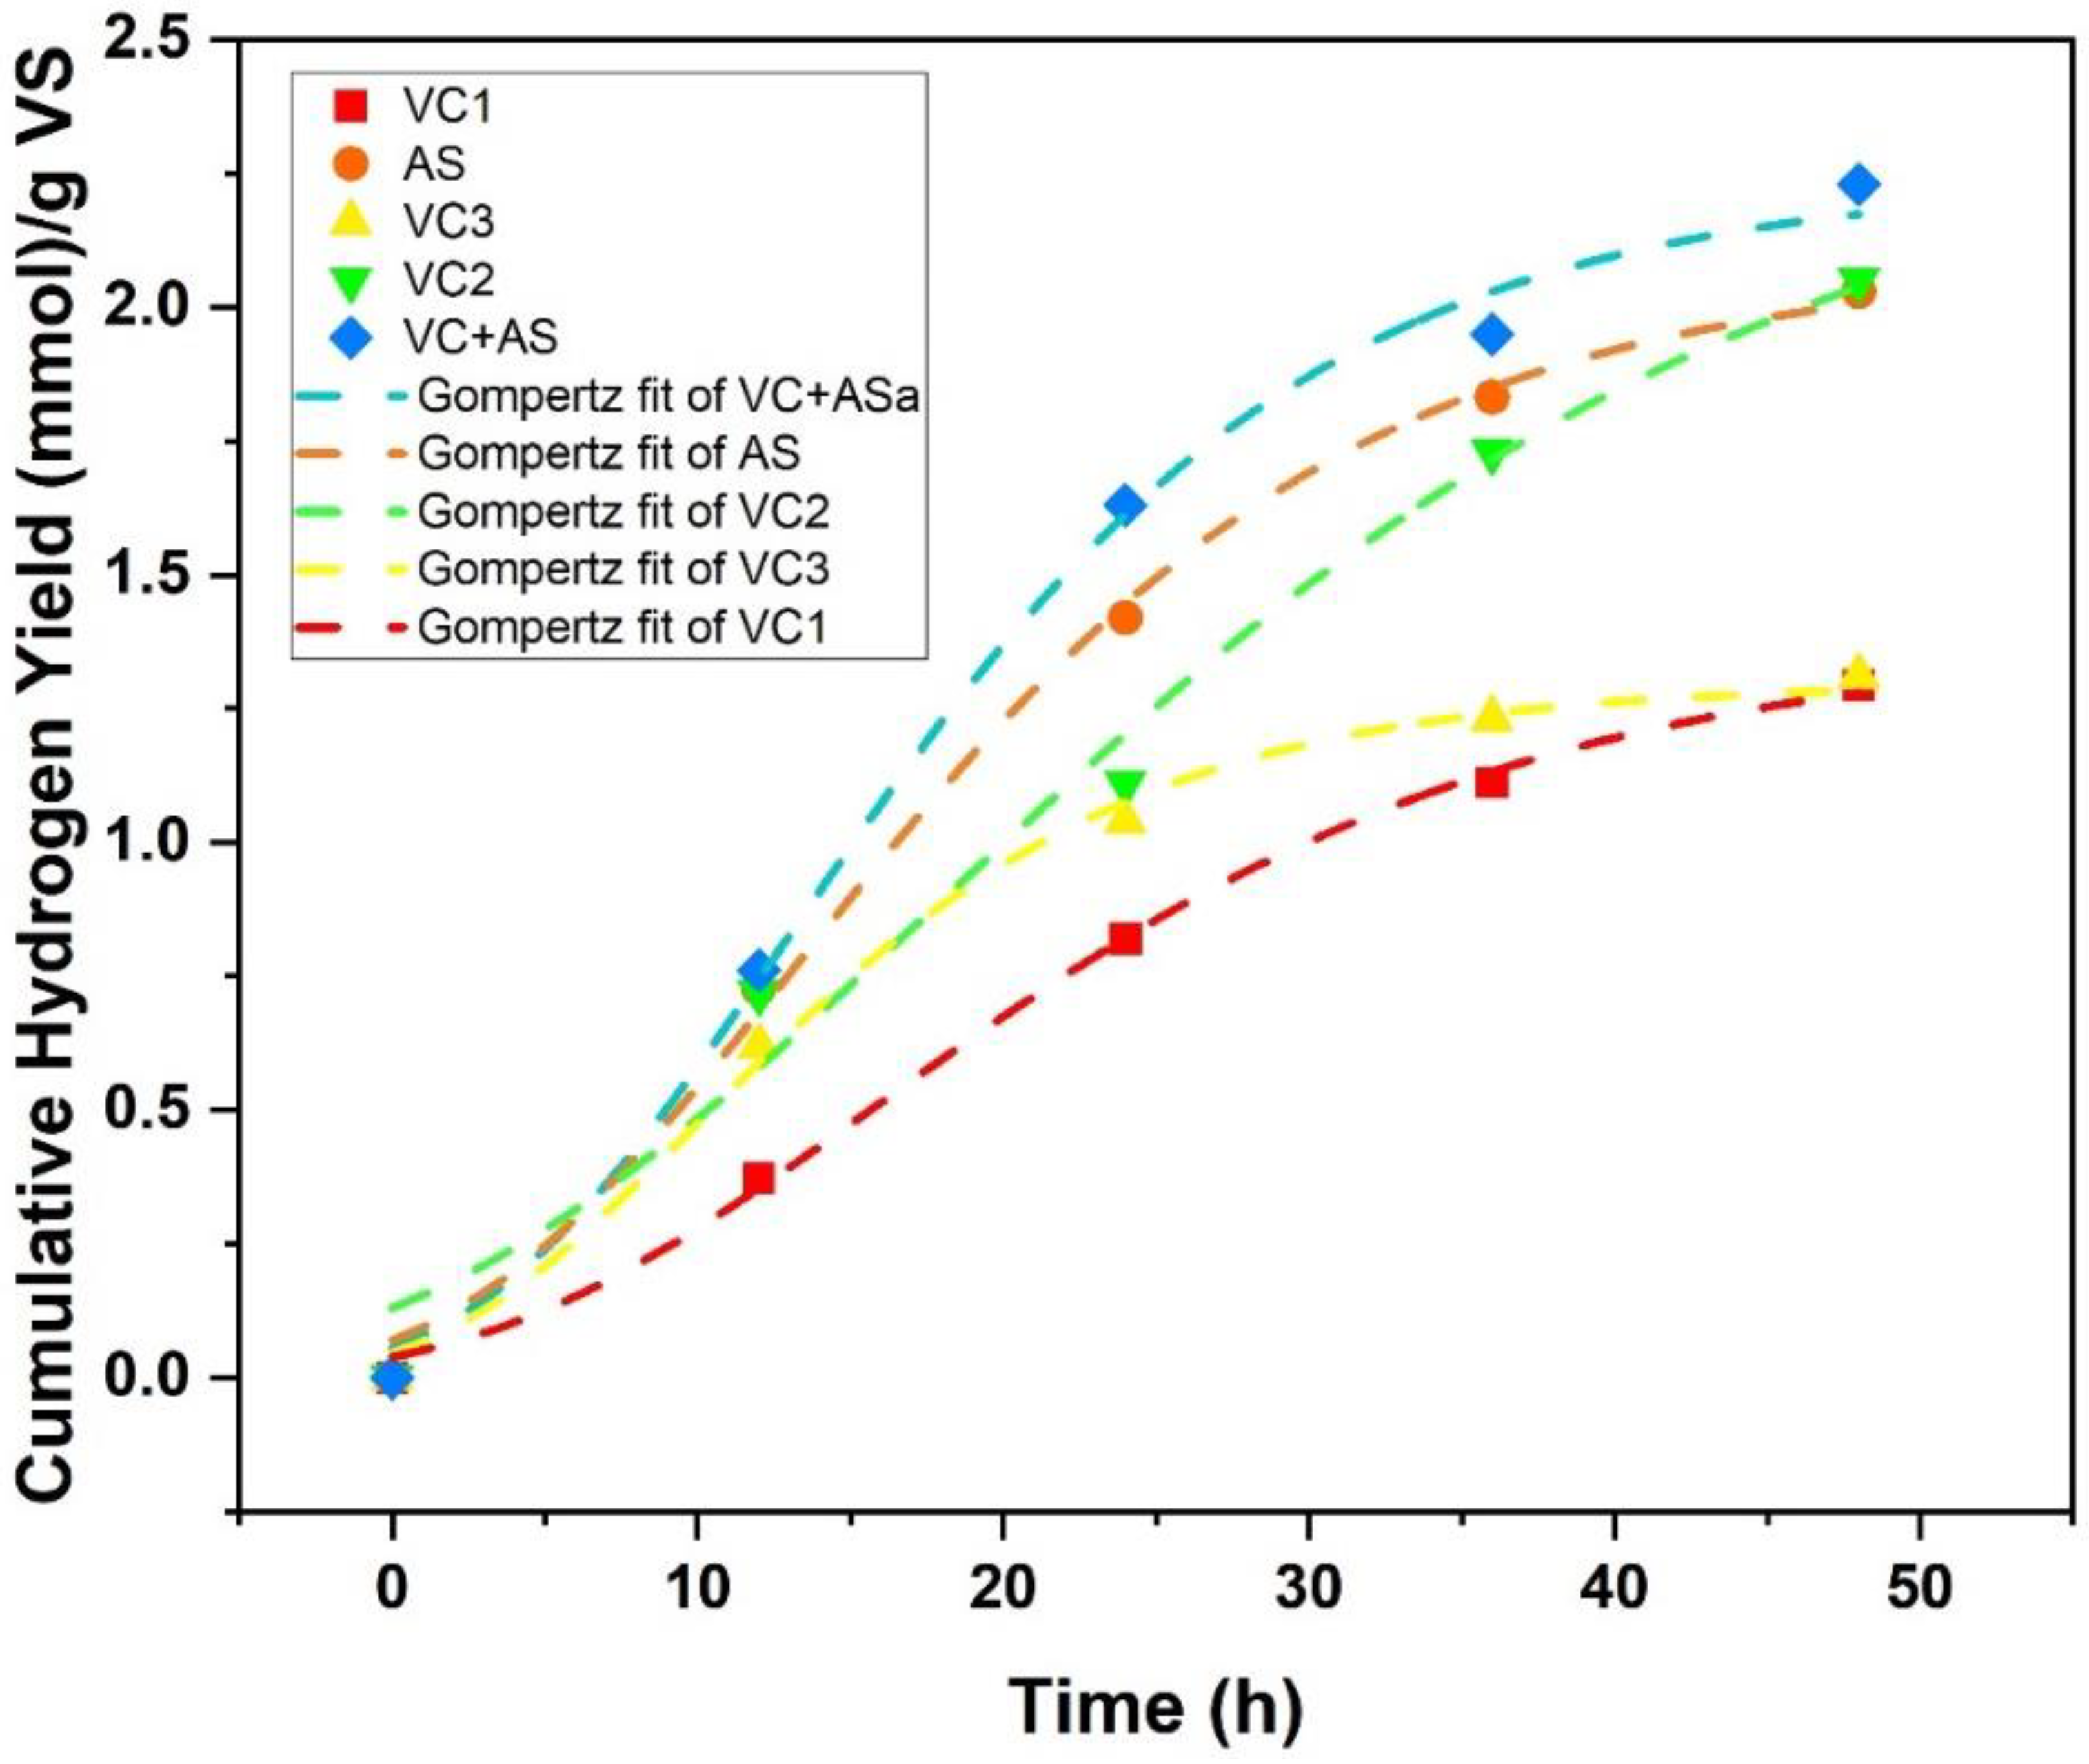
3.1. Biohydrogen Production
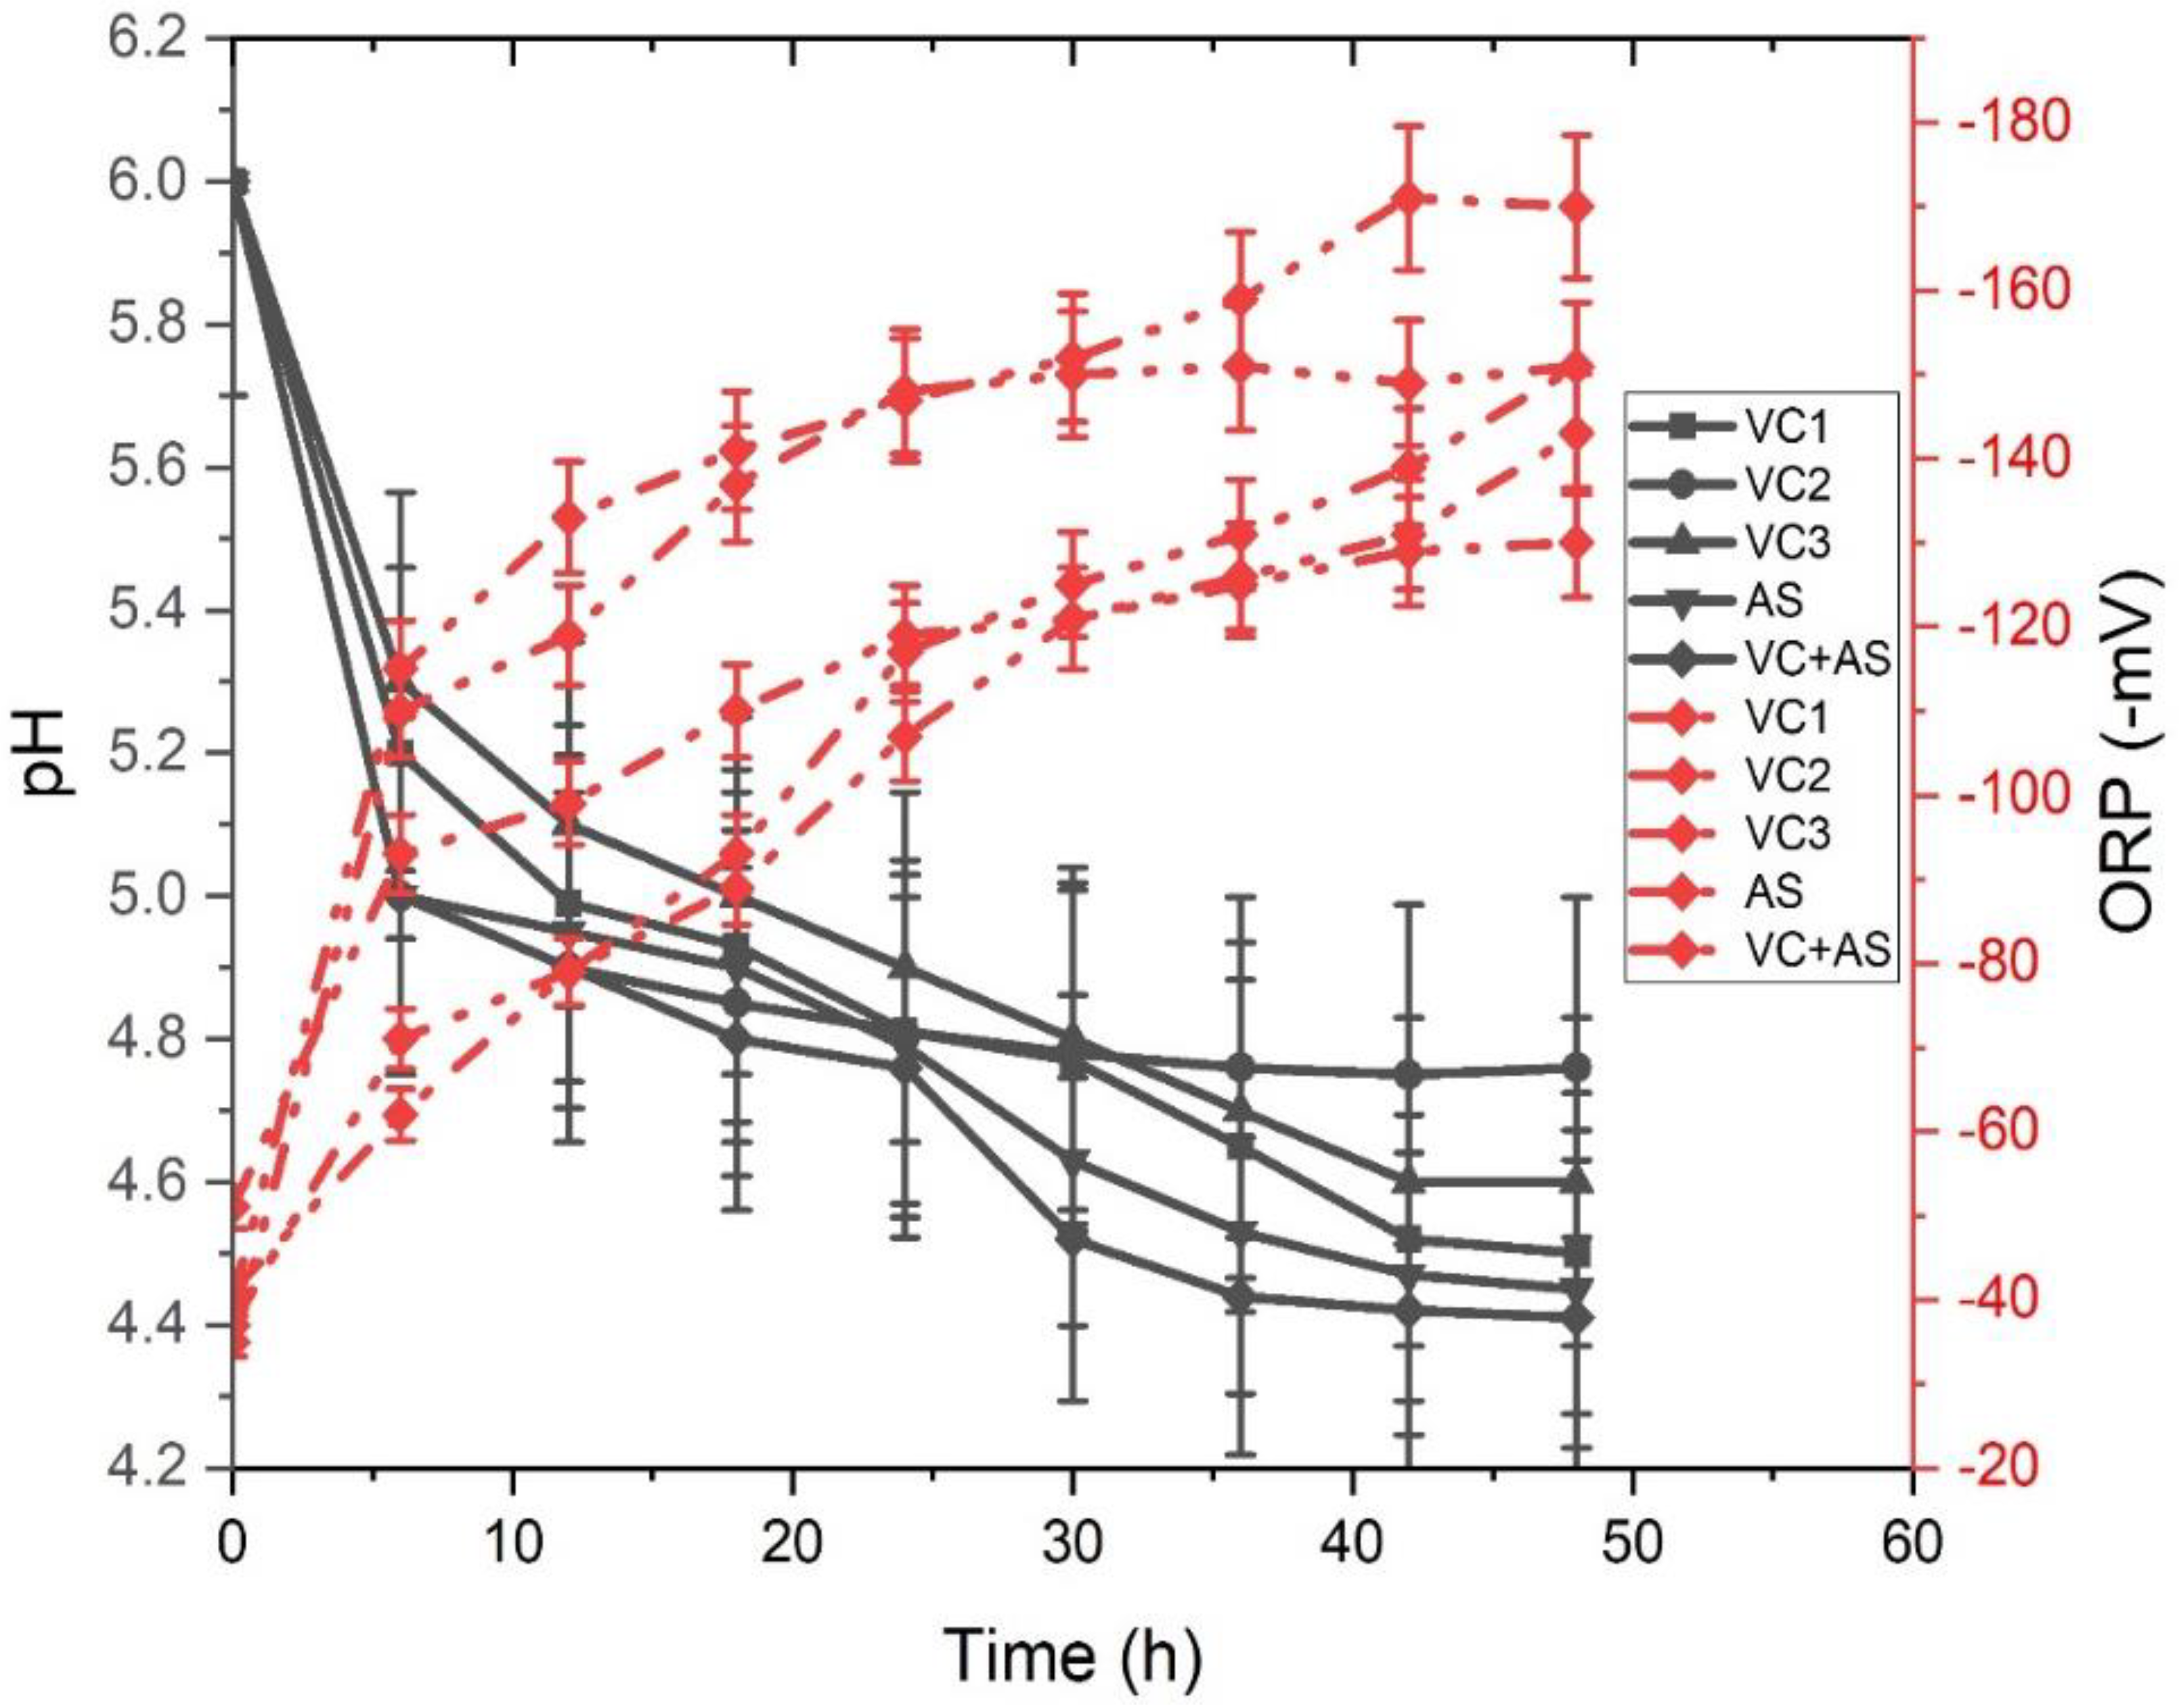
3.2. Redox Conditions
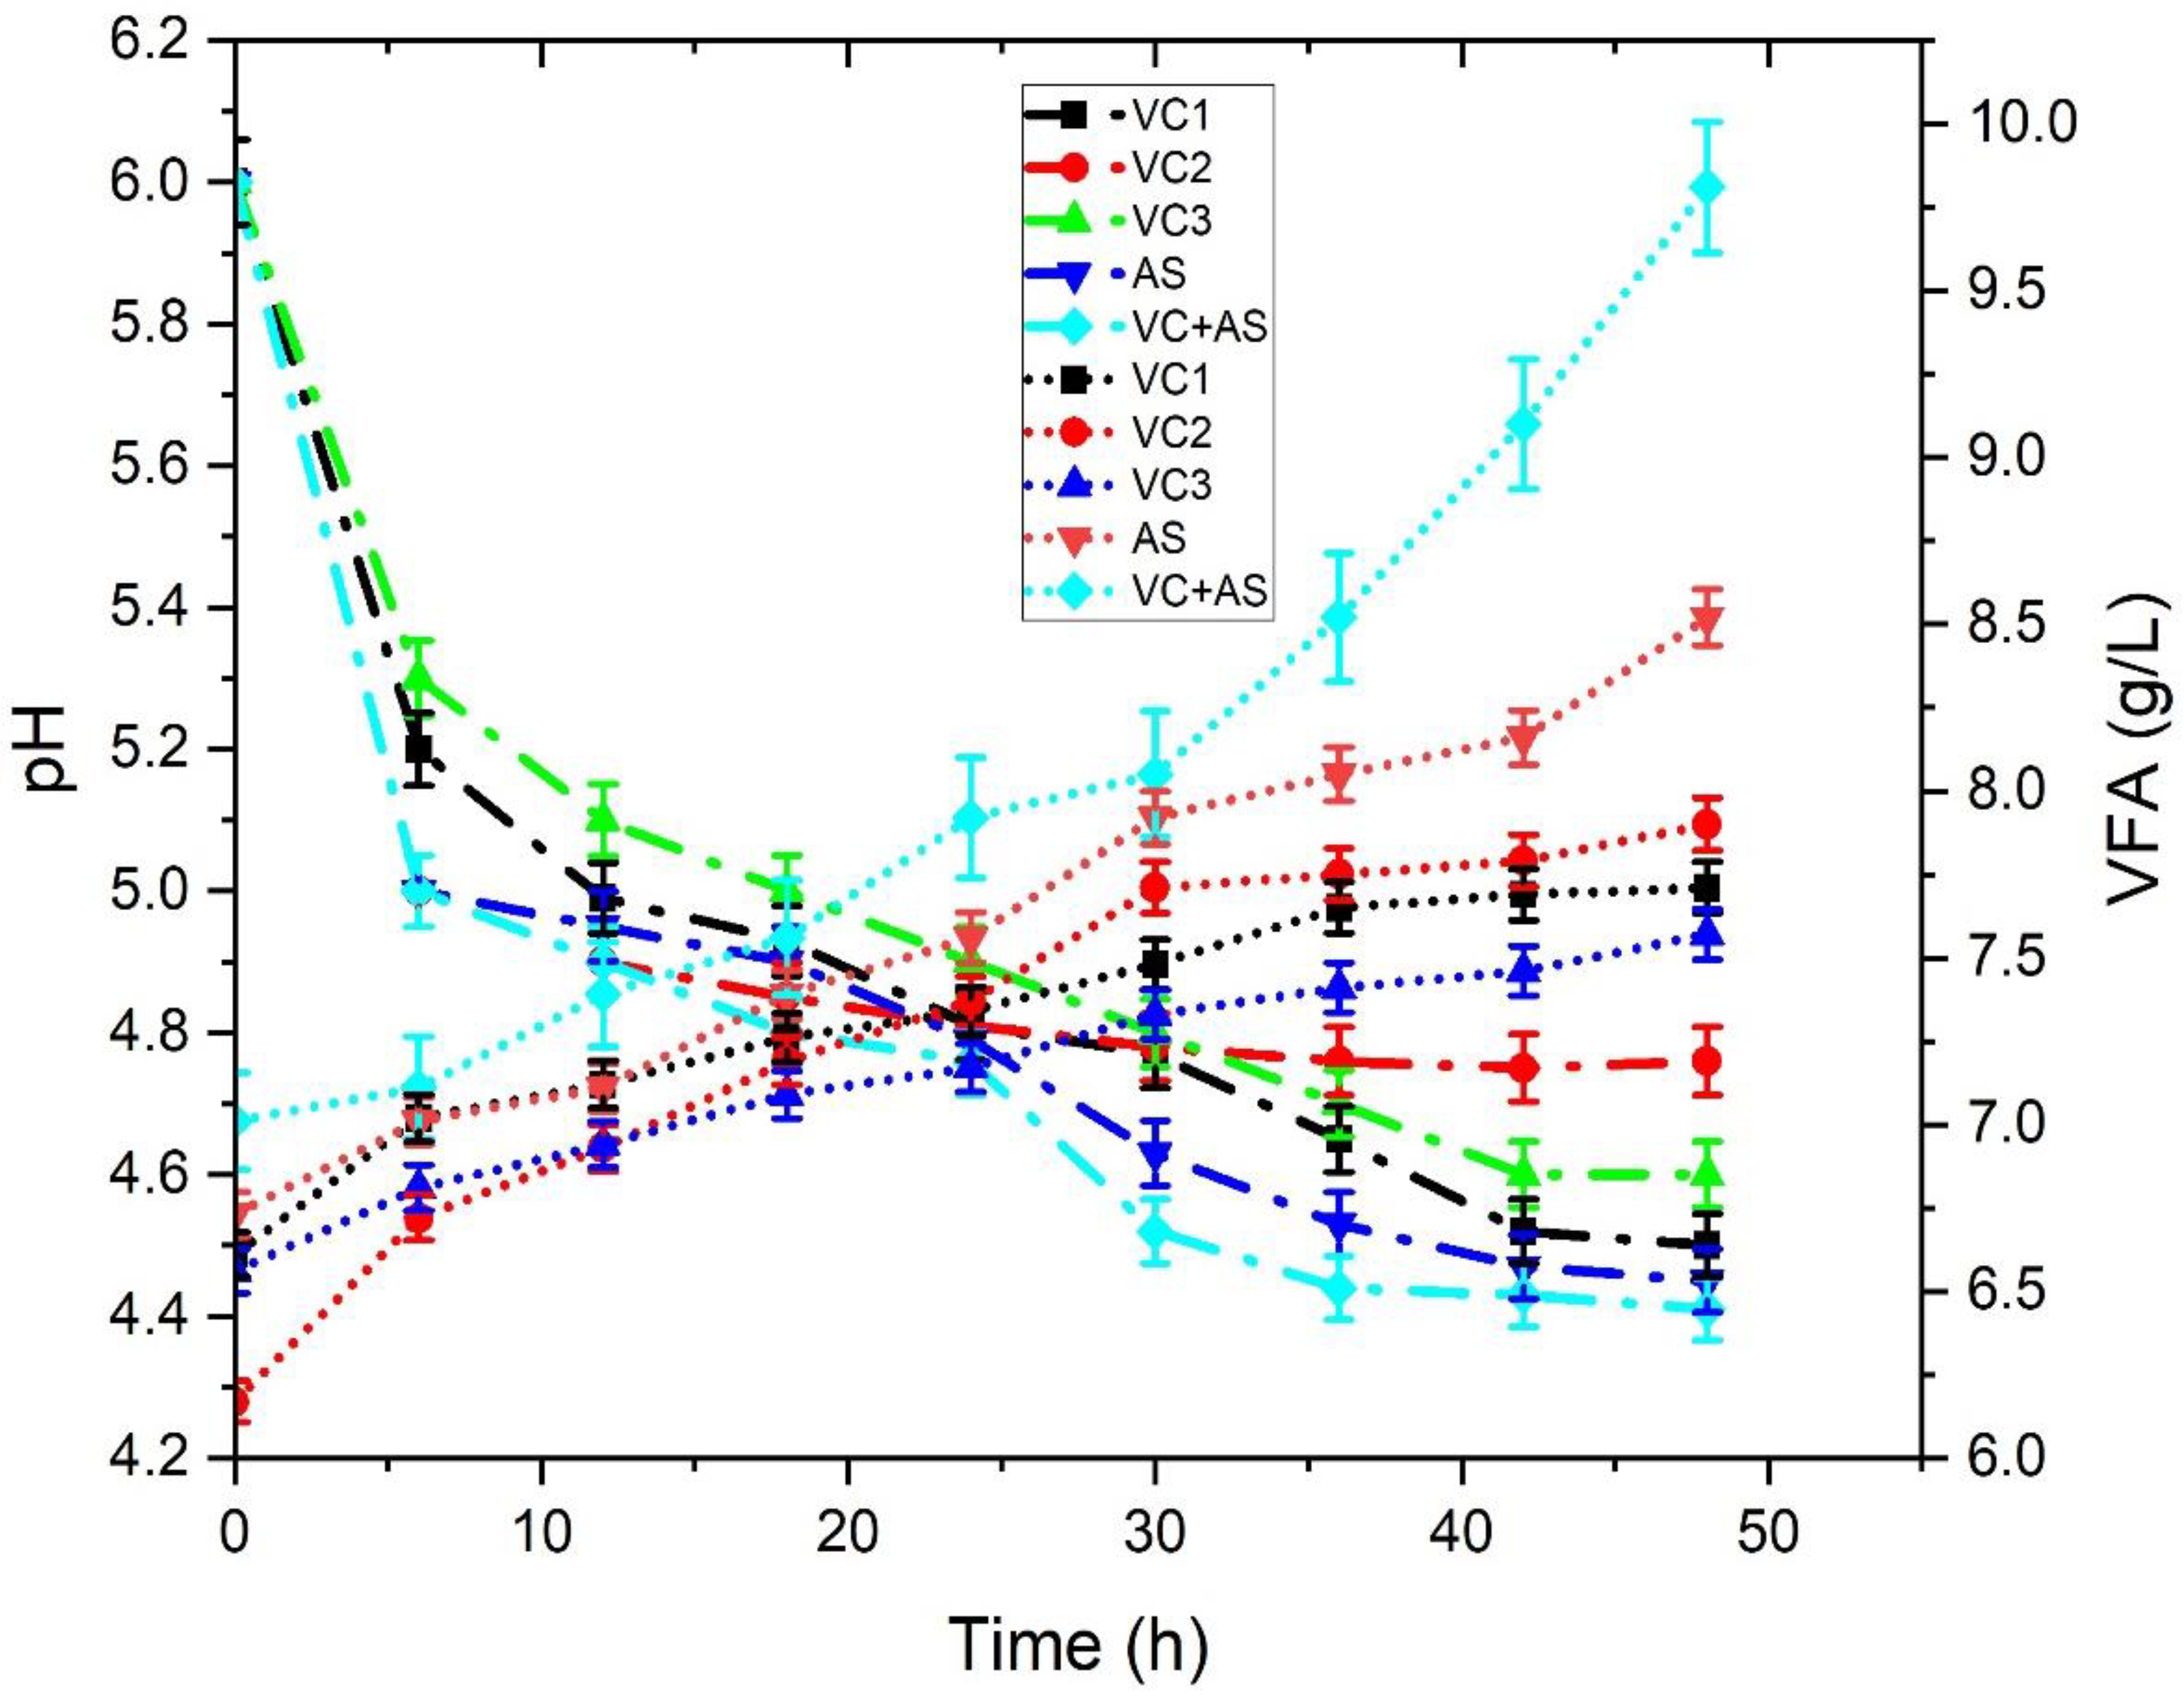
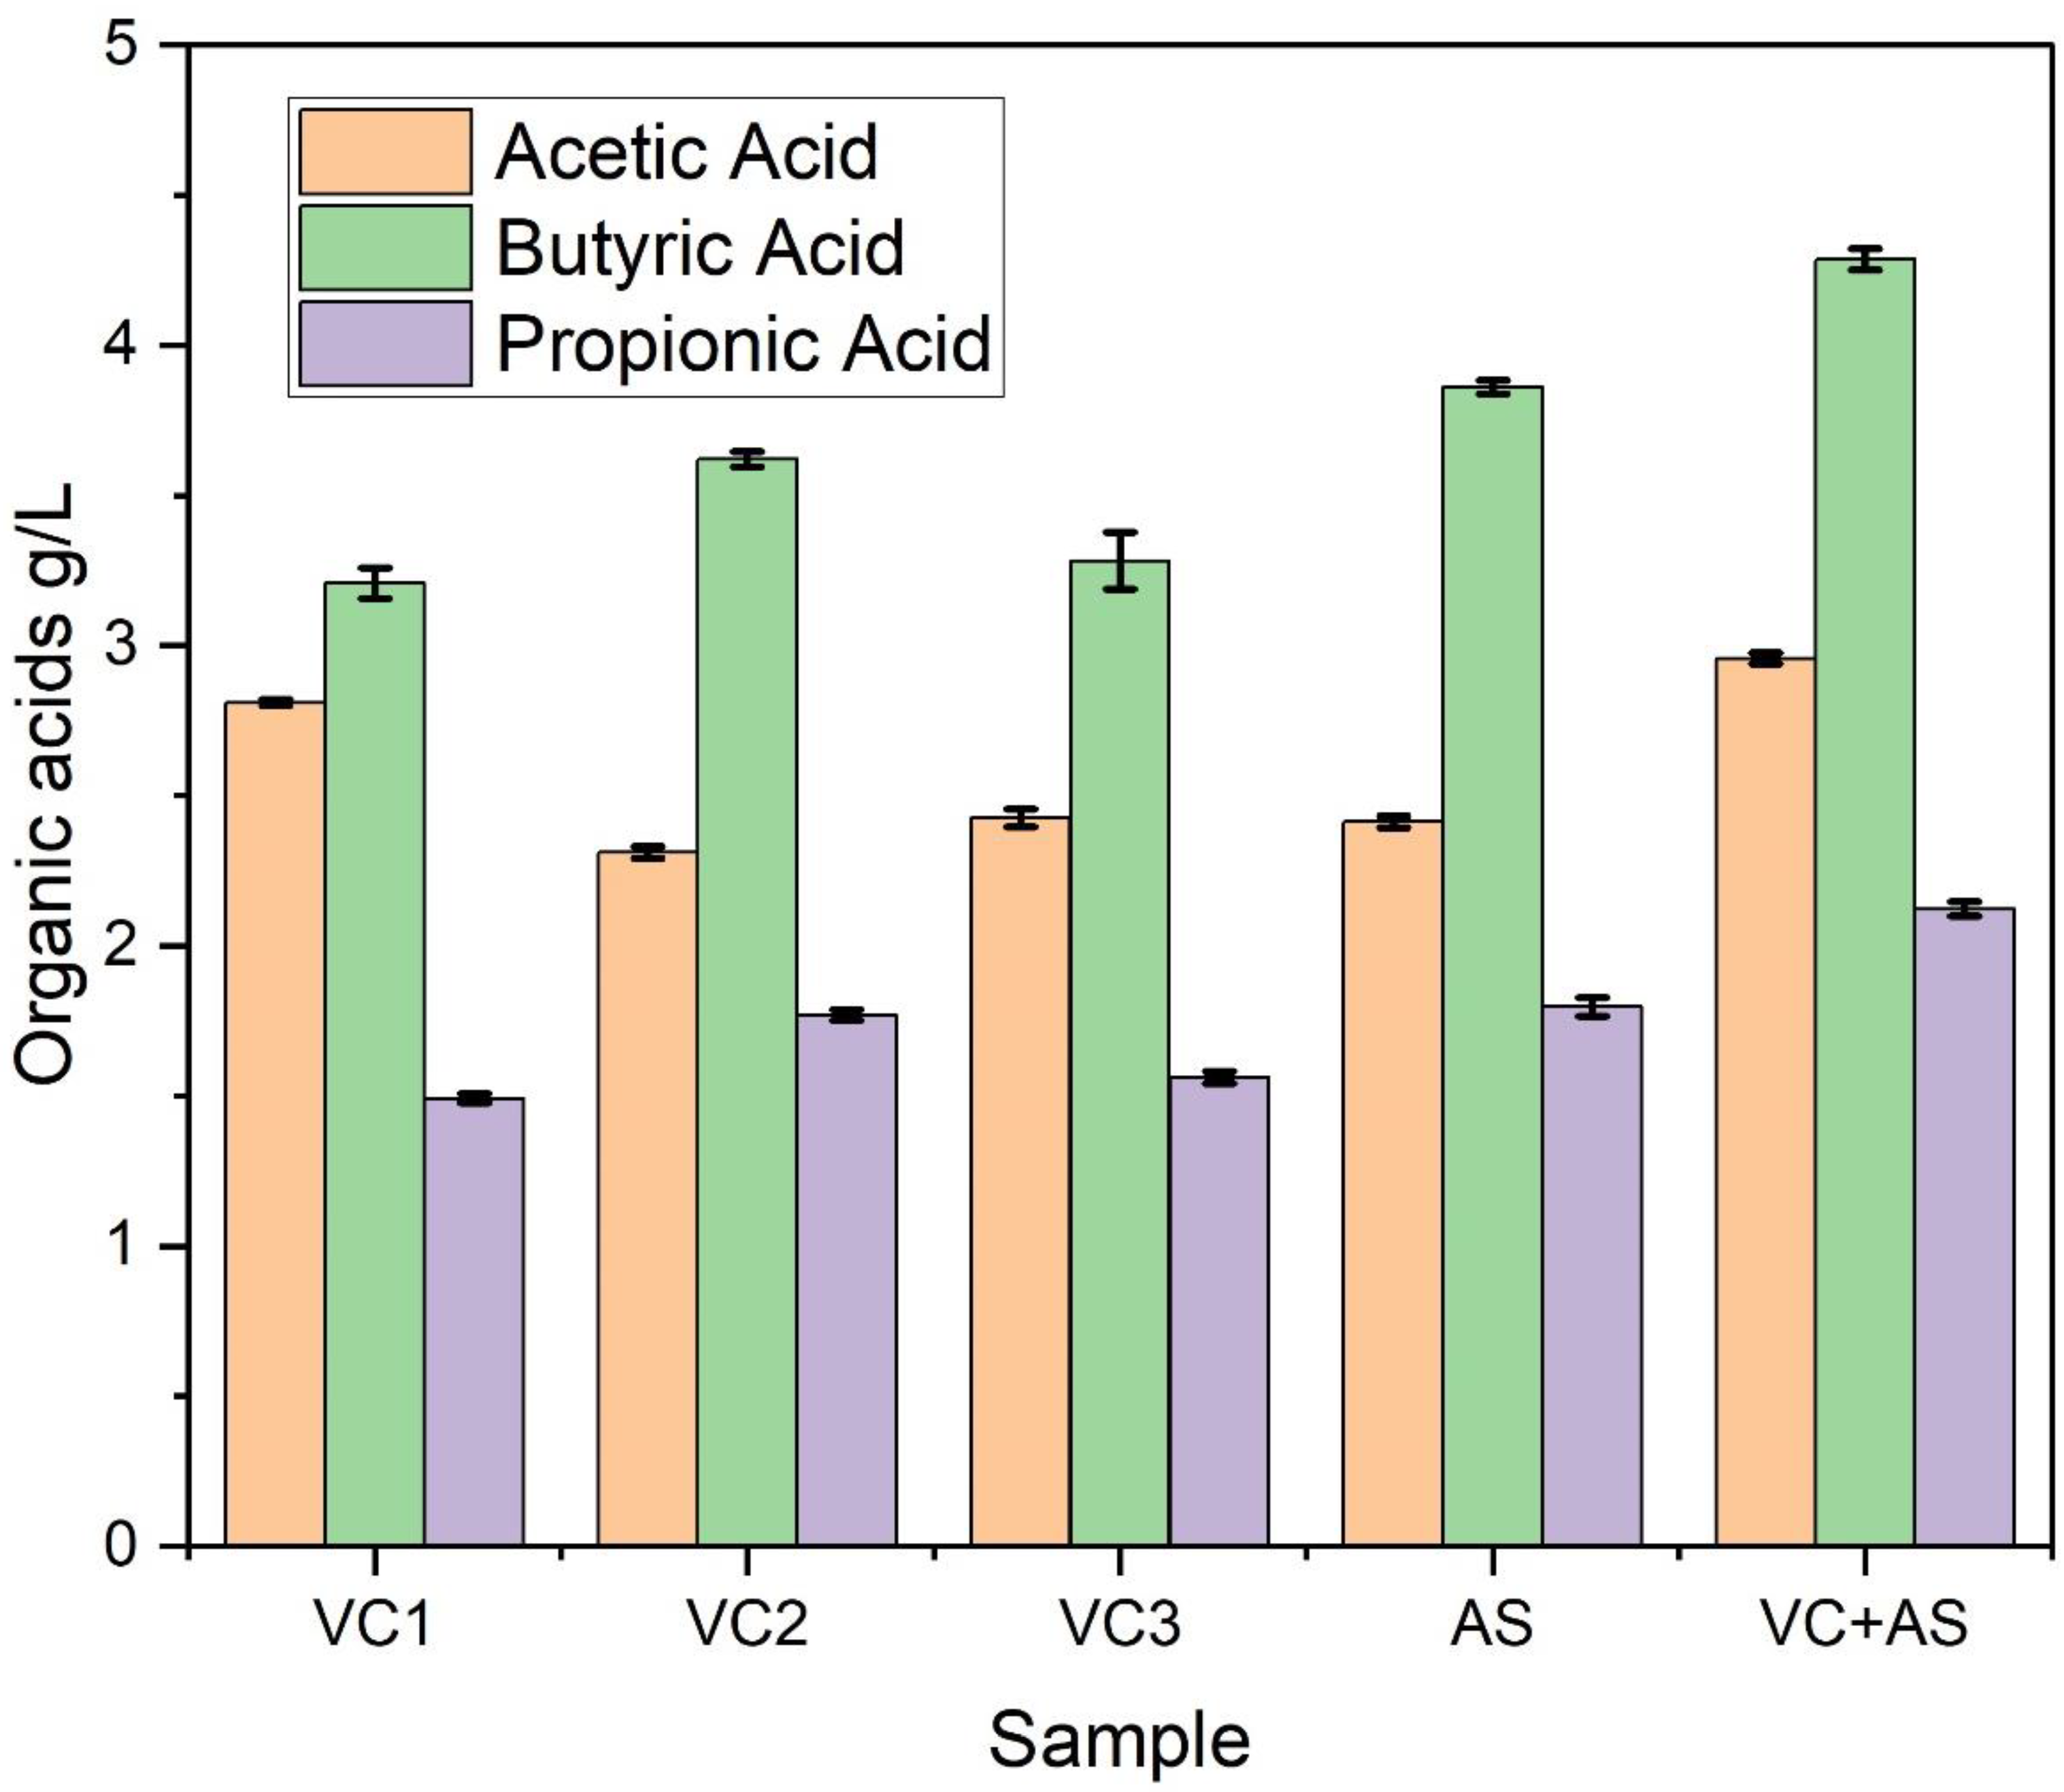
3.3. Volatile Fatty Acids
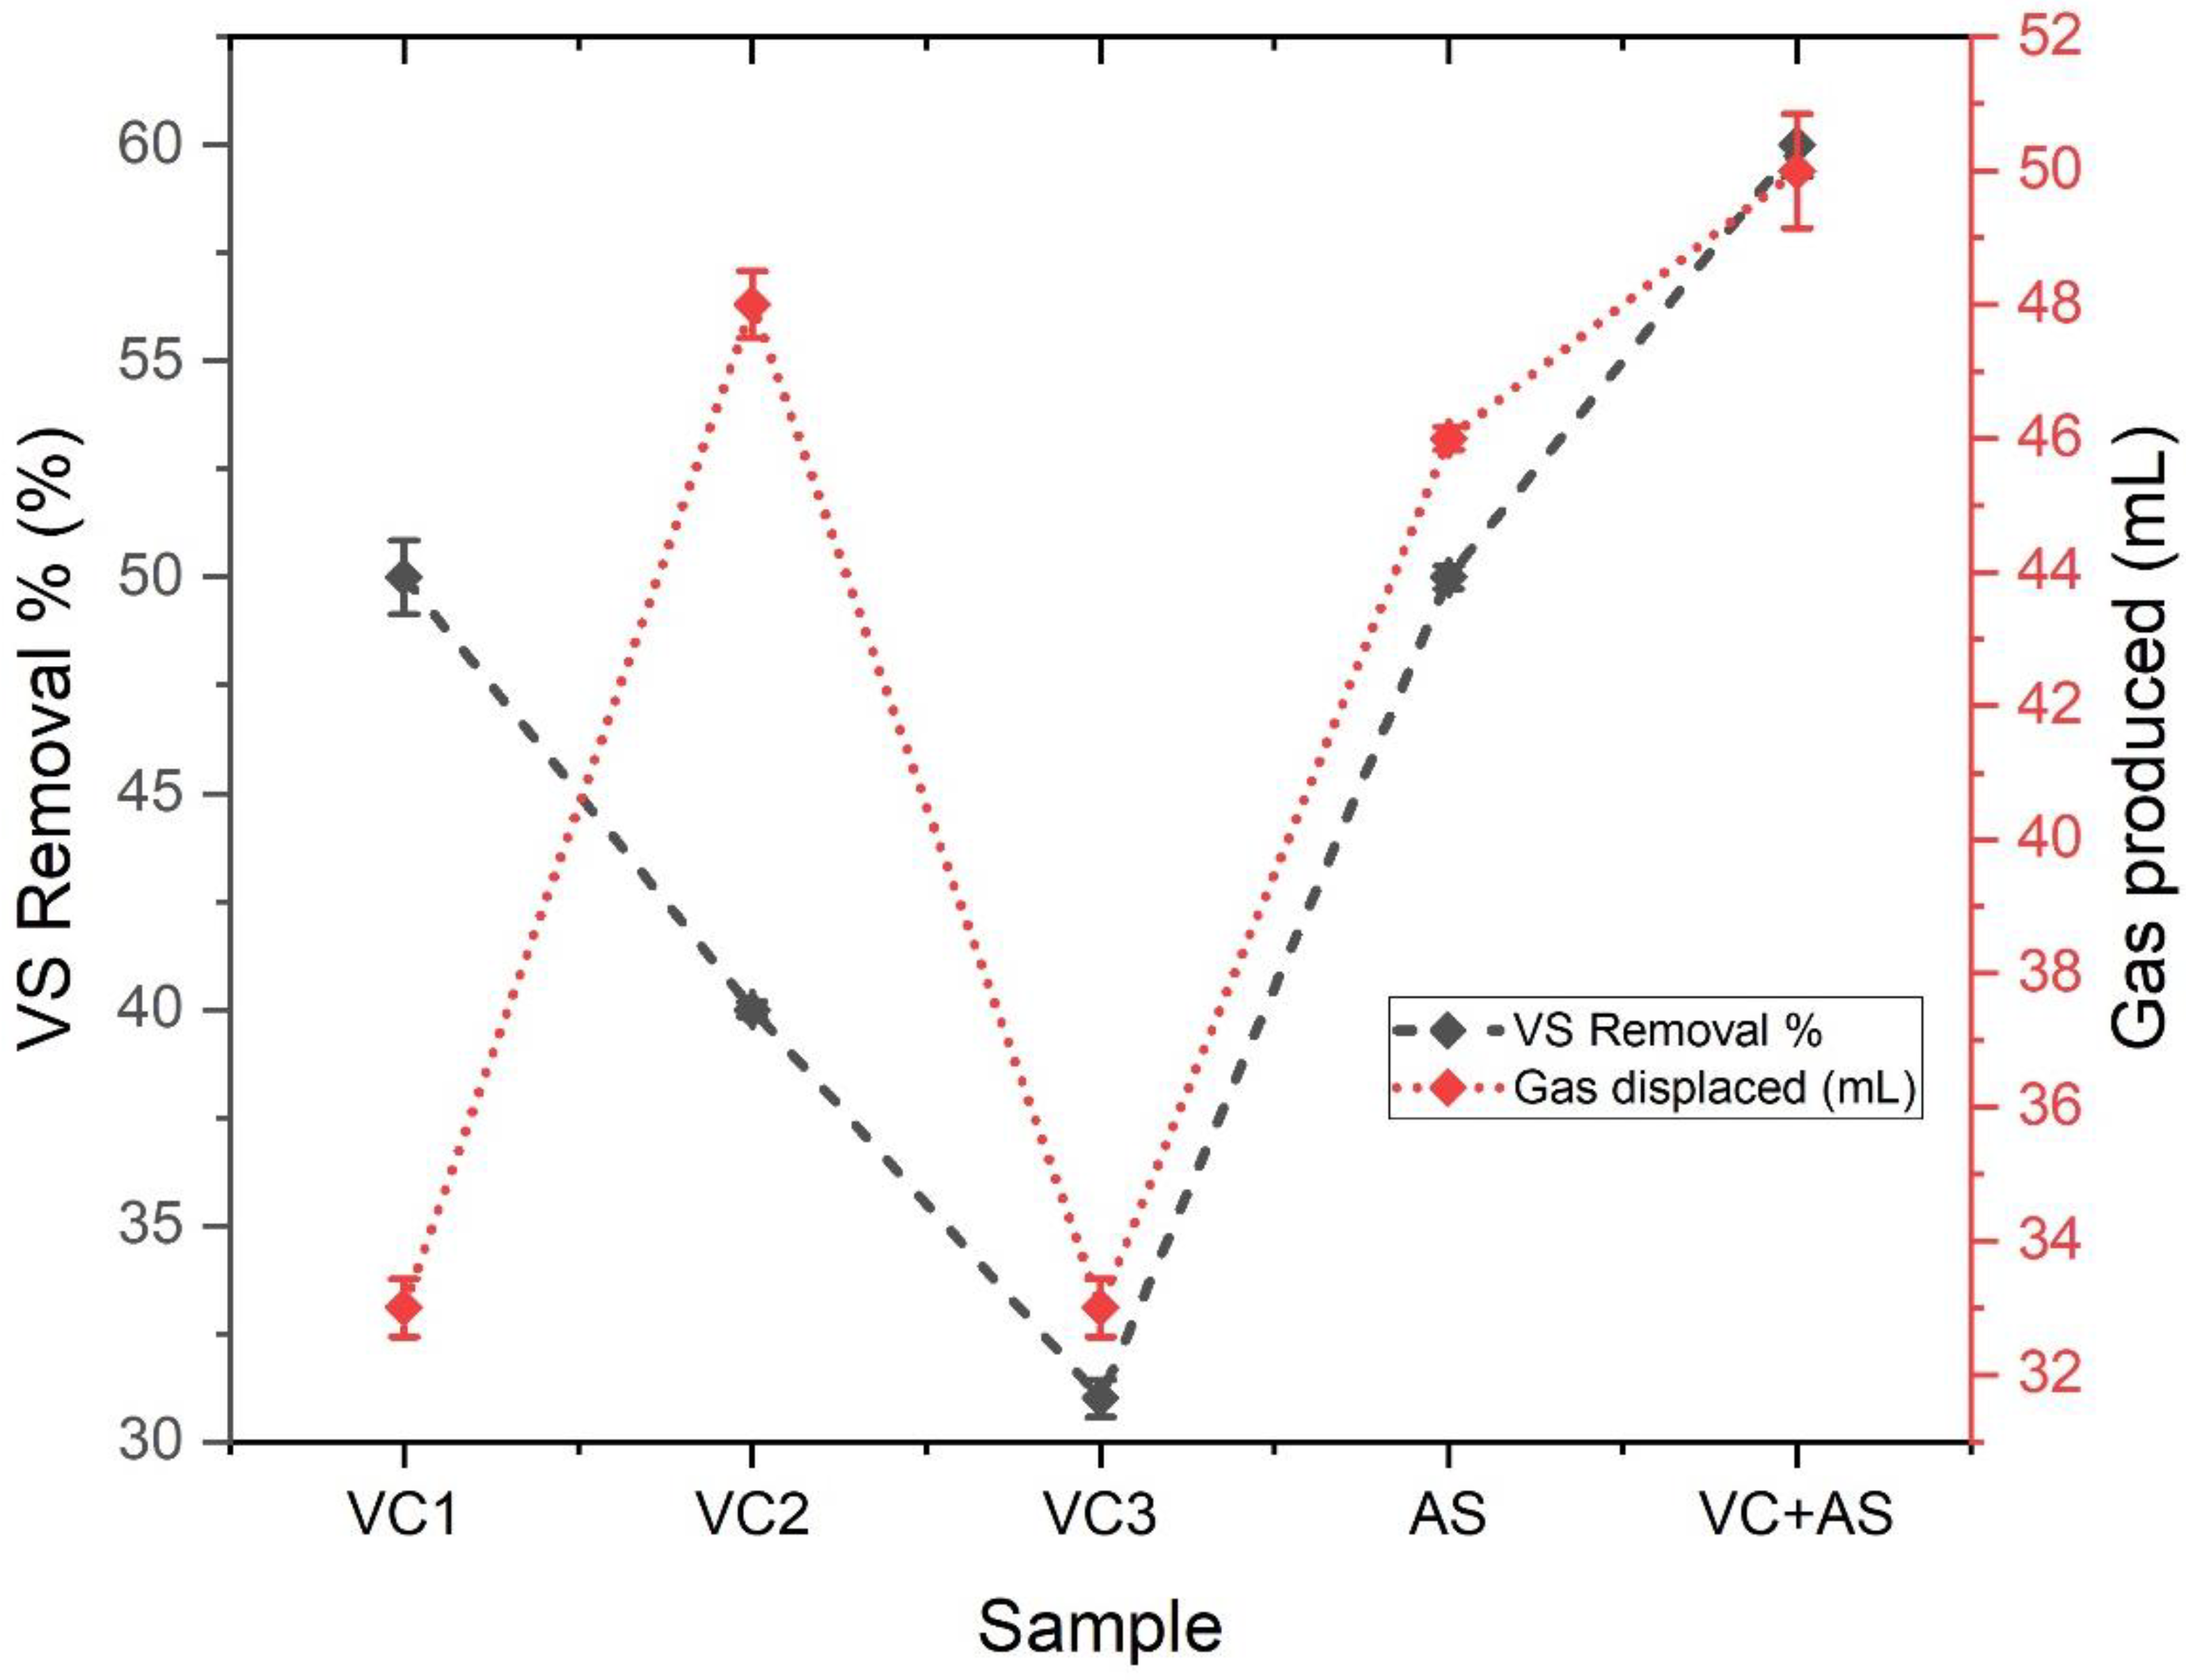
3.4. Substrate Degradation Efficiency
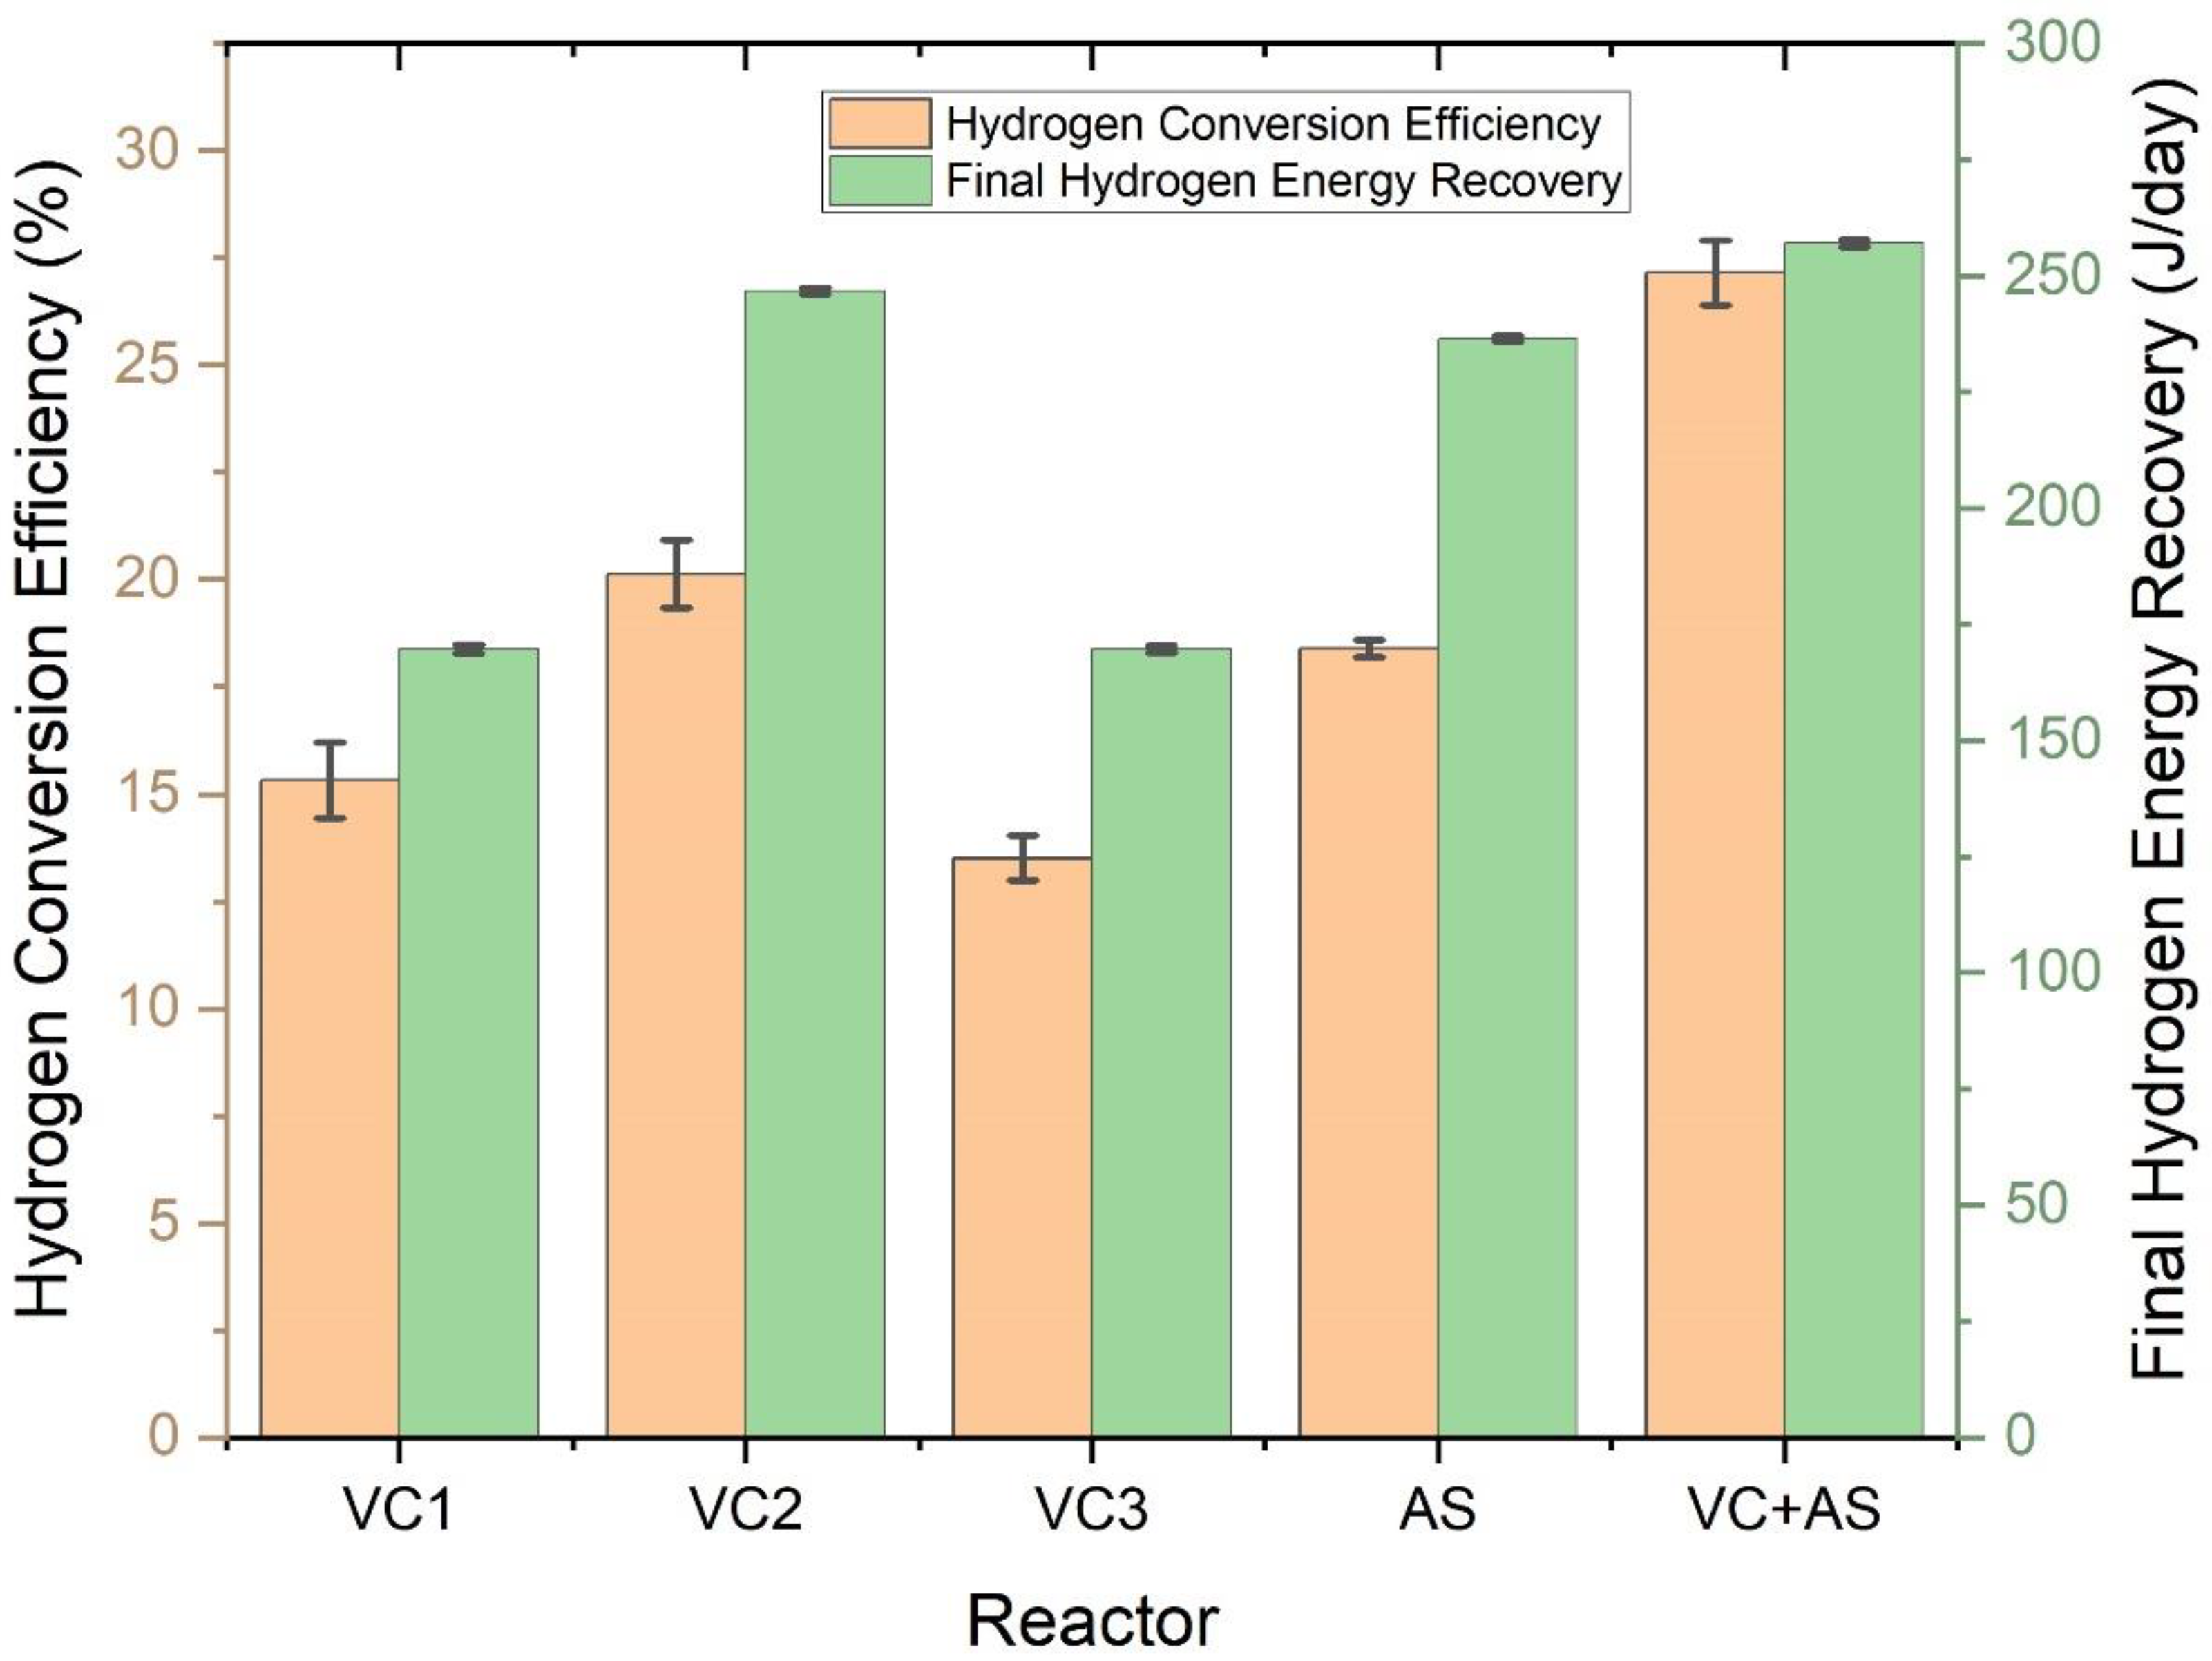
3.5. Hydrogen Conversion Efficiency and Energy Analysis
3.6. Substrate Mapping Based on Hydrogen Yields
4. Conclusions
Author Contributions
Funding
Institutional Review Board Statement
Informed Consent Statement
Data Availability Statement
Acknowledgments
Conflicts of Interest
Abbreviations
| Btu | British thermal units |
| GHG | Greenhouse gases |
| FW | Food waste |
| VC | Vermicompost |
| AS | Anaerobic Sludge |
| FAO | Food and Agriculture Organization |
| VFA | Volatile Fatty Acids |
| VIT | Vellore Institute of Technology |
| BOD | Biochemical Oxygen Demand |
| COD | Chemical Oxygen Demand |
| GC | Gas Chromatography |
| HPLC | High-Performance Liquid Chromatography |
| ORP | Oxidation Reduction Potential |
| APHA | American Public Health Association |
| HCE | Hydrogen Conversion Efficiency |
| THY | Theoretical Hydrogen Yield |
| F/M | Food to Microorganism ratio |
| NER | Net Energy Ration |
| VS | Volatile Solids |
References
- Vanyan, L.; Cenian, A.; Trchounian, K. Biogas and Biohydrogen Production Using Spent Coffee Grounds and Alcohol Production Waste. Energies 2022, 15, 5935. [Google Scholar] [CrossRef]
- Kumar, A.N.; Dissanayake, P.D.; Masek, O.; Priya, A.; Lin, C.S.K.; Ok, Y.S.; Kim, S.-H. Recent Trends in Biochar Integration with Anaerobic Fermentation: Win-Win Strategies in a Closed-Loop. Renew. Sustain. Energy Rev. 2021, 149, 111371. [Google Scholar] [CrossRef]
- Glenk, G.; Reichelstein, S. Economics of Converting Renewable Power to Hydrogen. Nat. Energy 2019, 4, 216–222. [Google Scholar] [CrossRef]
- Rosa, L.; Mazzotti, M. Potential for Hydrogen Production from Sustainable Biomass with Carbon Capture and Storage. Renew. Sustain. Energy Rev. 2022, 157, 112123. [Google Scholar] [CrossRef]
- Srivastava, R.K.; Shetti, N.P.; Reddy, K.R.; Aminabhavi, T.M. Biofuels, Biodiesel and Biohydrogen Production Using Bioprocesses. A Review. Environ. Chem. Lett. 2020, 18, 1049–1072. [Google Scholar] [CrossRef]
- Mohan, S.V. Harnessing of Biohydrogen from Wastewater Treatment Using Mixed Fermentative Consortia: Process Evaluation towards Optimization. Int. J. Hydrogen Energy 2009, 34, 7460–7474. [Google Scholar] [CrossRef]
- De Bari, I.; Giuliano, A.; Petrone, M.T.; Stoppiello, G.; Fatta, V.; Giardi, C.; Razza, F.; Novelli, A. From Cardoon Lignocellulosic Biomass to Bio-1,4 Butanediol: An Integrated Biorefinery Model. Processes 2020, 8, 1585. [Google Scholar] [CrossRef]
- Cabrol, L.; Marone, A.; Tapia-Venegas, E.; Steyer, J.-P.; Ruiz-Filippi, G.; Trably, E. Microbial Ecology of Fermentative Hydrogen Producing Bioprocesses: Useful Insights for Driving the Ecosystem Function. FEMS Microbiol. Rev. 2017, 41, 158–181. [Google Scholar] [CrossRef]
- El-Dalatony, M.M.; Zheng, Y.; Ji, M.-K.; Li, X.; Salama, E.-S. Metabolic Pathways for Microalgal Biohydrogen Production: Current Progress and Future Prospectives. Bioresour. Technol. 2020, 318, 124253. [Google Scholar] [CrossRef]
- Li, C.; Fang, H.H.P. Fermentative Hydrogen Production From Wastewater and Solid Wastes by Mixed Cultures. Crit. Rev. Environ. Sci. Technol. 2007, 37, 1–39. [Google Scholar] [CrossRef]
- Hasibar, B.; Ergal, İ.; Moser, S.; Bochmann, G.; Rittmann, S.K.-M.R.; Fuchs, W. Increasing Biohydrogen Production with the Use of a Co-Culture inside a Microbial Electrolysis Cell. Biochem. Eng. J. 2020, 164, 107802. [Google Scholar] [CrossRef]
- Mona, S.; Kumar, S.S.; Kumar, V.; Parveen, K.; Saini, N.; Deepak, B.; Pugazhendhi, A. Green Technology for Sustainable Biohydrogen Production (Waste to Energy): A Review. Sci. Total Environ. 2020, 728, 138481. [Google Scholar] [CrossRef] [PubMed]
- Song, W.; Ding, L.; Liu, M.; Cheng, J.; Zhou, J.; Li, Y.-Y. Improving Biohydrogen Production through Dark Fermentation of Steam-Heated Acid Pretreated Alternanthera Philoxeroides by Mutant Enterobacter Aerogenes ZJU1. Sci. Total Environ. 2020, 716, 134695. [Google Scholar] [CrossRef] [PubMed]
- Lee, K.-S.; Lin, P.-J.; Chang, J.-S. Temperature Effects on Biohydrogen Production in a Granular Sludge Bed Induced by Activated Carbon Carriers. Int. J. Hydrogen Energy 2006, 31, 465–472. [Google Scholar] [CrossRef]
- Kazimierowicz, J.; Dębowski, M.; Zieliński, M. Progress and Challenges in Biohydrogen Production. Energies 2022, 15, 5413. [Google Scholar] [CrossRef]
- Oceguera-Contreras, E.; Aguilar-Juárez, O.; Oseguera-Galindo, D.; Macías-Barragán, J.; Bolaños-Rosales, R.; Mena-Enríquez, M.; Arias-García, A.; Montoya-Buelna, M.; Graciano-Machuca, O.; De León-Rodríguez, A. Biohydrogen Production by Vermihumus-Associated Microorganisms Using Agro Industrial Wastes as Substrate. Int. J. Hydrogen Energy 2019, 44, 9856–9865. [Google Scholar] [CrossRef]
- Pascualone, M.J.; Costa, M.B.G.; Dalmasso, P.R. Fermentative Biohydrogen Production from a Novel Combination of Vermicompost as Inoculum and Mild Heat-Pretreated Fruit and Vegetable Waste. Biofuel Res. J. 2019, 6, 1046–1053. [Google Scholar] [CrossRef]
- Karthikeyan, O.P.; Trably, E.; Mehariya, S.; Bernet, N.; Wong, J.W.C.; Carrere, H. Pretreatment of Food Waste for Methane and Hydrogen Recovery: A Review. Bioresour. Technol. 2018, 249, 1025–1039. [Google Scholar] [CrossRef]
- Zhou, M.; Yan, B.; Wong, J.W.C.; Zhang, Y. Enhanced Volatile Fatty Acids Production from Anaerobic Fermentation of Food Waste: A Mini-Review Focusing on Acidogenic Metabolic Pathways. Bioresour. Technol. 2018, 248, 68–78. [Google Scholar] [CrossRef]
- Ucisik, A.S.; Henze, M. Biological Hydrolysis and Acidification of Sludge under Anaerobic Conditions: The Effect of Sludge Type and Origin on the Production and Composition of Volatile Fatty Acids. Water Res. 2008, 42, 3729–3738. [Google Scholar] [CrossRef]
- Farzad, S.; Mandegari, M.A.; Guo, M.; Haigh, K.F.; Shah, N.; Görgens, J.F. Multi-Product Biorefineries from Lignocelluloses: A Pathway to Revitalisation of the Sugar Industry? Biotechnol. Biofuels 2017, 10, 87. [Google Scholar] [CrossRef] [PubMed]
- Zhang, Z.; Zhang, H.; Li, Y.; Lu, C.; Zhu, S.; He, C.; Ai, F.; Zhang, Q. Investigation of the Interaction between Lighting and Mixing Applied during the Photo-Fermentation Biohydrogen Production Process from Agricultural Waste. Bioresour. Technol. 2020, 312, 123570. [Google Scholar] [CrossRef] [PubMed]
- Rodríguez, J.; Kleerebezem, R.; Lema, J.M.; van Loosdrecht, M.C.M. Modeling Product Formation in Anaerobic Mixed Culture Fermentations. Biotechnol. Bioeng. 2006, 93, 592–606. [Google Scholar] [CrossRef] [PubMed]
- Gadhamshetty, V.; Johnson, D.C.; Nirmalakhandan, N.; Smith, G.B.; Deng, S. Dark and Acidic Conditions for Fermentative Hydrogen Production. Int. J. Hydrogen Energy 2009, 34, 821–826. [Google Scholar] [CrossRef]
- Lee, H.-S.; Salerno, M.B.; Rittmann, B.E. Thermodynamic Evaluation on H2 Production in Glucose Fermentation. Environ. Sci. Technol. 2008, 42, 2401–2407. [Google Scholar] [CrossRef]
- Cortés, A.; Feijoo, G.; Chica, A.; Da Costa-Serra, J.F.; Moreira, M.T. Environmental Implications of Biohydrogen Based Energy Production from Steam Reforming of Alcoholic Waste. Ind. Crop Prod. 2019, 138, 111465. [Google Scholar] [CrossRef]
- Ramachandran, R.; Menon, R.K. An Overview of Industrial Uses of Hydrogen. Int. J. Hydrogen Energy 1998, 23, 593–598. [Google Scholar] [CrossRef]
- Bartels, J.R.; Pate, M.B.; Olson, N.K. An Economic Survey of Hydrogen Production from Conventional and Alternative Energy Sources. Int. J. Hydrogen Energy 2010, 35, 8371–8384. [Google Scholar] [CrossRef]
- Franchi, G.; Capocelli, M.; De Falco, M.; Piemonte, V.; Barba, D. Hydrogen Production via Steam Reforming: A Critical Analysis of MR and RMM Technologies. Membranes 2020, 10, 10. [Google Scholar] [CrossRef]
- Mohan, S.V.; Babu, V.L.; Srikanth, S.; Sarma, P.N. Bio-Electrochemical Evaluation of Fermentative Hydrogen Production Process with the Function of Feeding PH. Int. J. Hydrogen Energy 2008, 33, 4533–4546. [Google Scholar] [CrossRef]
- Feng, Y.; Zhang, Y.; Quan, X.; Chen, S. Enhanced Anaerobic Digestion of Waste Activated Sludge Digestion by the Addition of Zero Valent Iron. Water Res. 2014, 52, 242–250. [Google Scholar] [CrossRef] [PubMed]
- Pasupuleti, S.B.; Sarkar, O.; Mohan, S.V. Upscaling of Biohydrogen Production Process in Semi-Pilot Scale Biofilm Reactor: Evaluation with Food Waste at Variable Organic Loads. Int. J. Hydrogen Energy 2014, 39, 7587–7596. [Google Scholar] [CrossRef]
- Jia, X.; Li, M.; Wang, Y.; Wu, Y.; Zhu, L.; Wang, X.; Zhao, Y. Enhancement of Hydrogen Production and Energy Recovery through Electro-Fermentation from the Dark Fermentation Effluent of Food Waste. Environ. Sci. Ecotechnol. 2020, 1, 100006. [Google Scholar] [CrossRef]
- Venkata Mohan, S.; Mohanakrishna, G.; Sarma, P.N. Integration of Acidogenic and Methanogenic Processes for Simultaneous Production of Biohydrogen and Methane from Wastewater Treatment. Int. J. Hydrogen Energy 2008, 33, 2156–2166. [Google Scholar] [CrossRef]
- Pan, J.; Zhang, R.; El-Mashad, H.M.; Sun, H.; Ying, Y. Effect of Food to Microorganism Ratio on Biohydrogen Production from Food Waste via Anaerobic Fermentation. Int. J. Hydrogen Energy 2008, 33, 6968–6975. [Google Scholar] [CrossRef]
- Balamurugan, M.; Parthasarathi, K.; Ranganathan, L.; Cooper, E. Quality Criteria for Vermicomposts. In Vermiculture Technology; Clive, A., Norman, Q.E., Arancon, R.L.S., Eds.; CRC Press: Boca Raton, FL, USA, 2010; ISBN 9780429130670. [Google Scholar]
- Sinha, R.K.; Herat, S.; Agarwal, S.; Asadi, R.; Carretero, E. Vermiculture and Waste Management: Study of Action of Earthworms Elsinia Foetida, Eudrilus Euginae and Perionyx Excavatus on Biodegradation of Some Community Wastes in India and Australia. Environ. Syst. Decis. 2002, 22, 261–268. [Google Scholar] [CrossRef]
- Hawkes, F.R.; Hussy, I.; Kyazze, G.; Dinsdale, R.; Hawkes, D.L. Continuous Dark Fermentative Hydrogen Production by Mesophilic Microflora: Principles and Progress. Int. J. Hydrogen Energy 2007, 32, 172–184. [Google Scholar] [CrossRef]
- Baghchehsaraee, B.; Nakhla, G.; Karamanev, D.; Margaritis, A.; Reid, G. The Effect of Heat Pretreatment Temperature on Fermentative Hydrogen Production Using Mixed Cultures. Int. J. Hydrogen Energy 2008, 33, 4064–4073. [Google Scholar] [CrossRef]
- Goud, R.K.; Mohan, S.V. Regulating Biohydrogen Production from Wastewater by Applying Organic Load-Shock: Change in the Microbial Community Structure and Bio-Electrochemical Behavior over Long-Term Operation. Int. J. Hydrogen Energy 2012, 37, 17763–17777. [Google Scholar] [CrossRef]
- Zhu, H.; Béland, M. Evaluation of Alternative Methods of Preparing Hydrogen Producing Seeds from Digested Wastewater Sludge. Int. J. Hydrogen Energy 2006, 31, 1980–1988. [Google Scholar] [CrossRef]
- Mohan, S.V.; Bhaskar, Y.V.; Sarma, P.N. Biohydrogen Production from Chemical Wastewater Treatment in Biofilm Configured Reactor Operated in Periodic Discontinuous Batch Mode by Selectively Enriched Anaerobic Mixed Consortia. Water Res. 2007, 41, 2652–2664. [Google Scholar] [CrossRef]
- Nair, J.; Sekiozoic, V.; Anda, M. Effect of Pre-Composting on Vermicomposting of Kitchen Waste. Bioresour. Technol. 2006, 97, 2091–2095. [Google Scholar] [CrossRef] [PubMed]
- Grady, C.P.L., Jr.; Gaigger, G.T.; Love, N.G.; Filipe, C.D. Biological Wastewater Treatment, 2nd ed.; Marcel, D., Ed.; CRC Press: New York, NY, USA, 1999. [Google Scholar]
- Blomström, A.-L.; Lalander, C.; Komakech, A.J.; Vinnerås, B.; Boqvist, S. A Metagenomic Analysis Displays the Diverse Microbial Community of a Vermicomposting System in Uganda. Infect. Ecol. Epidemiol. 2016, 6, 32453. [Google Scholar] [CrossRef] [PubMed]
- Harms, P.; Kostov, Y.; Rao, G. Bioprocess Monitoring. Curr. Opin. Biotechnol. 2002, 13, 124–127. [Google Scholar] [CrossRef]
- Liu, C.-G.; Qin, J.-C.; Lin, Y.-H. Fermentation and Redox Potential. Ferment. Processes. 2017, 565. [Google Scholar] [CrossRef]
- Wang, J.; Wan, W. Effect of Temperature on Fermentative Hydrogen Production by Mixed Cultures. Int. J. Hydrogen Energy 2008, 33, 5392–5397. [Google Scholar] [CrossRef]
- Raghavulu, S.V.; Mohan, S.V.; Goud, R.K.; Sarma, P.N. Effect of Anodic PH Microenvironment on Microbial Fuel Cell (MFC) Performance in Concurrence with Aerated and Ferricyanide Catholytes. Electrochem. Commun. 2009, 11, 371–375. [Google Scholar] [CrossRef]
- Ferchichi, M.; Crabbe, E.; Gil, G.-H.; Hintz, W.; Almadidy, A. Influence of Initial PH on Hydrogen Production from Cheese Whey. J. Biotechnol. 2005, 120, 402–409. [Google Scholar] [CrossRef]
- Rafieenia, R.; Lavagnolo, M.C.; Pivato, A. Pre-Treatment Technologies for Dark Fermentative Hydrogen Production: Current Advances and Future Directions. Waste Manag. 2018, 71, 734–748. [Google Scholar] [CrossRef]
- Kim, S.-H.; Han, S.-K.; Shin, H.-S. Feasibility of Biohydrogen Production by Anaerobic Co-Digestion of Food Waste and Sewage Sludge. Int. J. Hydrogen Energy 2004, 29, 1607–1616. [Google Scholar] [CrossRef]
- Rogers, P. Genetics and Biochemistry of Clostridium Relevant to Development of Fermentation Processes; Academic Press: Cambridge, MA, USA, 1986. [Google Scholar]
- Sparling, R.; Risbey, D.; Poggi-Varaldo, H.M. Hydrogen Production from Inhibited Anaerobic Composters. Int. J. Hydrogen Energy 1997, 22, 563–566. [Google Scholar] [CrossRef]
- Venkata Mohan, S.; Vijaya Bhaskar, Y.; Murali Krishna, P.; Chandrasekhara Rao, N.; Lalit Babu, V.; Sarma, P.N. Biohydrogen Production from Chemical Wastewater as Substrate by Selectively Enriched Anaerobic Mixed Consortia: Influence of Fermentation PH and Substrate Composition. Int. J. Hydrogen Energy 2007, 32, 2286–2295. [Google Scholar] [CrossRef]
- Sarkar, O.; Mohan, S.V. Pre-Aeration of Food Waste to Augment Acidogenic Process at Higher Organic Load: Valorizing Biohydrogen, Volatile Fatty Acids and Biohythane. Bioresour. Technol. 2017, 242, 68–76. [Google Scholar] [CrossRef] [PubMed]
- Bansal, S.K.; Sreekrishnan, T.R.; Singh, R. Effect of Heat Pretreated Consortia on Fermentative Biohydrogen Production from Vegetable Waste. Natl. Acad. Sci. Lett. 2013, 36, 125–131. [Google Scholar] [CrossRef]
- Chen, C.-C.; Lin, C.-Y.; Lin, M.-C. Acid-Base Enrichment Enhances Anaerobic Hydrogen Production Process. Appl. Microbiol. Biotechnol. 2002, 58, 224–228. [Google Scholar] [CrossRef]
- Kim, S.; Choi, K.; Kim, J.-O.; Chung, J. Biological Hydrogen Production by Anaerobic Digestion of Food Waste and Sewage Sludge Treated Using Various Pretreatment Technologies. Biodegradation 2013, 24, 753–764. [Google Scholar] [CrossRef]
- Ntaikou, I. 10-Microbial Production of Hydrogen. In Sustainable Fuel Technologies Handbook; Dutta, S., Mustansar Hussain, C., Eds.; Academic Press: Cambridge, MA, USA, 2021; pp. 315–337. ISBN 978-0-12-822989-7. [Google Scholar]
- Mohammadi, P.; Ibrahim, S.; Annuar, M.S.M.; Ghafari, S.; Vikineswary, S.; Zinatizadeh, A.A. Influences of Environmental and Operational Factors on Dark Fermentative Hydrogen Production: A Review. CLEAN-Soil Air Water 2012, 40, 1297–1305. [Google Scholar] [CrossRef]
- Domínguez, J.; Aira, M.; Kolbe, A.R.; Gómez-Brandón, M.; Pérez-Losada, M. Changes in the Composition and Function of Bacterial Communities during Vermicomposting May Explain Beneficial Properties of Vermicompost. Sci. Rep. 2019, 9, 9657. [Google Scholar] [CrossRef]
- Mohan, S.V.; Mohanakrishna, G.; Goud, R.K.; Sarma, P.N. Acidogenic Fermentation of Vegetable Based Market Waste to Harness Biohydrogen with Simultaneous Stabilization. Bioresour. Technol. 2009, 100, 3061–3068. [Google Scholar] [CrossRef]
- Ghimire, A.; Frunzo, L.; Pontoni, L.; d’Antonio, G.; Lens, P.N.L.; Esposito, G.; Pirozzi, F. Dark Fermentation of Complex Waste Biomass for Biohydrogen Production by Pretreated Thermophilic Anaerobic Digestate. J. Environ. Manag. 2015, 152, 43–48. [Google Scholar] [CrossRef]
- Abubackar, H.N.; Keskin, T.; Yazgin, O.; Gunay, B.; Arslan, K.; Azbar, N. Biohydrogen Production from Autoclaved Fruit and Vegetable Wastes by Dry Fermentation under Thermophilic Condition. Int. J. Hydrogen Energy 2019, 44, 18776–18784. [Google Scholar] [CrossRef]
- Ghimire, A.; Luongo, V.; Frunzo, L.; Pirozzi, F.; Lens, P.N.L.; Esposito, G. Continuous Biohydrogen Production by Thermophilic Dark Fermentation of Cheese Whey: Use of Buffalo Manure as Buffering Agent. Int. J. Hydrogen Energy 2017, 42, 4861–4869. [Google Scholar] [CrossRef]
- Gorgeç, F.K.; Karapinar, I. Production of Biohydrogen from Waste Wheat in Continuously Operated UPBR: The Effect of Influent Substrate Concentration. Int. J. Hydrogen Energy 2019, 44, 17323–17333. [Google Scholar] [CrossRef]
- Logan, B.E.; Regan, J.M. Electricity-Producing Bacterial Communities in Microbial Fuel Cells. Trends Microbiol. 2006, 14, 512–518. [Google Scholar] [CrossRef]
- Clark, J.H.; Farmer, T.J.; Hunt, A.J.; Sherwood, J. Opportunities for Bio-Based Solvents Created as Petrochemical and Fuel Products Transition towards Renewable Resources. Int. J. Mol. Sci. 2015, 16, 17101–17159. [Google Scholar] [CrossRef]
- Han, W.; Yan, Y.; Shi, Y.; Gu, J.; Tang, J.; Zhao, H. Biohydrogen Production from Enzymatic Hydrolysis of Food Waste in Batch and Continuous Systems. Sci. Rep. 2016, 6, 38395. [Google Scholar] [CrossRef]
- Sharma, S.; Basu, S.; Shetti, N.P.; Aminabhavi, T.M. Waste-to-Energy Nexus for Circular Economy and Environmental Protection: Recent Trends in Hydrogen Energy. Sci. Total Environ. 2020, 713, 136633. [Google Scholar] [CrossRef]
- Reaño, R.L. Assessment of Environmental Impact and Energy Performance of Rice Husk Utilization in Various Biohydrogen Production Pathways. Bioresour. Technol. 2020, 299, 122590. [Google Scholar] [CrossRef]
- Guo, X.M.; Trably, E.; Latrille, E.; Carrere, H.; Steyer, J.-P. Predictive and Explicative Models of Fermentative Hydrogen Production from Solid Organic Waste: Role of Butyrate and Lactate Pathways. Int. J. Hydrogen Energy 2014, 39, 7476–7485. [Google Scholar] [CrossRef]
- Alibardi, L.; Cossu, R. Effects of Carbohydrate, Protein and Lipid Content of Organic Waste on Hydrogen Production and Fermentation Products. Waste Manag. 2016, 47, 69–77. [Google Scholar] [CrossRef]


| S.No | Substrate Used | Inoculum Used | Cumulative Hydrogen Produced | VS Degradation Efficiency | References |
|---|---|---|---|---|---|
| 1 | Food waste | Anaerobic Sludge and Vermicompost | 50 mL/g VS | 60% | Present Study |
| 2 | Vegetable waste | Acid-treated anaerobic sludge | 89 mL/g COD | 65% | [63] |
| 3 | Food waste | Anaerobic sludge | 57 mL/g VS | 39% | [35] |
| 4 | Potato, pumpkin waste, other agro-industrial wastes | Anaerobic sludge | 46 mL/g VS | - | [64] |
| 5 | Autoclaved FW | Anaerobic sludge | 27.91 mL/g VS | - | [65] |
| 6 | Cheese whey and wheat straw hydrolysate | Anaerobic sludge | 4554.5 H2/L | - | [66] |
| 7 | Mild heat-pretreated FVW | Vermicompost | 63.0 mL/g VS | 46% | [17] |
| 8 | Waste wheat | Anaerobic mixed culture | 654.7 L/kg | 45% | [67] |
| Substrate | Reactor | Hm (mL) | R (mL/h) | λ (hr) | Production H2 (mmol/g VS) | R2 |
|---|---|---|---|---|---|---|
| Vermicompost | VC1 | 33 | 0.04 | 3.41 | 1.224 | 0.997 |
| VC2 | 48 | 0.071 | 2.4 | 2.010 | 0.997 | |
| VC3 | 33 | 0.05 | 1.69 | 1.267 | 0.995 | |
| Anaerobic Sludge | AS | 46 | 0.05 | 1.16 | 1.927 | 0.982 |
| Vermicompost + Anaerobic Sludge | VC+AS | 50 | 0.083 | 3.05 | 2.107 | 0.996 |
Publisher’s Note: MDPI stays neutral with regard to jurisdictional claims in published maps and institutional affiliations. |
© 2022 by the authors. Licensee MDPI, Basel, Switzerland. This article is an open access article distributed under the terms and conditions of the Creative Commons Attribution (CC BY) license (https://creativecommons.org/licenses/by/4.0/).
Share and Cite
Karthikeyan, B.; Gokuladoss, V. Fusion of Vermicompost and Sewage Sludge as Dark Fermentative Biocatalyst for Biohydrogen Production: A Kinetic Study. Energies 2022, 15, 6917. https://doi.org/10.3390/en15196917
Karthikeyan B, Gokuladoss V. Fusion of Vermicompost and Sewage Sludge as Dark Fermentative Biocatalyst for Biohydrogen Production: A Kinetic Study. Energies. 2022; 15(19):6917. https://doi.org/10.3390/en15196917
Chicago/Turabian StyleKarthikeyan, Balakumar, and Velvizhi Gokuladoss. 2022. "Fusion of Vermicompost and Sewage Sludge as Dark Fermentative Biocatalyst for Biohydrogen Production: A Kinetic Study" Energies 15, no. 19: 6917. https://doi.org/10.3390/en15196917