Review

Review of Energy Challenges and Horizons of Hydrogen City Buses

1
Department of Electrical Power Engineering and Mechatronics, Tallinn University of Technology, 19086 Tallinn, Estonia
2
Department of Computer Systems, Tallinn University of Technology, 19086 Tallinn, Estonia
*
Author to whom correspondence should be addressed.
Energies 2022, 15(19), 6945; https://doi.org/10.3390/en15196945
Submission received: 15 August 2022 / Revised: 11 September 2022 / Accepted: 20 September 2022 / Published: 22 September 2022
(This article belongs to the Special Issue Hybrid, Electric and Fuel Cell Vehicles)

Abstract

:
This paper discusses fuel cell electric vehicles and, more specifically, the challenges and development of hydrogen-fueled buses for people accessing this transportation in cities and urban environments. The study reveals the main innovations and challenges in the field of hydrogen bus deployment, and identifies the most common approaches and errors in this area by extracting and critically appraising data from sources important to the energy perspective. Three aspects of the development and horizons of fuel cell electric buses are reviewed, namely energy consumption, energy efficiency, and energy production. The first is associated with the need to ensure a useful and sustainable climate-neutral public transport. Herewith, the properties of the hydrogen supply of electric buses and their benefits over gasoline, gas, and battery vehicles are discussed. The efficiency issue is related to the ratio of consumed and produced fuel in view of energy losses. Four types of engines–gasoline, diesel, gas, and electrical–are evaluated in terms of well-to-wheel, tank-to-wheel, delivery, and storage losses. The third problem arises from the production, operating, and disposal constraints of the society at the present juncture. Several future-oriented initiatives of the European Commission, separate countries, and companies are described. The study shows that the effectiveness of the FCEBs depends strongly on the energy generation used to produce hydrogen. In the countries where the renewables are the main energy sources, the FCEBs are effective. In other regions they are not effective enough yet, although the future horizons are quite broad.

1. Introduction

1.1. Work Scope, Aim, Features, and Restrictions

Environmental pollution in urban spaces is an important problem in terms of economic, health, and social costs. Localities are increasingly suffering from poor air quality, exposure to noise, and traffic jams. Many signs indicate that the world is inexorably approaching an environmental disaster [1,2,3].
A list of pollutants is quite long [4], and many of them depend on fuel combustion. It starts with greenhouse gases, such as carbon dioxide (CO2), methane, and water vapor contributing to an increase in the temperature of the lower atmosphere. It includes also suspended substances such as dust, ash, soot, smoke, sulphates, and nitrates formed as a result of fuel combustion and, depending on the composition, may be either highly or slightly toxic. With regard to nitrogen dioxide (NO2) from combustion processes, it must be noted that there is also a significant waste generated from industrial enterprises, power plants, furnaces, boiler houses, and vehicles. This is of the greatest concern because it affects human health, although other nitrogen oxides are also dangerous to health. Other pollutants are carbon monoxide (CO) produced from incomplete burning of carbon in engines, sulphur dioxide (SO2) released during the combustion of brown coal and oil, and sulphur-containing petroleum products exuded from the processing of sulphur-containing ores. In addition to environmental pollution, serious ecological problems such as climate change, global warming, acid rain, destruction of the ozone layer, etc. cannot stay in the shadows.
Most authors and organizations consider CO2 to be the worst part of this spectrum.
At the beginning of this review, it is important to note that many estimates of the pollution degree have a large variation and ambiguity. First of all, this is due to the fact that many factors must be taken into account to calculate emissions, including accounting protocols, emission limits, power coefficients, etc. [5]. Secondly, various sources of information are used, namely official documents of the European Commission (EC) and national authorities, calculated data, and experimental (real-world) results. For instance, when burning one kilogram of crude oil, 3.15 kg of CO2 is obtained according to the chemical formula, but in practice, more emissions are often obtained from different diesel fuels. In addition, different engine technologies developed for the same type of fuel emit differently. For example, one Euro-1 engine corresponds to about six Euro-6 engines in terms of carbon monoxide emissions. Therefore, among the numerous resources, it was necessary to determine some averaged values of the most common data. A fuel cell (FC) is often considered as a “zero-emission” device, since it does not release CO2 at the point of use, but it emits water vapor and warms air, affecting critical climate changes. When assessing emissions from electrical machines and grids, pollution from electrical discharges and electromagnetic noise are sometimes more dangerous than that from gasoline. Consequently, instead of being “zero-emission”, renewable resources are qualified as alternative or “climate-friendly” in this review, which means they cause minor harm to the environment.
Regardless of the degree of harm, the obvious cause of environmental pollution lies in the burning of fossil fuels that has made power available to the globe for many centuries and currently provides almost 80% of the approximately 172000 TWh/year of global energy [6,7]. Due to the negative results associated with the burning of fossil fuels, it is extremely important for the society to make every effort to decarbonize the economy. This outcome can be achievable only by deploying renewable resources as quickly as possible.
This paper analyzes several possibilities for improving human well-being with the help of environmentally protected public transportation based on fuel cell electric buses (FCEB). The aim of the study is to reveal the main innovations and challenges in the field of FCEB deployment and to identify the most common approaches and errors in this area by extracting and critically appraising data from sources important from the energy side. The primary focus is on three aspects of the development and horizons of these vehicles, namely energy consumption, energy efficiency, and energy production. The first is related to the need to ensure useful and sustainable climate-neutral mobility. The second issue is related to the ratio of consumed and produced fuel in view of four types of machines–gasoline, diesel, gas, and electrical, estimated in terms of well-to-wheel (W2W), tank-to-wheel, delivery, and storage energy losses. The third problem arises from the production, operating, and disposal possibilities of the contemporary society and on the initiatives put forward by the European Union (EU), individual countries, and companies.
Unlike previous works in the field, the strength of the proposed study relates to the identification, selection, and evaluation of the broad spectrum of the current state of the bus energy supply, along with an attempt to provide systematic recommendations for its long-term improvement and development. To this end, a comprehensive search was carried out for the most relevant documents, studies, and technical reports published in official EC directives and regulations, scientific journals, conference proceedings, and the Internet. The application of the established standards was critically appraised and clear qualitative and quantitative methods of data extraction and synthesis corresponding to the specific scope of review were used.
At the same time, it should be noted as a limitation of the study that this work leaves aside at least two important issues. First, only one type of electric vehicles (EV) is being revised, namely the FCEBs powered by hydrogen (H2), although this does not mean that the authors diminish the role of battery electric buses (BEB), considering them also as promising means of transportation. Second, different fuels are compared here irrespectively of their prices due to the slowdown in the global economy currently taking place [8].

1.2. Towards Electric Transport

A comprehensive review of transport use cases can be found in [9], which covers various types of vehicles and their mobility parameters such as range, mileage, payload, tank volume, engine size, and total cost of ownership in various countries. As an outcome, this study, as well as [10,11,12], demonstrates that the world transport sector (road and non-road, including marine and aviation) accounts for 8.1 Gt (34%) of the global CO2 emission, the current volume of which is near 23 Gt. About 4.5 Gt of CO2 emission is generated in the EU, while the EU produces just 3% of the oil it consumes [13]. Emissions at the tailpipe are discussed here and later in this section.
Road transport represents the bulk of the energy demand of the entire transport sector, accounting near 75% of global transport energy [12,14]. Herewith, road transport emits about 15–20% of total CO2 [9]. Some smaller estimation can be found in [15], which demonstrates the global release of 3 Gt CO2 emission from all road passenger vehicles.
After superposing consumed energy with CO2 emission, an approximate diagram of global energy consumption and CO2 emission can be built (Figure 1).
Oil, petroleum, compressed natural gas (CNG), and liquid petroleum gas (LPG) products continue to fulfil above 95% of all transport energy needs [12,16]. Now, petrol cars are the most commonly sold vehicles, constituting 59% of all registrations, and diesel vehicles comprise about 31%, whereas the sales of gas-fueled vehicles and EVs represent near 5% each [15]. The number of EVs and plug-in hybrid passenger cars on the road was about 10 million of the totally estimated 1.5 billion road vehicles in 2020 [17], with almost 400 million in Europe.
Particularly, according to the traffic research portal FIS, over 95% of CO2 emissions in Germany’s transport sector are caused by road traffic, and about 30% of this is caused by long and short-distance road haulage [18]. In Russia, the proportion of all road transport emissions in the total volume of pollutants into the atmosphere is about 42%, which is higher than the share of any industry. At that, in large cities this figure reaches 80 to 90% [19].
Different fossil fuels pollute differently. After processing a number of sources, such as [20,21], the CO2 share from various fuels can be presented as shown in Figure 2.
In particular, as follows from [22], in the USA the transport sector acquires 90% of its energy from petroleum, 4.5% from CNG and LPG, and only 5.5% from renewables, mainly biomass.
Bus fleets are the core of the public transport sector. According to Bloomberg New Energy Finance [23], there were 3 million city buses in operation worldwide in 2017. In 2019, diesel was the most popular type of fuel, as it accounted for 50% of all types of bus fuel [24]. Above 32% of buses used biodiesel additives and gas fuel, and only 18% of buses were electric in 2020, that is, between 0.5 million [23] and 0.6 million [12] (Figure 3).
In the EU, about 60% of all public transport journeys are made by urban and sub-urban buses, that is, above 32 billion passenger journeys per year. In small- and medium-sized cities where there are no other types of public transport, buses can comprise up to 100% of passenger traffic. Alternatively powered vehicles cover near 27% of new European bus sales [25].
According to [10,26], emissions in urban areas could be reduced by at least 20% as a result of switching to cleaner buses. Therefore, the EC recommends renewing the bus fleets in big cities of the EU first [27]. Thus, replacing internal combustion engines (ICE) with an alternative propulsion has become a priority of the city transport modernization.
Significant volumes of information on competitiveness of different technologies supporting this direction can be found in [28,29,30]. Ultimately, the choice of optimal technology for bus transportation depends on preferences for flexibility, operational constraints and infrastructure costs set by a fleet operator. As follows from [4], the key decision criteria are the cost of purchasing buses and their operation, in addition to a number of other parameters, such as comfort and space requirements, operation in hot or cold climates, flexibility across line needs, bus durability, the infrastructure, and the time of refueling. The important reasons for the marketing issues also lie behind the feasibility of production processes, the quality of vehicles, the reliability of the supply chain, and the acceptability of resources. All these factors affect the choice of propelling methods, but, given that many bus fleets are subsidized today, this may be a segment in which policy decisions can encourage early adoption.
The two ways to transfer to alternative equipment are to switch from diesel and gasoline to either gas (CNG, LPG, biogas, syngas, etc.) or electric propulsion.
The first alternative is to power buses with gas, which is more environmentally friendly than gasoline and diesel fuel [31,32]. Unlike an engine running on gasoline, which emits relatively easily such oxidizing substances as ethyl and ethylene, a gas engine running on LPG emits hydrocarbons, which is the most resistant to oxidation. Once the gas is completely burned, only CO2 and water vapor enter the atmosphere, whereas when gasoline and diesel fuel are burned, toxic carbon monoxide, nitrogen oxide, hydrocarbons, soot, and other small particles harmful to health are released as well.
Theoretically, 1 kg of natural gas releases 2.75 kg of CO2 [33] in contrast to crude oil, which yields 3.15 kg CO2 [34]. LPG burns more completely than gasoline, and therefore the concentration of carbon monoxide in the gas car exhaust is several times lower than in the exhaust of a gasoline car. As follows from [35], CO emission can be reduced by 2–3 times when using LPG instead of gasoline and diesel fuel. In accordance with [36], the use of natural gas improves air quality due to the reducing of NO2 emission by more than 90% and of particulate matter by 99%. Herewith, nitrogen oxides are decreased by two times, hydrocarbons by three times, smoke by nine times, and formation of soot common for diesel engines is almost absent when engines are running on LPG. It is noteworthy that gas equipment itself is simpler than any fuel injection pumps and diesel injectors since it practically does not contain complex gears [37].
The second alternative is to equip buses with electrical motors (EM) that are much more environmentally friendly than the ICEs and gas engines when discussing emissions at the tailpipe. Electric traction is a widely discussed topic in the field of technology and engineering today, given that currently the total share of electricity in the transport sector remains low [26].
At least two types of electric buses are usually compared, namely BEBs and FCEBs. Both are at the forefront of solving pollution problems, since they are not only clean but also silent, and produce much less vibration [26]. Both BEBs and FCEBs are electrically driven, use the same Ems, and have many components in common. The key difference is that batteries of BEBs store electricity in electrochemical form, while FCs of FCEBs generate it on board from stored hydrogen.
As a whole, the dynamics of the growth of harmful emissions are directly related to the increase of the transport fleet. At that, the number of automobiles globally tends to double every 20 years [16]. To follow the scenario [9,12,38], the mass of the global CO2 emission must be reduced by at least 90% by 2050 in order to avoid an environmental catastrophe. However, though ICEs (and diesel engines as their variety) are the sources of pollution, the contemporary transport sector is not yet ready to reduce environmental contamination [12]. According to an optimistic forecast [9], the switching to gas supply is reachable by 2030, but it is difficult to name the timing of the complete transition of the bus fleet to electrical technology, since this process depends on the pace of transport electrification, especially among companies operating in cities [39].

1.3. Fuel Cell Electric Vehicles

Hydrogen is currently considered the cleanest fuel, since the introduction of the hydrogen-powered FCs promises to significantly decrease the city pollution [1,4]. Therefore, FCs are now being implemented in transport, including not only buses, but also cars, trucks, forklifts, trains, ships, planes, submarines, rockets, etc. The list of models of hydrogen EVs exceeds several hundred products.
FC is an electrochemical converter that transforms chemical potential energy into electrical energy upon the continuous hydrogen (reductant) and oxygen (oxidant) reaction [40]. It generates electricity without combustion by extracting electrons from hydrogen and combining them with oxygen from the air (Figure 4).
Any type of FC has two electrodes–a negative anode and a positive cathode–sandwiched around a membrane made of a special polymer film called an electrolyte, which keeps the electrodes apart. Hydrogen from the tank feeds down a pipe to the anode, and oxygen from air comes down a second pipe to the cathode. The anode is made of platinum, a precious metal catalyst designed to speed up the chemical reaction, which breaks down the fuel into electrons and ions. Ions flow through the electrolyte towards the cathode. The released electrons, meanwhile, travel through the outer circuit including the electrical drive, which propels the vehicle wheels when road transport is considered. Upon reaching the cathode catalyst, usually nickel, ions join electrons and combine with water oxygen, which exits through the exhaust pipe in the form of vapor or steam.
An elementary FC generates 0.6 to 0.7 V voltage. To deliver the desired amount of energy, FC stacks are used, in which the FCs are combined in series to yield a higher voltage and in parallel to ensure the supply of a higher direct current (DC).
Thus, the FCs utilizing pure hydrogen fuel are completely carbon-free, and their only products are electricity, heat, and water. Since FCs do not emit pollution, they are classified as “zero-emission” devices and have a promising chance of becoming the equipment of the future. Since there are no moving parts in FC systems, they operate with high reliability, do not need frequent recharging like batteries, and generate energy as long as there is a fuel source. Electric vehicles built on the FC (FCEV) and EMs are not silent, but they operate more quietly than vehicles with ICEs, which make a combustion noise as the cylinder pressure changes.
Nevertheless, the hydrogen FCs are comparatively expensive because their construction requires rare substances. The highest cost of the FC assembly falls on the catalyst, which accounts for more than 40% of the total price due to the platinum material used [4]. From the standpoint of packaging, weight and, mostly, reliability, fuel storage, and high-volume manufacturability, the FC-fed drives cannot yet compete with ICEs in the automotive applications.
When the FC stack directly feeds the EM, the propulsion system suffers from voltage instability and nonlinear behavior in dynamic conditions, since the city driving cycles are characterized by decelerations, accelerations, and stop phases. To avoid supply instability, EVs are usually powered in a hybrid way [10], using both the FC energy and electricity from additional rechargeable batteries, ultracapacitors, and power electronics DC/DC converters combined into a single power unit.
Schematically, the powertrains of the FCEVs with EMs can be divided into three categories, namely FC with battery (FC + B), FC with ultracapacitor (FC + UC), and FC with battery and ultracapacitor (FC + B + UC) [40]. The latter is a favorite design configuration among carmakers such as Honda and Toyota, and are used in many FCEV models (Figure 5).
Onboard batteries possessing high specific energy are constantly charged from FCs to propel the EV. Unlike a battery electric vehicle (BEV), whose battery must be large and heavy to meet the maximum power requirement, the battery in this configuration is charged from the FC without need for charging stations and charging time delays [41]. The battery recaptures braking energy, provides extra power during short acceleration events, and smooths out the power delivered from the FC with the option to turn off the FC during low power needs. The amount of energy stored onboard is determined by the size of the hydrogen fuel tank. This is different from the BEV, where the amount of available power and energy is closely related to the battery size.
In contrast, ultracapacitors have high specific power to support power bursts during EV uptake, braking, and load variations. Since FCs cannot recuperate energy and batteries recuperate it too slowly, the ultracapacitors are used to quickly buffer braking energy. They store energy when it is available and release it with high power when it is needed. FCs in conjunction with ultracapacitors can thus create high power with fast dynamic response, which makes them well suited for automotive applications [41]. This arrangement promotes a decrease of the battery size due to electricity self-generation, enlargement of the driving range between 7 and 12 km/kg H2 for heavy EVs [42] and between 18 and 180 km/kg H2 for light EVs [43], and ensures shorter fueling times due to charging with hydrogen instead of electricity [44].
This configuration downsizes the FC power and mass by taking the transient energy upon itself. The powertrain is capable of kinetically accumulating energy with a very fast response and a long lifecycle [41]. The service life of FCs overcomes 30 thousand hours. Batteries usually retain their effectiveness for several thousand charge/discharge cycles. Ultracapacitors can maintain performance for about one million cycles.
Using power from the FC, the battery, and the ultracapacitor, the EMs feed the EV wheels. The EMs are connected to the FC stack via the DC/DC power electronics converter that handles the level of electrical voltage needed to provide the required vehicle speed and the torque it produces [4]. Other converters transform higher-voltage DC power from the battery and ultracapacitor stacks to the lower-voltage DC power needed to run vehicle accessories.
To manage the flow of electrical energy delivered by the FC, the battery, and the ultracapacitor stacks, a power electronics controller is used. Management of the energy exchange between the battery, the ultracapacitor, and the FC, i.e., deciding whether to use the stored electricity or generate it with the FC system, is an important challenge. This strategy affects the required battery power and optimal ultracapacitor sizing [44,45]. Paper [4] introduces different energy management strategies leading to the improvement of the performances from both the energy and reliability points of view. In addition to assessing fuel consumption, several control strategies prevent the degradation of energy storage systems represented by batteries and ultracapacitors [41].
Another issue facing the hydrogen FCEVs is related to the onboard hydrogen storage. This fuel is dangerous because of the low ignition energy and high combustion energy of hydrogen, as well as because it tends to flow out of the tanks easily [46]. Once the structure of the supply system is damaged, hydrogen leakage may occur, which will lead to the environmental problems and an insufficient FC power supply. A hydrogen leak can also cause a fire and endanger the safety of people and property, so a reliable supply system is key to the normal operation of the FCEV [47].

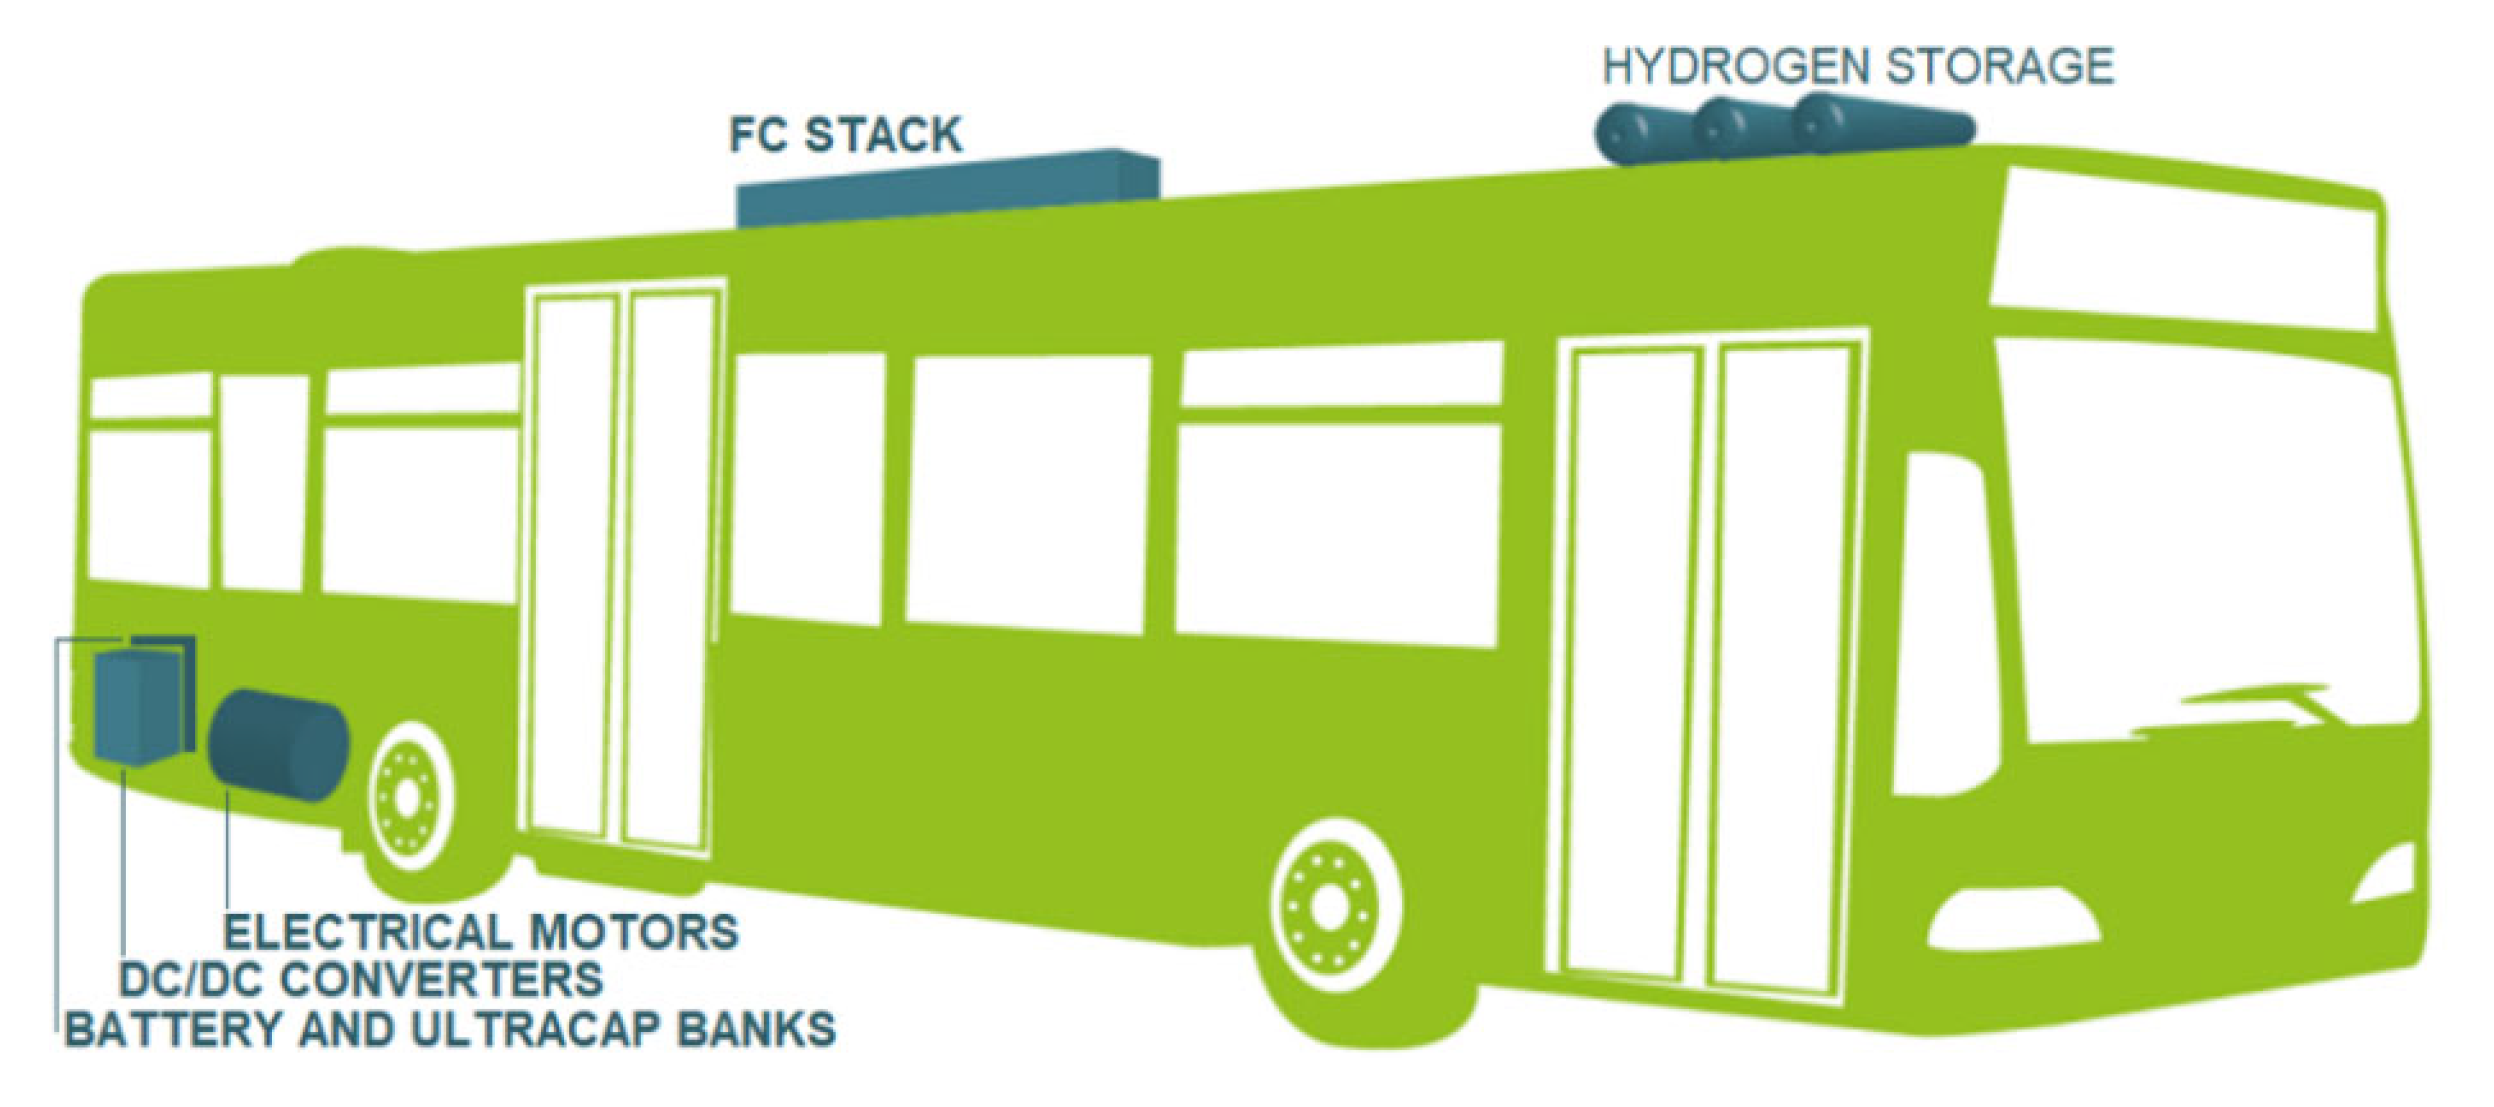
1.4. Hydrogen Buses–The Next Frontier in City Transport

New bus fleets are now being carefully designed considering environmental constraints. In this regard, the implementation of FCEBs demonstrates many benefits, flexibility, and the safety of urban areas. According to forecasts [1,29], buses should switch to hydrogen fuel first. They will be followed by trains, sea, and air transport. After that, the mass use of hydrogen in warehouses, logistics, and heavy industry could begin.
Over the last decade, the number of FCEB models has exceeded one hundred [48]. In 17 European cities, FCEBs are operated daily at a distance of about 8 million km [11] demonstrating stable power supply during the work cycle in heat and cold weather, proven durability, and a power reserve of 140 to 450 km between refueling in hydrogen refueling stations (HRS) at a refueling duration of 7–12 min [18,49].
Several companies are testing and introducing FCEBs [4]. These include: Daimler AG powered by Ballard Power Systems FCs; Thor Industries and Irisbus, based on UTC Power FC technology in California and operated by SunLine Transit Agency; TATA Motors and Indian Oil Corporation (Starbus, FC); Van Hool having commercial fleets in Aberdeen, Scotland; Wrightbus with a fleet in London, England; etc. Since 2018, FCs have been introduced into Korean Elec City buses developed by H Company [50]. The FCEBs are also supplied by other manufacturers in different locations, such as Power Vehicle Innovation, Skoda, MAN, Fiat, Navistar International, Volvo Buses, Hyundai Motor Company, Mitsubishi Bus Corporation, General Motors, VDL, Scania, and Ursus Lublin. In 2019, Solaris Bus & Coach introduced its Urbino 12. As of 2021, the largest fleet of FCEBs in Europe, with 38 buses in daily operation, was in Cologne, Germany [18].
The general design of FCEB electrical powertrains is largely unified (Figure 6).
Hydrogen is usually stored on board the bus either as compressed gas (200–1000 bar) in tanks, or as a cryogenic low-temperature (−253 °C) liquid, or even in an atomic state reversibly adsorbed in metal hydrides [10]. High-pressure tanks located on the roof of the bus provide sufficient range for a full-day operation, over 16 to 18 h [18]. In [49], Brazilian FCEBs with a driving range between refueling of 300 km are described. Korean Elec City FCEB has two hydrogen FCs stacks with a capacity of 90 kW [50]. Ballard’s Fébus FCEB presented in [18] covers more than 300 km between hydrogen refueling. Another Ballard bus carries near 40 kg of hydrogen onboard and is able to travel 350 km throughout the day.

2. Commitment to Excellence via Increase of Energy Efficiency

2.1. FCEB vs. BEB

A battery is the main competitor of the FC, with a hydrogen storage for powering an electrical drive. Commonly, a bus operator must decide which supply is most suitable for replacing the conventional ICE, either the FC with a hydrogen storage or the battery. Various scenarios are discussed by different authors.
At first glance, cost estimates of BEBs and FCEBs seem rather similar, both in terms of capital expenditures and operating expenses [18]. The advantage of FCEBs is that they provide higher flexibility and longer mileage at less additional investment than BEBs and their refueling time is short. In turn, the analysis [51] shows that BEBs are more sensitive then FCEBs to the environment conditions since they suffer quite noticeably of overheating during summertime and overcooling during wintertime. BEVs are mainly inferior to FCEVs due to the dangers associated with the production of heavy batteries [4]. As well, the sustainability of BEVs depends in part on the ability to reuse and recycle batteries and the compounds they contain.
Cost analysis conducted in [9] considers three specific options, namely short-distance urban trips with a 150 km reserve for refueling, long-distance urban trips with a 300–450 km range, and coach trips for intercity routes with a range of 500 km and longer. For long-range capabilities, hydrogen is considered the most practical alternative, whereas for urban short-distance trips BEBs remain quite competitive, since the needed battery is smaller and, therefore, cheaper.
The key aspect that affects the promotion of BEBs is the well-known “battery problem”, since the batteries are too heavy and expensive because the fleets must install fast chargers and the appropriate infrastructure. Long charging time, high weight, limited number of charge/discharge cycles disposing to aging with a maximum lifespan of 10 years, and sizable self-discharge rate at low specific power are the main drawbacks of batteries [11]. Manufacturing of batteries is accompanied with pollution, since 15 tons of CO2 are emitted into the air for every ton of lithium mined [52]. By far, the disposing of EV batteries is a great waste management problem as well. BEB batteries made up of lithium-ion cells, all of which need to be dismantled, contain hazardous materials and have an unpleasant tendency to explode if improperly disassembled [53].
Nevertheless, in the energy storage industry, there has been a gradual reduction in costs in the introduction of innovations in battery technology [12]. In accordance with [4], already BEVs have an advantage in reducing production costs, both in the small and medium class segments. Investments in the battery manufacturing sector have been increasing over the years, and it is expected that by 2040, the global deployment of cumulative storage will reach approximately 1 TWh worldwide, which raises expectations of improvements in related technologies [26]. Some authors believe that increase in mileage will benefit BEBs due to their lower energy consumption.
Most likely, both for long-distance transportation and on short-range routes the FCEBs and BEBs will have a cost parity between 2020 and 2050, since without breakthroughs in technology, a complete alternative to the battery remains challenging. This means that the choice of the future system will be very sensitive to local conditions, such as the cost of electricity or hydrogen, the available infrastructure for refueling, and the required mileage [9]. Much depends on the willingness of consumers to pay for the increased flexibility of a particular offer.
In [54], a case study on transport perspectives conducted in Germany is presented, in which an attention is paid to various classes of road, rail, inland waterway, and air transport. The criteria assessed from the production side included technical maturity, costs, and environmental impact, while from the user side, possible mixing with existing fossil fuels and compliance with the required application ranges. For BEBs, the highest fuel cost reduction was predicted, namely by 50–65% compared to conventional ICEs for coaches and city buses, while for FCEVs, a reduction of only 22% was expected.
In [26], two variants of the Citaro buses of Mercedes-Daimler, BEB and FCEB, were selected for comparison. Their characteristics were analyzed, applying traditional diesel buses as a reference. It has been shown that FCEBs have a great advantage in terms of autonomy, since they do not require charging during a full work shift on the line, which makes it possible to bypass one of the main problems of BEBs. They also differed in their way of refueling, which is similar in time to the method of refueling traditional diesel buses, since a full refueling takes only a few minutes.
On the other hand, in 2019, Honda Europe managers announced their intention to promote BEBs, while FCEVs were relegated to the technologies of the next era [55]. Similarly, the “USA Today” stated that “the dream of FCEVs is practically dead for the passenger car market” [56]. The plan to buy hydrogen FCEBs was also cancelled in the French city of Montpellier after it was found that their operation would cost 6 times more than BEBs [57]. Nissan also discussed abandoning FCEBs development [58]. Several other automobile companies initially focused on FCEBs have shifted their attention to BEBs as well [59,60].

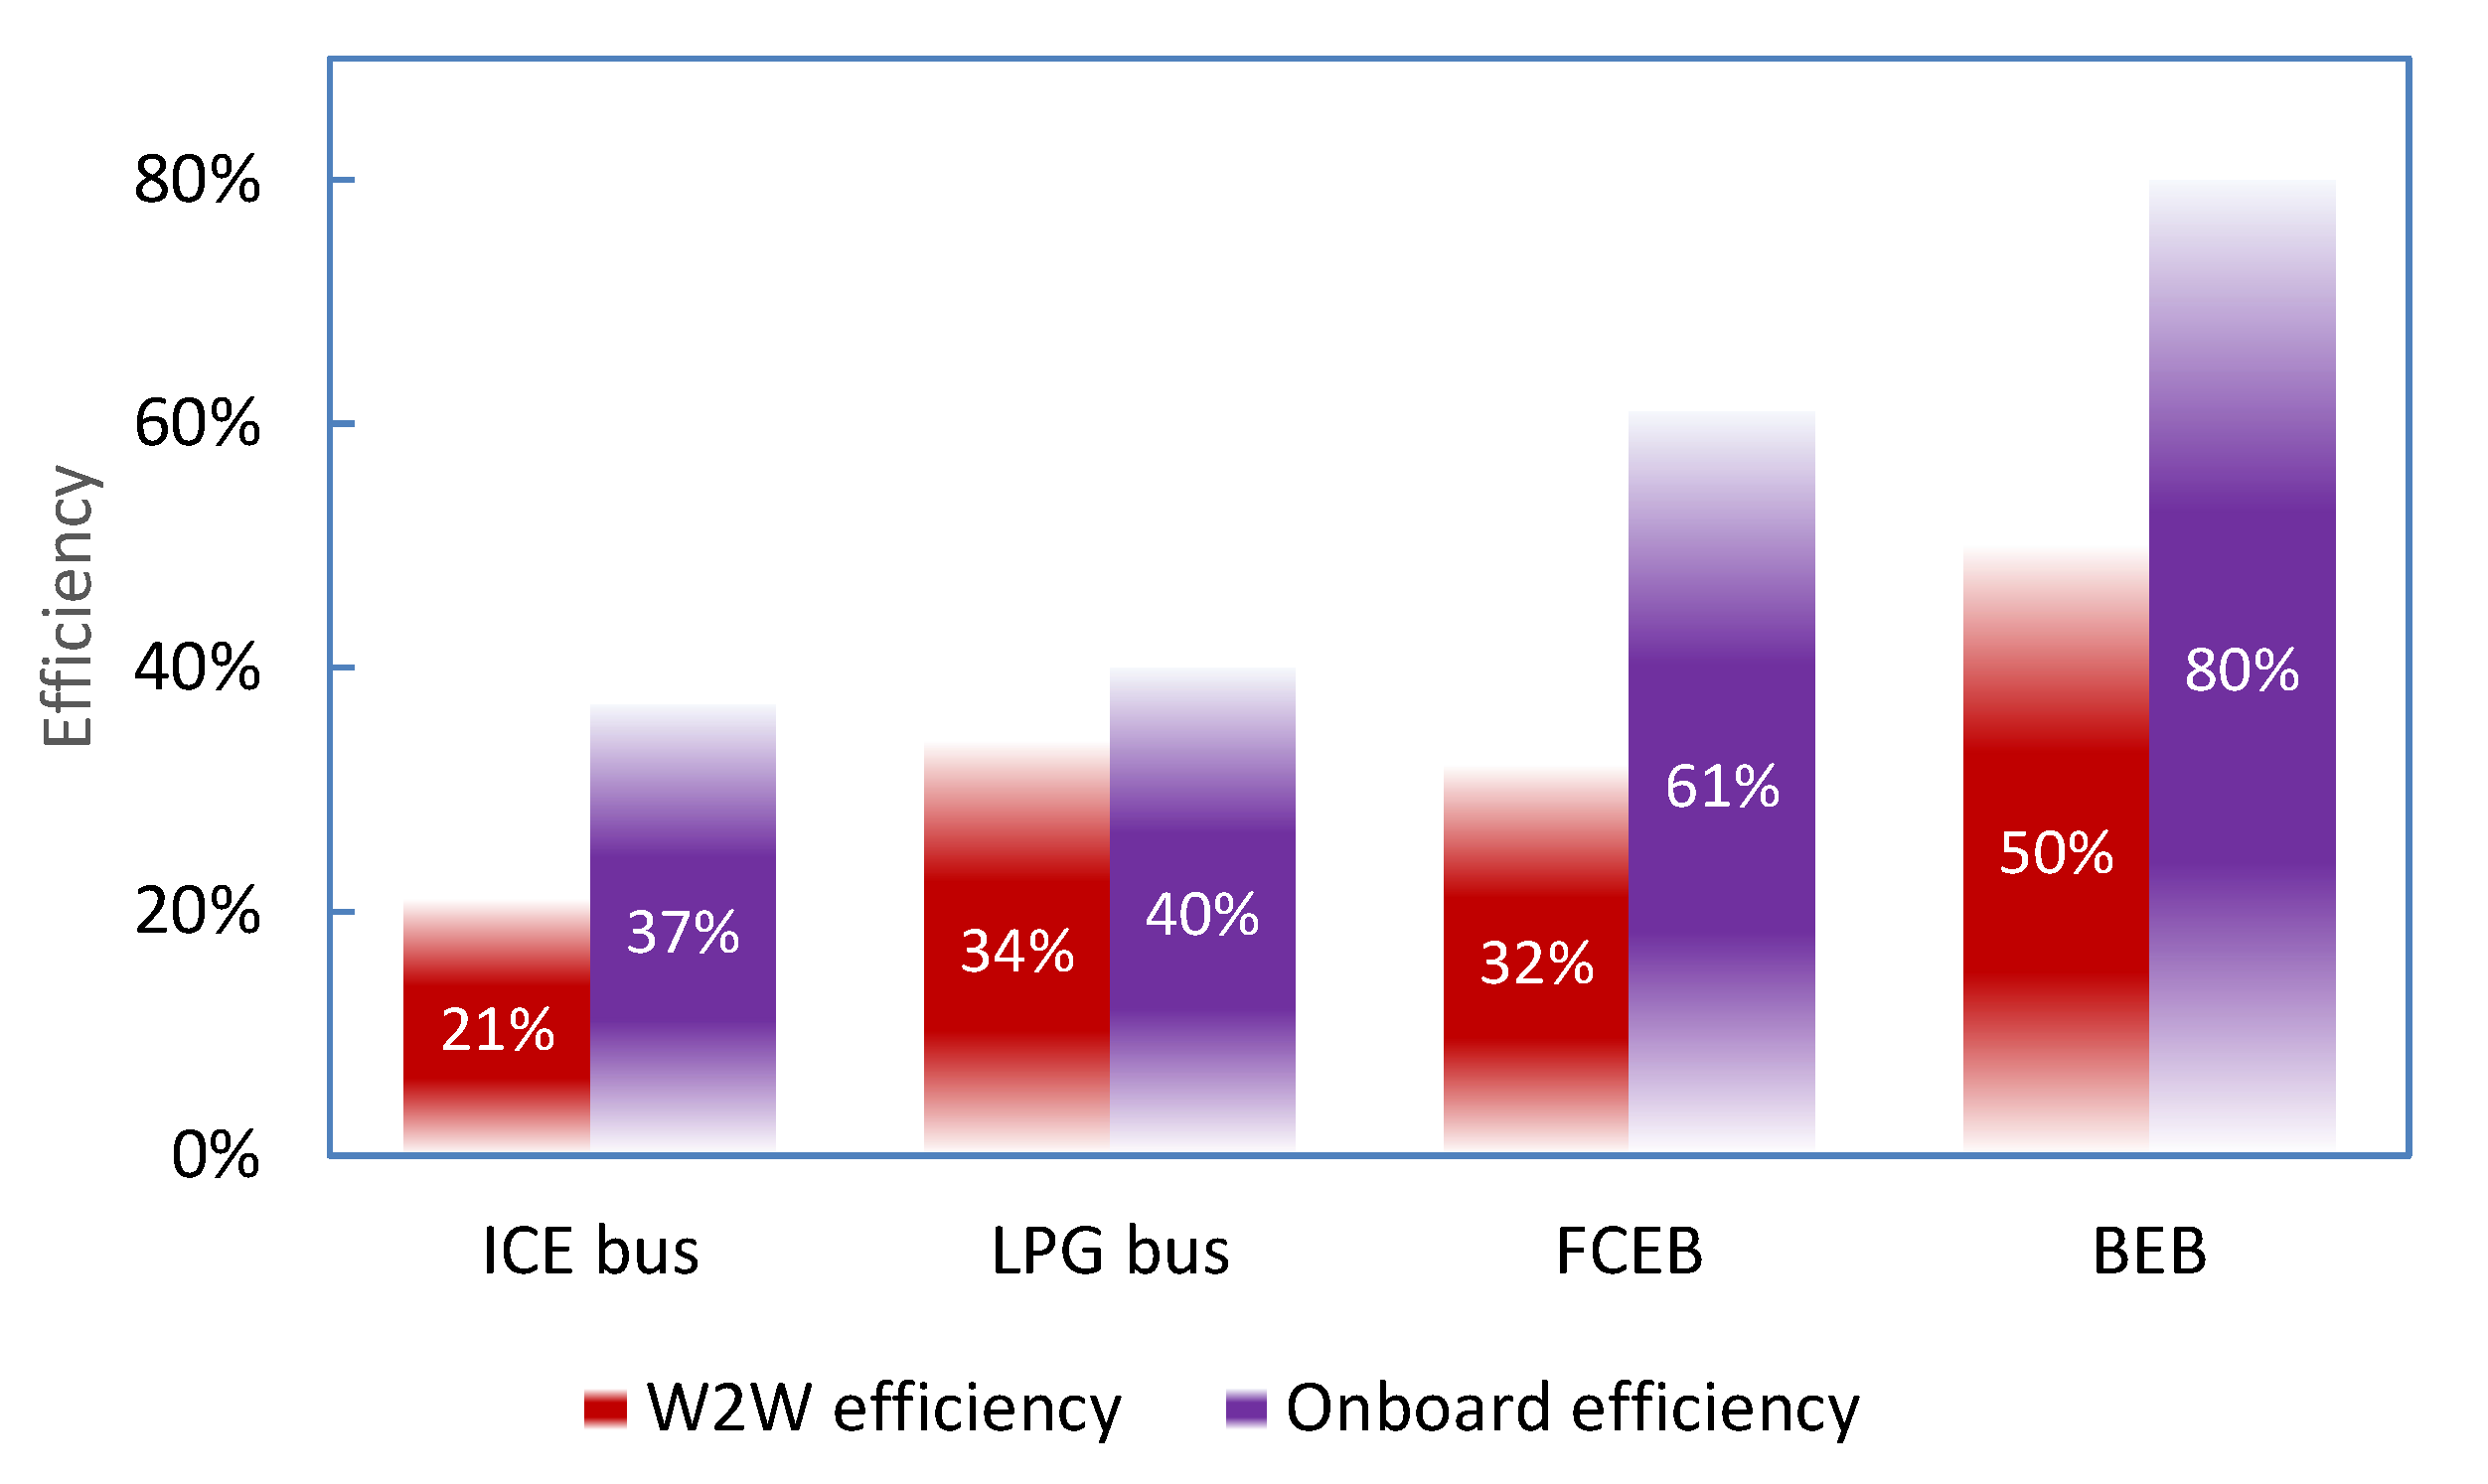
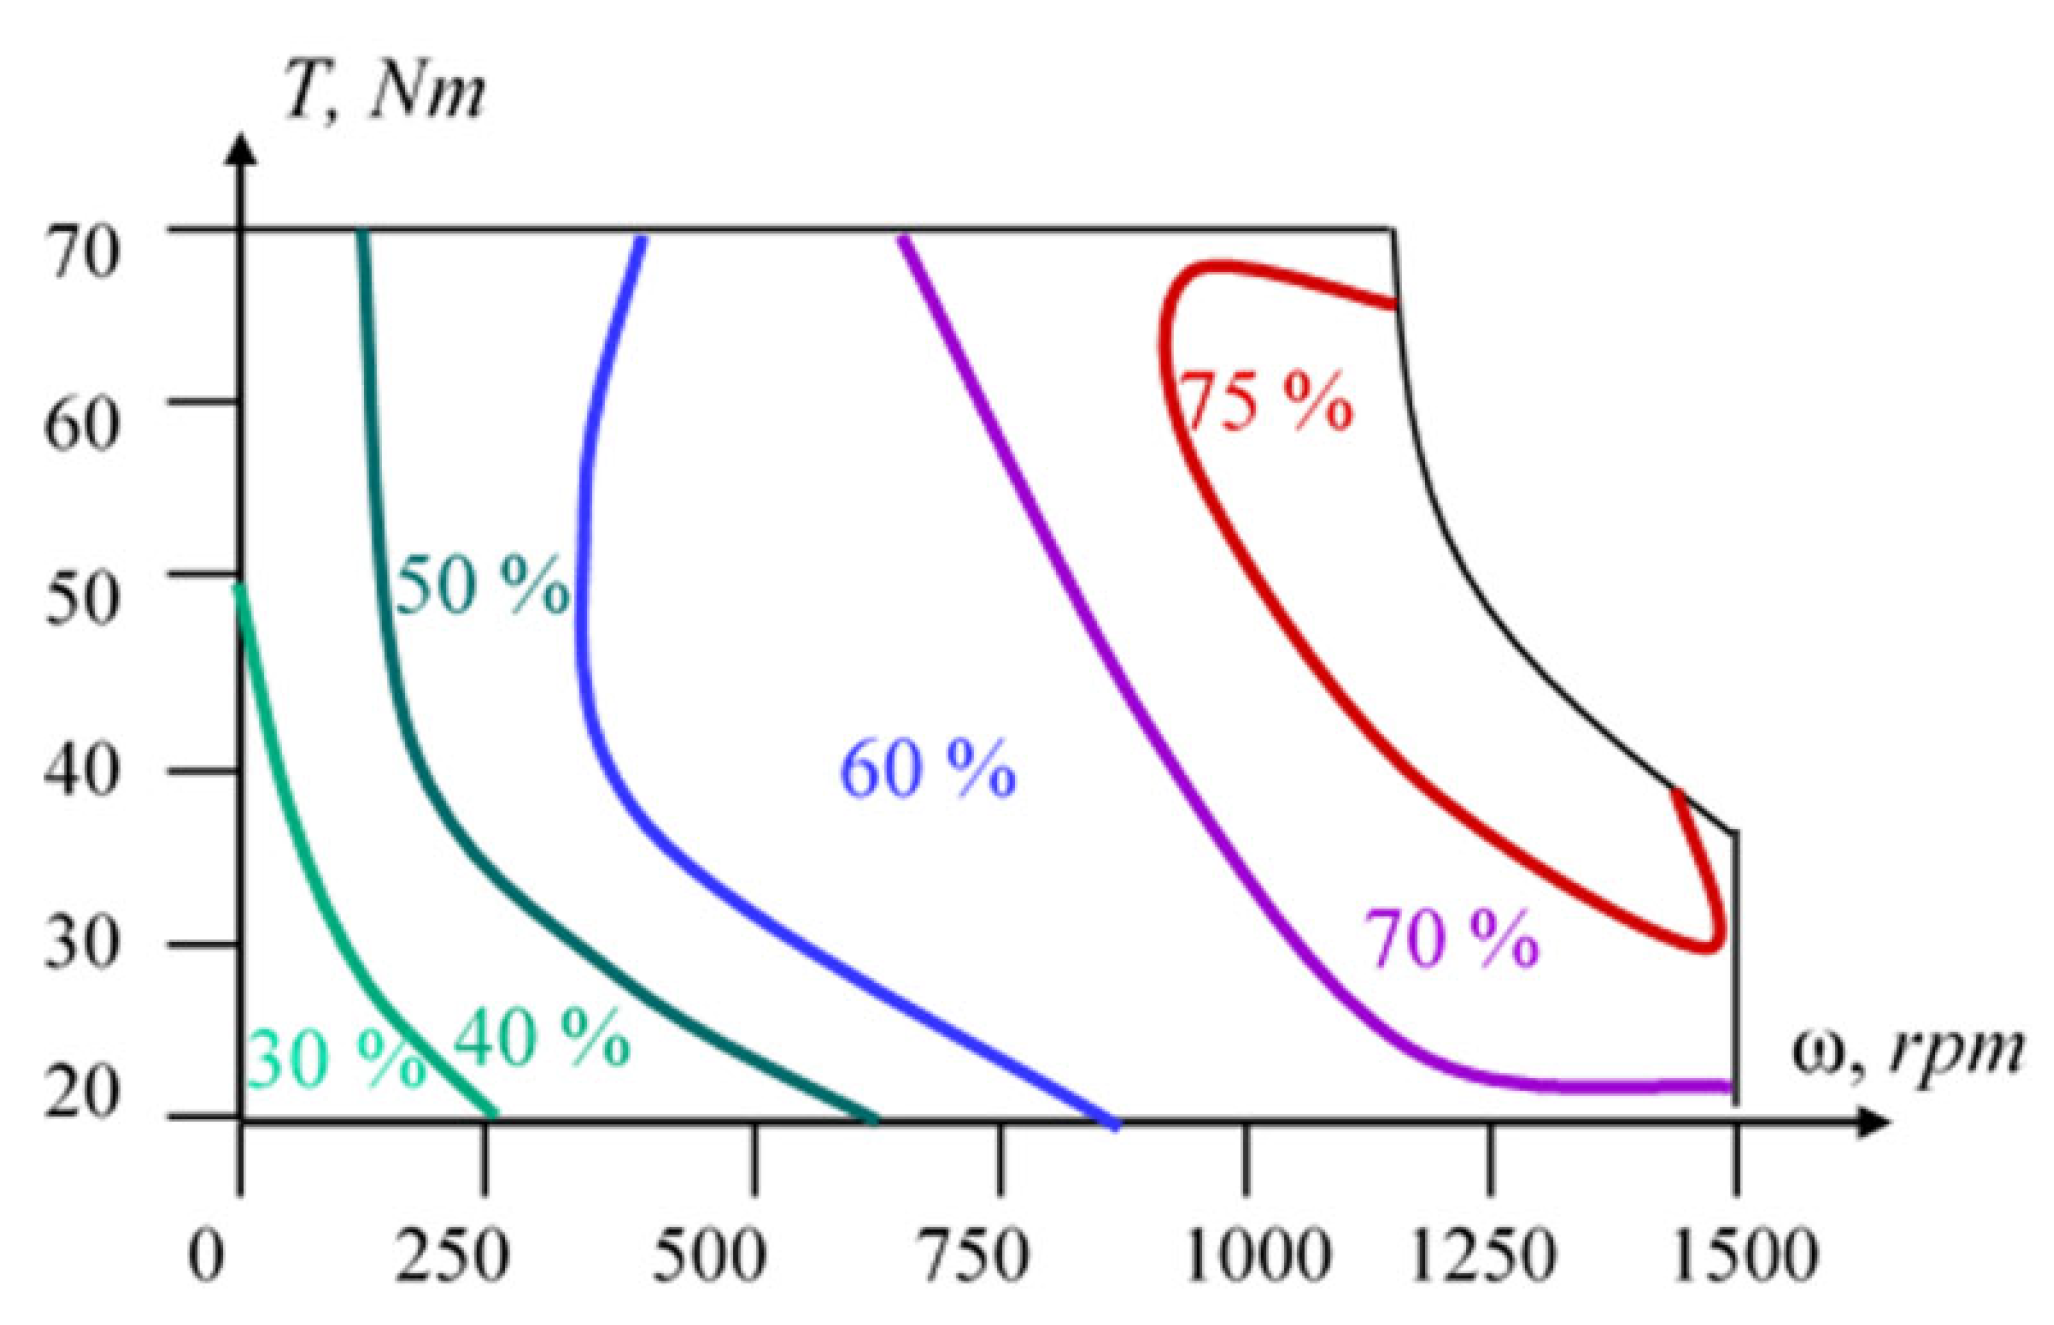
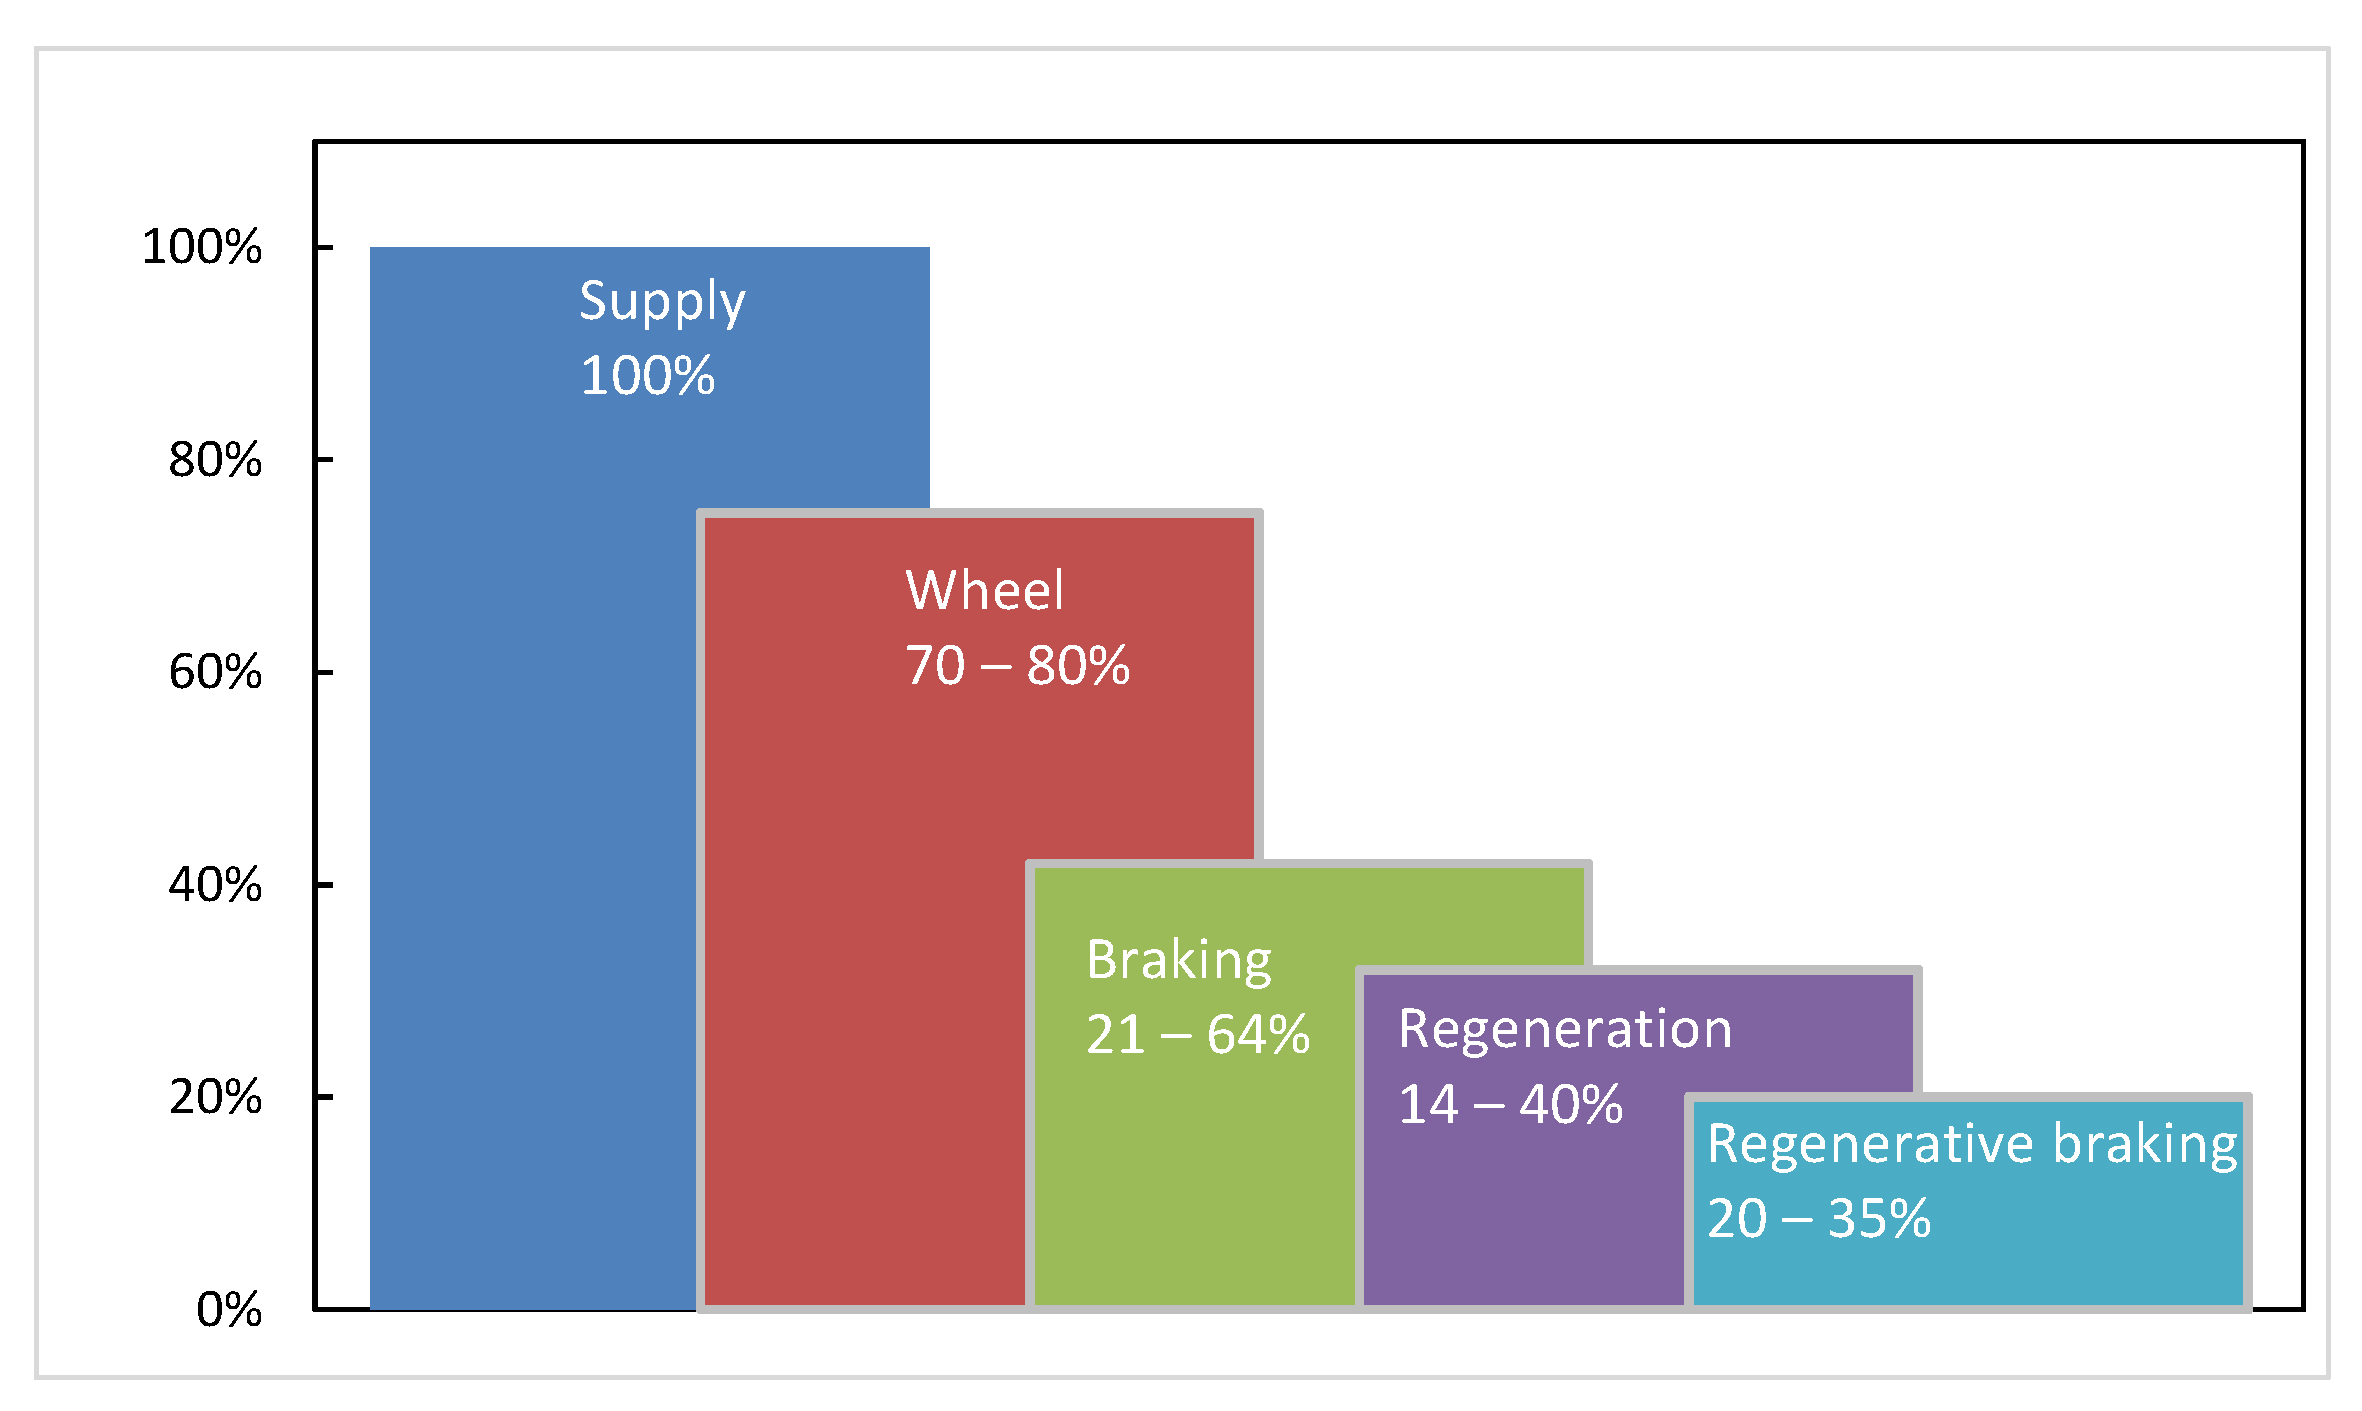
2.2. Efficiency Issues

Pollution originates from unused energy losses that, instead of propelling, are released into the environment. Energy saving is the main way to decrease losses. Therefore, energy efficiency is a very important factor when choosing the bus propulsion system.
Energy efficiency is the ratio between the energy available to wheels and the supply energy. In [61,62,63], efficiency is defined as the useful fraction of total final energy consumption representing the propulsion energy without losses following production, transformation, storage, energy sector own-use, delivery, and distribution. In other words, efficiency η is the propulsion energy E (i.e., useful energy) divided by the same propulsion energy plus all the energy losses δ occurred up to the primary energy source:
η = E/(E + δ) × 100%
For example, in 2021, in the USA transportation sector, this parameter was estimated as 26.9% of the total amount of energy generated in the country. Only about approximately 1/5 of this energy was directly used to propel vehicles, while the remaining 4/5 were wasted. At that time, the amount of total usable energy in the USA was 31.8%. This means that the efficiency of the transport sector is less than the overall efficiency of the overall power generation efficiency in the USA [22].
To propel the vehicle, friction and aerodynamics must be overcome; it is necessary to overcome friction and aerodynamics, which, in the case of ICE-powered vehicles, is accompanied by an emission from the exhaust pipe. Fuel production and distribution also lead to emissions. To obtain gasoline, for example, oil extraction from the ground is followed by its delivery to an oil refinery, oil refining into gasoline, and delivery of gasoline to a service station. Each of these steps is accompanied by energy losses. EVs do not fume while driving, but they also need to overcome friction and produce heat, vapor, dust, solid fractions from tire wear, etc., and a large amount of emissions is generated during the production and distribution of electricity used to charge EVs.
The integral efficiency of the complete fuel lifecycle is often referred to as W2W efficiency [64]. It is inversely proportional to the losses occurring in the overall fueling system, including its generation, delivery, storage, processing, and disposal. Mathematically, energy efficiency is equal to the product of efficiencies of all energy conversion stages given that they are developed as in-series processes. Since it is quite difficult to evaluate the W2W efficiency, the efficiencies of the separate segments in this chain are usually discussed, such as engine efficiency, FC efficiency, drive efficiency, altogether originating the onboard (tank-to-wheel [62]) efficiency, etc.
In particular, the average refining process for gasoline is around 85% efficient [65]. The efficiency of gas and steam turbines exceeds 70% [66]. The theoretical maximal efficiency of a wind turbine is 59.4% [61]. A typical solar farm has about 10% efficiency, but after interconnecting it with a wind farm, their total loading will grow, which will lead to an increase in efficiency. This scale is expanding annually and is considered the most promising since photovoltaic and onshore wind energy is reaching 2–3 cents/kWh in an increasing number of places [67].
The efficiency of hydrogen production of electric power obtained from renewable energy sources is 50–60% for small units and about 65–70% for larger installations [20]. An average electrolyzer works about 10% of the time or less with 50 to 79% efficiency dependently of the degree of loading [68]. Generally, the higher the system load factor, the cheaper the cost of hydrogen. Additional energy losses occur during the compression of hydrogen (efficiency of hydrogen liquefaction is about 90% in accordance with [20,58]). Another problem is that hydrogen is difficult to store because it easily leaks out. Moreover, the pipelines usually have much more losses [69] than electricity transmission grids, the efficiency of which exceeds 95% [70].
After transition from W2W to the tank-to-wheel level, the authors of [37] quantify the efficiency of ICEs as 30–35%. Following [26,71], the efficiency of ICE is between 20 and 30%, but 16–37% in [62]. In [72], the ICE-driven vehicles are called 10–16% efficient. The authors of [37] estimate the efficiency of gas engines as 38–40% in a wide range of driving modes, whereas in [71] this efficiency is rated as 27%.
In [26], it was revealed that EVs are characterized by having twice-higher efficiency than ICE-fed vehicles. The efficiency of the propulsion electrical drives is usually about 70–80%, including the efficiency of an average EM of 75–90% and the efficiency of a power converter of 90–95% [62,73]. In [20], the efficiency of the battery-fed electrical drive is evaluated as 80%.
The authors [4,58] quantify the FC efficiency as 60–65% at peak power. In turn, in accordance with [74], the FC efficiency is counted as 51%, which is higher than that of a gas turbine and ICE. However, when comparing different types of vehicles, the efficiency of the FCEV is evaluated between 25 and 38% in [42,72], though it still exceeds that of the ICE-driven vehicles. A similar estimation can be found in [4], where it is emphasized that the efficiency of FCEVs is 16–26%, which is 60–70% higher than that of ICE vehicles. On average, replacing the ICE with an FC system could save at least 60% of onboard energy consumption [26,71]. In contrast, according to [16,20], FCEBs are less efficient than BEBs, and in some extreme cases they may even be less efficient than ordinary vehicles with gasoline or diesel engines.
Regarding BEBs as compared with FCEBs, the authors of [67] promise higher efficiency from the former, since they offer the potential for up to 75% energy savings compared to FCEBs in the same applications. A study conducted at Stanford University and the Technical University of Munich in 2016 revealed that, even assuming local hydrogen production, investing in BEBs is the most economical choice due to their higher energy efficiency [75].
In addition to the efficiency, several authors are referring to other parameters aiming to estimate vehicle effectiveness. In transport, mileage is often used, that is, the distance that a car overcomes at a given amount of fuel, usually km/kg, or liter/100 km, or kWh/km [12]. The authors [62], having collected a complete set of data from 428 EVs, found the average energy consumption of BEBs starts at 0.4 kWh/km. On the other hand, an estimation of [23] has resulted in average BEB energy consumption of 0.8 kWh/km at operations in a normal mode with 20 °C, low traffic, and a skilled driver, but the same BEB operating in winter, at −10 °C, with electric heating turned on, has reached a consumption of 2.5 kWh/km.
Hydrogen is a great energy carrier in relation to weight. The energy value of hydrogen is between 30 and 50 kWh/kg [42]. Since the volumetric energy density of gasoline and diesel fuel are near 8.8 and 10 kWh/liter, respectively, they contain only 12–13 kWh/kg [76]. Since the volumetric energy density of liquid hydrogen is about 20% of the volumetric energy density of gasoline, hydrogen liquefaction requires about 12 kWh/kg of additional energy, which is equivalent to 20–40% of the useful energy contained in 1 kg of H2 [77].
The study in [67] revealed that an average FCEB consumes 2.4 times more energy than an average BEB. An analysis published in “Green Car Reports” shows that the FCEVs consume even three times more electricity per kilometer than BEVs [78], and the same can be said about the best FCEVs in Japan. In [42], the amount of energy required to move an FCEB is accepted between 1 and 1.25 kWh/km. In the first projects [49], it was expected than FCEBs will use maximum 15 kg of H2/100 km. Now [79], a typical range of FCEBs is from 4 to 7 kg/100 km.
Figure 7 roughly demonstrates different efficiency estimates of the four types of buses. It is considered that a diesel bus normally consumes 19–24 L per 100 km [80,81] and a bus propelled by LPG consumes 10–15% more, that is, 21–27 L. These data are reasonable for high-density traffic in urban areas, but surely not for long-mileage cruises.

2.3. Diversity of Efficiency

It is noteworthy that efficiency is a variable value, which changes depending on driving modes, degree of consumption, loading level, and environmental conditions [62,80].
The average efficiencies discussed above were mainly focused on the propelling in some standard driving conditions. At the same time, city driving is characterized by the modes of random accelerations and braking, stopping, and overtaking. Herewith, the efficiency itself changes in a way similar to that shown in Figure 8 for EMs [82].
Propulsion efficiency grows as the degree of loading increases, demonstrating a maximum that is more pronounced for EMs at upper speeds. Higher transmission ratio also has a positive effect on efficiency: it increases as the power unit rotational speed decreases. Less efficiency is achieved with overload and low-speed conditions, so the lowest values are typical for idling and slow operation. It means that in the case of slow city driving, the losses are much higher than in the case of fast-speed bus travel on highways.
Variable losses are also associated with power converters and driven wheels [82]. As for losses related to the so-called “well-to-tank” chain, there are also many examples of changing efficiency.
A very effective way to utilize the excess mechanical energy of the engine is to convert kinetic energy into electrical energy and feed it back to the battery power source by means of regenerative braking. This approach differs from conventional braking, in which excess kinetic energy is converted into heat and released into the environment. The advantages of regenerative braking compared to traditional braking are energy saving, reduced tire wear, and fuel economy [49,83].
Traditionally, there are some practical limitations on how much and how quickly regenerative braking can be applied, since it is impossible to completely recover energy. The amount of regenerative energy depends on many factors, such as the deceleration rate of the engine and the receptiveness of the energy storage system. A review of numerous sources in the literature has led to a diagram of the typical distribution of braking energy [83] presented in Figure 9.
Regarding the previously evaluated efficiency of an electrical drive, the amount of energy returned to the supply at regenerative braking is between 20 and 35%. At the same time, it was reported in [84] that the return of braking energy in typical urban areas can be increased much more, and can potentially reach 80% in large cities with intensive traffic and deceleration regimes.

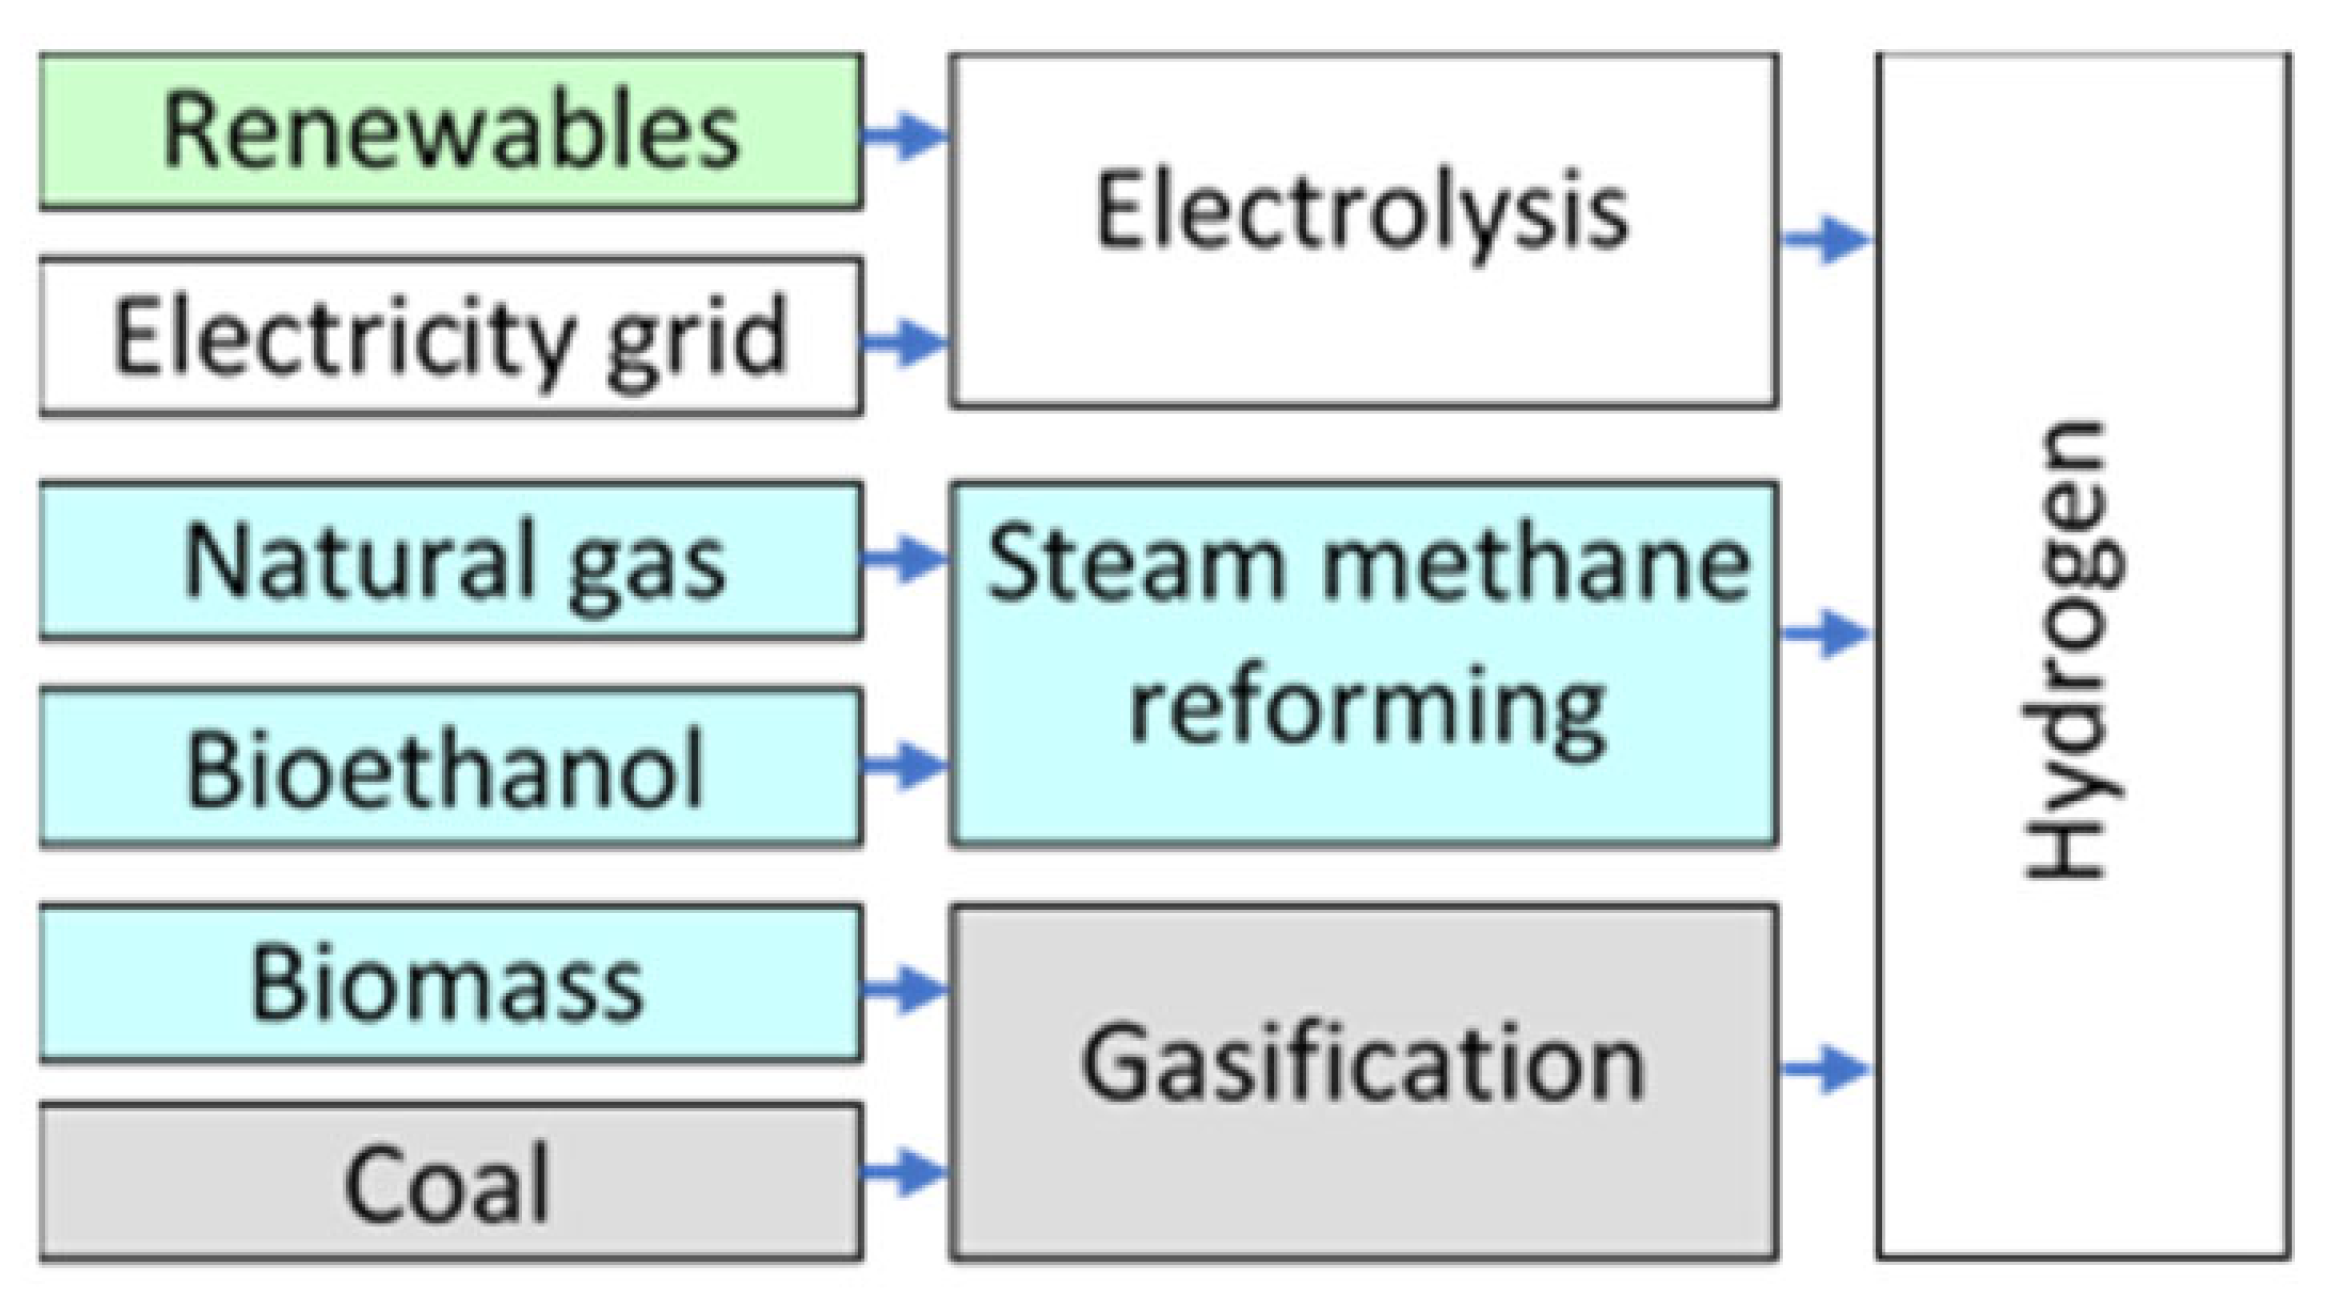
3. Advancing the Hydrogen Production Technologies

3.1. Engagement in Hydrogen

Both the global and the EC strategies consider hydrogen as one of the key fuels of the future. In the transport sector, the competitiveness of hydrogen compared to other fuels depends on the degree pollutions in the entire W2W chain, from fuel production to consumption, so the priority is to reduce pollutions [85,86]. Although the hydrogen-powered FCEB emits few pollutants, producing mainly water and heat, the overall W2W chain is associated with creation of a great amount of pollutants in the non-driving stages. This is because the largest number of problems hindering the introduction of FCs in the transport sector is not related to onboard equipment, but to the hydrogen manufacturing, storage, and delivery [26].
From 1980 to 2018, the use of hydrogen has tripled [67]. In 2018, the worldwide hydrogen production was valued at over 110 billion euros and its use was amounted to 225 thousand units installed [67]. Nevertheless, hydrogen still makes up a modest fraction of both the global and the EU energy balances, accounting for less than 2% in energy consumption. Simple estimates show that it means roughly 3000 TWh/year or near 70 Mt of hydrogen from electrolysis and from hydrocarbons reforming worldwide [85].
The global hydrogen production is expected to grow over 5% annually through 2028 [87]. However, in order for hydrogen to reduce the pollution of the planet, it must reach a much broader scale. The EU has set a goal to produce up to 1 million cubic meters of industrial hydrogen by 2025 and 10 million cubic meters by 2030. These 10 million will comprise a fairly small share of Europe’s total energy consumption. Herewith, by 2050 hydrogen should already account for more than 60% of seasonal energy storage needs [39].
In [74], calculations of worldwide prices are given for hydrogen and other fuel sources from 2017 to 2050. In 2019, the cost of hydrogen, including its manufacturing, distribution, storage, and delivery was estimated from 1.5 to 10 €/kg. This cost depends on whether the production is centralized or decentralized, as well as on the market segment and many other factors. In comparison with gasoline, the hydrogen cost per kilometer was up to three times greater [44].
To decrease the cost, it is convenient to produce hydrogen in places most closely located to the corresponding energy resources [88]. For example, in [89] a situation was considered in which a bus with an ICE costs to the fleet about 0.6 €/km for fueling and maintenance. The BC Transit Company from Vancouver had to spend twice as much on FCEB, about 1.3 €/km, because Vancouver does not have its own supplier of hydrogen fuel and hydrogen was delivered by diesel trucks from Quebec located 4800 km away. This not only doubled operating costs, but also reduced the benefits of the using the “zero-emitting” FCEBs in the first place. As a result, three FCEBs were deactivated and returned back to the Ballard Company producing these FCEBs, and the others were converted to ICE electric hybrids and eventually discarded.
At the same time, hydrogen can be obtained as a by-product in specific energy-intensive industrial processes. It leads to the creation of new jobs and potentially has a multiplier effect, at which hydrogen can be used in combination with other resources (such as ammonia fabrication, iron release, methanol elaboration, oil refining and processing of biofuels for hydrocracking, making diesel and biodiesel fuels, synthetic fuels, electronics, etc.) to export goods with higher added value [67]. For example, the steel and cement industries currently account for 15–27% of global CO2 emissions [90,91], as well as dust, ash, soot, and smoke. Obtaining hydrogen as a byproduct of these industries predicts great benefits. According to the calculations of [43], the modernization of heavy industry could reduce greenhouse gas emissions by at least 50–60%, becoming an important contribution to the national economy. Examples are enterprises of this kind in Australia, Chile, Norway, Morocco, China, etc. [92].
Hydrogen manufacturing concentrated at centralized large enterprises commonly reduces the cost of production, but requires additional costs for storage and delivery to HRSs.
Given the estimates of [74], the cost of hydrogen storage and distribution ranges from 30 to 170% of the fabrication cost. The authors of [67] promise that the demand for storage of high volumes of solar and wind energy should increase significantly by 2050 compared to today, and hydrogen should help meet this requirement.
Logistics of imported hydrogen accounts for 30–40% of the total cost of its delivery [67], which ranged from 0.2 to 3.4 €/kg in 2019 [74]. In the case of delivery, significant losses are added to the logistics chain, which can multiply the need for electricity for hydrogen supplies.
Analysis of [9] presumes that over the next decade, the cost of the entire hydrogen manufacturing cycle should decrease by about 60%, and by about 70% if only distribution and retail are taken into account.
The following projects look prospective around the hydrogen W2W costs reduction [67,93,94]:
  • improving the efficiency of the hydrogen fuel chain and search for options to decrease losses;
  • estimation of the potential for reducing greenhouse gas emission in the hydrogen production;
  • solving the problem of transferring pipeline systems from natural gas to hydrogen;
  • assessment of the possibilities for using the best available renewable resources outside the country;
  • assessment of the socio-economic consequences of the hydrogen economy.

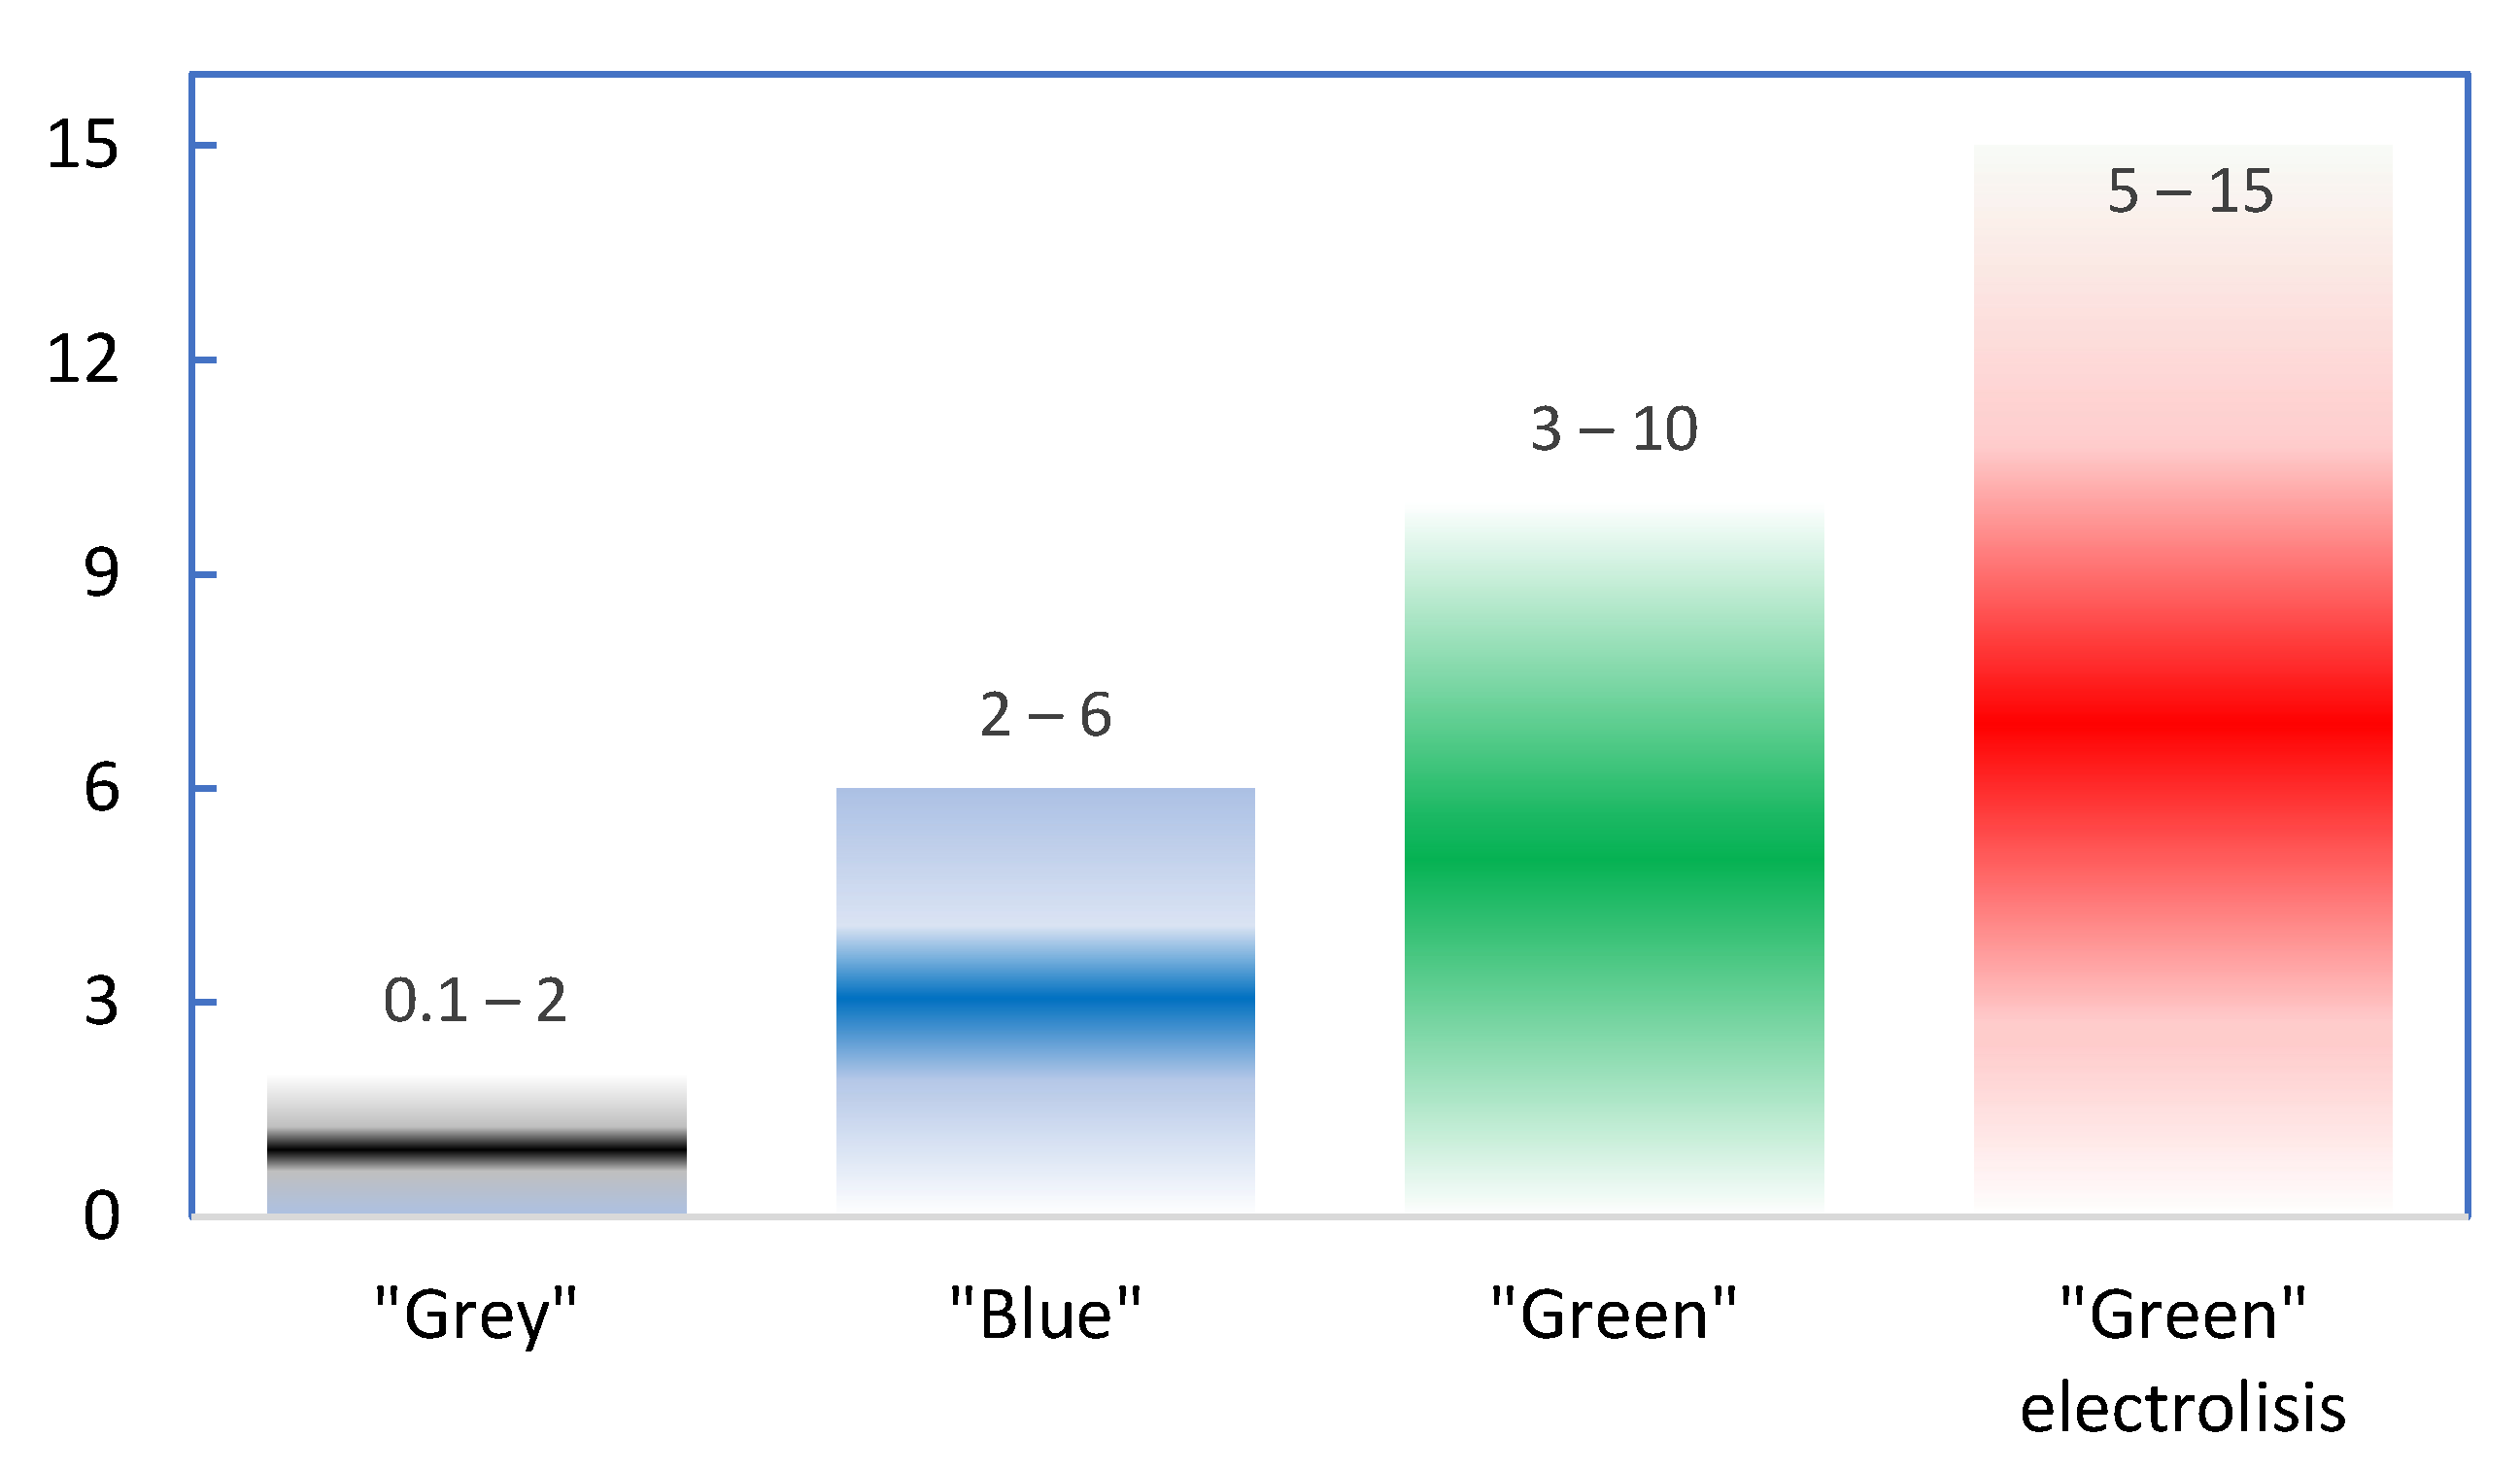
3.2. Leaving behind Fossil Fuels

Hydrogen is absent on earth in its pure form, and must be extracted from other compounds using various approaches. A wide range of fuels can produce hydrogen, including renewable energy, nuclear energy, natural gas, coal, and oil. It can be transported via pipelines or on ships in liquid form. It can be converted into electricity and methane.
There are various options for generating hydrogen from both non-renewable and renewable energy sources (Figure 10).
Currently, there are many methods of industrial hydrogen generation from water, garbage, ethanol, metallurgical slag, biomass, etc. Such methods include electrolysis, steam conversion of methane and natural gas, coal gasification, pyrolysis, partial oxidation, biotechnology, and others. A variety of methods is one of the main advantages of the hydrogen supply since it increases energy security and reduces dependence on certain types of raw materials [95].
Most of the global industrially manufactured hydrogen (80% according to estimates of [6]) is made from fossil fuels, including natural gas and nuclear energy. Depending on the fabrication method and the carbon footprint, that is, the amount of harmful emissions, hydrogen from fossil fuels is distinguished with color gradation as hydrogen produced without CO2 capture (“grey” hydrogen), hydrogen from atomic energy (“yellow” hydrogen), and hydrogen from natural gas and fossil fuels produced with CO2 accumulation in special storage facilities (CCU, “blue” hydrogen) [95].
Hydrogen from fossil fuels is still largely obtained with harmful emissions entering the atmosphere. While manufacturing, about 830 to 900 Mt of CO2 are emitted annually in the world [2,48]. This means almost 4% of the total global CO2 emissions. Hydrogen production in EU using this method is associated with 70 to 100 Mt of annual emission of CO2 [1,87].
Its vast majority (96% according to [87]) is obtained without CO2 capture (“grey” hydrogen). Hydrogen generation for hydrocracking, used in the manufacturing of gasoline, produces approximately 10% of greenhouse gas emissions [2,96], which is equivalent to CO2 emission in the UK and Indonesia combined [85,86]. Hydrogen produced by steam reforming of methane has an emission factor of about 285 g CO2/kWh (9.5 kg CO2/kg H2), and when coal is gasified, the emission factor grows to about 675 g CO2/kWh [67]. At that, the amount of hydrogen produced should be calculated, taking into account its losses at transportation, storage, and liquefaction. Moreover, according to the Ford Motor Company, this “grey” hydrogen includes 40% other pollutants besides 60% CO2 [96].
In addition to the inefficient conversion of fossil fuels into a usable form of resources, the common disadvantages of “grey” technologies include political instability in countries rich in fossil fuels and some other variable factors; therefore, costs of “grey” hydrogen oscillates between 0.1 to 2€/kg [97] (Figure 11).
Another option is “blue” hydrogen based on natural gas storage and on fossil fuels with carbon capture. According to [1,60], the main limiting factors for the utilization of “blue” hydrogen in public transport are higher investment expenses than in the case of direct use of fossil fuels in ICE. These expenses include both operations and additional investments towards hydrogen-based equipment, storage, and facilities. Moreover, the possible impact of risks in the supply chains and uncertainty in the market are amplified due to high margins on final products in the global competition. In 2020, the estimated costs for “blue” hydrogen were from 2 €/kg [1] to 6 €/kg H2 and higher [97]. Now, it highly depends on the current natural gas prices.
Criticism is often related to the high intensity of carbon emissions when hydrogen is released from fossil fuels. In addition, such problems await their solutions as the burden of capital costs, low energy content per unit volume in environmental conditions, and investments in the hydrogen manufacturing and compression, along with the creation of infrastructure for hydrogen distribution, delivery to HRSs, and limited capacity to produce or generate it in the bus-operated territories.

3.3. Time for Renewable Hydrogen

The most prospective option is the implementation of the “green” hydrogen technology. The future of cleaner energy requires an increase in the supply of hydrogen from renewable resources [2]. Renewables can replenish themselves, thereby replacing the part depleted at consumption, for a finite period of time on a human timescale, in contrast to fossil fuels that are being consumed at a much faster rate than they are replenished. Transition from the “grey” and “blue” technologies to renewable hydrogen leads to achieving the goal of climate neutrality and “zero emission” in the long term, being the most consistent with an integrated energy system. Climate neutrality refers to the idea of achieving net zero greenhouse gas emissions by balancing these emissions so that they are equal to (or less than) the emissions that are removed by the natural absorption of the planet.
Environmentally friendly renewable hydrogen is an energy carrier obtained either using an electrolyser from water by electrolysis (red bar in Figure 11) or from renewable energy sources by gasification of the renewable feedstocks, as well as from hydro, tidal, wave, wind, or solar resources (green bar in Figure 11). Biofuels (biomass and biogas) and waste are also considered renewable energy sources [12], though they are not environmentally friendly.
In most cases, renewable hydrogen sources are economically unprofitable, and its cost estimated in [1,97] oscillates from 2.5 to 15 €/kg.
High installation and storage costs, dependence on weather, and climate are the main barriers for expanding the use of renewables. In most cases, renewable sources are located far enough away from the consumer. In several regions, some of them are completely inaccessible, while in others delivery costs are high. The uncertainty in the energy production capacity of variable renewables aggravates the problem.
Today, the share of renewable energy sources in global energy consumption is about 12%, and about 20% of the electric power generation sector [85,86]. It is planned to grow to 25% by 2035 and to 40–50% by 2050. It is also expected that renewable energy sources will occupy an important place, accounting for more than 60% of the newly installed capacities [12].
Several production plants to produce up to one million tons of “green” hydrogen are designed for the next years. On the way to 2050, renewable hydrogen should be gradually introduced on a large scale along with opening new renewable energy sources as technology is developed and manufacturing costs decrease. According to [1], by 2030 renewable hydrogen will become economically competitive compared to other forms of hydrogen production. Analyses of [85,86] indicate that the cost of hydrogen from renewables may fall by 30% by this time. The priority for the EU is to develop renewable hydrogen, produced using mainly wind and solar energy. The cost of renewable hydrogen in this area is rapidly declining. The cheapest wind power and solar projects can now offer hydrogen at a price comparable to the cost of hydrogen released from several fossil fuels. Already, some renewable energy resources have become competitive with natural gas. The authors of [67] show that hydrogen from low-cost wind and solar photovoltaic projects will achieve competitiveness with fossil fuels by 2025–2028.
Setting quotas for CO2 emission from fossil fuels further increases the competitiveness of “green” hydrogen. From 2030 to 2050, renewable hydrogen technologies should reach maturity and be implemented on a large scale to cover all sectors that are difficult to decarbonize and where other alternatives may not be feasible or have higher costs. This is an ambitious plan, given that there are no global examples yet of large-scale “green” hydrogen production [96]. Elaboration of a large volume of hydrogen from renewable energy sources, in combination with hydrogen storage, should contribute to ensuring long-term seasonal flexibility. Researchers from [67] consider seasonal storage of renewable electricity, and primarily hydrogen, to be an especially promising direction after 2030.
Since the FC technology offers many advantages when the fuel is hydrogen from renewable sources, multiple global and national policies promote the application of renewables in road transport, including measures to directly support the use of biofuel and “green” electricity in FCEBs and encourage the introduction of “zero-emitting” vehicles [12].
The transport sector, including FCs, HRSs, and electrolysers, will just benefit from the transition from experimental to mass production. Considering that transport remains the sector with the lowest share of renewable energy sources, the European Chemicals Agency aims to introduce “green” hydrogen technologies to transport by combining renewable and “zero-emitting” hydrogen offering. As a result, as follows from [31], the share of “green” hydrogen should increase to 13–14% by 2050.

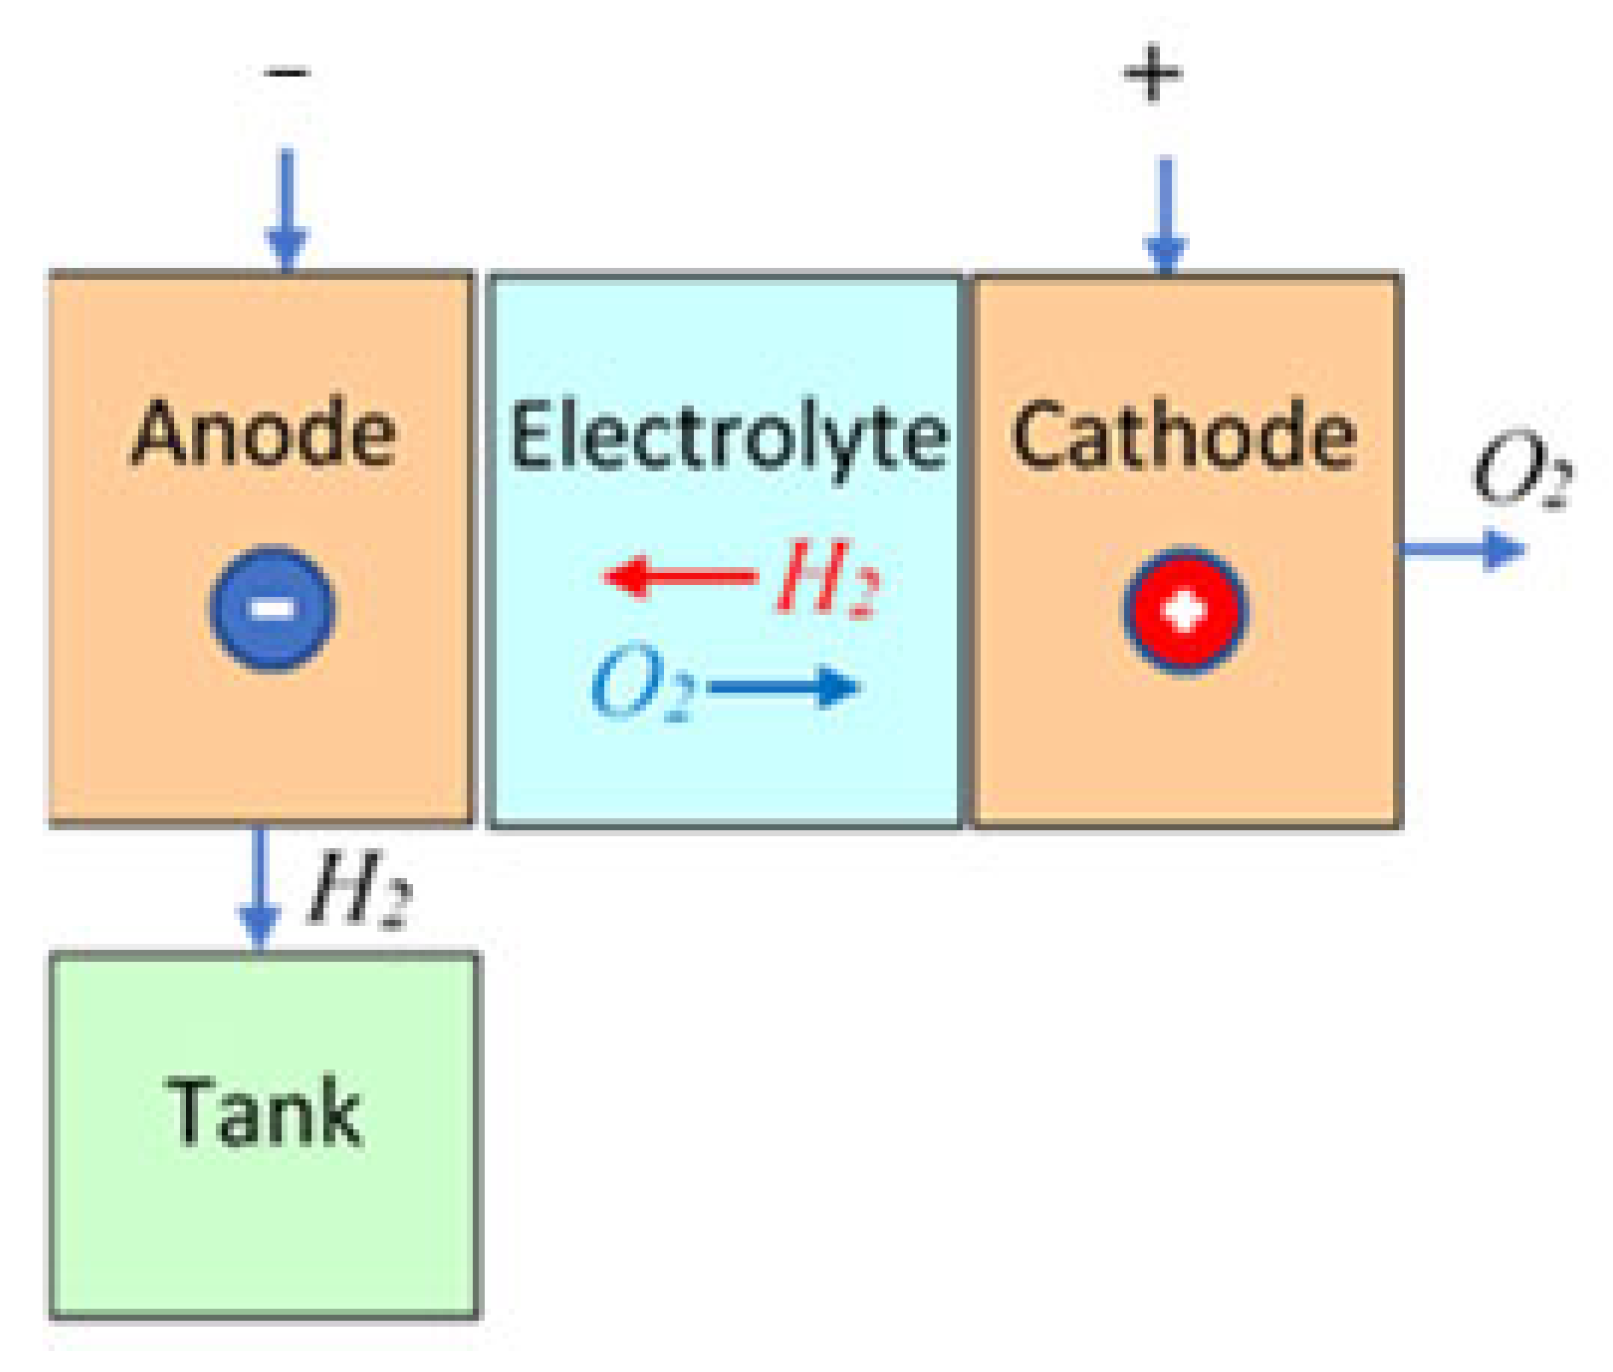
3.4. Challenges and Prospects of Electrolysis

An optimal way is to manufacture hydrogen by direct electrolysis of water by electricity, especially because electricity is easier to deliver to the consumer by wires than hydrogen by pipes.
Electrolyzers are the devices that split water into hydrogen and oxygen, thus issuing hydrogen electrically from water as outlined in Figure 12. Here, a DC voltage source is connected to the negative anode and positive cathode of the electrolyser. Upon the voltage between anode and cathode, a water electrolyte solution is splitting into positively charged hydrogen ions and negatively charged oxygen ions. The former are attracted to the anode and recombine in pairs to form hydrogen. Likewise, the negative oxygen ions are drawn to the cathode and form oxygen there.
In this way, the HRSs can manufacture hydrogen in urban areas. It is noteworthy that hydrogen generation in HRSs is an energy-intensive process, which makes the hydrogen too expensive (10–15 €/kg H2 [97]) and leaves negative the overall balance of energy consumption of this alternative fuel. Hydrogen prices for consumers largely depend on how many HRSs there are, how often they are used, and how much hydrogen is delivered daily. It is probably impossible to manufacture a significant amount of hydrogen using exceptionally cheap or even free water if the electrolysers work about 10% of the time or less. Given this level of use, produced hydrogen turns out to be uncompetitive. To reduce the cost of hydrogen generation from water, electrolyzers must have a much higher utilization factor, which, in turn, is incompatible with the sharply increasing demand for electricity. In this connection, the need to find a balance between buying electricity during periods of low prices and increasing use of electrolyzers is discussed in the literature [95].
As follows from [6,98], the global electricity generation now overcomes 27,000 TWh/year at the total world electricity installed capacity above 7 TW. However, 35% of this capacity come from coal, 23% from natural gas, 11% from nuclear, and 4% from oil. Just 16% come from hydro resources, 5% from wind, 3% from solar stations, 2% from biomass and waste, and 1% from other renewables. In 2020, 20% of 3700 TWh electricity in the USA [99] and 38% of 2664 TWh electricity in the EU [100] were obtained from renewables, and in the EU it was the first time when renewables overtook fossil fuels and became the primary source of electricity [101]. Nevertheless, renewable electricity satisfies as few as 0.3% of total hydrogen needs [12] whereas biofuels continue to make the largest contribution from renewable energy sources to the road transport sector.
Hydrogen is obtained from both the regional and the local HRSs. Those locations follow a careful analysis of the demands for the fleet and other requirements of FCEBs and heavy-duty vehicles [67] because any interruption at a hydrogen supply can shut down multiple consumers [102]. There are various concepts of refueling infrastructure that are suitable for different levels of hydrogen demand, from refueling a single FCEB to large filling stations capable of refueling multiple cars and FCEBs daily [40]. The regional HRSs are equipped with powerful electrolyzers whereas the local HRSs can be either also equipped with the own electrolyzers or acquire hydrogen from the regional HRSs aiming only to share it in situ among fueling FCEBs with extremely low emissions [18]. Generated hydrogen is compressed and stored ready for dosing until needed. Many HRSs have a distribution system that allows multiple buses to be used for simultaneous hydrogen refueling. Each refueling in HRS takes 5 to 12 min, which is much faster than BEBs overnight charging.
As an example, the first commercial HRS of the Nation-Energy Company in Yunfu (China) can be considered. The daily capacity of this station is 500 kg of hydrogen, and the storage capacity is 665 kg. Refueling the bus with 22 kg H2 takes 5–7 min, while the average consumption per bus is about 12 km/kg H2 [18].
Over the past decade, the costs of electrolyzation have decreased by 60% and the study [1] predicts that by 2030 they will be halved compared to today. With the expected reduction in both the cost of electrolyzers and the cost of electricity from renewable sources in the long term, hydrogen produced from water will become competitive with other forms of hydrogen generation. Higher capacity factors of wind and solar farms are also an important factor in reducing overall costs. Thus, the question is how early this competitiveness will be achieved and to what extent new technologies can accelerate this trend.
The EU has presented a hydrogen strategy, whose goal is to issue a set of powerful electrolyzers. The following projects are progressing in this direction [67,93,94]:
  • assessment of the economic efficiency of seasonal storage and flexibility on the electrolyzers’ demand side;
  • assessment of the potential to reduce the electrolyzers’ cost and their ability to work with a partial load, given the availability of variable power;
  • assessment of possible improvement of the characteristics of various electrolyser designs and their degradation under different operating conditions that affect the cost of hydrogen;
  • assessment of the potential and the rate of reduction of investment costs for the electrolyzers.
According to [12,67], it is expected that by 2030 the installed capacity of all electrolyzers will be about 700 GW and 1700 GW by 2050. With this development, the cost of electrolyzers should be reduced from 840 to 375 €/kW by 2050.

3.5. Future-Oriented Initiatives

In 2011, the International Renewable Energy Agency (IRENA) has been established as the principal platform for international cooperation in promoting the widespread adoption and sustainable use of all forms of renewable energy, including bioenergy, geothermal, hydropower, ocean, solar, and wind energy, in the pursuit of sustainable development, energy access, energy security, and low-carbon economic growth and prosperity [103].
In 2015, a legally binding international treaty on climate change called the “Paris Agreement” was adopted aiming to limit global warming to well below 2, preferably to 1.5 °C, compared to pre-industrial levels [104].
Five years later, the European Clean Hydrogen Alliance was founded as part of the European new industrial strategy [29] with a plan to accelerate the reduction of CO2 emission.
In this connection, the “European Green Deal” project was approved in 2020. Its “Fitfor55 Package” issued by the EC proposes reducing net greenhouse gas emission by at least 55% by 2030 compared to the 1990 level [39]. This strategy must turn Europe into a climate-neutral continent by 2050 through measures in all areas of its economy, including investments in transport electrification [12].
Seeking to promote a more efficient and sustainable transport policy, the EC considers the use of hydrogen in the transport sector in its “Strategy for Sustainable and Reasonable Mobility” announced in the “European Green Deal.” To boost the introduction of new technologies, the Package amends the “Renewable Energy Directive” (RED II) [105] and sets renewable hydrogen quotas for the transport sector by 2030. As a result, all new transport means, including buses, on the European market should become “zero-emitting” from 2035.
In 2020, the world’s largest developers of renewable hydrogen systems joined together to form the “Green Hydrogen Catapult” initiative, aimed at significantly reducing costs to stimulate a faster transition to renewable energy in the most carbon-intensive industries [12].
For the development of low-carbon technologies, a European Innovation Fund with a volume of about 10 billion euros was created [1]. The Fund aims to facilitate the demonstration of innovative hydrogen-based systems and to reduce the risk of large and complex projects and, therefore, offers a unique opportunity to prepare such technologies for large-scale implementation in the period of 2020–2030. The first tender of proposals within the framework of the Fund was announced in 2020.
The goals for 2025 and 2030 set out in the “Regulation on CO2 Emission Standards” [106] are important factors for creating a leading market for hydrogen solutions as soon as the FC technology becomes sufficiently mature and cost-effective. The “Horizon 2020 FCs” and “Hydrogen Joint Venture” (FCH-JU) projects [88] are aimed at accelerating Europe’s technological leadership. In the scope of the FCH-JU joint project, the EU is promoting the “Joint Initiative for Hydrogen Vehicles across Europe” (JIVE and JIVE2) programs that support the introduction of large-scale FCEBs and hydrogen HRSs.
A hydrogen strategy for a climate-neutral Europe has been developed in 2020 [1]. Its most important section is “Promoting research and innovation in the field of hydrogen technologies.” First, as far as hydrogen production is concerned, this entails scaling up to larger, more efficient, and economical gigawatt plants, which, together with fabrication capabilities and new materials, provide hydrogen to large consumers. Second, it is planned to further develop the infrastructure for the distribution, storage, and delivery of hydrogen in large volumes and, possibly, over long distances. Third, an important place is occupied by the creation of large-scale applications for use in transport, including FCEBs. Finally, it is offered to support policy development in a number of cross-cutting areas, in particular to ensure improved and harmonized safety standards, as well as monitoring and assessing the impact on the social sphere and the labor market. Robust methodologies need to be developed to assess the environmental impacts of hydrogen technologies and associated value chains, including lifecycle greenhouse gas emission and sustainability.
The EC also provides targeted support to prepare financially sound and viable hydrogen projects in countries where this is identified as a priority in relevant national and regional programs. During the funding period, a special “Interregional Innovation Investment Tool” with a pilot project on hydrogen technologies in carbon-intensive regions supports the development of innovative value chains in the context of the “European Regional Development Fund” [107].
Most countries of the world recognize an important role of the transport sector in reducing emissions and include transport modernization in their national energy plans following the “Paris Agreement” [101,104]. Herewith, according to [85], the number of countries that directly support investment in hydrogen technologies is constantly increasing, with most of them focused on transport. To date, 18 countries, whose economies account for 70% of global GDP, have already developed detailed strategies for implementing solutions in the field of hydrogen energy. About 10 thousand HRSs are under construction by 2030 in China, Japan, the USA and South Korea [9]. This factor may become an important management point for considering the use of hydrogen technology in general.
According to publicly available data, the FCEV stocks in China are expected to reach 50 thousand by 2025 and 1 million by 2030. Japan has set similar ambitious goals regarding FCEVs, aiming for 20 thousand FCEVs by 2025 and 800 thousand by 2030. The most ambitious targets are those of South Korea and Germany, with a total of 18 million FCEVs by 2030s.
The “Green New Deal” of the Republic of Korea outlines the country’s plans to issue 20 thousand FCEVs by 2025 and achieve carbon neutrality by 2050 that include 1.13 million euros. The Korean goal is to provide funding for 65 HRSs by 2035 [12] by 2040 as a part of the eco-friendly public transportation expansion policy in the scope of “The Roadmap for the Hydrogen Economy” program [50].
In 2016, the German government adopted the “Climate Action Plan” for 2050, making Germany one of the first countries to adopt the long-term low greenhouse gas emission reduction strategy [18]. Germany’s hydrogen strategy is planning to increase hydrogen production capacity to 5 GW by 2030 and 10 GW by 2040 using electricity from renewable energy sources. Germany has also pledged to invest up to 7 billion euros in the renewable hydrogen technologies [12].
As part of the “10-point plan” of the green industrial revolution of the UK, about 12 billion GBP of public investment is allocated for decarburization of the country. The plan includes grants for “zero-“ or ultra-low-emitting vehicles with the phasing out of sales of gasoline and diesel buses and vans by 2030. The UK has also announced the allocation of 28 million GBP to finance five hydrogen-issued projects [12].
Canada has published a climate plan that includes the goal of banning the sale of new gasoline-powered passenger cars, vans, and pickups by 2035 with their replacement being BEV and FCEV transport.
Norway has allocated 3.6 billion NOK to support the transition from “grey” to “blue” hydrogen and, finally, to “green” hydrogen.
Spain has unveiled a plan to increase hydrogen production from renewable sources and set a target for 300–600 MW of their capacity by 2024 and 4 GW by 2030.
Scotland has announced the allocation of 100 million GPB for new electrolyzers and set a goal to obtain 25 GW of renewable hydrogen by 2050.
The Estonian Transport Administration, coordinating the development of the nationwide public transport, expects that the public transport fleet in Tallinn will be carbon-neutral [108], assuming that all diesel buses will be replaced by 2025 and gas buses by 2035. At the same time, with the support of the EU, it is planned to create a network of HRSs and to supplement the Tallinn bus fleet with FCEBs.
The Australian government has allocated 70 million AUD to support the deployment of at least two new renewable hydrogen projects and established a new 300 million AUD fund to invest in the renewable hydrogen national industry.
Chile has unveiled a national “green” hydrogen strategy aimed at turning the country into a global producer and exporter of hydrogen by 2040. The strategy consists of a commitment to develop regulation of the use and fabrication of renewable hydrogen, analyze world best practices related to renewable hydrogen, and convene a government sector to develop a roadmap and action plan by 2025, which will identify opportunities for joint financing with the private sector. Chile’s strategy also updates the country’s rules, setting a goal to reduce greenhouse gas emission by 18–27% by switching to renewable fuels.
In several developed countries, more and more active efforts are also being made to expand the use of hydrogen with an emphasis on larger-scale, more environmentally friendly technologies.

4. Summary and Outlook

The state-of-the-art introduction of the hydrogen technology into the city bus transport sector has been analyzed in this review. The three sections of the study focus on the three sides of these vehicles’ development and prospects, namely energy consumption, energy efficiency, and energy production. The current problems of bus energy supply are selected, identified, and evaluated in terms of their solution, improvement, and development.
The comprehensive search among the most relevant documents, studies, and technical reports published in official EC directives and regulations, scientific journals, conference proceedings, established standards, and on the Web resulted in the following conclusions.
First, the widespread use of clean FCEBs faces several challenges. The hydrogen infrastructure is developing slowly, and many obstacles have been found on the way to its implementation. The effectiveness of the FCEBs depends strongly on the energy generation used to produce hydrogen. In the countries where the renewables are the main energy sources, the FCEBs are effective and their benefits strongly depend on the number of HRSs, the intensity of their use, and the amount of hydrogen delivered. In other regions, where hydrogen is almost entirely supplied from natural gas, coal, and other fossil fuels, efficiency of the FCEBs remains rather low.
Second, the review shows that the main pathway to follow to refine the present technology is to expand the use of renewable energy sources and production volumes, from which FCs and HRSs can benefit so that hydrogen from renewables could become a reliable medium to decarbonize bus transport, improve air quality, and strengthen energy security. The deployment of FCEBs, focused primarily on long and medium mileage and passenger transportation on popular routes, promises to increase the competitiveness of FC vehicles.
Third, to solve the problems identified in this review, the active participation of national and local authorities, industry, and investors is required. Recent advances in the implementation of FCs in city buses have shown that policies and technological innovations have the potential to create a global industry of environmentally friendly public transport.

Author Contributions

Conceptualization, methodology, software, writing, investigation, V.V.; validation, Z.R.; resources, V.V.; project administration, funding acquisition, E.P. All authors have read and agreed to the published version of the manuscript.

Funding

This research was funded by the Estonian Research Council grant PRG 658.

Data Availability Statement

Not applicable.

Conflicts of Interest

The authors declare no conflict of interest.

Abbreviations

EVelectric vehicle
BEVbattery electric vehicle
BEBbattery electric bus
FCfuel cell
FCEVfuel cell electric vehicle
FCEBfuel cell electric bus
EUEuropean Union
ECEuropean Commission
CO2carbon dioxide
H2hydrogen
DCdirect current
EMelectrical motor
ICEinternal combustion engine
HRShydrogen refueling station
CNGcompressed natural gas
LPGliquid petroleum gas
W2Wwell-to-wheel

References

  1. A Hydrogen Strategy for a Climate-Neutral Europe; European Commission: Brussels, Belgium, 2020; 24p, Available online: https://ec.europa.eu/energy/sites/ener/files/hydrogen_strategy.pdf (accessed on 19 September 2022).
  2. Global Renewables Outlook: Energy Transformation 2050; International Renewable Energy Agency (IRENA): Abu Dhabi, United Arab Emirates, 2020; 291p, Available online: https://www.irena.org/publications/2020/Apr/Global-Renewables-Outlook-2020 (accessed on 19 September 2022).
  3. Cardella, U.; Decker, L.; Klein, H. Roadmap to economically viable hydrogen liquefaction. Int. J. Hydrogen Energy 2017, 42, 13329–13338. [Google Scholar] [CrossRef]
  4. Sorlei, I.-S.; Bizon, N.; Thounthong, P.; Varlam, M.; Carcadea, E.; Culcer, M.; Iliescu, M.; Raceanu, M. Fuel cell electric vehicles—A brief review of current topologies and energy management strategies. Energies 2021, 14, 252. [Google Scholar] [CrossRef]
  5. How Fuel Cells Reduce Carbon Emissions as Effectively as Renewables. BloomEnergy White Paper. April 2019. 8p. Available online: https://www.bloomenergy.com/wp-content/uploads/bloom-energy-whitepaper-how-fuel-cells-reduce-carbon-emissions-as-effectively-as-renewables-new.pdf (accessed on 19 September 2022).
  6. World Energy Balances: Overview. Statistics Report; International Energy Agency (IEA): Paris, France, 2020; 59p, Available online: https://iea.blob.core.windows.net/assets/23f096ab-5872-4eb0-91c4-418625c2c9d7/World_Energy_Balances_Overview_2020_edition.pdf (accessed on 19 September 2022).
  7. Fossil Fuels; Environmental and Energy Study Institute (EESI): Washington, DC, USA, 2021; Available online: https://www.eesi.org/topics/fossil-fuels/description (accessed on 19 September 2022).
  8. REPowerEU Plan; European Commission: Brussels, Belgium, 2022; Available online: https://eur-lex.europa.eu/legal-content/EN/TXT/?uri=COM%3A2022%3A230%3AFIN&qid=1653033742483 (accessed on 19 September 2022).
  9. Path to Hydrogen Competitiveness. A Cost Perspective; Hydrogen Council: Brussels, Belgium, 2020; 88p, Available online: https://hydrogencouncil.com/wp-content/uploads/2020/01/Path-to-Hydrogen-Competitiveness_Full-Study-1.pdf (accessed on 19 September 2022).
  10. D’Ovidio, G.; Masciovecchio, C.; Rotondale, N. City bus powered by hydrogen fuel cell and flywheel energy storage system. In Proceedings of the IEEE International Electric Vehicle Conference (IEVC), Florence, Italy, 17–19 December 2014; pp. 1–5. [Google Scholar] [CrossRef]
  11. Ometto, A.; Masciovecchio, C.; Ciancetta, F.; D’Ovidio, G. A novel high efficiency hybrid power unit for hydrogen-fueled city transit bus. In Proceedings of the Electric Vehicles International Conference (EV), Bucharest, Romania, 3–4 October 2019; pp. 1–5. [Google Scholar] [CrossRef]
  12. Renewables 2021 Global Status Report; REN21 Secretariat: Paris, France, 2021; 371p, Available online: https://www.ren21.net/wp-content/uploads/2019/05/GSR2021_Full_Report.pdf (accessed on 19 September 2022).
  13. Mulholland, E.; Rodríguez, F. Reducing Oil Dependence in the EU through Applied Measures for Trucks and Buses; The International Council on Clean Transportation (ICCT): San Francisco, CA, USA, 2022; 4p, Available online: https://theicct.org/wp-content/uploads/2022/05/fs-eu-hdv-oil-imports-may22.pdf (accessed on 19 September 2022).
  14. Jaworski, A.; Mądziel, M.; Kuszewski, H. Sustainable public transport strategies—Decomposition of the bus fleet and its influence on the decrease in greenhouse gas emissions. Energies 2022, 15, 2238. [Google Scholar] [CrossRef]
  15. CO2 Performance of New Passenger Cars in Europe; European Environmental Agency (EEA): Copenhagen, Denmark, 2021; Available online: https://www.eea.europa.eu/ims/co2-performance-of-new-passenger (accessed on 19 September 2022).
  16. Woodford, C. Fuel Cells. Explainthatstuff. 2021. Available online: https://www.explainthatstuff.com/fuelcells.html (accessed on 19 September 2022).
  17. How Many Cars Are There in the World in 2022? Hanges & Company: Singapore, 2022; Available online: https://hedgescompany.com/blog/2021/06/how-many-cars-are-there-in-the-world/ (accessed on 19 September 2022).
  18. The Future of Clean Transit is Electric; Ballard Power Systems: Burnaby, BC, Canada, 2022; Available online: https://www.ballard.com/markets/transit-bus (accessed on 19 September 2022).
  19. Shakhov, V.; Sokolova, O. Towards air pollution detection with Internet of vehicles. In Proceedings of the Transactions of 15th International Asian School-Seminar Optimization Problems of Complex Systems (OPCS), Novosibirsk, Russia, 26–30 August 2019; pp. 183–186. [Google Scholar] [CrossRef]
  20. Baxter, T. Hydrogen Cars Won’t Overtake Electric Vehicles Because They’re Hampered by the Laws of Science. The Conversation. 2020. Available online: https://theconversation.com/hydrogen-cars-wont-overtake-electric-vehicles-because-theyre-hampered-by-the-laws-of-science-139899 (accessed on 19 September 2022).
  21. How to Calculate the CO2 Emission from the Fuel Consumption? EcoScore: Brussels, Belgium, 2022; Available online: https://ecoscore.be/en/info/ecoscore/CO2 (accessed on 19 September 2022).
  22. Lawrence Livermore National Laboratory. 2021 Annual Report. Available online: https://flowcharts.llnl.gov (accessed on 19 September 2022).
  23. 500,000 e-Buses Today in Operation. Sustainable Bus. 2020. Available online: https://www.sustainable-bus.com/news/electric-vehicle-outlook-2020-bnef-electric-buses/#:~:text=By%20Editorial%20Staff-,Today%20there%20are%20500%2C000%20e%2Dbuses%20in%20operation%20globally.,New%20Energy%20Finance%20(BNEB) (accessed on 19 September 2022).
  24. Advancing Public Transport (UITP). Global Bus Survey. 2019; 4p, Available online: https://cms.uitp.org/wp/wp-content/uploads/2020/07/Statistics-Brief_Global-bus-survey-003.pdf (accessed on 19 September 2022).
  25. Fact Sheet: Buses. European Automobile Manufacturers’ Association (ACEA). 2021. Available online: https://www.acea.auto/fact/fact-sheet-buses/ (accessed on 19 September 2022).
  26. Ceccon, S.; Longo, M.; Mazzoncini, R.; Panarese, A. Analysis of the implementation of full electric and hydrogen hybrid buses in two lines of the city of Milan. In Proceedings of the 15th International Conference on Ecological Vehicles and Renewable Energies (EVER), Monte-Carlo, Monaco, 10–12 September 2020; pp. 1–8. [Google Scholar] [CrossRef]
  27. Roadmap to a Single European Transport Area—Towards a Competitive and Resource Efficient Transport System; European Commission: Brussels, Belgium, 2011; 31p, Available online: https://eur-lex.europa.eu/LexUriServ/LexUriServ.do?uri=COM:2011:0144:FIN:en:PDF (accessed on 19 September 2022).
  28. Energy Technology Perspectives 2020; International Energy Agency (IEA): Paris, France, 2021; 400p, Available online: https://iea.blob.core.windows.net/assets/7f8aed40-89af-4348-be19-c8a67df0b9ea/Energy_Technology_Perspectives_2020_PDF.pdf (accessed on 19 September 2022).
  29. European Clean Hydrogen Alliance; European Commission: Brussels, Belgium, 2020; Available online: https://ec.europa.eu/growth/industry/strategy/industrial-alliances/european-clean-hydrogen-alliance_en (accessed on 19 September 2022).
  30. Green Hydrogen Investment and Support Report; Hydrogen Europe: Brussels, Belgium, 2020; 35p, Available online: https://profadvanwijk.com/wp-content/uploads/2020/05/Hydrogen-Europe_Green-Hydrogen-Recovery-Report_final.pdf (accessed on 19 September 2022).
  31. Khatibi, M. Investigating the impact of wind farms energy yields on reduction of power plants natural gas consumptions and CO2 emissions: A practical case study in Iran. In Proceedings of the 7th Iran Wind Energy Conference (IWEC), Shahrood, Iran, 17–18 May 2021; pp. 1–4. [Google Scholar] [CrossRef]
  32. Zhou, Y.; Qin, C.; Chen, Z. Response and emissions performance of diffusion combustion fueled with DME and natural gas blends. In Proceedings of the IEEE International Conference on Power and Renewable Energy (ICPRE), Shanghai, China, 21–23 October 2016; pp. 694–698. [Google Scholar] [CrossRef]
  33. How Much CO2 is Produced When Burning 1GJ of Natural Gas? Stack Exchange Network: New York, NY, USA, 2021; Available online: https://chemistry.stackexchange.com/questions/155547/how-much-co2-is-produced-when-burning-1gj-of-natural-gas (accessed on 19 September 2022).
  34. Bliss, J. Carbon Dioxide Emissions per Barrel of Crude. The Quiet Road. 2008. Available online: http://numero57.net/2008/03/20/carbon-dioxide-emissions-per-barrel-of-crude/#:~:text=When%20fuel%20oil%20is%20burned,kilograms%20of%20carbon%20dioxide%20gas (accessed on 19 September 2022).
  35. Luft, S.; Skrzek, T. Effect of the exhaust gas recirculation ratio and the energy share of the gaseous fuel on basic operating parameters and exhaust emissions in a dual-fuel compression ignition engine operating on natural gas. In Proceedings of the XI International Science-Technical Conference Automotive Safety, Casta-Papiernicka, Slovakia, 18–20 April 2018; pp. 1–6. Available online: https://ieeexplore.ieee.org/document/8373351 (accessed on 19 September 2022).
  36. Iliev, S. A study of the influence of HHO gas on the performance and emissions of a diesel engine. In Proceedings of the 7th International Conference on Energy Efficiency and Agricultural Engineering (EE&AE), Ruse, Bulgaria, 12–14 November 2020; pp. 1–4. [Google Scholar] [CrossRef]
  37. Takaish, T.; Numata, A.; Nakano, R.; Sakaguchi, K. Approach to high efficiency diesel and gas engines, Mitsubishi Heavy Industries, Ltd. Tech. Rev. 2008, 45, 21–24. Available online: http://www.mhi.co.jp/technology/review/pdf/e451/e451021.pdf (accessed on 19 September 2022).
  38. Roadmap Towards Zero Emissions: The Complementary Role of BEVs and FCEVs; Hydrogen Council: Brussels, Belgium, 2021; 26p, Available online: https://hydrogencouncil.com/wp-content/uploads/2021/10/Transport-Study-Full-Report-Hydrogen-Council-1.pdf (accessed on 19 September 2022).
  39. The European Green Deal; European Commission: Brussels, Belgium, 2019; Available online: https://eur-lex.europa.eu/legal-content/EN/TXT/?qid=1576150542719&uri=COM%3A2019%3A640%3AFIN (accessed on 19 September 2022).
  40. Fuel Cell Electric Buses: Knowledge Base; Waterstofnet: Turnhout, Belgium, 2022; Available online: https://fuelcellbuses.eu/ (accessed on 19 September 2022).
  41. Valdez-Resendiz, J.E.; Rosas-Caro, J.C.; Mayo-Maldonado, J.C.; Claudio-Sanchez, A.; Ruiz-Martinez, O.; Sanchez, V.M. Improvement of ultracapacitors-energy usage in fuel cell based hybrid electric vehicle. Int. J. Hydrogen Energy 2020, 45, 13746–13756. [Google Scholar] [CrossRef]
  42. Escandón, A.M.A.C.; Escandón, B.E.A.B.; Zalamea-León, E.; Serrano-Guerrero, X. Hydrogen capacity for use in public transportation using the excess electricity generated by photovoltaics from rooftops in the urban area of Cuenca, Ecuador. In Proceedings of the 20th International Conference on Renewable Energies and Power Quality (ICREPQ), Vigo, Spain, 27–29 July 2022; pp. 1–6. Available online: https://www.icrepq.com/icrepq22/215-22-cevallos.pdf (accessed on 19 September 2022).
  43. Akadeemik Enn Lust: Eesti Mängib Ikka Veel Lolli ja Tahab Edasi Tossutada. Tuule Tehnoloogia Litt. 2019. Available online: http://www.tuuleliit.ee/akadeemik-enn-lust-eesti-mangib-ikka-veel-lolli-ja-tahab-edasi-tossutada/ (accessed on 19 September 2022).
  44. Gim, J.; Kim, M.; Ahn, C. Energy management control strategy for saving trip costs of fuel cell/battery electric vehicles. Energies 2022, 15, 2131. [Google Scholar] [CrossRef]
  45. Luciani, S.; Tonoli, A. Control strategy assessment for improving PEM fuel cell system efficiency in fuel cell hybrid vehicles. Energies 2022, 15, 2004. [Google Scholar] [CrossRef]
  46. Dobson, G. Exploding Hydrogen Station Leads to FCV Halt; EV Talk: Sydney, Australia, 2019; Available online: https://evtalk.com.au/exploding-hydrogen-station-leads-to-fcv-halt/ (accessed on 19 September 2022).
  47. Li, H.; Liu, J.; Tian, Y.; Li, J. Optimization design of the permanent seat structure of the hydrogen supply system of fuel cell bus. In Proceedings of the IEEE Asia-Pacific Conference on Image Processing, Electronics and Computers (IPEC), Dalian, China, 14–16 April 2021; pp. 689–692. [Google Scholar] [CrossRef]
  48. Global Hydrogen Review 2021; International Energy Agency (IEA): Paris, France, 2021; 223p, Available online: https://iea.blob.core.windows.net/assets/5bd46d7b-906a-4429-abda-e9c507a62341/GlobalHydrogenReview2021.pdf (accessed on 19 September 2022).
  49. Ônibus Brasileiro Movido a Hidrogênio Começa a Rodar em São Paulo; Inovação Tecnológica: Lille, France, 2009; Available online: www.inovacaotecnologica.com.br/noticias/noticia.php?artigo=onibus-brasileiro-movido-a-hidrogenio-comeca-a-rodar-em-sao-paulo (accessed on 19 September 2022).
  50. Yi, Y.; Jang, J.A.; Lee, I. Data design for driving monitoring of hydrogen electric bus. In Proceedings of the Transactions of International Conference on Information and Communication Technology Convergence (ICTC), Jeju Island, Korea, 20–22 October 2021; pp. 697–700. [Google Scholar] [CrossRef]
  51. Borbujo, I.C.; Pereirinha, P.G.; Vega, M.G.; del Valle, J.A.; Antón, J.C.Á. Heavy duty transport descarbonization: Legislation and standards for hydrogen and battery electric buses and heavy-duty trucks. In Proceedings of the Transactions of IEEE Vehicle Power and Propulsion Conference (VPPC), Gijon, Spain, 25–28 October 2021; pp. 1–6. [Google Scholar] [CrossRef]
  52. Crawford, I. How Much CO2 is Emitted by Manufacturing Batteries? MIT Climate: Cambridge, MA, USA, 2022; Available online: https://meche.mit.edu/news-media/how-much-co2-emitted-manufacturing-batteries (accessed on 19 September 2022).
  53. Woollacott, E. Electric Cars: What Will Happen to All the Dead Batteries? BBC: London, UK, 2021; Available online: https://www.bbc.com/news/business-56574779 (accessed on 19 September 2022).
  54. Breuer, J.L.; Scholten, J.; Koj, J.C.; Schorn, F.; Fiebrandt, M.; Samsun, R.C.; Albus, R.; Görner, K.; Stolten, D.; Peters, R. An Overview of Promising Alternative Fuels for Road, Rail, Air, and Inland Waterway Transport in Germany. Energies 2022, 15, 1443. [Google Scholar] [CrossRef]
  55. Allen, J. Honda: Now Is The Right Time to Embrace Electric Cars. The Sunday Times. 4 November 2019. Available online: https://www.driving.co.uk/news/honda-embracing-electrified-cars-now-right-time (accessed on 19 September 2022).
  56. FCEV Sales, FCEB, & Hydrogen Station Data; California Fuel Cell Partnership: California, CA, USA, 2022; Available online: https://cafcp.org/by_the_numbers (accessed on 19 September 2022).
  57. Hanley, S. French City Cancels Hydrogen Bus Contract, Opts for Electric Buses; CleanTechnica: Long Beach, CA, USA, 2022; Available online: https://cleantechnica.com/2022/01/11/french-city-cancels-hydrogen-bus-contract-opts-for-electric-buses (accessed on 19 September 2022).
  58. Fernandes, R. Here’s Why Hydrogen Cars Were Doomed To Fail. 2022. Available online: https://www.slashgear.com/833231/heres-why-hydrogen-cars-were-doomed-to-fail (accessed on 19 September 2022).
  59. Williams, K. The Switch from Hydrogen to Electric Vehicles Continues Now Hyundai Makes Move; Seeking Alpha: New York, NY, USA, 2017; Available online: https://seekingalpha.com/article/4103682-switch-from-hydrogen-to-electric-vehicles-continues-now-hyundai-makes-move (accessed on 19 September 2022).
  60. Hydrogen from Renewable Power Technology Outlook for the Energy Transition; Renewable Energy Agency (IRENA): Abu Dhabi, United Arab Emirates, 2018; 52p, Available online: https://www.irena.org/-/media/Files/IRENA/Agency/Publication/2018/Sep/IRENA_Hydrogen_from_renewable_power_2018.pdf (accessed on 19 September 2022).
  61. He, C.; Ma, L.; Wang, R.; Zhang, X. Establishment of wind turbine energy efficiency index system based on f-neighborhood rough set. In Proceedings of the International Conference on Sensing, Diagnostics, Prognostics, and Control (SDPC), Beijing, China, 5–7 August 2020; pp. 17–21. [Google Scholar] [CrossRef]
  62. Weiss, M.; Cloos, K.C.; Helmers, E. Energy efficiency trade-offs in small to large electric vehicles. Environ. Sci. Eur. 2020, 32, 1–17. [Google Scholar] [CrossRef]
  63. Total Final Consumption; Energy Education: Burlington, VT, USA, 2021; Available online: https://energyeducation.ca/encyclopedia/Total_final_consumption (accessed on 19 September 2022).
  64. Well-to-Wheels Analyses; European Commission: Ispra, Italy, 2016; Available online: https://joint-research-centre.ec.europa.eu/welcome-jec-website/jec-activities/well-wheels-analyses_en (accessed on 19 September 2022).
  65. Wang, X.-Z.; Zhou, M.-H.; Dang, J.-M. A comparative efficiency evaluation of China’s logistics regions based on changing output indicators. In Proceedings of the International Conference on Information Management, Innovation Management and Industrial Engineering, Taipei, Taiwan, 19–21 December 2008; pp. 7–11. [Google Scholar] [CrossRef]
  66. Oziemski, M. Topping nuclear power plants steam cycles with gas turbines as the way of enhancing their efficiency. In Proceedings of the International Conference on Power Generation Systems and Renewable Energy Technologies (PGSRET), Istanbul, Turkey, 26–27 August 2019; pp. 1–6. [Google Scholar] [CrossRef]
  67. Hydrogen: A Renewable Energy Perspective; Report of the 2nd Hydrogen Energy Ministerial Meeting in Tokyo, Japan; Renewable Energy Agency (IRENA): Abu Dhabi, United Arab Emirates, 2019; 52p, Available online: https://www.irena.org/-/media/Files/IRENA/Agency/Publication/2019/Sep/IRENA_Hydrogen_2019.pdf (accessed on 19 September 2022).
  68. Electrolyzer Efficiency. HOMER Pro. 2022. Available online: https://www.homerenergy.com/products/pro/docs/latest/electrolyzer_efficiency.html (accessed on 19 September 2022).
  69. Skiba, E.D.; Shaposhnikov, V.V.; Kocharyan, E.V. Energy saving in the main gas pipeline transport. In Proceedings of the transactions of International Science and Technology Conference (EastConf), Vladivostok, Russia, 1–2 March 2019; pp. 1–3. [Google Scholar] [CrossRef]
  70. Klimash, V.S.; Tabarov, B.D. Improving the efficiency of transformer substations with unbalanced load schedule. In Proceedings of the Transactions of International Multi-Conference on Industrial Engineering and Modern Technologies (FarEastCon), Vladivostok, Russia, 6–9 October 2020; pp. 1–4. [Google Scholar] [CrossRef]
  71. Moghbelli, H.; Niasar, A.H.; Langari, R. New generation of passenger vehicles: FCV or FCEV? In Proceedings of the Transactions of IEEE International Conference on Industrial Technology, Mumbai, India, 15–17 December 2006; pp. 1–8. [Google Scholar] [CrossRef]
  72. Lambert, F. Toyota Admits ‘Elon Musk is Right’ about Fuel Cell, but Moves Forward with Hydrogen Anyway. Electrek. 26 October 2017. Available online: https://electrek.co/2017/10/26/toyota-elon-musk-fuel-cell-hydrogen (accessed on 19 September 2022).
  73. Vodovozov, V. Electrical Drive: Performance, Design and Control; LAP Lambert Academic Publishing: Saarbrücken, Germany, 2014; 328p, Available online: https://www.amazon.co.uk/Electrical-Drive-Performance-Design-Control/dp/3659551910 (accessed on 19 September 2022).
  74. Hydrogen Electricity Value Chain. Group Technology & Research Position Paper. 2019. Available online: https://issuu.com/dnvgl/docs/190225193348-9479976654484e1884e8add3fe2c5095 (accessed on 19 September 2022).
  75. Battery Electric Cars Are a Better Choice for Emissions Reduction; PVBuzz Media: Scarborough, ON, Canada, 2016; Available online: https://pvbuzz.com/electric-cars-better (accessed on 19 September 2022).
  76. Liquid Hydrogen Online; IdealHy: Oldenburg, Germany, 2013; Available online: https://www.idealhy.eu/index.php?page=lh2_outline (accessed on 19 September 2022).
  77. Stolzenburga, K.; Berstadb, D.; Deckerc, L.; Elliottd, A.; Haberstrohe, C.; Hattof, C.; Klause, M.; Mortimerf, N.D.; Mubbalaa, R.; Mwabonjef, O.; et al. Efficient liquefaction of hydrogen: Results of the IDEALHY project. In Proceedings of the XXth Energie—Symposium, Stralsund, Germany, 7–9 November 2013; pp. 1–8. Available online: https://www.idealhy.eu/uploads/documents/IDEALHY_XX_Energie-Symposium_2013_web.pdf (accessed on 19 September 2022).
  78. Voelcker, J. Energy use for hydrogen fuel-cell vehicles: Higher than electrics, even hybrids (analysis). Green Car Reports. 4 May 2017. Available online: https://www.greencarreports.com/news/1110239_energy-use-for-hydrogen-fuel-cell-vehicles-higher-than-electrics-even-hybrids-analysis (accessed on 19 September 2022).
  79. Nekkers, R.; Ex, F.; van Beckhoven, J. Hydrogen buses on the Veluwe. Status Report 2BP. March 2020. Available online: https://www.h2nodes.eu/images/docs/20200416_status_verslag_2BP_Hydrogen_buses_on_the_Veluwe_Eng_.pdf (accessed on 19 September 2022).
  80. Ivkovic, I.; Kaplanović, S.; Milovanović, B. Influence of road and traffic conditions on fuel consumption and fuel cost for different bus technologies. Therm. Sci. 2017, 21, 693–706. [Google Scholar] [CrossRef]
  81. Al-Mahadin, A.; Mustafa, M.Y. Utilizing fuel cell technology for Dubai Roads and Transport Authority (RTA). In Proceedings of the Advances in Science and Engineering Technology International Conferences (ASET), Dhabi, United Arab Emirates, 6 February–5 April 2018; pp. 1–6. [Google Scholar] [CrossRef]
  82. Vodovozov, V.; Raud, Z.; Lehtla, T. Design of an experimental setup to study the drives of battery electric vehicles. World Acad. Sci. Eng. Technol. 2013, 76, 704–710. [Google Scholar] [CrossRef]
  83. Raud, Z.; Vodovozov, V.; Lillo, N.; Rassolkin, A. Reserves for regenerative braking of battery electric vehicles. In Proceedings of the Electric Power Quality and Supply Reliability Conference (PQ), Rakvere, Estonia, 11–13 June 2014; pp. 1–6. [Google Scholar] [CrossRef]
  84. Halderman, D.J. Advanced Automotive Electricity and Electronics; Pearson Education: New Jersey, NJ, USA, 2013; 455p. [Google Scholar]
  85. [20A] The Future of Hydrogen; International Energy Agency (IEA): Paris, France, 2019; 203p, Available online: https://iea.blob.core.windows.net/assets/9e3a3493-b9a6-4b7d-b499-7ca48e357561/The_Future_of_Hydrogen.pdf (accessed on 19 September 2022).
  86. Hydrogen; International Energy Agency (IEA): Paris, France, November 2021; Available online: https://www.iea.org/reports/hydrogen (accessed on 19 September 2022).
  87. Hydrogen Generation Market Size, Share & Trends Analysis Report; Grand View Research: San Francisco, CA, USA, 2022; 132p, Available online: https://www.grandviewresearch.com/industry-analysis/hydrogen-generation-market (accessed on 19 September 2022).
  88. Future European Fuel Cell Technology: Fit for Automatic Manufacturing and Assembly; Fuel Cells and Hydrogen Joint Undertaking: Brussels, Belgium, 2020; Available online: https://www.fch.europa.eu/project/future-european-fuel-cell-technology-fit-automatic-manufacturing-and-assembly (accessed on 19 September 2022).
  89. Vancouver Ends Hydrogen Bus Program Amid High Costs. 2015. Available online: https://enrg.io/vancouver-ends-hydrogen-bus-program-amid-high-costs (accessed on 19 September 2022).
  90. Swalec, C. Steel Plants are Responsible for Global CO2 Emissions. CarbonBrief. 2021. Available online: https://www.carbonbrief.org/guest-post-these-553-steel-plants-are-responsible-for-9-of-global-co2-emissions (accessed on 19 September 2022).
  91. Gibbs, M.J.; Soyka, P.; Conneely, D. CO2 emissions from cement production. In Good Practice Guidance and Uncertainty Management in National Greenhouse Gas Inventories; IPCC: Hayama, Japan, 2000; pp. 175–182. [Google Scholar]
  92. Mohseni, S.; Brent, A.C. Economic viability assessment of sustainable hydrogen production, storage, and utilization technologies integrated into on- and off-grid micro-grids: A performance comparison of different meta-heuristics. Int. J. Hydrogen Energy 2020, 45, 34412–34436. [Google Scholar] [CrossRef]
  93. Mobility and Transport; European Commission: Brussels, Belgium, 2022; Available online: https://transport.ec.europa.eu/index_en (accessed on 19 September 2022).
  94. Baroutaji, A.; Wilberforce, T.; Ramadan, M.; Olabi, A.C. Comprehensive investigation on hydrogen and fuel cell technology in the aviation and aerospace sectors. Renew. Sustain. Energy Rev. 2019, 106, 31–40. [Google Scholar] [CrossRef] [Green Version]
  95. 2017 Renewable Energy Data Book; National Renewable Energy Laboratory (NREL), U.S. Department of Energy: Portland, OR, USA, 2019; 142p. Available online: https://www.nrel.gov/docs/fy19osti/72170.pdf (accessed on 19 September 2022).
  96. Zhang, D.; Duan, R.; Li, H.; Yang, Q.; Zhou, H. Optimal design, thermodynamic, cost and CO2 emission analyses of coal-to-methanol process integrated with chemical looping air separation and hydrogen technology. Energy 2020, 203, 117876. [Google Scholar] [CrossRef]
  97. Cost, Logistics Offer ‘Blue Hydrogen’ Market; C&P Global: Crown Point, IN, USA, 2022; Available online: https://www.spglobal.com/marketintelligence/en (accessed on 19 September 2022).
  98. Statistical Review of World Energy; BP p.l.c.: London, UK, 2021; 72p, Available online: https://www.bp.com/content/dam/bp/business-sites/en/global/corporate/pdfs/energy-economics/statistical-review/bp-stats-review-2021-full-report.pdf#page13 (accessed on 19 September 2022).
  99. United States Energy Information; EnerData: Grenoble, France, 2022; Available online: https://www.enerdata.net/estore/energy-market/united-states (accessed on 19 September 2022).
  100. Electricity Production, Consumption and Market Overview; Eurostat: Brussels, Belgium, 2022; Available online: https://ec.europa.eu/eurostat/statistics-explained/index.php?title=Electricity_production,_consumption_and_market_overview (accessed on 19 September 2022).
  101. State of the Energy Union 2021—Contributing to the European Green Deal and the Union’s Recovery; European Commission: Brussels, Belgium, 2021; Available online: https://energy.ec.europa.eu/system/files/2021-10/state_of_the_energy_union_report_2021.pdf (accessed on 19 September 2022).
  102. Woodrow, M. Bay Area Experiences Hydrogen Shortage after Explosion. ABC News. 4 June 2019. Available online: https://abc7news.com/hydrogen-explosion-chemicals-chemical-plant/5328775 (accessed on 19 September 2022).
  103. International Renewable Energy Agency (IRENA). Available online: https://www.irena.org/ (accessed on 19 September 2022).
  104. Paris Agreement; United Nations: San Francisco, CA, USA, 2015; 27p, Available online: https://unfccc.int/sites/default/files/english_paris_agreement.pdf (accessed on 19 September 2022).
  105. Renewable Energy Directive; European Commission: Brussels, Belgium, 2018; Available online: https://eur-lex.europa.eu/legal-content/EN/TXT/?uri=uriserv:OJ.L_.2018.328.01.0082.01.ENG&toc=OJ:L:2018:328:TOC (accessed on 19 September 2022).
  106. CO2 Emission Performance Standards for Cars and Vans; European Commission: Brussels, Belgium, 2019; Available online: https://eur-lex.europa.eu/legal-content/EN/TXT/?uri=celex%3A32020R0022 (accessed on 19 September 2022).
  107. European Regional Development Fund; European Commission: Brussels, Belgium, 2021; Available online: https://eur-lex.europa.eu/legal-content/EN/TXT/?uri=CELEX:32021R1058 (accessed on 19 September 2022).
  108. Public Transport in Estonia. Bus; Estonian Transport Administration: Tallinn, Estonia, 2021; Available online: https://www.transpordiamet.ee/en/mobility-and-transportation/public-transport-estonia/bus (accessed on 19 September 2022).
Figure 1. Energy consumption and CO2 emission of world transport.
Energies 15 06945 g001
Figure 2. Approximate CO2 emissions of different fossil fuels.
Energies 15 06945 g002
Figure 3. World numbers of vehicles, millions.
Energies 15 06945 g003
Figure 4. Scheme of a fuel cell.
Energies 15 06945 g004
Figure 5. A powertrain of an FCEV.
Energies 15 06945 g005
Figure 6. General design of an FCEB.
Energies 15 06945 g006
Figure 7. Efficiency estimates of the four types of buses.
Energies 15 06945 g007
Figure 8. Efficiency map of an EM in torque (T) to speed (ω) reference frame.
Energies 15 06945 g008
Figure 9. Distribution of braking energy at regeneration.
Energies 15 06945 g009
Figure 10. Methods for producing hydrogen.
Energies 15 06945 g010
Figure 11. Approximate ratios between hydrogen prices (€/kg) in 2020.
Energies 15 06945 g011
Figure 12. Scheme of an electrolyser.
Energies 15 06945 g012
Publisher’s Note: MDPI stays neutral with regard to jurisdictional claims in published maps and institutional affiliations.

