Article

A Study Exploring Opportunities to Utilize Wind Charge in Bangladesh

by
Muhammad Muhibbullah
1,*,
Quazi Taif Sadat
1 and
Umashankar Subramaniam
2
1
Department of Electrical and Electronic Engineering, Bangladesh University, 15/1, Iqbal Road, Mohammadpur, Dhaka 1207, Bangladesh
2
Department of Communications and Networks, Renewable Energy Laboratory, College of Engineering, Prince Sultan University, Riyadh 11586, Saudi Arabia
*
Author to whom correspondence should be addressed.
Energies 2022, 15(19), 6997; https://doi.org/10.3390/en15196997
Submission received: 14 August 2022 / Revised: 18 September 2022 / Accepted: 22 September 2022 / Published: 23 September 2022
(This article belongs to the Section I: Energy Fundamentals and Conversion)

Abstract

:
Wind charge is produced naturally in space. Knowing the nature of space charge is important for various purposes. If the charge is received for the whole year long by an antenna, then, in this process, the charge can be used as electric power. In the present work, the nature of wind charge in space in the cities of Dhaka and Narayanganj was observed. A net-type antenna was used to receive the wind charge. The results show that the power decreased with the antenna gaps. The output power increased with the antenna’s gross area and the speed of air. The overall output power was increased with humidity. It was shown that wind with a higher distance from the ground carries more electric charge. This research reveals that electric charge is inhomogeneous in wind, and it is collectable as electric power. The nature of the results is similar in both cities, but the output power is larger in Dhaka than in Narayanganj. This alternative power source is environmentally friendly, and it reduces thunder and lighting due to charge being taken from wind. Thus, this creates a more danger-free environment.

1. Introduction

Electricity is mainly produced by burning fuel, and burning fuel produces dangerous pollutants, such as oxides of sulfur and nitrogen, CO, hydrocarbons, and most significantly, CO2 [1,2]. These pollutants are alarmingly increasingwith the increase in electricity consumption day by day. Alternative energy sources may solve this problem. Windmills [3] can produce a large amount of electric power anywhere globally, but they require particular locations and climates. Hydroelectric power [4] is a conventional pollution-free power source, and it also produces huge amounts of electric power, but its use requires suitable surroundings. Tidal [5], sea wave [6], and solar cell [7] sources are expensive compared to other conventional power sources. The thermoelectric [8,9] process does not produce a huge amount of electric power. The harvesting of space and cloud charge can be an energy source, which is environmentally friendly since it is pollution-free.
Clouds and space contain huge amounts of electric charge, which is produced naturally. Recently, the use of electromagnetic microwaves for communications has increased remarkably [10,11,12,13]. This radiation may also influence the production of charge in air particles. On the other hand, thousands of people and livestock are killed by thunder and lighting all over the world every year [14,15,16]. To protect people and livestock from lighting, and to make the wind charge usable as energy, it is important to know the nature of wind charge. Some research has been carried out on the nature of space charge. Michael Faraday noted the peculiarities of the creation and discharge of electric charges during sandstorms [17] in 1850, an observable fact repeatedly revived over the prevailing century and a half [18]. Correspondingly, sand becomes strongly electrified by helicopter movement in desert surroundings, causing spark and detonation hazards. Many observers have observed mechanisms by which similar particles may charge one another [19], differences in contact area [20] or particle size [21], the inductive charging of isolated particles [22], or aqueous ion transfer on particle surfaces [23].
The above research reveals the nature of space and cloud charge in local areas (outside Bangladesh). There is no example of the collection of space charges so far. Moreover, the nature of space charge depends on the natural environment in a local region, because the generation and flow of space charge is related to the local environment. The amount of space charge would not be the same in deserts and rainy regions. There is no report on the nature of wind charge in Bangladesh. In the present research, the wind charge in the cities of Dhaka and Narayanganj in Bangladesh was characterized in the summer season. A net-type antenna was used to collect the wind charge near space in various environments. The variable parameters were wind speed, the geometry of the antenna, humidity, and height of the antenna from the ground.

2. Basis of Principle

Electric charge appears in the air or clouds through multiple actions of nature, and it separates through natural electric fields. The charge is created from the radiolysis of air by cosmic rays, radioactivity, and other natural activities. Recently, the use of electromagnetic radiation for communications has increased remarkably. This radiation may influence the production of air particle charge. A charge partition carries a potential difference between ionic regions of the upper atmosphere and the Earth’s surface, which causes a leakage of current to flow vertically [24,25,26]. A type of microphysical friction exchanges charge with a magnitude of tens of femto-Coulombs, but the very small magnitude and polarity are very much influenced by the water content and temperature.
The space or cloud charge in an area tries to discharge with the opposite charge in another area or with the ground via a short path. Usually, a lighting-protected rod is used to protect people and livestock from lighting [27]. This easy technique was taken to collect the moving charge of wind from space in this work. In this way, we could characterize the wind charge. This antenna receives a charge (+ve or −ve) from space, and the charge goes through a primary coil of a transformer (T) to the ground, as shown in Figure 1. Since the charge is not distributed homogeneously in space, an inhomogeneous direct current flows through the primary coil as a pulsating direct current; then, AC power is generated to the secondary coil. We collected the power generated in this process to characterize the wind charge.

3. Experimental Details

The antenna was connected with an end of the primary coil of a transformer T, and the other end of the transformer was grounded (see Figure 1). The bridge rectifier (D) rectified the output. The produced power of the secondary coil of the transformer was characterized. The variation in output with different parameters was observed. When one parameter was changed, other parameters remained unchanged. The parameters were antenna gap, antenna length (size), wire diameter, speed of air, humidity, and antenna height from the ground. The output of the secondary coil was observed using a digital multimeter (D M) for an antenna with different heights in certain environments of a place, and the experiment was repeated indifferent environments. The experiment was conducted in both the cities of Dhaka and Narayanganj in Bangladesh at the beginning of the summer season. To reduce the research costs, the work was carried out on a 24 m high building in Dhaka city and a 20 m high building in Narayanganj city. Three rods (around 1.15 cm in diameter) were grounded (around 50 cm deep) in the ground with 10 cm distances from each other near the buildings. The rods were connected in parallel. A copper (22-gauge, 3-piece cable) wire was used to connect the rods and the antenna via a transformer in series. The charge flowed via the primary coil of the transformer. The transformer was very small (it is usually used as a low-voltage dc source), and the wire of the transformer was very narrow, at around 30 gauges. The model of the rectifier diode was In4007. The speed of the air, humidity, and temperature were measured instantly in each experiment. The power and current were measured with a CD800a digital multimeter from Sanwa Electric Instrument Company Limited, Japan. The humidity was measured by a hygrometer which is made by Anymetre of ROHS, China; model: TH101B. The speed of air was measured where the antenna was placed using an anemometer. The model of the meter is AR836+, which is made by Smart Sensor Intelli Instrument Pro, China.
Seven types of observations were made in this research. A description of each observation is given below:
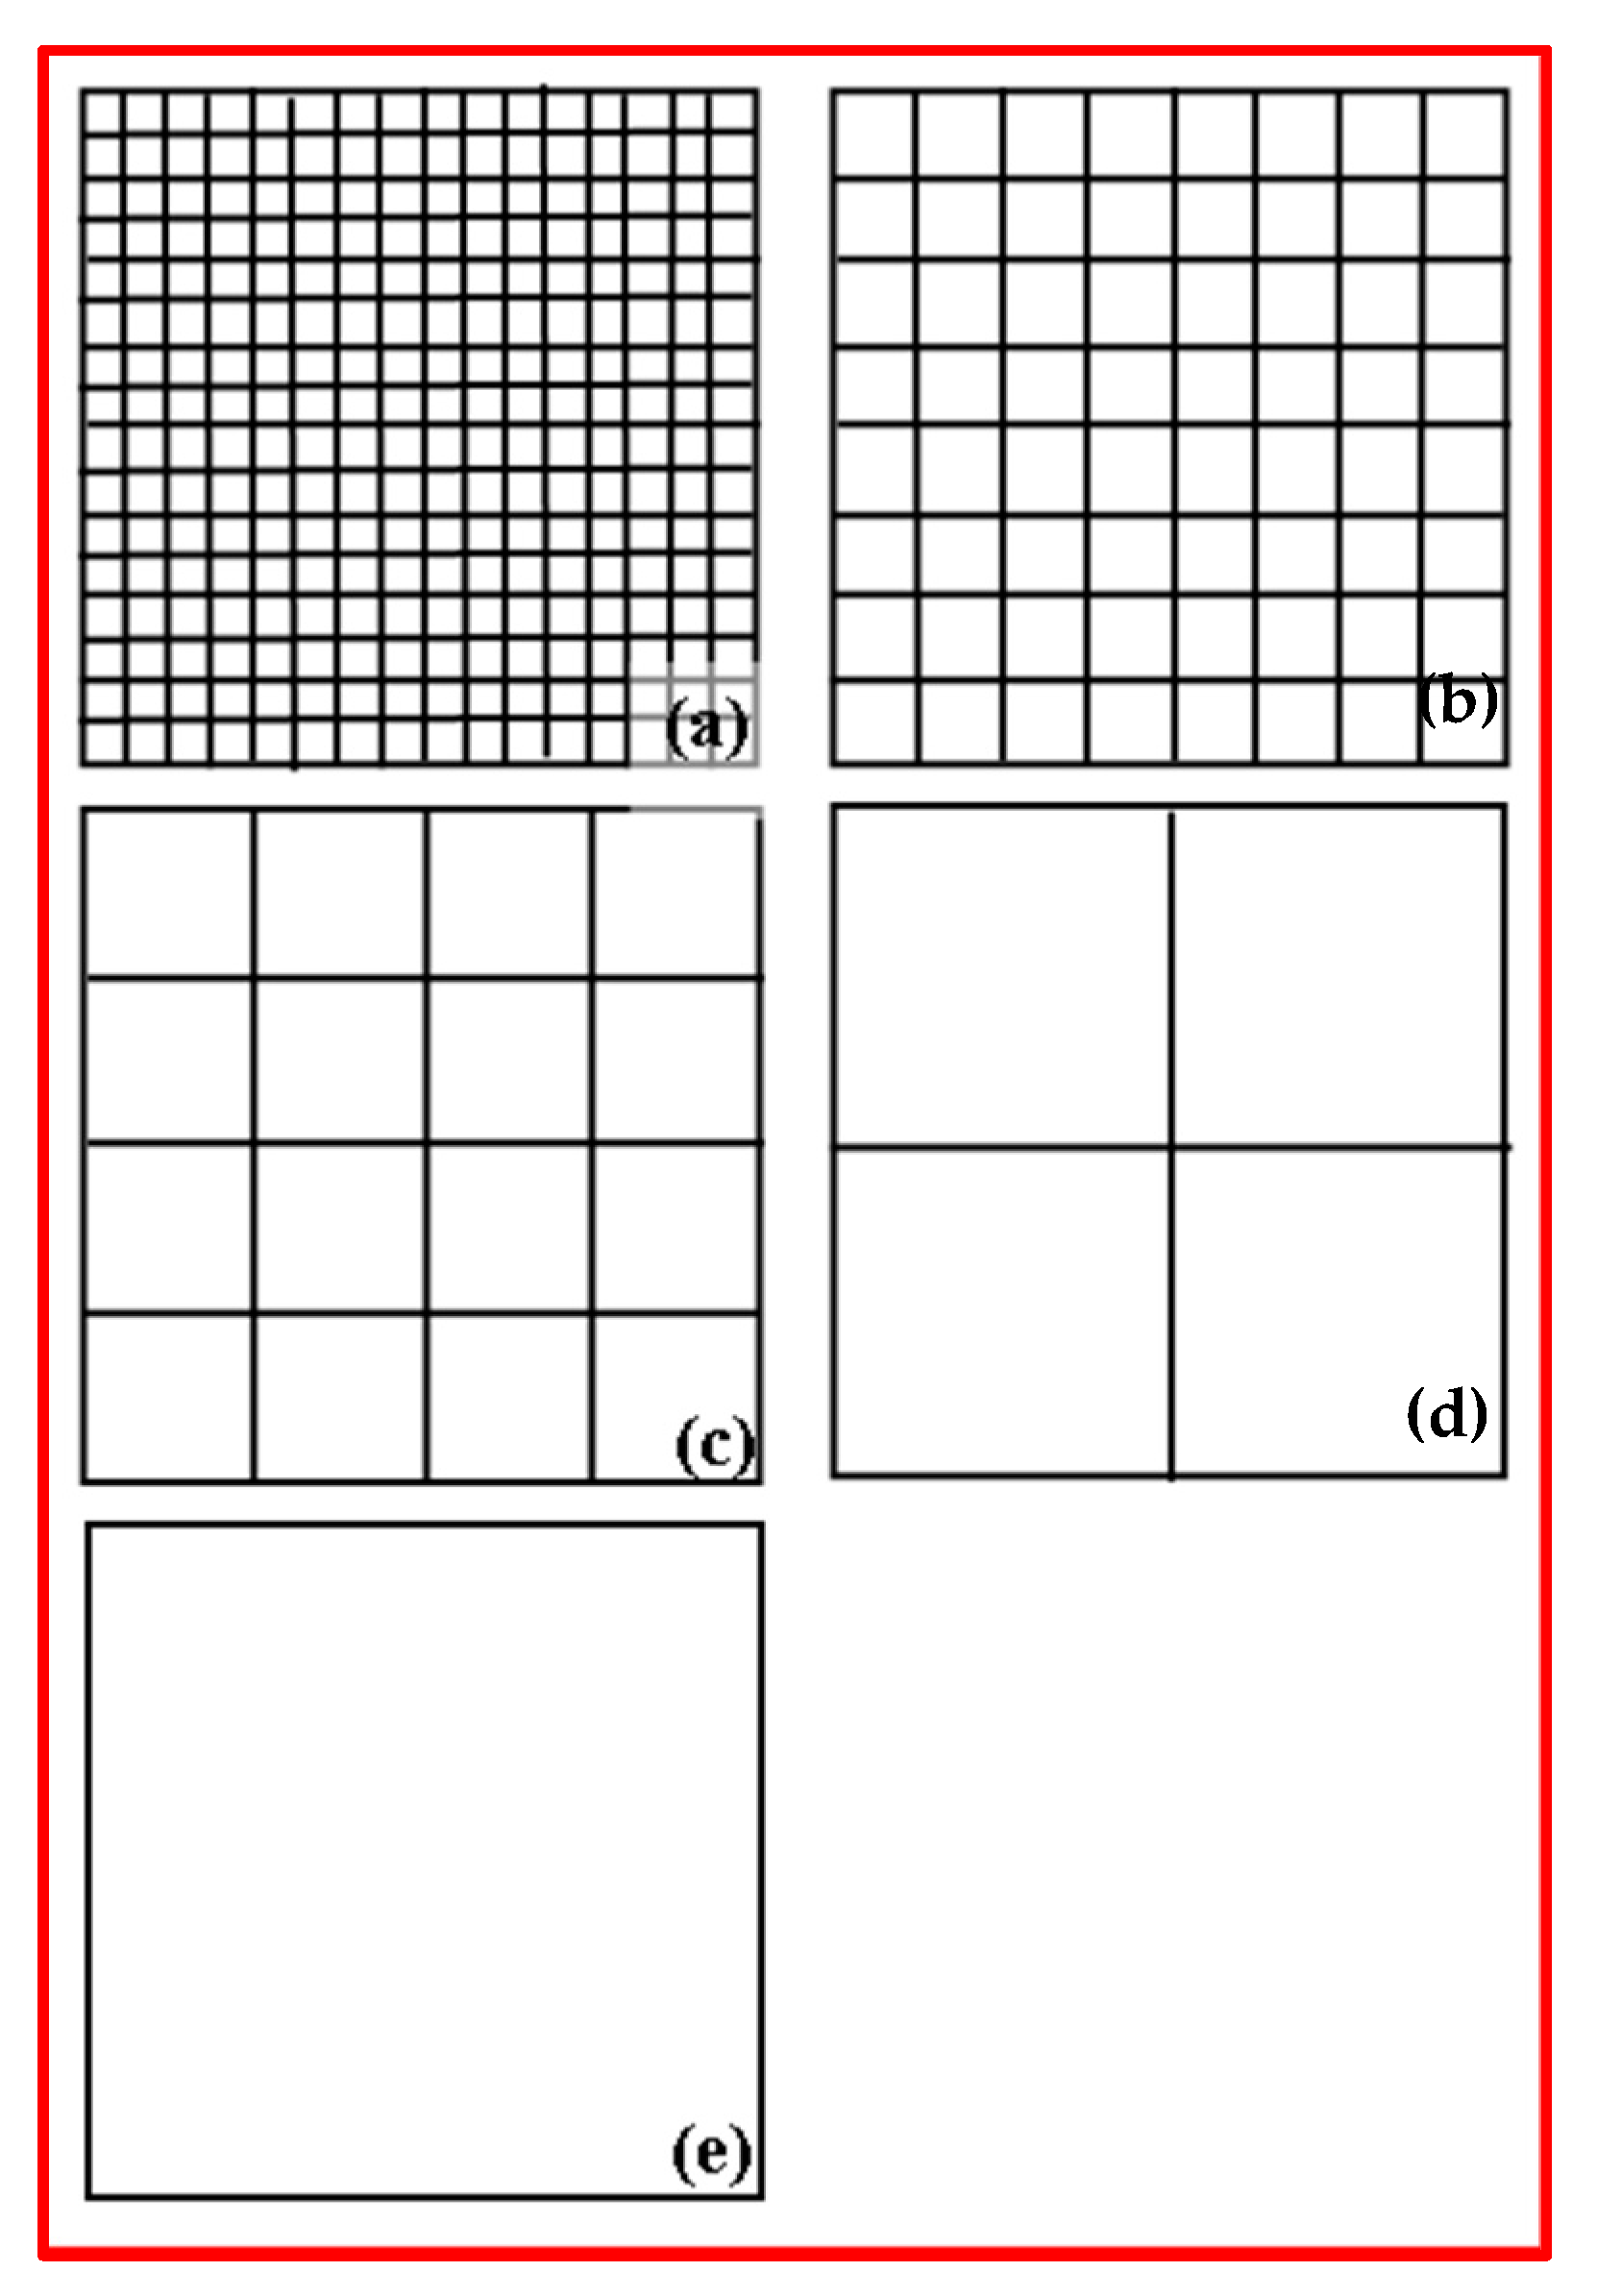
  • The output power was recorded with different antenna gaps. Other parameters were almost constant in these observations. It was difficult to maintain constant environment for long periods of time, so the work had to be carried out as rapidly as possible. Galvanized iron (GI) wires were used to make the antennas. Five antennas were used in this observation. The gross antenna size was 72 × 72 cm2, and the wire diameter was 1.6 mm. The sizes of the gaps were 6 × 6 cm2, 12 × 12 cm2, 24 × 24 cm2, 36 × 36 cm2, and 72 × 72 cm2, as shown in Figure 2.
  • Output power was recorded with different humidity levels, and other parameters were constant in these observations. The antenna size was 72 × 72 cm2, the gap size was 24 × 24 cm2, and the wire diameter was 3.0 mm. It was difficult to take readings with constant air speeds and temperatures. We have done the experiment several times to get suitable meaning for the presentable data.
  • Output power was recorded using different diameters of the antenna wire. Other parameters were constant during these experiments. Five antennas were used in this observation. The antenna size was 72 × 72 cm2, and the gap size was 24 × 24 cm2. The variations in the diameters were 0.5 mm, 1.2 mm, 2.4 mm, 2.6 mm, and 3.0 mm, as shown in Figure 3.
  • Output power was recorded with different air speeds. Other parameters were constant in these observations. The antenna size was 72 × 72 cm2, the gap size was 24 × 24 cm2, and the wire diameter was 1.2 mm.
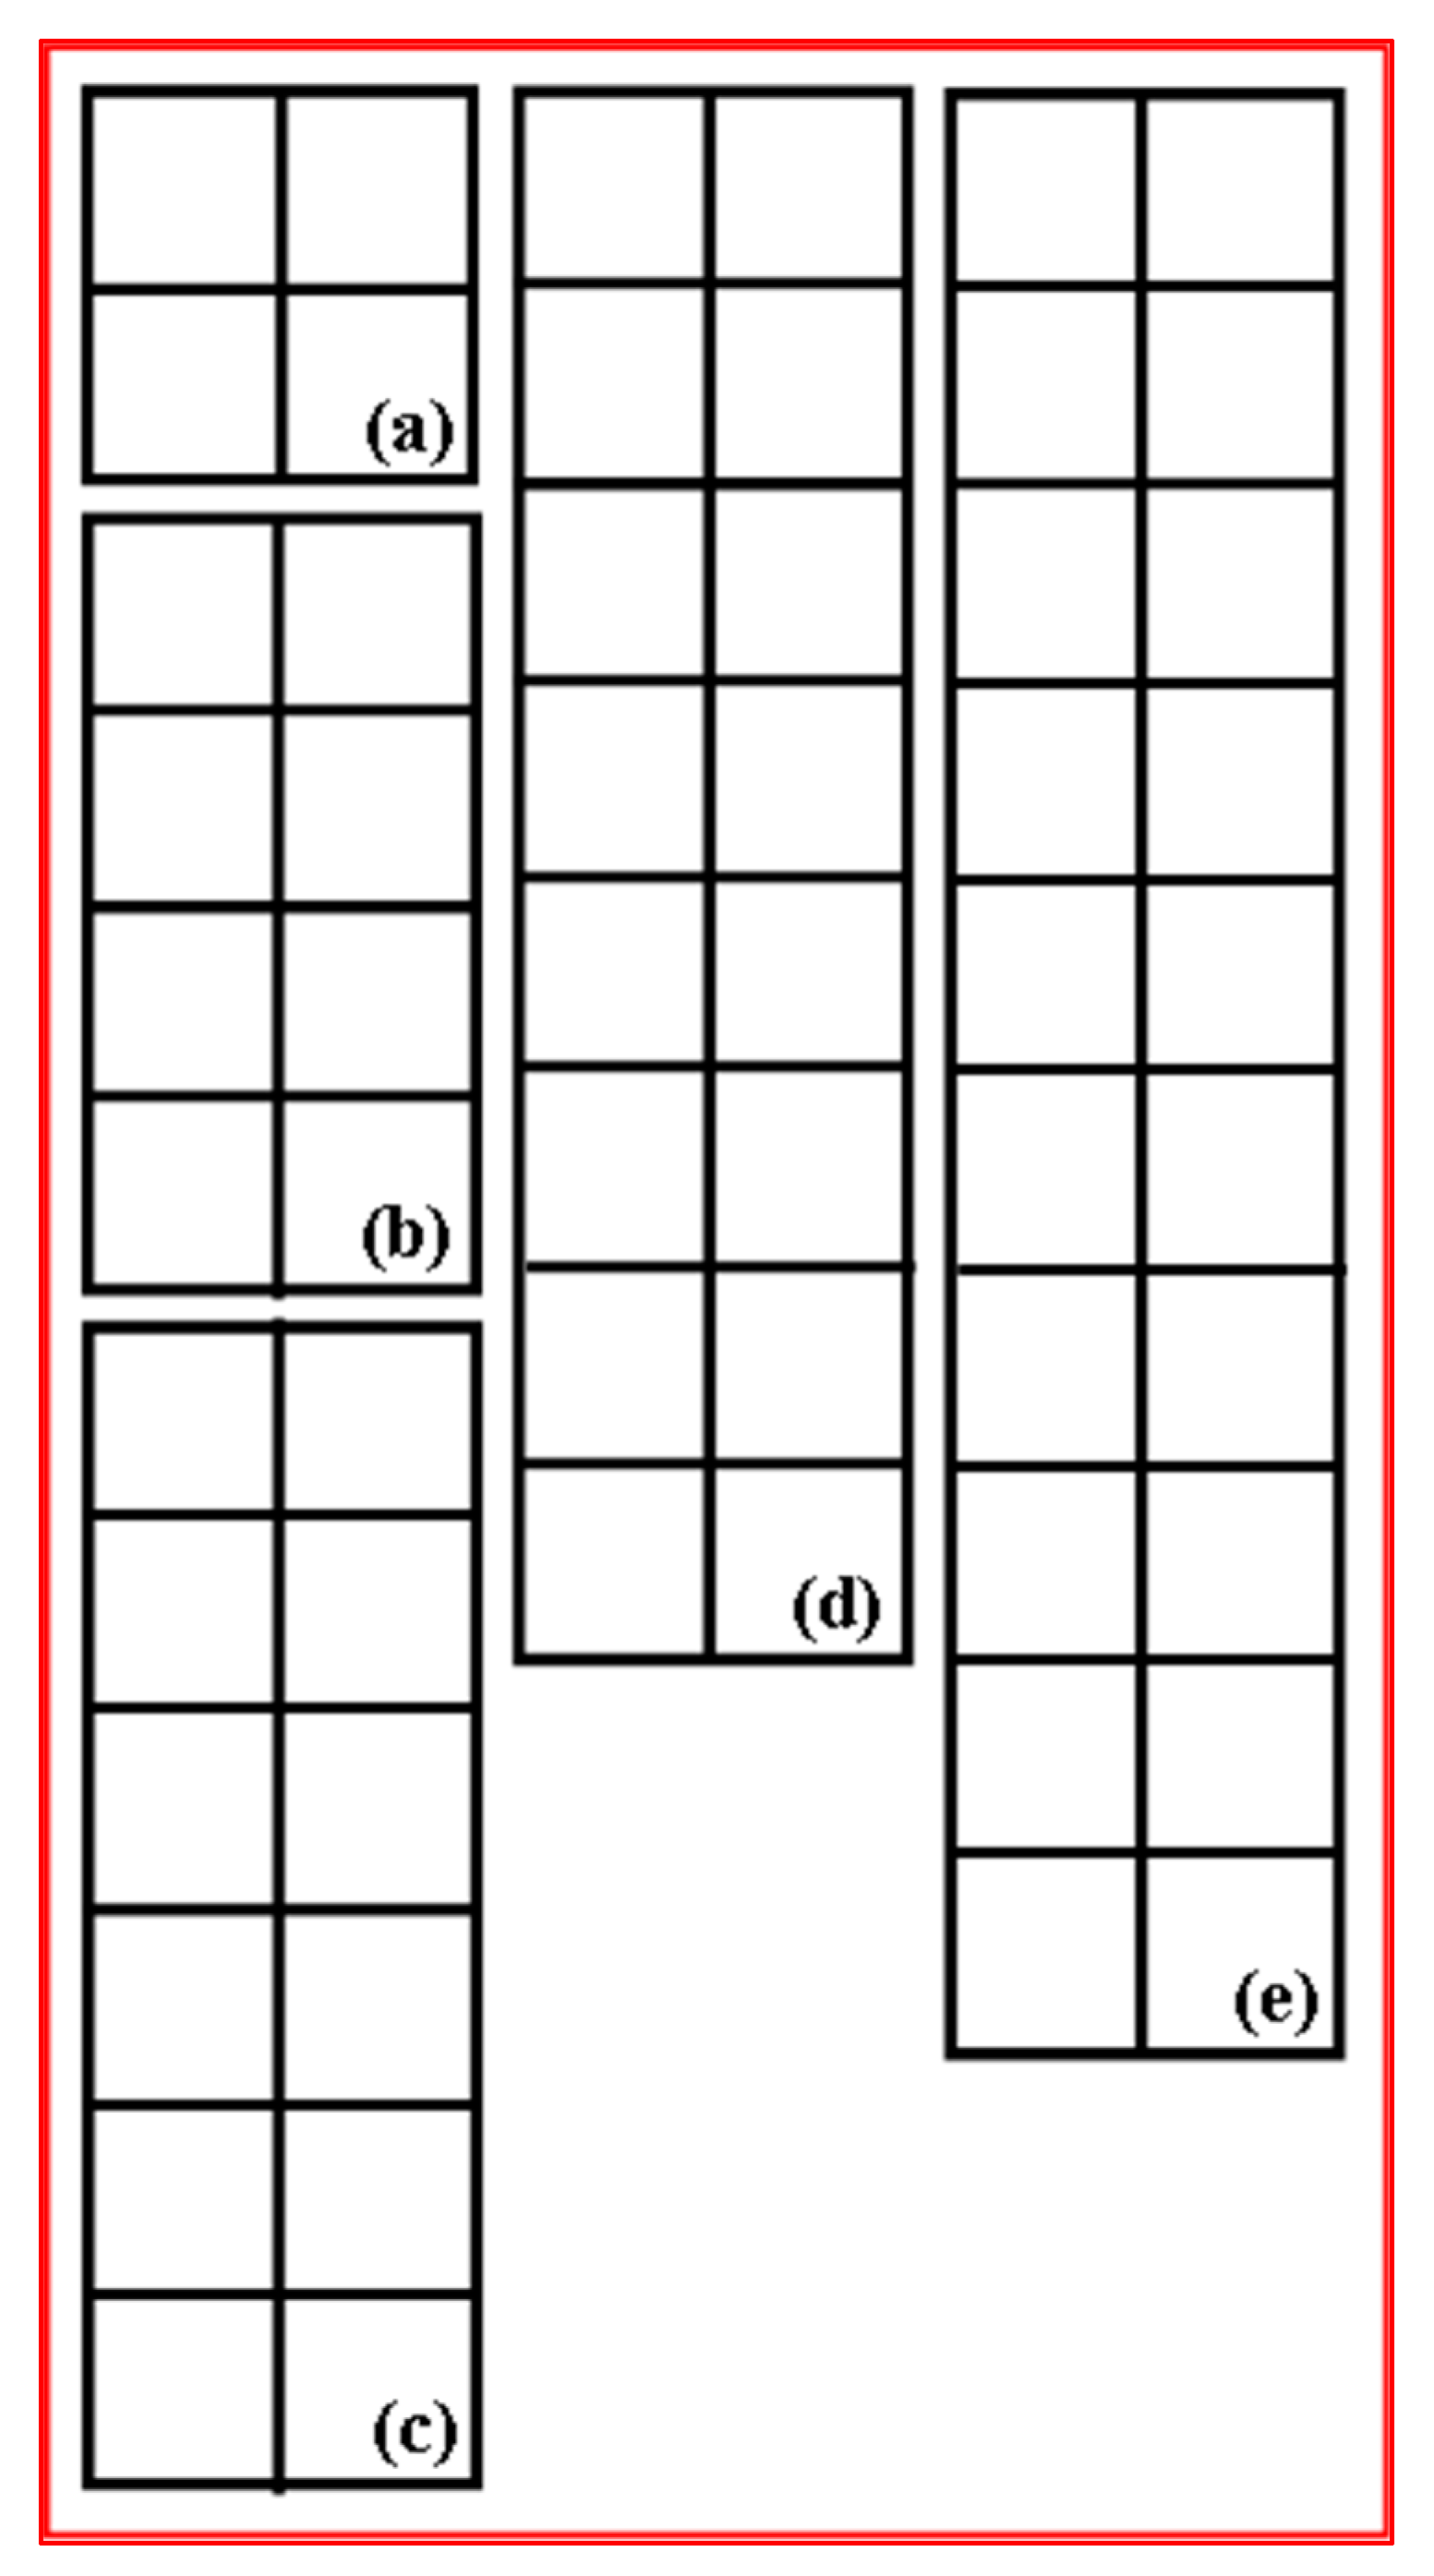
  • Output power was recorded with different antenna lengths. Other parameters were constant in these observations. Five antennas were used in this observation. The gap size was 24 × 24 cm2, the width of the antenna was 72 cm, and the wire diameter was 3.0 mm. The lengths of the antenna were 48 cm, 96 cm, 144 cm, 192 cm, and 240 cm, as shown in Figure 4.
  • Output power was recorded with different heights from the ground. Other parameters were constant during these observations. The antenna size was 72 × 72 cm2, the gap size was 24 × 24 cm2, and the wire diameter was 3.0 mm in these observations.
  • Output power was recorded in different cities. Other parameters were constant in these observations. The antenna size was 72 × 72 cm2, the gap size was 24 × 24 cm2, and the wire diameter was 3.0 mm in these observations. The speed of air was around 3.1 m/s, and the temperature was 33 °C.

4. Results and Discussion

In this research, the nature of charge flow in space near the ground was observed. To learn the nature of the output for a particular parameter, the values of other parameters should be kept constant, but this work is difficult to carry out accurately. This is because the values of airspeed, humidity, temperature, etc., are out of the control of human beings. The experiment was carried out repeatedly with records of environmental conditions such as the speed of the wind, humidity, and temperature. Using this trial-and-error method, the required (adjusted) data were collected. In the period of research, the space charge was very small, so a very small amount of power transferred from space to the ground.
Firstly, the output powers were observed to determine the nature of the space charge without connecting the transformer. It was observed that the nature of the charge was moderately negative. The positive charge appeared to be very rare with a relatively low value. This matches with the report in [25,26], because the charge separation occurred from the Earth to the ionosphere electric field, which indicates that the wind close to Earth should carry a negative charge. The output varied rapidly, and the polarity of the charge changed from time to time. After connecting the transformer in series, the output power became more stable due to the effect of the rectification circuit.
The variation in output power with the lengths of the gaps between the antennas is shown in Figure 5. The figure shows that the output powers zigzagged. The overall output decreased with the area of the antenna gaps. The square-shaped antennas collected the charge from the air. The antennas with smaller gaps were able to contact more air, so the output decreased with the antenna gaps. The square-shaped antennas collected the charge from the flowing air. The antennas with larger gaps were unable to collect the charge from the air.
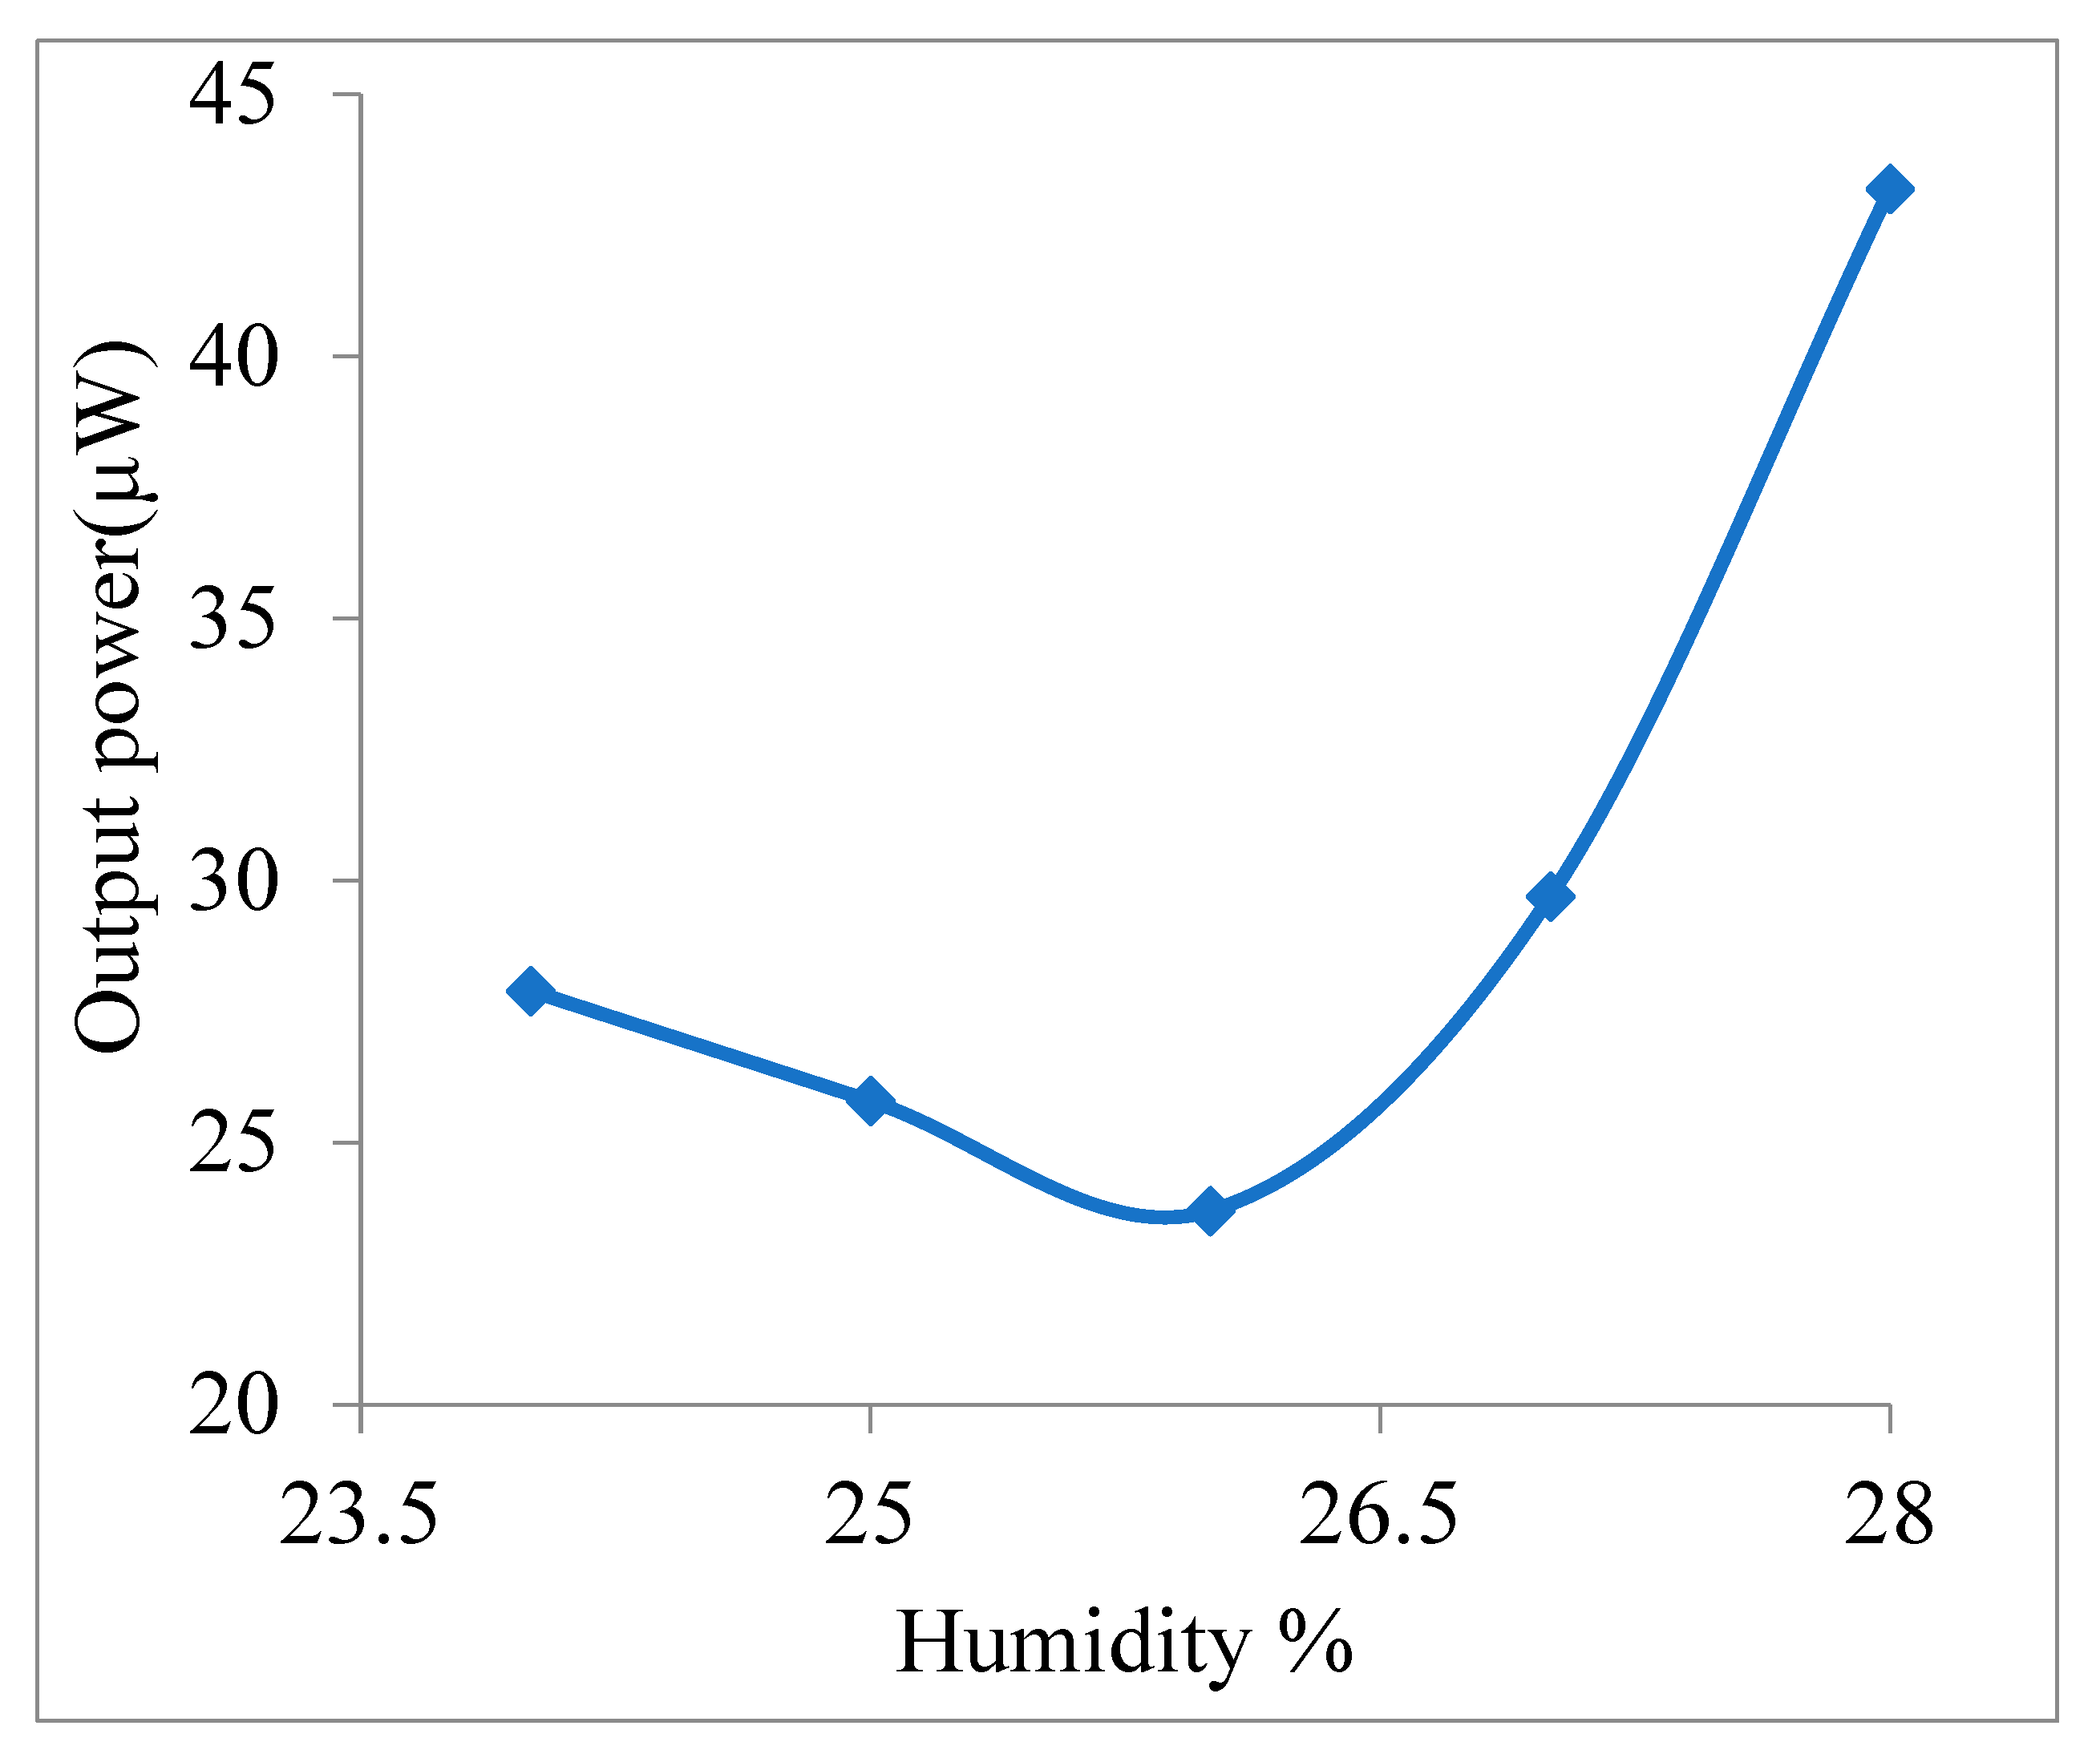
The variation in output power with the humidity is shown in Figure 6. The figure shows that the output was larger with higher humidity. Humidity is avital parameter of space charge. The output depends on the charge of the air, and conductivity depends on the humidity of the air. With the increase inhumidity, the conductivity of the air is increased. Thus, discharging is increased with humidity.
The output power was observed with the diameter of the antenna wire, and the result is shown in Figure 7. The figure shows that the output power increased with the diameters of the antenna wires. This is logical, because thicker wires are able to touch more air. The output should change with the speed of air.
To verify this technique, the output power was observed with the speed of air. Other parameters were constant during this observation. The results are shown in Figure 8. The graph shows that the output power increased with the speed of air. More charge was passed per second witha higher speed of air, so power increased with the speed of air. The zigzag shape indicates that the experimental error or deviation values of all other constant parameters or the charge of air were different in different places. The GI and copper materials were also compared in this observation. The output power with the copper wire antenna was larger than that of the GIantenna due to its better conductivity.
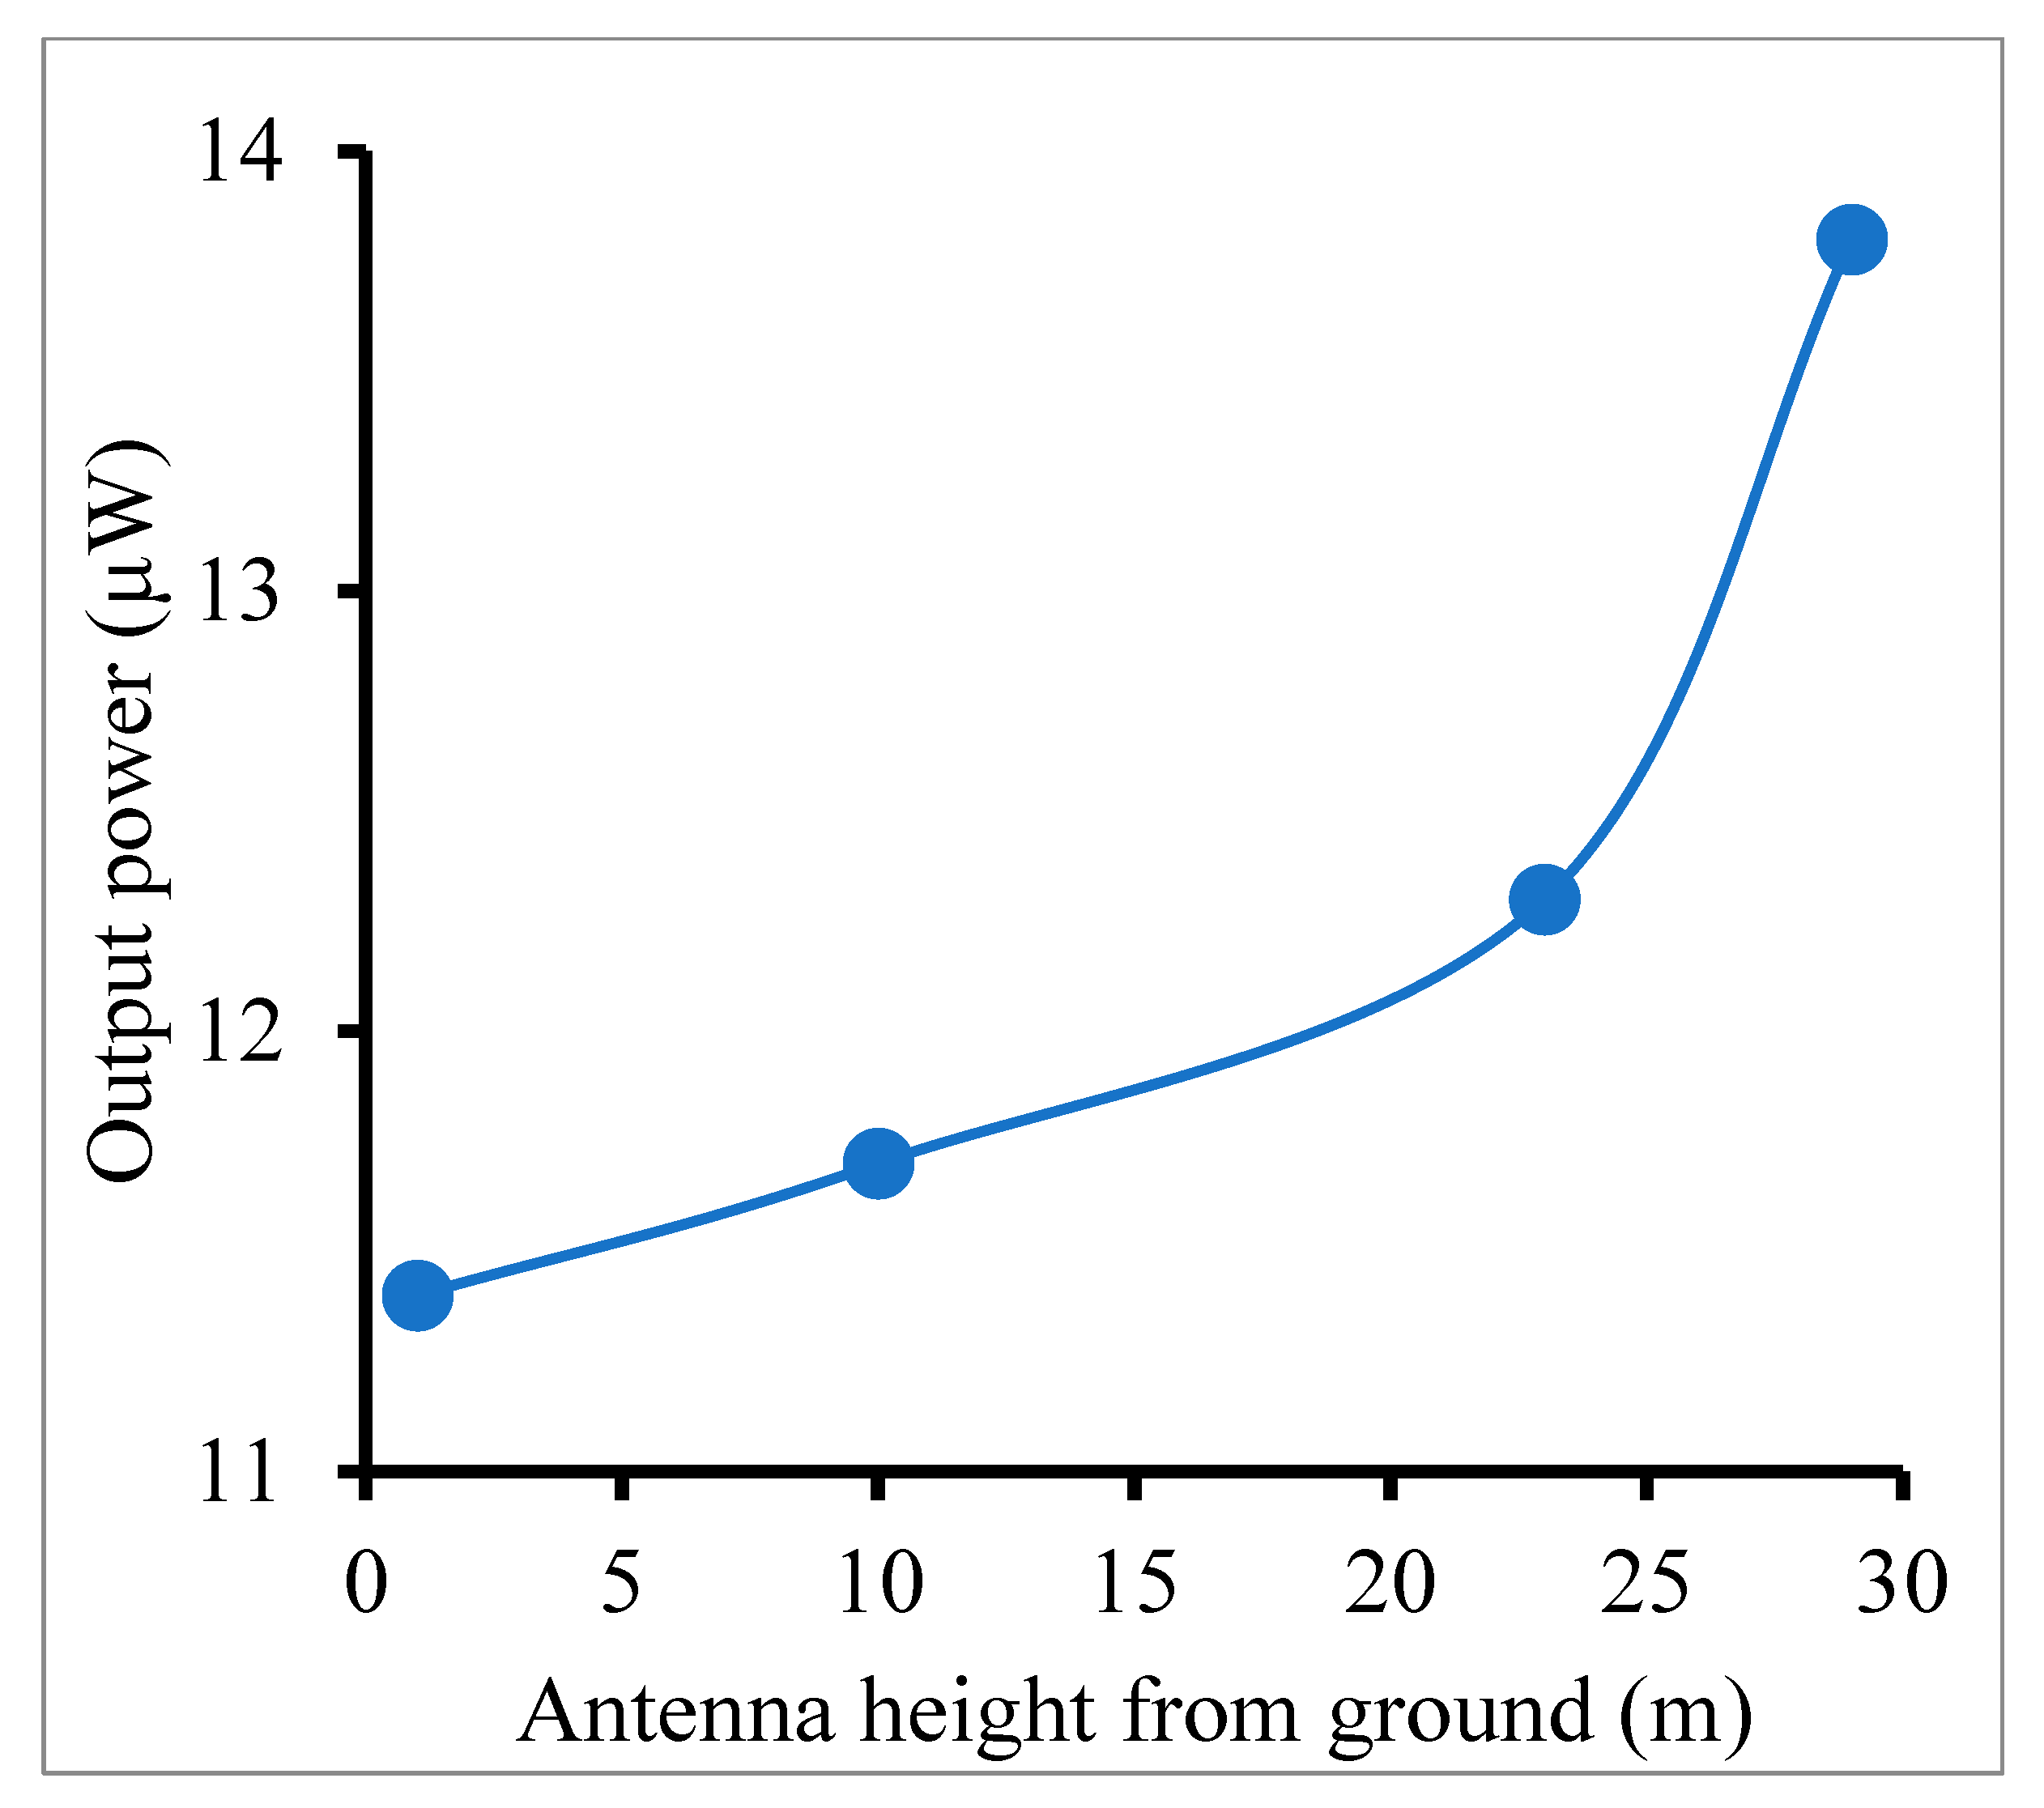
The variation in output power with the gross area of the antenna is shown in Figure 9. All antennas were made of a square-shaped gap of galvanized iron wire. The width of the antennas was constant (72 cm). Here, the varying parameter was the antenna length. The figure shows that the output power increased with antenna length. The gross area of the antenna increased with antenna length; therefore, the power increased. The effect of height from the ground was studied. Figure 10 shows the output power with the height from the ground.
From the figure, it can be concluded that a higher distance from the ground carries more electric charge. Lower levels in the air have many discharging opportunities. Trees, towers of transmitters, high-rise buildings, etc., are discharging media. So, the power in upper-level air is higher. In this system, the power will be collected from space using a special technique during all seasons of a year; in this way, the charge in air will be reduced, and then, the thunder and lighting will be reduced in the spring and summer seasons. Therefore, the technique creates a suitable energy source, and in parallel, it may create a danger-free environment.
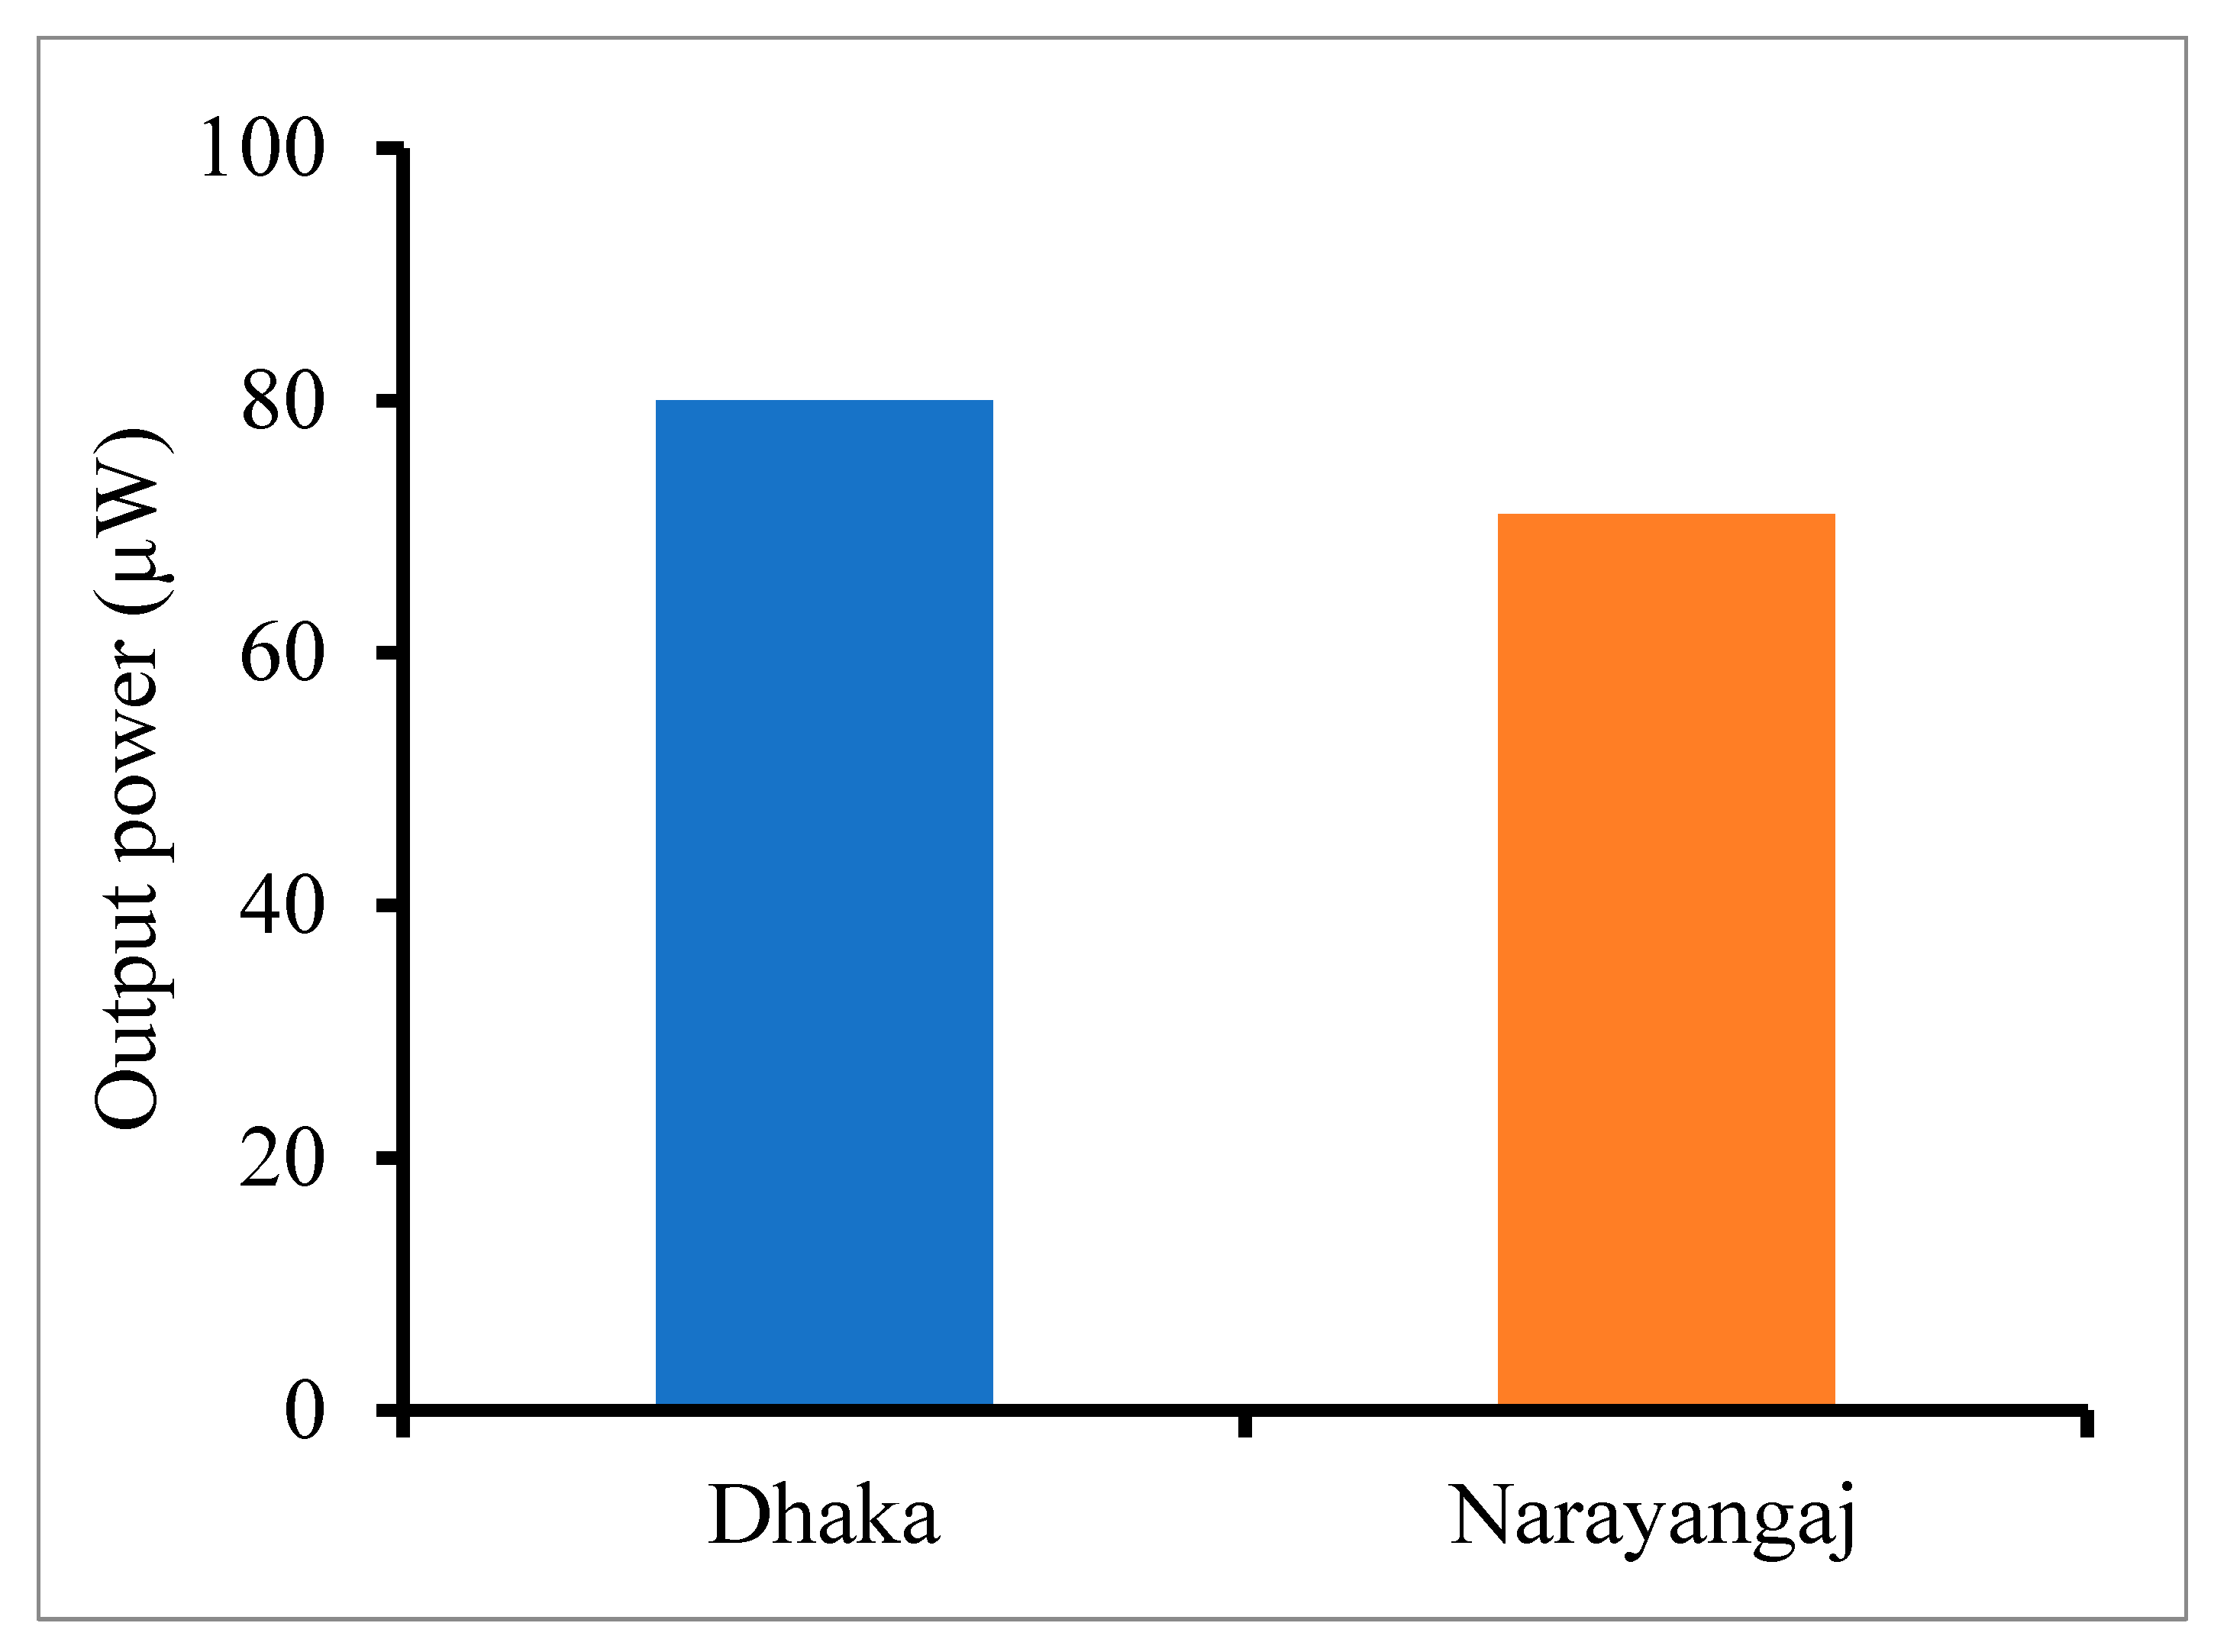
The speed, temperature, pressure, and humidity in the wind differed in the different locations. The natural and artificial causes of charge generation are different in each city. This is why the results regarding the power received changed. To verify this point, we observed the power in the cities of Dhaka and Narayanganj. We have tried to keep the other parameters constant. The results (Figure 5, Figure 6, Figure 7, Figure 8 and Figure 9) are similar in both cities, but the output power is larger in Dhaka than in Narayanganj, as shown in Figure 11. The population and industry are much larger in Dhaka than in Narayanganj; therefore, the artificial creation of wind charge is greater in Dhaka. This may be a cause of the generation of more electric power in Dhaka.

5. Conclusions

In this research, the wind charge was characterized in the cities of Dhaka and Narayanganj. The output power varied rapidly, and the polarity of the charge changed from time to time. The graph of output power versus the length of the antenna gap shows that the overall output decreased with the area of the antenna gap. After the transformer was connected in series, the output power became smoother. The results show that the output is significant under higher-humidity conditions. The output power increased with the diameters of the antenna wire and the speed of the air. The variation in output power with the gross area of the antenna shows that the output power increased with the area of the antenna. The results show that higher distances from the ground carried more electric charge, and copper wire is better than GI. More power is received in Dhaka city than that in Narayanganj. The research reveals that an electric power source may be developed using the process, although the cost of establishing such a system is expensive with respect to the power received. However, alternative and environmentally friendly power sources are important for sustainability, and in parallel, a danger-free atmosphere will help protect people and livestock from lighting. The measurement of the absolute charge of the wind will be carried out in our future research.

Author Contributions

Conceptualization, M.M.; methodology, M.M.; formal analysis, M.M.; investigation, Q.T.S.; data curation, resources, writing—original draft preparation, M.M.; supervision, U.S.; review, M.M., Q.T.S. and U.S. All authors have read and agreed to the published version of the manuscript.

Funding

This research received no external funding.

Institutional Review Board Statement

Not applicable.

Informed Consent Statement

Not applicable.

Data Availability Statement

Not applicable.

Acknowledgments

Injamul Hasan, Ifran Hossain Mollah, Shahadat Hossain, Masum Billah, Alamin, Khandokar Salauddin, and Jakirul Islam helped directly with the experimental work. The authors are grateful to the undergraduate students. Bangladesh University has helped financially, which helped to conduct the research although the amount was small. The authors are grateful to the administration of Bangladesh University. Sheikh Alauddin, Head, Department of English, Bangladesh University helped improve the quality of the paper. The authors are grateful to him for his kind efforts.

Conflicts of Interest

The authors declare no conflict of interest.

References

  1. United Nations Environment Programme (UNEP). Global Environment Outlook (GEO)—2000; Earth—Scan Publications Ltd.: London, UK, 2000. [Google Scholar]
  2. Spencer, M.; Tipper, W.A.; Coats, E. UK Offshore Wind in the 2020s. In Creating the Conditions for Cost Effective Decarbonisation; Green Alliance: London, UK, 2014. [Google Scholar]
  3. Hydroelectric Power. Reclamation Managing Water in the West; Power Resource Office—US Department of Interior, Bureau of Reclamation: Washington, DC, USA, 2005. [Google Scholar]
  4. Vikas, M.; Rao, S.; Seelam, J.K. Tidal energy: A review. In Proceedings of the International Conference on Hydraulics, Water Resources and Coastal Engineering (Hydro2016), Pune, India, 8–10 December 2016. [Google Scholar]
  5. Wang, Z.J.; Wang, Z.W. A review on tidal power utilization and operation optimization. IOP Conf. Ser. Earth Environ. Sci. 2019, 240, 052015. [Google Scholar] [CrossRef]
  6. Muhibbullah, M.; Sadat, Q.T.; Rahman, S.K.; Sutradhar, A.C.; Shaikh, M.E. Characterization of a Linear Generator for Sea Wave. In Proceedings of the 2020 IEEE Region 10 Symposium (TENSYMP), Dhaka, Bangladesh, 5–7 June 2020. [Google Scholar] [CrossRef]
  7. Muhibbullah, M.; Ichimura, M. Fabrication of Heterojunctions Based on Chemically Deposited Copper Oxide Thin Films for Solar Cell Application. Trans. Mater. Res. Soc. Jpn. 2011, 36, 195–198. [Google Scholar] [CrossRef]
  8. Rowe, M.D. Thermoelectric Power; John Wiley & Sons, Inc.: Hoboken, NJ, USA, 1999. [Google Scholar]
  9. Sharma, A.; Lee, J.H.; Kim, K.H.; Jung, J.P. Recent Advances in Thermoelectric Power Generation Technology. J. Microelectron. Packag. Soc. 2017, 24, 9–16. [Google Scholar] [CrossRef]
  10. Abu, M.; Md, S.A.; Asha’ri, H. Compact microstrip monopole antenna with enhanced gain using artificial magnetic conductor (AMC). J. Phys. Conf. Ser. 2010, 1502, 012001. [Google Scholar] [CrossRef]
  11. Supreeyatitikul, N.; Jantori, S.; Boontamchau, P. Design of circular monopole antenna using a ground plane modifications for LTE and UWB Applications. In Proceedings of the 7th International Conference on Information, Communication and Networks, Macau, China, 23–26 April 2019. [Google Scholar] [CrossRef]
  12. Khalifa, M.; Khashan, L.; Fawzy, I.B.H. Broadband printed-dipole antenna for 4g/5g smartphones. J. Phys. Conf. Ser. 2020, 1447, 012049. [Google Scholar] [CrossRef]
  13. Muhibbullah, M.; Alhazime, A.A.; Amin, M.; El-Zohary, S.E. Antenna designing for efficient rectenna solar cells. Phys. Scr. 2022, 97, 065505. [Google Scholar] [CrossRef]
  14. Holle, L.R. The Number of Documented Global Lighting Fatalities. In Proceedings of the 24th International Lighting Detection Conference and 6th International Lighting Meteorology Conference, San Diego, CA, USA, 18–21 April 2016. [Google Scholar]
  15. Holle, L.R. A summary of recent national-scale lighting fatality studies. Weather Clim. Soc. 2016, 8, 35–42. [Google Scholar] [CrossRef]
  16. Holle, L.R. Lighting-cuased deaths and injuires related to agriculture. In Proceedings of the 24th International Lighting Detection Conference and 6th International Lighting Meteorology Conference, San Diego, CA, USA, 18–21 April 2016; p. 4. [Google Scholar]
  17. Baddeley, P.F.H. Whirlwinds and Dust-Storms of India; Bell & Daldy: London, UK, 1860; pp. 3–4. [Google Scholar]
  18. Shaw, P.E. The electrical charges from like solids. Nature 1926, 118, 659–660. [Google Scholar] [CrossRef]
  19. Lowell, J.; Truscott, W.S. Triboelectrification of identical insulators. J. Phys. D Appl. Phys. 1986, 19, 1273–1280. [Google Scholar] [CrossRef]
  20. Shaw, P.E. Electrical separation between identical solid surfaces. Proc. Phys. Soc. 1927, 39, 449–452. [Google Scholar] [CrossRef]
  21. Lacks, D.J.; Levandovsky, A. Effect of particle size distribution on the polarity of triboelectric charging in granular insulator systems. J. Electrost. 2007, 65, 107–112. [Google Scholar] [CrossRef]
  22. Wu, Y.; Castle, G.S.P.; Inculet, I.I.; Petigny, S.; Swei, G. Induction charge on freely levitating particles. Powder Technol. 2003, 135–136, 59–64. [Google Scholar] [CrossRef]
  23. Whitesides, G.M.; Carty, M.L.S. Electrostatic charging due to separation of ions at interfaces: Contact electrification of ionic electrets. Angew. Chem. Int. Ed. 2008, 47, 2188–2207. [Google Scholar] [CrossRef]
  24. Ristenpart, W.D.; Bird, J.C.; Belmonte, A.; Dollar, F.; Stone, H.A. Non-coalescence of oppositely charged drops. Nature 2009, 461, 377–380. [Google Scholar] [CrossRef] [PubMed]
  25. Wilson, C.T.R. Some thundercloud problems. J. Frankl. Inst. 1929, 208, 1–12. [Google Scholar] [CrossRef]
  26. Coates, A.J.; Wellbrock, A.; Lewis, G.R.; Jones, G.H.; Young, D.T.; Crary, F.J.; Waite, J.H., Jr. Heavy negative ions in Titan’s ionosphere: Altitude and latitude dependence. Planet. Space Sci. 2009, 57, 1866–1871. [Google Scholar] [CrossRef]
  27. Gomes, C. Lighting safety of animals. Int. J. Biometeorol. 2012, 56, 1011–1023. [Google Scholar] [CrossRef] [PubMed]
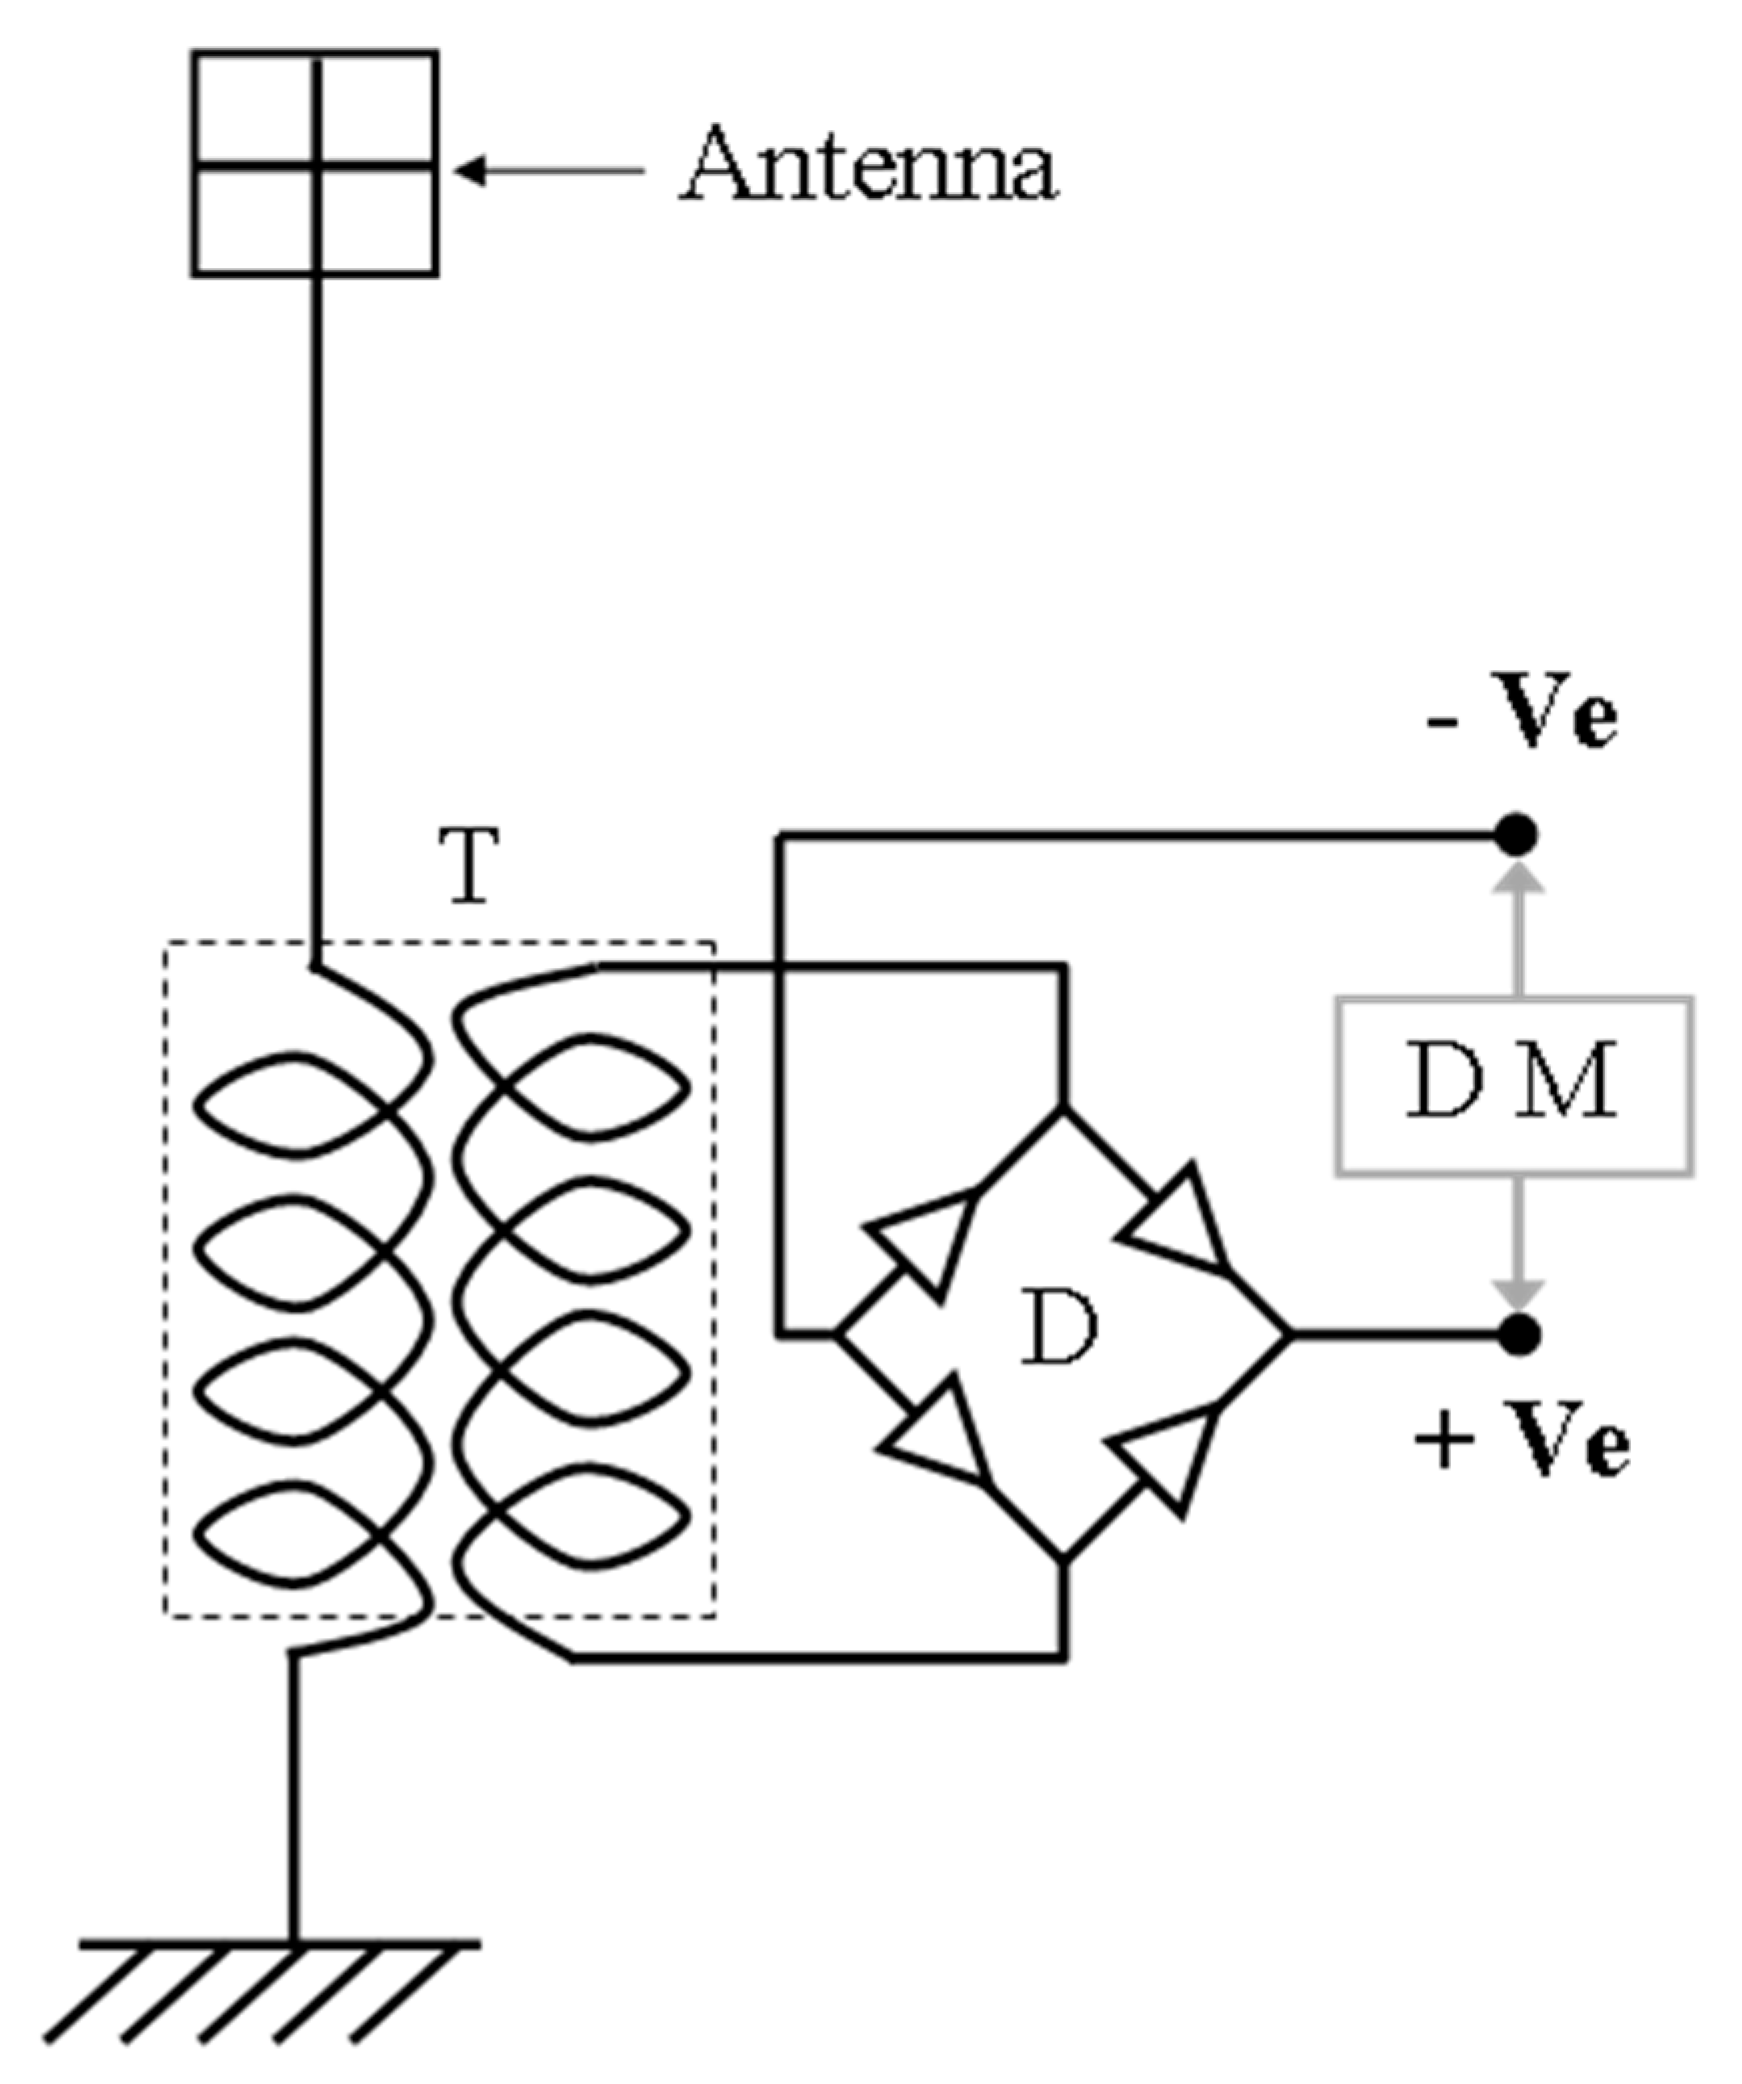
Figure 1. Schematic diagram of the electric power collector from the wind.
Energies 15 06997 g001
Figure 2. A set of antennas with different antenna gaps in which the wire diameter was 1.6 mm and the gross area was 72 × 72 cm2. The areas of the gaps were (a) 6 × 6 cm2, (b) 12 × 12 cm2, (c) 24 × 24 cm2, (d) 36 × 36 cm2, and (e) 72 × 72 cm2.
Energies 15 06997 g002
Figure 3. A set of antennas with different diameters of the wire in which the gross area was 72 × 72 cm2 and the area of the gap was 24 × 24 cm2. The wire diameters were (a) 0.5 mm, (b) 1.2 mm, (c) 2.4 mm, (d) 2.6 mm, and (e) 3.0 mm.
Energies 15 06997 g003
Figure 4. A set of antennas with different antenna lengths in which the diameter of wire was 3.0 mm and the area of the gap was 24 × 24 cm2. The width was 72 cm, and the lengths were (a) 48 cm, (b) 96 cm, (c) 144 cm, (d) 192 cm, and (e) 240 cm.
Energies 15 06997 g004
Figure 5. Output power with the antenna gaps. Other parameters were constant. The speed of air was around 4 m/s, temperature was 32 °C, gross area of each antenna was 72 × 72 cm2, and the wire diameter was 2.5 mm.
Energies 15 06997 g005
Figure 6. Output power with the humidity. Other parameters were constant. The speed of air was around 2.6 m/s, temperature was 34 °C, gross area of each antenna was 72 × 72 cm2, and the square-shaped antenna gap was 24 × 24 cm2.
Energies 15 06997 g006
Figure 7. Output power with diameter of the antenna wire. Other parameters were constant. The speed of air, temperature, humidity, antenna gap, and height of the antenna were constant. The square-shaped antenna gap was 24 × 24 cm2.
Energies 15 06997 g007
Figure 8. Output power with the speed of air. The square-shaped antenna gap was 24 × 24 cm2, temperature was 32 °C, humidity was 40%, gross area of each antenna was 72 × 72 cm2, the wire diameter was 2.5 mm, and the height of the antenna from the ground was 30 m.
Energies 15 06997 g008
Figure 9. Output power with length of antenna. Other parameters were constant. Speed of air was around 3.5 m/s, and wire diameter was 3.0 mm. All other parameters were similar to those in Figure 8.
Energies 15 06997 g009
Figure 10. Output power with antenna height from ground. Other parameters were constant with those in Figure 8.
Energies 15 06997 g010
Figure 11. Output power for two cities. Other parameters were constant with those in Figure 8.
Energies 15 06997 g011
Publisher’s Note: MDPI stays neutral with regard to jurisdictional claims in published maps and institutional affiliations.