Article

Potential for Underground Storage of Liquid Fuels in Bedded Rock Salt Formations in Poland

by
Leszek Lankof
1,
Stanisław Nagy
2,
Krzysztof Polański
2,* and
Kazimierz Urbańczyk
3
1
Mineral and Energy Economy Research Institute of the Polish Academy of Sciences, Wybickiego 7A, 31-261 Krakow, Poland
2
Faculty of Drilling, Oil and Gas, AGH University of Science and Technology, Mickiewicza 30 Av., 30-059 Krakow, Poland
3
Ubroservice, ul. Lea 149A, 30-133 Krakow, Poland
*
Author to whom correspondence should be addressed.
Energies 2022, 15(19), 7005; https://doi.org/10.3390/en15197005
Submission received: 26 August 2022 / Revised: 16 September 2022 / Accepted: 20 September 2022 / Published: 24 September 2022

Abstract

:
The paper aims to give a universal methodology for assessing the storage capacity of a bedded rock salt formation in terms of the operational and strategic storage facilities for liquid fuels. The method assumes the development of a geological model of the analyzed rock salt formation and the determination of the salt caverns’ size and spacing and the impact of convergence on their capacity during operation. Based on this method, the paper presents calculations of the storage capacity using the example of the bedded rock salt formations in Poland and their results in the form of storage capacity maps. The maps show that the analyzed rock salt deposits’ storage capacity in northern Poland amounts to 7.1 B m3 and in the Fore-Sudetic Monocline to 10.5 B m3, in the case of strategic storage facilities. The spatial analysis of the storage capacity rasters, including determining the raster volumes and their unique values, allowed us to quantify the variability of the storage capacity in the analyzed rock salt deposits.

1. Introduction

The method of storing crude oil and liquid hydrocarbons in solution-mined caverns was patented in 1916 in Germany and widely used in the 1950s in the USA and Great Britain [1]. Today, it is the most commonly used method of underground storage of crude oil, heating oil, diesel fuel, liquid propane–butane (LPG), and some supercritical gases such as ethylene and propylene. There are storage facilities of strategic reserves, ensuring the continuity of supply in a crisis, emergency ones—in the event of the failure or repair of the transmission pipelines—seasonal and peak ones, balancing petroleum product demands, and cyclical ones, which are profitable in price fluctuations [2,3,4,5].
One of the significant problems in constructing an underground storage facility in bedded rock salt deposits is the appropriate site selection when considering the planned storage capacity. There are numerous publications on assessing the storage capacity potential of rock salt deposits in terms of natural gas [6,7], compressed air [8], or hydrogen [9,10]. However, no comprehensive study on assessing the storage potential of liquid fuels in bedded rock salt deposits is known to the authors.
Therefore, the article’s purpose is to present the methodological approach for determining the capacity of bedded rock salt formations, considering the critical conditions affecting liquid fuel storage in salt caverns. The methodology allows for the development of capacity maps to facilitate the site selection for the storage facility within the bedded rock salt deposit.
The approach considers operational caverns, intended to be emptied several times with water or brine of low concentration, and strategic reserve caverns, rarely emptied, and only with saturated brine. The methodology considered the significant factors influencing the analyzed rock salt deposit storage capacity, such as cavern dimension changes, spacing, and convergence. It considers the variable size of caverns, depending on the thickness of the rock salt layer, and cavern leaching during operation. As the stored liquid fuels are rarely withdrawn with a technical brine saturation of 205–310 kg/m3, the consequence is that after each withdrawal of the stored liquid fuel, the brine tends to maximum saturation, dissolving the surrounding rock salt and enlarging the cavern [11,12]. It is possible to forecast cavern enlargement by extrapolating the echo sounder measurements performed after the subsequent cavern emptying [13,14].
An increase in insoluble content in the sump should be anticipated at the design stage, considering the cavern enlargement during its operation. In addition, the appropriate brine level should be ensured in order to not block the brine string shoe after several emptyings of the cavern, as pointed out by Urbańczyk [12].
Another factor in the methodology is the distance between the caverns. Two criteria for assessing the maximum allowable dimensions of the caverns are usually applied. The first assumes that the ratio of the average thickness of the safety pillar between the caverns to the cavern diameter P/D should not be lower than 1.78. The second criterion assumes that the ratio of the minimum pillar thickness to the maximum cavern diameter, 3D-P/D, should not be lower than 1 [14]. As it would be challenging to meet these conditions in the strategic petroleum reserves (SPR) caverns, Park and Ehgartner [14] analyzed the critical salt caverns individually. It turns out that the safety factors based on the dilatation criterion in individual cases even allow a P/D value of 0.4. Ratigan et al. [13] suggest that the pillar thickness can be reduced by half at the expense of the cavern diameters. Zhang et al. [15,16] indicate that for the SPR in Jintan, it is possible to lower the P/D ratio to 1.5 at the design stage. The allowable cavern spacing grid modulus was determined based on the method for designing the cavern fields used in Poland [17,18].
Like all salt caverns, liquid fuel storage caverns lose their volume due to convergence. Therefore, its estimation has been an obligatory element of the cavern stability analysis for many years. Convergence in the case of liquid fuel storage caverns plays a positive role. The convergence rate is higher in the lower part of the cavern, where leaching is most significant; so, the cavern’s size grows slightly slower than that which results from the saturation of the operating brine. On the other hand, convergence greatly complicates the final abandonment of caverns when they are no longer suitable for further storage after a certain number of storage cycles. The increase in pressure inside a sealed cavern due to convergence may lead to fracturing of its roof, resulting in the loss of cavern tightness [19,20,21]. To a large extent, the risk of cavern roof fracturing depends on the rate of the pressure buildup [22,23].
The innovation of the research was the assessing of the storage capacity of the rock salt deposit based on its depth and thickness and the development of contour maps of the storage capacity. The storage capacity maps are helpful for preliminary site selections for underground oil and fuel storage facilities in rock salt deposits. They allow the determination of the surface area of the deposit necessary to build a facility with a given storage capacity and the amount of liquid fuel that may be stored in a specific part of the deposit.

2. Materials and Methods

2.1. Research Area

The research area covers the rock salt deposits in the northern part of the Polish Zechstein Basin and the Fore-Sudetic Monocline. The analysis included the salt deposits occurring at a depth of up to 1800 m below ground level (bgl). The adopted criterion allowed us to determine the occurrence of rock salt deposits subjected to the analysis of the storage capacity of liquid fuels (Figure 1).

2.1.1. Bedded Rock Salt Formation in the Northern Part of the Zechstein Basin

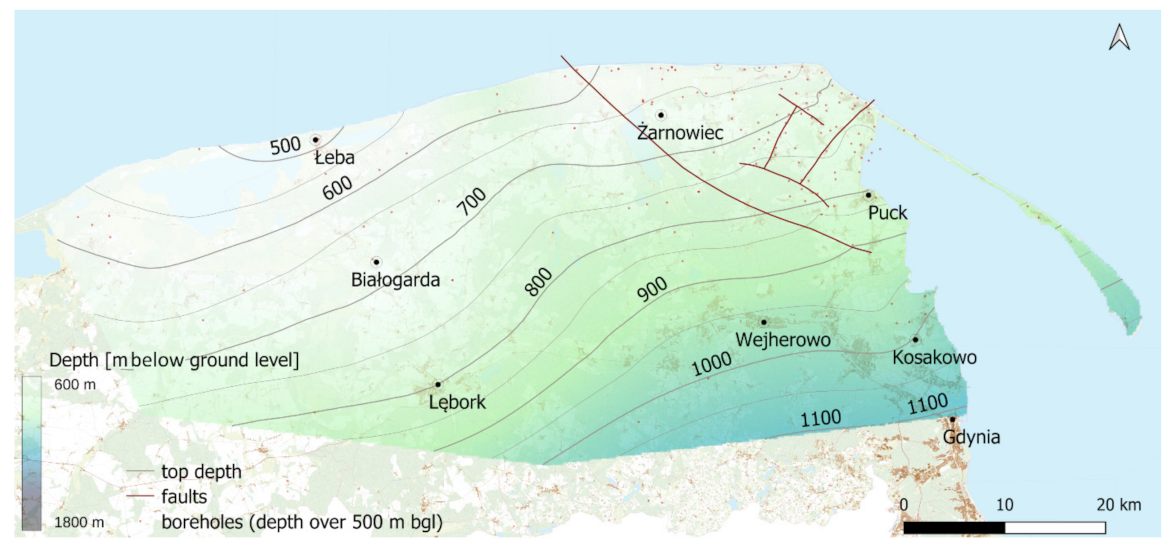
Bedded rock salt formation in the region of northern Poland occurs in the marginal zone of the East European Platform, on the north-western slope of the Peri-Baltic Syneclise. The location within a stable platform meant that the deposition and distribution of the Zechstein deposits were mainly determined by facies conditions [25]. In this region, rock salt occurs only within one cyclothem PZ1, as the oldest unit of rock salt Na1 [26]. The rock salt layers occurring in the Peri-Baltic Syneclise vary in thickness from a few meters to over 220 m. The salt formation is slightly inclined. The regional dip towards SSE does not exceed 10°. The rock salt top occurs at a depth of 550 m bgl in the vicinity of Łeba to over 1100 m bgl in the southern part of the discussed area (cf. Appendix B).

2.1.2. Bedded Rock Salt Formation in the Fore-Sudetic Monocline

In the Fore-Sudetic Monocline, rock salt occurs within three cyclothems. Because of the thickness of the individual layers, the oldest rock salt is the most suitable for underground storage in salt caverns. The thickness of the oldest salt layer is diverse. It ranges from a few meters near the southern border to a hundred and several dozen meters in the northern part, locally exceeding 300 m (cf. Appendix B). The oldest rock salt top’s minimum depth is 700 m bgl. Together with other rocks building the Fore-Sudetic Monocline, the rock salt layers dip gently from 2° to 5° towards the NE [27]. Numerous dislocation systems occur in the Fore-Sudetic Monocline in the Permian and Triassic deposits, which should be considered when planning underground storage caverns in this area.

2.2. Methods for Assessing the Storage Capacity of the Rock Salt Layer

The storage capacity for liquid fuels was evaluated for two types of cavern:
  • strategic reserves caverns, rarely emptied, and only with saturated brine;
  • operational storage caverns, intended to be emptied several times with water or brine of low concentration.
In the case of the operational caverns, the storage capacity was estimated after the first filling and after the last emptying with freshwater.
The methodology initially assumes the determination the shape of the storage cavern and the volume of the storage part of the cavern. For this purpose, appropriate criteria for the depth and thickness of the rock salt layer were adopted, considering the rock salt thickness that must be left under and above the cavern for the safe operation of the storage facility. Then, the cavern spacing and the surface area per storage cavern were determined to calculate the storage capacity of the rock salt layer per area. Next, the initial and maximum diameters of the storage caverns were determined using the relationships for caverns producing brine (cf. Appendix A). The next step was to define the formulas based on which the storage capacity of liquid fuels in the rock salt layer was calculated. The impact of convergence on the storage caverns was also considered and incorporated into the final calculation formulas. Finally, the calculation results were presented in maps of the storage capacity per area. In addition, the preliminary analysis of the storage capacity rasters was also carried out. The study included the determination of the volume and the unique values of the individual rasters using QGIS software. QGIS is a free and open-source desktop application that supports the viewing and analyzing of geospatial data. The built-in raster analysis module allowed for a precise determination of the relationship between the surface area of the analyzed salt layer and its storage capacity.

3. Theoretical Background of the Methodology

3.1. Cavern Size

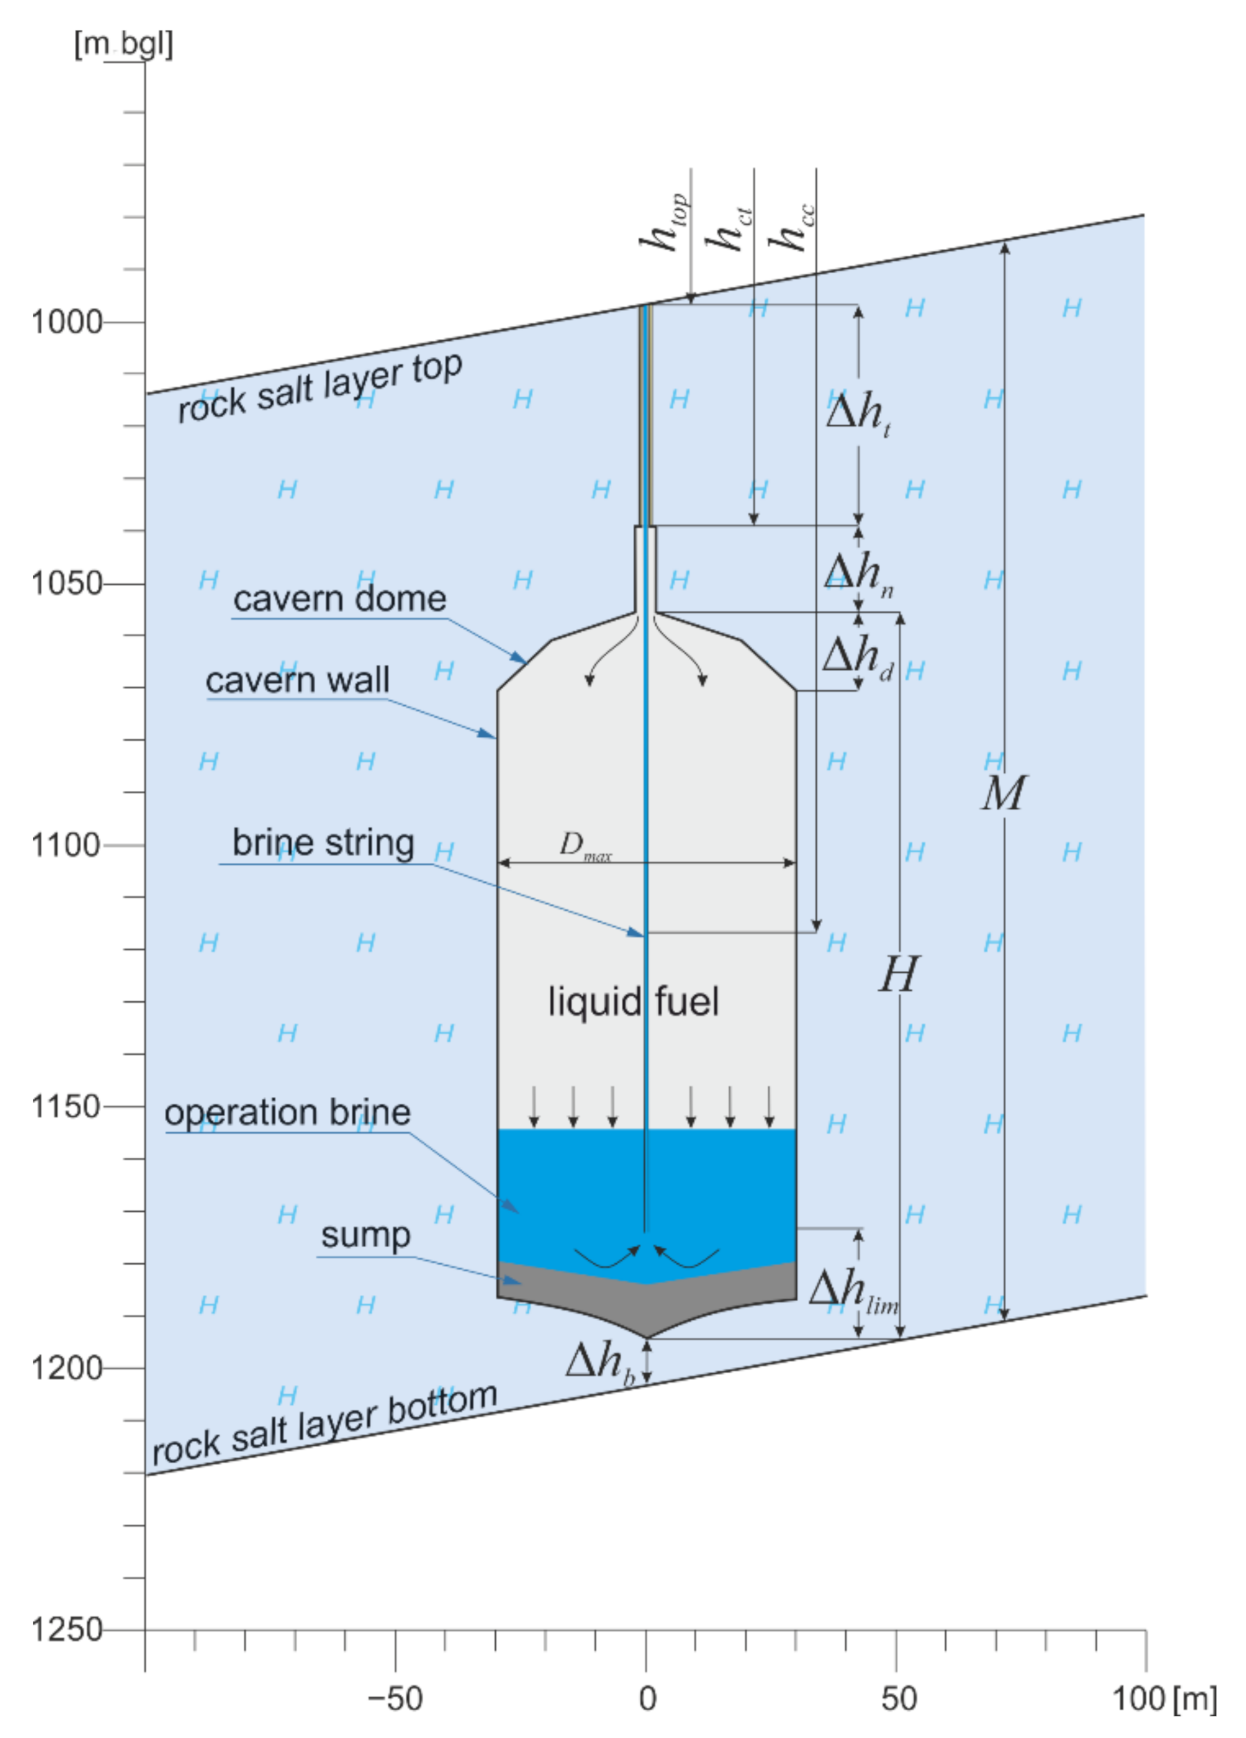
The volume of the caverns depends on their shape, height, and diameter. The shape of storage caverns has been considered in numerous publications [11,28,29]. The cavern shape shown in Figure 2 was adopted to analyze the storage capacity.
The height of the caverns in the bedded rock salt formations depends on the deposit thickness and the total thickness of the rock salt left above and below the storage cavern, Δhsum.
Δ h s u m = Δ h t + Δ h n + Δ h b ,
where Δht is the thickness of the rock salt layer above the cavern [m], Δhn is the height of the cavern neck [m], and Δhb is the thickness of the rock salt layer below the cavern [m].
In the case of storage caverns for liquid fuels, the cemented casing shoe’s depth and the cavern roof’s depth do not affect the head pressures. Therefore, the thickness of the rock salt above the storage cavern, Δht, is assumed to be 30 m. The length of the cavern neck, Δhn, i.e., a bare borehole widened by short-term leaching to a diameter of 2 m, was assumed to be 15 m. The 5 m thickness of the protective layer of rock salt below the cavern, Δhb, was assumed.
In the horizontal layers, 50 m is the minimum thickness of the rock salt left above and below the storage cavern. In the case of the monoclinal occurring layers, this value depends on the dip angle. In the case of the analyzed layers, where the dip reaches 10°, a thicker rock salt of 45 m above the storage cavern was assumed. According to the authors, it is entirely safe and enables the construction of tight and adequately durable cementation. As a result, the total thickness of the rock salt left above and below the storage cavern is 65 m. Therefore, the cavern height H for the layer thickness M in meters defines Formula (2):
H = M Δ h s u m = M 65   m .
The above assumptions adopted by the authors were based on the cavern field design practice used in Poland [17,30].
The central part of the cavern (Figure 2) is a cylinder with the target diameter Dmax. The cavern’s dome approximates a cone with a height of 1/3 Dmax, and the cavern’s sump approximates a cone with a height of 1/6 Dmax. The volume V of such a cavern may be defined by Formula (3):
V = π 12   D m a x 2   ( 3 H D m a x ) ,
where Dmax represents the target diameter [m]. The leaching conditions mainly determine the value of the maximum cavern diameter. In a homogeneous rock salt layer, the cavern is leached approximately axially symmetrically, and its diameter reaches two-thirds of the cavern height. With larger diameters, the cavern’s shape deviates from the regular one.
The storage volume of the cavern is limited by the column of operation brine below the stored product at least 10 m high. It is caused by keeping the appropriate distance from the sump filled with insoluble materials. Additionally, a column of insoluble materials of about 10 m accumulating in the sump should be considered. The cavern is never emptied to the top to protect the dome against leaching. The height of the storage zone, Hm, may be defined by Formula (4), considering these limitations.
H m = H D m a x 3 Δ h l i m ,
where Δhlim is the limitation in the height of the cavern storage zone [m]. Therefore, the volume of the storage zone, Vm, may be approximated by Formula (5):
V m = π 4   D m a x 2   H m = π 4   D m a x 2 ( H D m a x 3 Δ h l i m ) .

3.2. Cavern Spacing

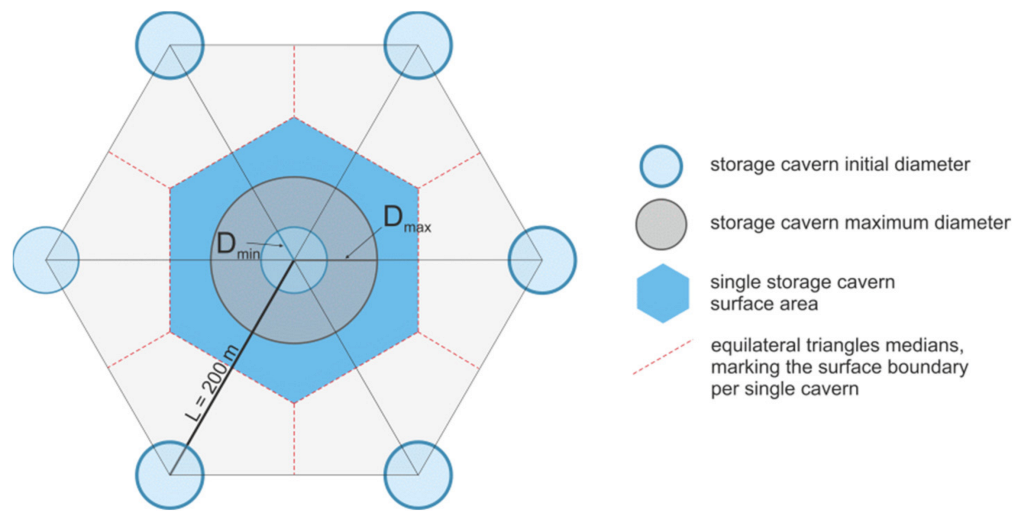
In the estimations, the cavern spacing in a triangular grid with a side of L = 200 m was assumed to avoid the interaction between caverns (Figure 3). In the case of storing liquid fuels, the distance between the caverns may be smaller than in the case of natural gas or hydrogen. When storing compressed gases, the cavern spacing is usually around 250 m. The cavern spacing’s impact on cavern stability and performance has been discussed in many studies [14,31,32].
With the assumed cavern spacing grid, the area assigned to a single cavern S might be calculated by Formula (6):
S = L 2 3 2 ,
where L is the cavern spacing modulus [m]. In the case of the cavern spacing in a triangular grid with a side of L = 200 m, the area per single cavern is 34,641 m2.

3.3. Initial and Final Cavern Size

Cavern spacing is related to its diameter and depth. Even though stored liquid fuel density is lower than that of brine, the pressure imposed on the walls and roof of the cavern will be the same or higher than in the brine-producing caverns. Thus, the caverns’ grid modulus ratio to their diameter may be the same as that of the production caverns with regard to cavern stability.
When designing the storage facility, one should assume that an emergency may occur, requiring a quick withdrawal of the stored fuel using freshwater. Such operations result in a cavern size increase due to partial cavern leaching. In addition, repeated incidents may cause the neighboring caverns to merge. Because of this risk, the storage cavern spacing modulus ratio to its diameter should be 50% greater than in the case of the production caverns.
This study applies the method for the determination of the allowable cavern spacing modulus used for brine-producing caverns [33]. This method compares the vertical stresses in the pillars between neighboring caverns with the rock salt strength specified in the triaxial stress state (cf. Appendix A). The value of the k coefficient representing the L/D ratio is expressed by Formula (7):
k = 3.2159 + 0.0006797   h c t + 0.0000001232   h c t 2 ,
where the depth of the cavern top [m], hct, is defined as follows:
h c t = h t o p + Δ h t + Δ h n ,
where htop is the top of the rock salt layer depth [m]. As the above dependence applies to brine-producing caverns, after taking into account the correction for storage caverns it may be assumed that:
L D m a x = 2.41 + 5.098 × 10 4   h c t + 9.24 × 10 8   h c t 2 .
The above formula defines the maximum diameter of the storage cavern, which further storage operations should not enlarge. Initially, the diameter of the cavern must be correspondingly smaller, depending on how often the liquid fuel will be withdrawn from the storage cavern using freshwater. Each cavern emptying causes an increase in diameter by 1.11 times and in volume by 1.17 times [11]. It means that after emptying the cavern six times, its diameter will be 1.85 times larger, and the cavern volume will be 2.6 times greater.
When withdrawing liquid fuels using freshwater, one must consider that the storage cavern will be leached particularly strongly in its lower part. As a result, the final storage cavern may become a truncated cone. The final cavern shape depends on the liquid fuel withdrawal rate and the withdrawal medium type: the higher the withdrawal rate and the higher the brine concentration, the more uniformly the cavern diameter increases.
It is possible to make the final cavern shape more regular after several operation cycles if the shape of the initial storage part of the cavern corresponds to the inverted truncated cone. However, since it is impossible to leach out a perfect cone or achieve the shape of an ideal cylinder resulting from the storage cavern operation, the final storage volume will be slightly lower than that defined by Formula (5).
To consider the changes in the cavern shape during operation, we replace “¼” in Formula (5) with the Din coefficient, appropriately modifying the cavern volume. Din is a coefficient that determines a formula variant expressing the storage capacity. The Din value depends on the ratio of the initial diameter to the cavern spacing, the initial shape, the number of emptyings of the cavern, the medium used for this purpose, etc. The coefficient value may be in the range of 0.01–0.25 [30].
In the general case, the cavern storage volume Vm,in will be defined by Formula (10):
V m , i n = π D i n   D m a x 2 ( H D m a x 3 Δ h l i m ) ,
where Din is a dimensionless coefficient determining a variant of the formula for the storage capacity. In the case of a cylindrical cavern emptied with almost-saturated brine, the Din coefficient reaches a maximum value of 0.25. In the case of a conical shape, the value of the Din coefficient should be determined based on experience and computer simulations of the leaching of caverns after emptying.
In the case of operational caverns whose initial shape of the storage zone is cylindrical, according to the authors, the Din coefficient value of 0.04 for the initial storage capacity can be assumed, as can the value of 0.1 for the final one. In the case of operational caverns with an initial conical shape, the Din coefficient value can be doubled [30].

3.4. Rock Salt Storage Capacity

The storage capacity of the rock salt layer Cm is presented as the amount of product that may be stored in the caverns per area. It is defined as follows.
C m = V m , i n S ,
where Vm,in depends on the storage variant and its phase. Thus, generally, the storage capacity Cm,var may be defined by Formula (12):
C m , v a r = 2 D i n 3     π   D m a x 2 L 2 ( H D m a x 3 Δ h l i m ) .

3.5. The Impact of Convergence on the Storage Cavern Capacity

In the case of liquid fuel storage caverns, convergence is assessed mainly to determine the amount of brine discharged due to this phenomenon. Enlargement of the cavern size after each emptying and refilling cycle causes the convergence to impact the cavern capacity slightly. At constant pressure, the rate of convergence stabilizes and tends to the value that may be defined by Formula (13) [33,34]:
k ( p ) = 1 V   V t = A 1 ( p ( h cc ) p σ 0 ) n e Q 1 R T m ,
where V is the geometric cavern volume, A1, n, and Q1 are the constant coefficients, p is the brine pressure in the salt cavern, and p is the primary lithostatic pressure that is defined as follows:
p ( h cc ) = ( ρ o h t o p + ρ s ( h c c h t o p ) ) g ,
where ρo, ρs are the density of the overburden rocks and rock salt, respectively, htop is the salt mirror depth, and Tm is the rock salt temperature that can be defined as:
T m ( h c c ) = T m 0 + g T   h cc ,
where Tm0 is the rock mass temperature on the ground level, and gT is the geothermal gradient. The values of the A1, n1, and Q1/R coefficients were adopted following the calculation results by Ślizowski et al. [33], respectively: A1 = 0.3423‰/year, n1 = 4.089, and Q1/R = 2867.9 K.
The volume of the cavern after “t” years is therefore expressed by Formula (16) [33]:
V ( t ) = V 0 ( 1 k ( p ) ) t ,
The storage capacity of a rock salt layer may be defined by Formula (17), considering the impact of convergence:
C m , v a r = 2 D i n 3     π   D m a x 2 L 2 ( H D m a x 3 Δ h l i m ) ( 1 k ( p ) ) t ,

3.6. Calculations and Storage Capacity Map Development

The calculations of the storage capacity of liquid fuels in rock salt deposits were carried out using the authors’ Resurf software [33]. They required the development of rasters of the salt layer roof depth and salt layer thickness. The rasters had to be of the exact dimensions to perform the calculations. Their resolution was 100 by 100 m, meaning that there were 100 points with the values of the salt layer thickness and depth determined per square kilometer. The storage capacity calculations according to Formula (17) were carried out at each point of the batch rasters using the Resurf software. The calculations consider the following parameters for each type of storage cavern:
  • Δht—thickness of the rock salt over the cavern—45 [m];
  • Δhn—length of the cavern neck—15 [m];
  • Δhb—thickness of the rock salt below the cavern—5 [m];
  • Dmax—maximum cavern diameter—67 [m];
  • Δhlim—the height of the residual brine zone—40 [m];
  • L—cavern spacing modulus—200 [m];
  • hmax—maximum depth of the rock salt layer top—1800 [m];
  • Mmin—minimum rock salt layer thickness—130 [m];
  • Din—coefficient of diameter increment—0.25 for strategic storage facilities; 0.08 and 0.2 for operational storage facilities, in the case of initial and target conditions, respectively;
  • Tm0—rock mass temperature on the ground level—285 K;
  • gT—geothermal gradient—0.01 K/m and 0.027 K/m in northern and southwestern Poland, respectively.
The results of the calculations are the new rasters of the storage capacity. The final contour maps were developed based on the capacity of the raster to present the volume of liquid fuels stored in M m3/km2, which is equivalent to 1 m3/m2.
Initially, the authors assumed a minimum deposit thickness of 150 m due to the possibility of constructing caverns of a large volume. However, considering the possible inaccuracies in the geological structure of the analyzed deposits, it was decided to map a slightly larger area, considering the thickness of the rock salt layers up to 130 m. Therefore, the 150 m thickness isolines were marked on the storage capacity maps to observe the trends near the areas suitable for storage.

4. Results

Based on the calculations, storage capacity maps for the operational and strategic storage facilities were developed. They present the potential of liquid fuel storage in rock salt layers in northern Poland and the Fore-Sudetic Monocline. Furthermore, the analysis of the storage capacity rasters using QGIS allowed for a precise determination of the relationship between the surface area of the salt layer and its storage capacity.

4.1. Rock Salt Storage Capacity in Northern Poland

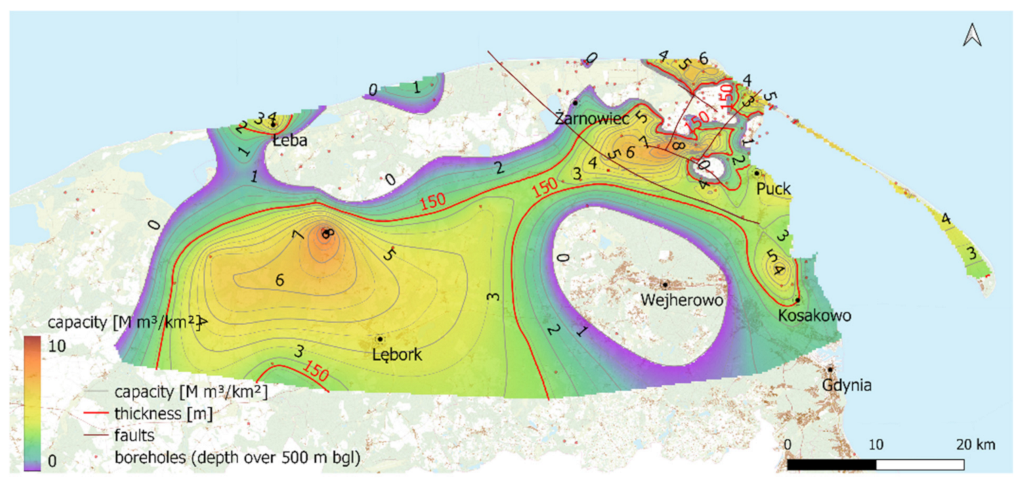
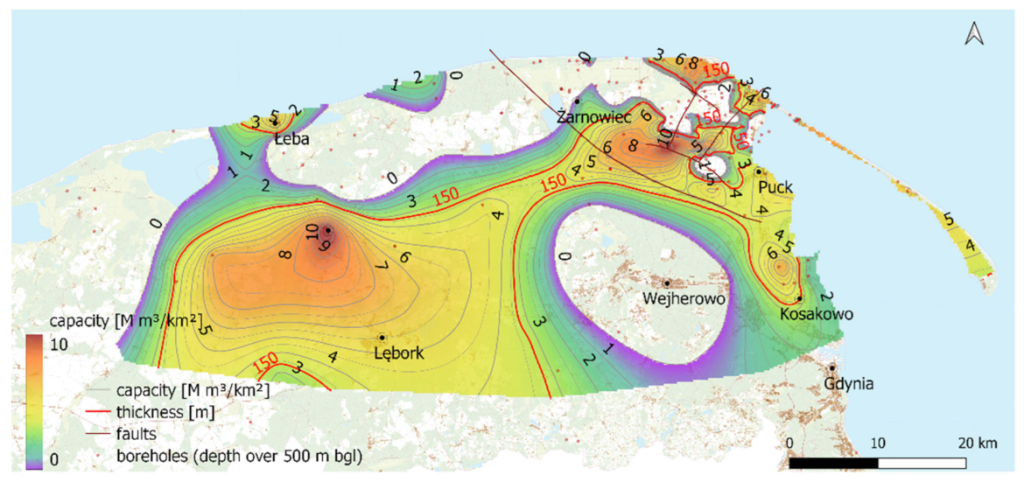
The adopted assumptions and the calculation method allowed the development of the storage capacity maps for the individual cavern variants. Figure 4, Figure 5 and Figure 6 show the storage capacity for the liquid fuels in the cases of the three analyzed variants of the storage caverns.
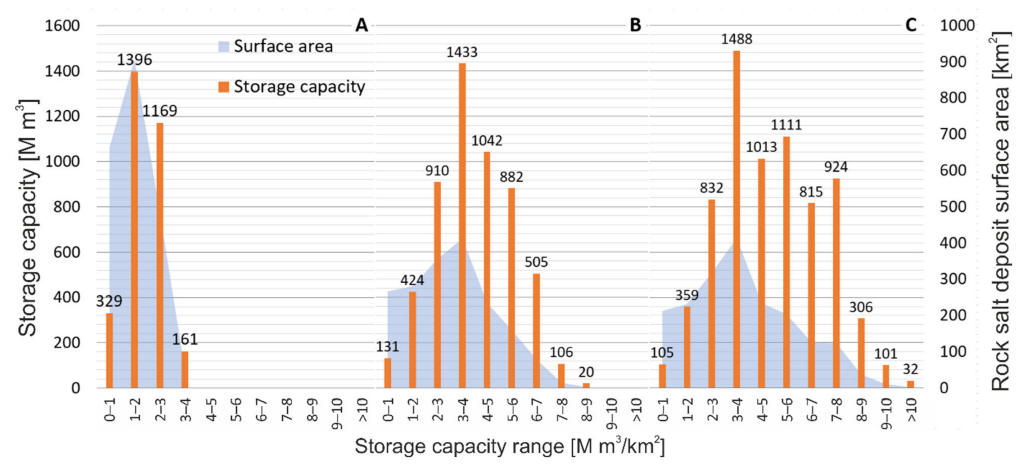
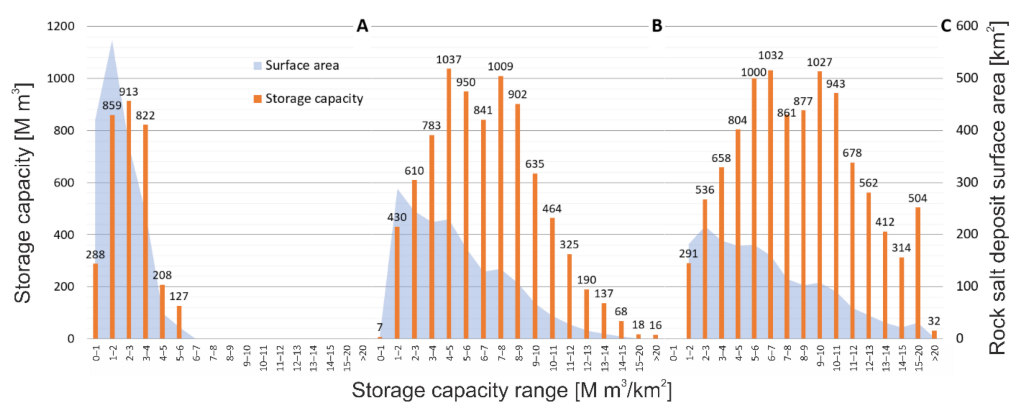
In the case of the operational caverns, after the first filling, up to 3.9 M m3/km2 of liquid fuel may be stored in the area with the most significant rock salt layer thickness. These are the areas in the north-eastern and central-western part of the study area, where the thickness is much more than 150 m and sometimes reaches up to 220 m (Białogarda). The analysis of the unique raster values for the variant of the operational caverns after the first filling (Figure 7A) shows that the area with the most significant storage potential of 3–4 M m3/km2 is over 160 km2. Still, it constitutes only 2.4% of the analyzed area. Therefore, on approximately 75% of the studied area, the storage capacity of the rock salt layer reaches 2 M m3/km2. Thus, the total initial storage capacity of the rock salt layer for the operational storage caverns is 3.1 B m3.
After 30 years of exploitation of the storage caverns, according to the assumed scenario, the caverns are enlarged due to their gradual leaching. The leaching causes an increase in the storage capacity of the salt layer. In this case, the results of the calculations presented on the map (Figure 5) show that the storage capacity has more than doubled, reaching the maximum storage capacity of 8.7 M m3/km2.
The analysis of the unique raster values for the variant of the operational caverns for the target cavern diameter (Figure 7B) shows that the storage capacity above 4 M m3/km2, which is the maximum value in the variant of the operational caverns after the first filling, occurs in the area of 490.4 km2, which is 27.1% of the analyzed area. The area with the largest storage capacity of 8–9 M m3/km2 is 2.43 km2, only 0.1% of the studied area. On approximately 75% of the area of interest, the storage capacity of the rock salt layer is up to 2 M m3/km2. In contrast, a storage capacity of over 6 M m3/km2 is noted over 100 km2 of the studied area. The total storage capacity of the rock salt deposit is 5.5 B m3.
In the case of the strategic storage facilities, the results of the calculations (Figure 6) indicate that the storage capacity may even exceed 10 M m3/km2. The analysis of the unique raster values (Figure 7C) suggests that within the deposit with an area of 4302.3 km2, constituting 38.5% of the analyzed deposit area, the storage capacity is over 4 M m3/km2. The 4 M m3/km2 corresponds to a rock salt layer thickness of more than 150 m.
The area with the most significant potential for storage above 10 M m3/km2 amounts to 3.1 km2, which is only 0.16% of the analyzed deposit area. On the other hand, the storage capacity of the rock salt layer exceeds 5 M m3/km2, which is over 75% of the studied area. For comparison, a capacity of 6 M m3/km2 is noted over 300 km2 of the studied area. The rock salt layer total storage capacity in the case of the strategic storage facilities is 7.1 B m3.

4.2. Rock Salt Storage Capacity in the Fore-Sudetic Monocline

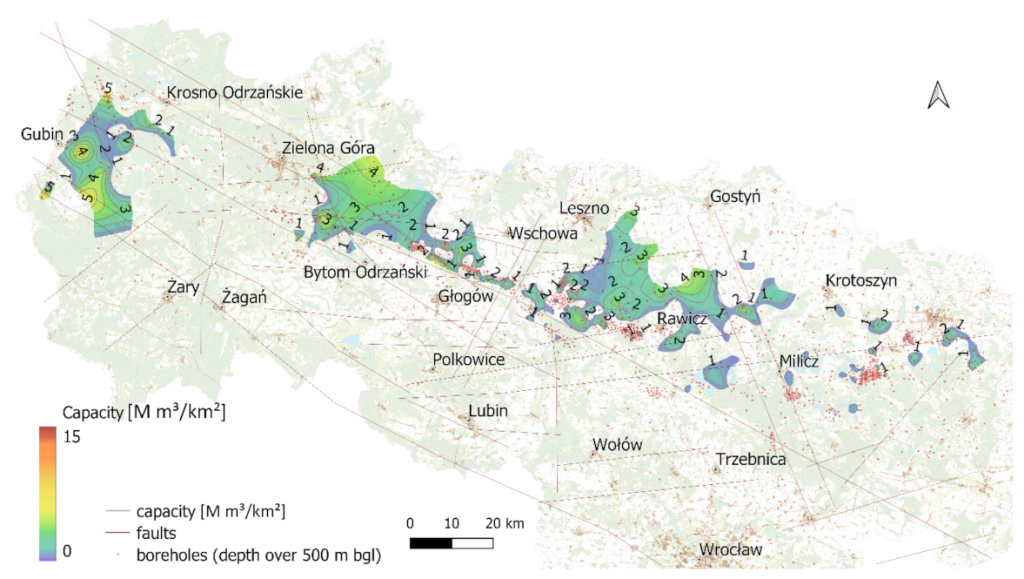
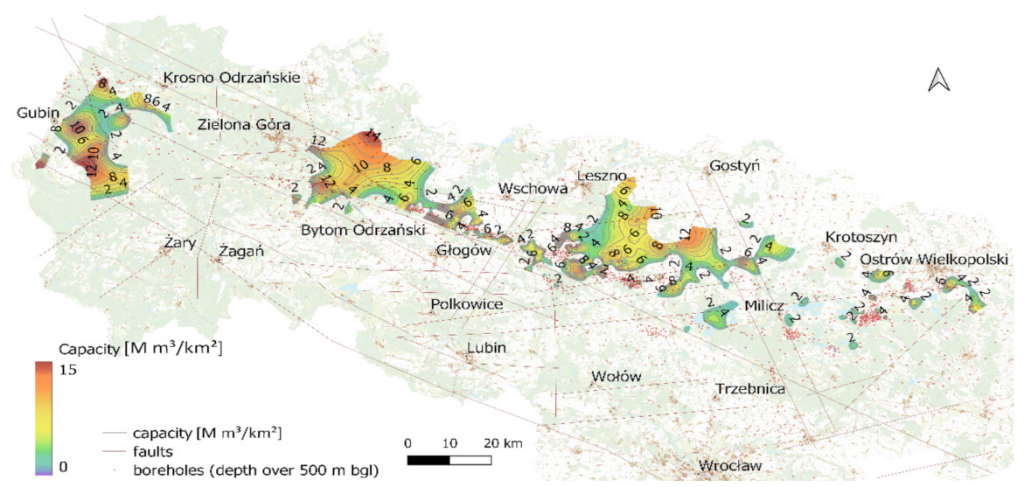
Within the Fore-Sudetic Monocline, the largest storage capacity was recorded for the oldest rock salt layer (one of the four cyclothems). On the maps of storage capacity shown in Figure 8, Figure 9 and Figure 10, two regions with the most outstanding storage potential may be distinguished—the western part of the monocline near Gubin and its central part on the east of Zielona Góra and in the Leszno region. There are small, isolated areas in the eastern part of the monocline with much less storage potential.
In the case of the operational caverns, over 5 M m3/km2 of liquid fuel may be stored in the area with the most significant rock salt layer thickness in the western and central part of the Fore-Sudetic Monocline. The analysis of the unique raster values for the variant of operational caverns after the first filling (Figure 11A) shows that the area with the most significant storage potential of 5–6 M m3/km2 is about 27 km2. Still, it constitutes only 1.6% of the analyzed area. On approximately 80% of the studied area, the storage capacity of the rock salt layer reaches up to 3 M m3/km2. The rock salt layer’s total initial storage capacity potential for operational storage caverns is 3.2 B m3. Figure 11 shows the analysis results of the unique raster values of the liquid fuel storage capacity in the Fore-Sudetic Monocline’s rock salt deposit.
In the case of the target state of the operational storage, the calculations show that the storage capacity potential reaches the maximum value even over 20 M m3/km2 on the small area of the deposit. The analysis of the unique raster values for the variant of the operational caverns for the target cavern diameter (Figure 11B) shows that on 90% of the analyzed area, the storage capacity does not exceed 8 M m3/km2. The area with the largest storage capacity of over 20 M m3/km2 is 16 km2, only 0.7% of the studied area. The maximum storage capacity potential is observed in the range of 4–5 M m3/km2 and 7–8 M m3/km2. The total storage capacity of the rock salt deposit is 8.4 B m3.
In the case of the strategic storage facilities, the calculations indicate that the storage capacity may even exceed 20 M m3/km2. The analysis of the unique raster values (Figure 11C) shows that the area with the most significant potential for storage above 20 M m3/km2 amounts to 32 km2, which is 1.2% of the analyzed area. The maximum storage capacity potential is observed in the range of 6–7 M m3/km2 and 9–10 M m3/km2. The rock salt layer total storage capacity in the case of the strategic storage facilities is 10.5 B m3.
Appendix C presents the detailed maps and charts of the storage capacity potential in the western and central parts of the Pre-Sudetic Monocline, where the two regions with the most outstanding storage potential occur.

5. Discussion

The methodology developed by the authors considers the most critical factors determining the storage capacity of liquid fuels in rock salt deposits. The appropriate shape of the storage cavern has been assumed, taking numerous publications on this issue into account [11,35,36,37]. The storage cavern spacing is an essential element in this type of analysis because of its mutual interactions. The adopted assumptions in this respect reflect the experience of numerous research studies carried out over many years [13,14,30,32,38]. The impact of convergence on the capacity of liquid fuel storage caverns is not as significant as that of compressed gas storage caverns. Still, its impact, as presented, e.g., by [39,40,41], has also been considered to refine the calculations. The calculations also considered the liquid fuel withdrawal method and the storage scenarios influencing the rate of the changes in the volume of the storage caverns [11,42]. The methodology also considered the previously applied methods and calculation methods in estimating the rock salt storage capacity for various substances [9,10,43,44,45]. A significant factor in evaluating the storage capacity is the geological structure of the analyzed rock salt layers [39,46,47], identified based on geological data from the Central Geological Database of the Polish Geological Institute.
The results presented in the article indicate a high storage potential of liquid fuels in rock salt deposits in the studied regions, which, thanks to the applied methodology, have been presented uniquely in the form of maps expressing the storage capacity of the rock salt layer per area.
The obtained results indicate that the storage capacity of liquid fuels in the rock salt deposit in the northern region of Poland ranges from 3.1 to 5.5 B m3 in the case of the operational storage facilities and is 7.1 B m3 for the strategic ones. The maximum storage capacity values per area range from 8.7 M m3/km2 in the case of the operational storage facilities to over 10 M m3/km2 for the strategic ones. The corresponding values in the Fore-Sudetic Monocline ranged from 3.2 to 8.4 B m3 in the case of the operational storage facilities and 10.5 B m3 in the case of the strategic ones. The maximum storage capacity values per area range from 15 M m3/km2 in the case of the operational storage facilities to over 20 M m3/km2 in the case of the strategic ones.
The presented maps reflect the current state of knowledge about the analyzed rock salt deposits. However, one should consider that the fewer the boreholes that were drilled in or drilled in the vicinity of the considered area the more hypothetical are the given estimates. Moreover, when assessing the storage possibilities in the area of the Fore-Sudetic Monocline, detailed analyses of the site selection for the underground storage facilities should consider the limitations related to tectonics, manifested by numerous faults. In the case of the monocline, the geothermal gradient is higher than in northern Poland. The higher geothermal gradient significantly impacts the convergence of the salt caverns, which was also considered in the calculations performed.
The methodology developed in this study and presented in detail may help in the assessment of the storage capacity of the liquid fluids in the rock salt deposits at every stage of the storage facility operation, considering different storage facilities. After minor modifications, the methodology may also be adopted for assessing the storage capacity of the rock salt deposits in terms of the storage of other liquid substances.
Numerous studies on strategic storage facilities currently being developed worldwide [15,16,48,49,50] indicate that the methodology presented in the article may be of interest to scientists and companies planning to expand the strategic reserves of liquid fuels in rock salt deposits.

6. Conclusions

The developed methodology considers all the essential aspects of storing liquid fuels in rock salt layers. The calculations using the method indicate a large storage capacity of the analyzed layers. For example, the storage capacity reaches a maximum of 10 M m3/ km2 in the case of the strategic storage facilities in northern Poland and over 20 M m3/km2 in the Fore-Sudetic Monocline.
The values presented correspond to the storage potential when considering the geological and mining conditions. The capacity of the rock salt layers may be much lower after considering the surface and underground conditions using spatial data analysis tools.
The methodology allows the transparent identification of regions with the highest storage capacity. Furthermore, the results of the calculations in the form of rasters and maps constitute a sound basis for a spatial suitability analysis of the individual regions, with excellent storage potential for the location of storage facilities when considering any additional spatial data of the area of interest.
The method’s accuracy depends primarily on the geological structure of the analyzed seams. Therefore, each refinement of the geological model of the analyzed layers improves the accuracy of the conducted estimations. In addition, after the modification, the methodology can assess the storage capacity of other substances in rock salt layers.
The developed maps of the storage capacity of the bedded rock salt deposits constitute the basis for detailed analyses of their suitability for the location of underground storage facilities. Further research on this problem based on the theory of strategic approach in multi-criteria decision making and the use of spatial data is currently underway. The results of this research will be presented in the following publication.

Author Contributions

Conceptualization, L.L., K.U. and S.N.; methodology, L.L., K.U., S.N. and K.P.; validation, L.L. and K.P.; formal analysis, L.L., K.U. and K.P.; investigation, L.L., K.U. and K.P.; resources, S.N., K.P. and L.L.; data curation, L.L. and K.P.; writing—original draft preparation, L.L., S.N., K.P. and K.U.; writing—review and editing, L.L., K.P. and K.U.; visualization, L.L. and K.P.; supervision, L.L. and S.N.; project administration, K.P.; funding acquisition, K.P., S.N. and L.L. All authors have read and agreed to the published version of the manuscript.

Funding

This research received no external funding.

Data Availability Statement

Not applicable.

Conflicts of Interest

The authors declare no conflict of interest.

Appendix A. Determination of Liquid Fuels Storage Cavern Safe Spacing

The method of determining the allowable cavern spacing grid modulus, taken from the classical design of the cavern field, was applied. This methodology compares the vertical stresses in the pillar between caverns with the strength of the rock salt in a triaxial stress state.
The method adopts the following assumptions:
  • caverns are arranged in a triangular grid;
  • caverns are filled with the stored medium, i.e., the brine level is at its deepest point;
  • the average vertical pressure in the rock mass results from the weight of the rocks, minus the counterpressure of the stored medium;
  • the stored medium counterpressure is attributed to the cavern roof, and the influence of the shape of the cavern dome is neglected;
  • the least favorable conditions occur at the brine/stored medium interface depth;
  • the case is considered when the cavern is under the stored medium column pressure (such an extreme case may occur due to a failure).
The mean vertical pressure at the maximum depth of the residual brine level is:
p z = S 0 h c t ρ o g + S F H m ρ s g S K h c t ρ m g S F = K h c t g ( ρ o ρ m ) + H m g ρ s + h c t g ρ m
where S0 is an area of the hexagonal section assigned to a single cavern in the grid (cf. Figure 2), hct is the depth of the cavern top [m], ρo is the average density of the overburden rocks [kg/m3], ρs is the density of the rock salt [kg/m3], and g is standard gravity [Mm/s2]. The coefficient K represents the relation between the area of the hexagonal section assigned to a single cavern and the pillar area in a triangular section [m2] and can be expressed as:
K = S 0 S F = k 2 k 2 2 π 3
where S F is the pillar area in a triangular section [m2], k is the quotient of the cavern spacing modulus L (the length of the side of the triangular grid of the cavern spacing), and the target cavern radius is Dmax/2 (cf. Figure 2).
The pressure of the stored medium at the maximum depth of the brine level is defined as follows:
p r = ( h c t + H m ) g ρ m
Taking, in turn, the following criterion of the long-term strength of the rock mass:
σ 1 u l t = 7.02 ( σ 3 ) 0.692 + 8.24 ° [ MPa ]
pz can be interpreted as follows:
p z     7.02 ( p r ) 0.692 + 8.24   [ MPa ] .
Combining Equations (A1) and (A5), the following condition is obtained:
K 7.02 ( p r ) 0.692 + 8.24 H m g ρ s h c t g ρ m h s g ( ρ o ρ m ) .
On the basis of K (Formula (A2)), it is possible to calculate the spacing of the caverns. Before the practice application, an appropriate safety factor should increase the k-ratio calculated from the above formula.
Assuming: ρo = 2200 kg/m3, ρs = 2160 kg/m3, and ρm = 870 kg/m3, it is possible to table k for hct ∈ [500 m, 1800 m], Hm ∈ [100 m, 300 m].
It turns out that the height of the storage zone in the cavern does not significantly impact the spacing of the caverns. Although the load on the pillar increases, the medium pressure also increases, which means that the rock salt’s strength (triaxial state) also increases. Therefore, neglecting the influence of Hm, k was parameterized as a function of hct by multiplying it by a safety factor of 1.2.
k = L D m a x = 2.41 + 5.098 × 10 4   h c t + 9.24 × 10 8   h c t 2 .
The above formula depends mainly on the stored medium’s density and the average density of the rocks occurring above the cavern. The coefficients in (A7) will be different for media with different densities. The calculation results show the following values of the coefficients in Formula (A7) for individual media:
Table A1. The values of the Formula (A7) coefficients for stored liquid media of different densities.
Stored MediaPolynomial Intercept h c t Coefficient h c t 2 Coefficient
Crude oil2.410.0005149.63 × 10−8
Gasoline2.510.0004103.33 × 10−7
Brine2.350.000340−4.7 × 10⁻⁶
LPG5.170.0059914.67 × 10−6
The Formula (A7) form also depends on the long-term strength of the salt. The parameterization (A3) adopted here is based on the conservative values of the triaxial strength for Polish salt deposits. It was assumed to be 0.4 and of short-term strength. In general, other values of these strengths or the dilatancy limit can be assumed here.
One can also not parameterize dependencies (A5) and (A6) but use them directly. The authors prepared the parameterization (A7) because to obtain the maps of the storage capacity, they processed the rasters of the maps of the thickness and depth of the salt roof, and the aim was to shorten the computation time. Apart from that, Formula (A7) and the maps developed with its help primarily illustrate the method and its usefulness.

Appendix B. Thickness and Top Depth Maps of Bedded Salt Deposits in Poland

Appendix B.1. The Northern Part of Poland
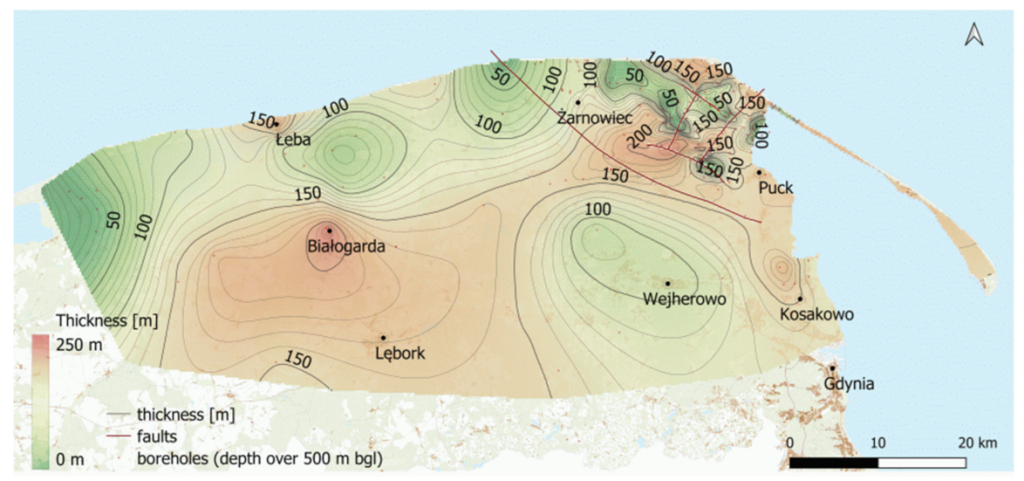
Figure A1. The thickness map of the oldest rock salt (Na1) layer based on the thickness raster.
Energies 15 07005 g0a1
Figure A2. The top depth map of the oldest rock salt (Na1) layer based on the top depth raster.
Energies 15 07005 g0a2

Appendix B.2. The Fore-Sudetic Monocline

Figure A3. The thickness map of the oldest rock salt (Na1) layer occurring to a depth of 1800 m bgl.
Energies 15 07005 g0a3
Figure A4. The top depth map of the oldest rock salt (Na1) layer to a depth of 1800 m bgl.
Energies 15 07005 g0a4

Appendix C. Storage Capacity Maps

Appendix C.1. The Western Part of the Fore-Sudetic Monocline
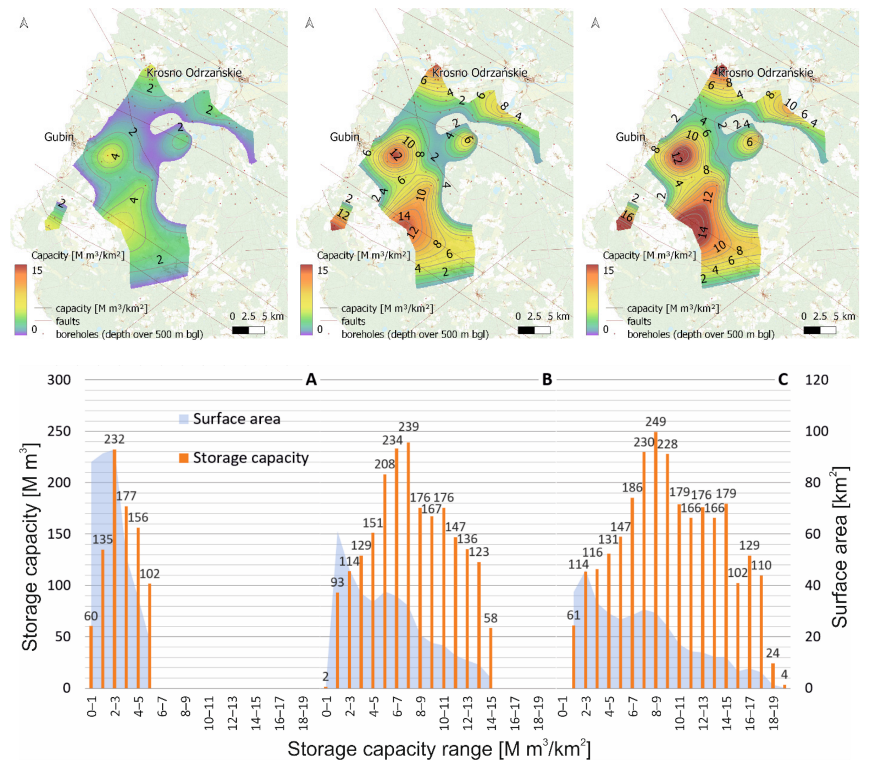
Figure A5. The storage capacity of liquid fuels in the rock salt layer in the western part of the Fore-Sudetic Monocline ((A) initial state of operational storage, (B) target state of operational storage, (C) strategic storage).
Energies 15 07005 g0a5

Appendix C.2. The Central Part of the Fore-Sudetic Monocline

Figure A6. The storage capacity of liquid fuels in the rock salt layer in the central part of the Fore-Sudetic Monocline ((A) initial state of operational storage, (B) target state of operational storage, (C) strategic storage).
Energies 15 07005 g0a6

References

  1. Bays, C. Use of salt solution cavities for underground storage. In Proceedings of the First World Salt Symposium; Northern Ohio Geological Society: Cleveland OH, USA, 1963; pp. 564–578. [Google Scholar]
  2. Kunstman, A.; Poborska-Młynarska, K.; Urbańczyk, K. Geologiczne i górnicze aspekty budowy magazynowych kawern solnych. Przegląd Geol. 2009, 57, 819–828. [Google Scholar]
  3. Lord, D.; Roberts, B.L.; Gutierrez, K.; Rudeen, D.K. Solution Mining Characteristics of U.S. Strategic Petroleum Reserve Oil Drawdown. In Proceedings of the SMRI Spring 2012 Technical Conference, Regina, SK, Canada, 22–25 April 2012. [Google Scholar]
  4. Andrews, A.; Pirog, R. The Strategic Petroleum Reserve: Authorization, Operation, and Drawdown Policy; CRS Rep Congr R42460; Congressional Research Service, Library of Congress: Washington, DC, USA, 2012. [Google Scholar]
  5. Bai, Y.; Dahl, C. Evaluating the management of U.S. Strategic Petroleum Reserve during oil disruptions. Energy Policy 2018, 117, 25–38. [Google Scholar] [CrossRef]
  6. Istvan, J.H.; Lenz, J.E.; Cook, T.W. Potential for Storage of Natural Gas in the Hutchinson Salt Member of the Wellington Formation of South-Central Kansas. In Proceedings of the SMRI Fall 1998 Meeting; Solution Mining Research Institute: Rome, Italy, 1998. [Google Scholar]
  7. Ślizowski, J.; Urbańczyk, K.; Łaciak, M.; Lankof, L.; Serbin, K. Efektywność magazynowania gazu ziemnego i wodoru w kawernach solnych. Effectiveness of natural gas and hydrogen storage in salt caverns. Przemysł Chem. 2017, 96, 994–998. [Google Scholar] [CrossRef]
  8. Parkes, D.; Evans, D.; Williamson, P.; Williams, J. Estimating available salt volume for potential CAES development: A case study using the Northwich Halite of the Cheshire Basin. J. Energy Storage 2018, 18, 50–61. [Google Scholar] [CrossRef]
  9. Lankof, L.; Tarkowski, R. Assessment of the potential for underground hydrogen storage in bedded salt formation. Int. J. Hydrogen Energy 2020, 45, 19479–19492. [Google Scholar] [CrossRef]
  10. Caglayan, D.G.; Weber, N.; Heinrichs, H.U.; Linßen, J.; Robinius, M.; Kukla, P.A.; Stolten, D. Technical potential of salt caverns for hydrogen storage in Europe. Int. J. Hydrogen Energy 2020, 45, 6793–6805. [Google Scholar] [CrossRef]
  11. Kunstman, A.; Urbańczyk, K. Designing of the storage cavern for liquid products, anticipating its size and shape changes during withdrawal operations with use of unsaturated brine. In Proceedings of the SMRI Spring 2008 Technical Conference, Porto, Portugal, 27–30 April 2008. [Google Scholar]
  12. Urbańczyk, K. Dwa czynniki ograniczające żywotność kawern magazynujących media ciekłe. Two factors limiting the lifetime of the caverns storing liquid media. Przegląd Solny/Salt Rev. 2019, 15, 40–44. [Google Scholar]
  13. Ratigan, J.L.; Nieland, J.D.; McCauley, T.V. Geomechanical Assessment of the LOOP LLC Crude Oil Storage Facility in the Clovelly Salt Dome, Louisiana. In Proceedings of the SMRI Fall 2006 Conference; Solution Mining Research Institute: Rapid City, SD, USA, 2006. [Google Scholar]
  14. Ehgartner, B.L.; Park, B.Y. Allowable Pillar to Diameter Ratio for Strategic Petroleum Reserve Caverns; Sandia Report SAND2011-2896; Sandia National Laboratories: Albuquerque, NM, USA; Livermore, CA, USA, 2011. [Google Scholar]
  15. Zhang, X.-B.; Qin, P.; Chen, X. Strategic oil stockpiling for energy security: The case of China and India. Energy Econ. 2017, 61, 253–260. [Google Scholar] [CrossRef]
  16. Zhang, N.; Shi, X.; Zhang, Y.; Shan, P. Tightness Analysis of Underground Natural Gas and Oil Storage Caverns with Limit Pillar Widths in Bedded Rock Salt. IEEE Access 2020, 8, 12130–12145. [Google Scholar] [CrossRef]
  17. Gąska, K.; Hoszowski, A.; Gmiński, Z.; Kurek, A. Monografia Podziemnych Magazynów Gazu; Oficyna Wydawnicza ASPRA-JR: Warszawa, Poland, 2012. [Google Scholar]
  18. Ślizowski, J.; Urbańczyk, K.; Lankof, L.; Serbin, K. Analiza zmienności polskich pokładów soli kamiennej w aspekcie magazynowania gazu. Wiert Naft. GAZ 2011, 28, 431–443. [Google Scholar]
  19. Cauberg, H.; Kuilman, B.; Valkering, B.; Walters, J.V. Rock mechanical behavior and sealing aspects of a closed-in salt cavity filled with brine. In Proceedings of the SMRI Fall Meeting; Solution Mining Research Institute: Amsterdam, The Netherlands, 1986. [Google Scholar]
  20. Habibi, R. An investigation into design concepts, design methods and stability criteria of salt caverns. Oil Gas Sci. Technol.–Rev. d’IFP Energies Nouv. 2019, 74, 14. [Google Scholar] [CrossRef]
  21. Gniady, C.T.; Ehgartner, B.L. Fracture Predictions for Over-Pressurizationof Sealed Wellbores. In Proceedings of the SMRI Fall 1993 Meeting; Solution Mining Research Institute: Lafayette, LA, USA, 1993. [Google Scholar]
  22. Wallner, M.; Paar, W.A. Risk of Progressive Pressure Build Up in a Sealed Cavity. In Proceedings of the SMRI Fall 1997 Meeting; Solution Mining Research Institute: El Paso, TX, USA, 1997. [Google Scholar]
  23. Thoraval, A.; Lahaie, F.; Brouard, B.; Berest, P. A generic model for predicting long-term behavior of storage salt caverns after their abandonment as an aid to risk assessment. Int. J. Rock Mech. Min. Sci. 2015, 77, 44–59. [Google Scholar] [CrossRef]
  24. Czapowski, G.; Aleksandrowski, P.; Jarosiński, M. Struktury solne 1: 5,000,000. In Atlas Geologiczny Polski; Nawrocki, J., Becker, A., Eds.; PIG–PIB: Warszawa, Poland, 2017; pp. 1–170. [Google Scholar]
  25. Czapowski, G.; Peryt, T.; Antoniewicz, L. Facies and paleogeography of the Zechstein (Upper Permian) Oldest Halite (Na1) in Poland. Bull. Pol. Acad. Sc. Earth Sci. 1993, 41, 217–227. [Google Scholar]
  26. Wagner, R.; Peryt, T.M. Possibility of sequence stratigraphic subdivision of the Zechstein in the Polish Basin. Geol. Q. 1997, 41, 457–474. [Google Scholar]
  27. Deczkowski, Z.; Gajewska, I. Charakterystyka starokimeryjskich i laramijskich struktur blokowych monokliny przedsudeckiej. Kwart Geol. 1997, 23, 467–481. [Google Scholar]
  28. Sobolik, S.R.; Ehgartner, B.L. Analysis of Simple Cavern Shapes for the Strategic Petroleum Reserve. In Proceedings of the SMRI Fall 2006 Conference; Solution Mining Research Institute: Rapid City, SD, USA, 2006. [Google Scholar]
  29. Wang, T.; Yan, X.; Yang, H.; Yang, X.; Jiang, T.; Zhao, S. A new shape design method of salt cavern used as underground gas storage. Appl. Energy 2013, 104, 50–61. [Google Scholar] [CrossRef]
  30. Urbańczyk, K.; Ślizowski, J.; Serbin, K. Prognoza Pojemności Magazynów Płynnych Węglowodorów w Polskich Złożach Soli Kamiennej w Zależności od Warunków Naturalnych i Czynników Górniczo-Technicznych; Raport z Projektu Badawczego Nr N N525 363935; MONEY.PL: Kraków, Poland, 2011. [Google Scholar]
  31. Zhang, G.; Wu, Y.; Wang, L.; Zhang, K.; Daemen, J.J.; Liu, W. Time-dependent subsidence prediction model and influence factor analysis for underground gas storages in bedded salt formations. Eng. Geol. 2015, 187, 156–169. [Google Scholar] [CrossRef]
  32. Yang, C.; Wang, T.; Li, J.; Ma, H.; Shi, X.; Daemen, J.J.K. Feasibility analysis of using closely spaced caverns in bedded rock salt for underground gas storage: A case study. Environ. Earth Sci. 2016, 75, 1138. [Google Scholar] [CrossRef]
  33. Ślizowski, J.; Urbańczyk, K.; Czapowski, G.; Lankof, L.; Serbin, K.; Ślizowski, K. Możliwości Magazynowania Gazu Ziemnego w Polskich Złożach Soli Kamiennej w Zależności od Warunków Geologiczno-Górniczych; Śślizowski, J., Urbańczyk, K., Eds.; Wydawnictwo IGSMiE PAN: Kraków, Poland, 2011; 132p. [Google Scholar]
  34. Bérest, P.; Brouard, B. A tentative classification of salts according to their creep properties. In Proceedings of the SMRI Spring 1998 Meeting; Solution Mining Research Institute: New Orleans, LO, USA, 1998; pp. 1–21. [Google Scholar]
  35. Xing, W.; Zhao, J.; Hou, Z.; Were, P.; Li, M.; Wang, G. Horizontal natural gas caverns in thin-bedded rock salt formations. Environ. Earth Sci. 2015, 73, 6973–6985. [Google Scholar] [CrossRef]
  36. Mortazavi, A.; Nasab, H. Analysis of the behavior of large underground oil storage caverns in salt rock. Int. J. Numer. Anal. Methods Géoméch. 2016, 41, 602–624. [Google Scholar] [CrossRef]
  37. Ban, F.; Yuan, G.; Wan, J.; Peng, T. The optimum interwell distance analysis of two-well-horizontal salt cavern construction. Energy Sources Part A Recover. Util. Environ. Eff. 2020, 43, 3082–3100. [Google Scholar] [CrossRef]
  38. Wang, T.; Ma, H.; Shi, X.; Yang, C.; Zhang, N.; Li, J.; Ding, S.; Daemen, J. Salt cavern gas storage in an ultra-deep formation in Hubei, China. Int. J. Rock Mech. Min. Sci. 2018, 102, 57–70. [Google Scholar] [CrossRef]
  39. Zhang, N.; Ma, L.; Wang, M.; Zhang, Q.; Li, J.; Fan, P. Comprehensive risk evaluation of underground energy storage caverns in bedded rock salt. J. Loss Prev. Process Ind. 2017, 45, 264–276. [Google Scholar] [CrossRef]
  40. Wang, G.; Guo, K.; Christianson, M.; Konietzky, H. Deformation characteristics of rock salt with mudstone interbeds surrounding gas and oil storage cavern. Int. J. Rock Mech. Min. Sci. 2011, 48, 871–877. [Google Scholar] [CrossRef]
  41. Serbin, K.; Ślizowski, J.; Urbańczyk, K.; Nagy, S. The influence of thermodynamic effects on gas storage cavern convergence. Int. J. Rock Mech. Min. Sci. 2015, 79, 166–171. [Google Scholar] [CrossRef]
  42. Urbańczyk, K. Ługowanie w złożach małej miąższości (Proces ługowania kawern solnych cz. V) Leaching in thin-bedded deposits. (Salt cavern leaching process p. V). Przegląd Solny/Salt Rev. 2021, 27, 67–91. [Google Scholar]
  43. Ślizowski, J.; Lankof, L.; Urbańczyk, K.; Serbin, K. Potential capacity of gas storage caverns in rock salt bedded deposits in Poland. J. Nat. Gas Sci. Eng. 2017, 43, 167–178. [Google Scholar] [CrossRef]
  44. Scafidi, J.; Wilkinson, M.; Gilfillan, S.M.; Heinemann, N.; Haszeldine, R.S. A quantitative assessment of the hydrogen storage capacity of the UK continental shelf. Int. J. Hydrogen Energy 2021, 46, 8629–8639. [Google Scholar] [CrossRef]
  45. Evans, D.; Parkes, D.; Dooner, M.; Williamson, P.; Williams, J.; Busby, J.; He, W.; Wang, J.; Garvey, S. Salt Cavern Exergy Storage Capacity Potential of UK Massively Bedded Halites, Using Compressed Air Energy Storage (CAES). Appl. Sci. 2021, 11, 4728. [Google Scholar] [CrossRef]
  46. Lux, K.-H. Design of salt caverns for the storage of natural gas, crude oil and compressed air: Geomechanical aspects of construction, operation and abandonment. Geol. Soc. Lond. Spéc. Publ. 2009, 313, 93–128. [Google Scholar] [CrossRef]
  47. Qiu, Y.; Zhou, S.; Wang, J.; Chou, J.; Fang, Y.; Pan, G.; Gu, W. Feasibility analysis of utilising underground hydrogen storage facilities in integrated energy system: Case studies in China. Appl. Energy 2020, 269, 115140. [Google Scholar] [CrossRef]
  48. Wu, G.; Wei, Y.-M.; Nielsen, C.; Lu, X.; McElroy, M.B. A dynamic programming model of China’s strategic petroleum reserve: General strategy and the effect of emergencies. Energy Econ. 2012, 34, 1234–1243. [Google Scholar] [CrossRef]
  49. Shi, X.; Liu, W.; Chen, J.; Yang, C.; Li, Y.; Ma, H.; Peng, H.; Wang, T.; Ma, X. Geological Feasibility of Underground Oil Storage in Jintan Salt Mine of China. Adv. Mater. Sci. Eng. 2017, 2017, 1–11. [Google Scholar] [CrossRef] [Green Version]
  50. Rath, R.; Nanda, A.; Wippich, M.; Wilke, H.F. Underground Salt Cavern Storages for Crude Oil at Bikaner, India. In Proceedings of the SMRI Fall 2014 Technical Conference, Groningen, Chester, UK, 28 September–1 October 2014. [Google Scholar]
Figure 1. Zechstein Salt Formation (according to: Czapowski et al. [24]).
Energies 15 07005 g001
Figure 2. Liquid fuel storage salt cavern—filling of the cavern.
Energies 15 07005 g002
Figure 3. The cavern spacing triangular grid.
Energies 15 07005 g003
Figure 4. The storage capacity of liquid fuels in the rock salt layer in northern Poland, operational caverns (after the first filling).
Energies 15 07005 g004
Figure 5. The storage capacity of liquid fuels in the rock salt layer in northern Poland, operational caverns (target cavern volume).
Energies 15 07005 g005
Figure 6. The storage capacity of liquid fuels in the rock salt layer in northern Poland, strategic caverns.
Energies 15 07005 g006
Figure 7. The analysis results of the unique raster values of liquid fuel storage capacity ((A) initial state of operational storage, (B) target state of operational storage, (C) strategic storage).
Energies 15 07005 g007
Figure 8. The storage capacity of liquid fuels in the rock salt layer in the Fore-Sudetic Monocline, operational caverns (after the first filling).
Energies 15 07005 g008
Figure 9. The storage capacity of liquid fuels in the rock salt layer in the Fore-Sudetic Monocline, operational caverns (target cavern volume).
Energies 15 07005 g009
Figure 10. The storage capacity of liquid fuels in the rock salt layer in the Fore-Sudetic Monocline (strategic caverns).
Energies 15 07005 g010
Figure 11. The analysis results of the unique raster values of liquid fuel storage capacity ((A) initial state of operational storage, (B) target state of operational storage, (C) strategic storage).
Energies 15 07005 g011
Publisher’s Note: MDPI stays neutral with regard to jurisdictional claims in published maps and institutional affiliations.