Article

An Approach for Determining Voltage Imbalance Contributions Based on Complex Independent Component Analysis

by
Márcio Arvelos Moraes
,
Vinícius Henrique Farias Brito
and
José Carlos de Oliveira
*
Faculty of Electrical Engineering, Federal University of Uberlândia, Uberlândia 38400-902, Brazil
*
Author to whom correspondence should be addressed.
Energies 2022, 15(19), 7014; https://doi.org/10.3390/en15197014
Submission received: 18 August 2022 / Revised: 12 September 2022 / Accepted: 15 September 2022 / Published: 24 September 2022
(This article belongs to the Topic Power Quality)

Abstract

:
In the context of power quality problems, the voltage imbalance index is relevant, given its harmful impacts on the networks and loads. Thus, reliable and viable methodologies for practical use are necessary to determine agents’ contributions. This article presents a noninvasive method for sharing responsibility for imbalances based on the principle of superposing the individual voltage imbalance produced by the parties. A procedure based on the Complex Independent Component Analysis (CICA) technique is proposed to meet the parameters required by the superposition method. Based on the measurements of voltages and currents carried out on the point of common coupling (PCC), the negative sequence impedances are determined using the CICA method under the terms needed by the superposition principle. The methodology’s effectiveness is evaluated through performance comparisons carried out over the process, in light of the response from the methods for sharing responsibilities currently published in the literature of this domain. The results obtained through the proposed approach show good adherence to the procedures presented with solid conceptual bases. However, unlike these, this article’s methodology offers practical perspectives for application in the field.

1. Introduction

The growing addition of distributed generation, and the insertion of unbalanced three-phase and single-phase loads, among other factors, has elevated the indices of unbalanced voltage on the power system grid, mainly on the distribution network [1,2,3,4,5]. The degradation of these electrical power quality (PQ) indexes can cause undesirable effects, such as negative sequence voltages and currents, and consequent effects on transmission and distribution systems, especially in transformers and rotating machines [6,7]. In addition, the propagation of this disturbance may generate non-characteristic harmonic currents in electronic converters [8]. In light of these facts, additional losses, overheating, and, consequently, impacts occur on the life expectancy of the several electrical system components. Therefore, maintaining imbalance levels under current standards is crucial. Once the limits are exceeded, strategies are necessary to mitigate the abnormal phenomenon discussed herein. Implementing these solutions to reduce the imbalance may imply high costs, whose financial disbursements should be shared fairly among the agents involved. In this scenario, one finds the theme of responsibility sharing, which seeks to define the contributing portion of each unit to the level of the disturbance encountered at a particular point of common coupling (PCC).
In the context of responsibility sharing, one finds several studies that analyze PQ phenomena for harmonic distortions and short-term voltage variations, such as voltage sags [9,10,11,12]. On the other hand, few papers associated with voltage imbalance responsibility are found [13,14].
In this context, in [15], the Conforming and Non-Conforming Current method (CNCC) is proposed to sort out the matter. The procedure assumes that the total negative current drawn by a consumer can be separated into two portions. One of these portions is the Conforming Current, which reproduces the contributions of the supplier. The second portion is associated with the imbalance caused by the consumer, denominated as Non-conforming Current. Although the advances and contributions made by the CNCC method are recognized, studies [16,17] highlight divergences between the expected results and those presented by the methodology. In this context, the previous works clarify that the possible cause for these inconsistencies is based on the propositions made by the CNCC method that positive and negative sequence impedances are equal. However, as is known, rotating machines, specifically three-phase induction motors, have a substantially lower negative-sequence impedance amplitude than the positive-sequence impedance, which compromises the results.
In [16], a procedure is presented that uses the three-phase power flow (TPPF) method associated with the voltages and currents of negative sequence to determine the primary source of voltage imbalance at the PCC. The authors propose that the active power signal of the negative sequence is directly linked to the origin of the imbalance. A disadvantage encountered in this approach is the fact that it is not possible to define the portion of the contribution of each agent concerning the total imbalance at the PCC. Furthermore, application studies have shown that this method has inconsistencies in identifying the main contributor [17].
In 2008, the IEC/TR 61000-3-13 [18] was published. It proposes an evaluation procedure by measuring the voltage unbalance factor (VUF) before and after the connection of a consumer unit at the PCC. As this method requires complete disconnection from an installation, its application becomes impractical for existing units that do not permit interruptions to their processes. Therefore, in its original concept, this procedure should be carried out at the planning or commissioning stage. The method concerning its physical foundations is consistent with the objectives established here. Its implementation is presented in the direct form of the superposition of two operational states for the electric grid, allowing the composition of the contributions from the agents involved. However, the difficulties associated with the interruption of production and safety processes determine that its use is restricted to particular situations that allow the disconnection of consumer units. In the theoretical context, this method is used as a reference base to analyze the performance of the sharing proposal established by this article.
Strategies exist that were developed to find the percentage of responsibility through a deterministic approach. This goal can be achieved using voltage and current measurements at the PCC in conjunction with the values of network parameters. In [19], a mathematical model is proposed that evaluates the impact of loads, lines, and supplies on the total imbalance of the system. In [20,21], the authors analyze the propagation of the imbalance by using a complex indicator to determine the imbalance emission levels at the PCC on radial and interconnected networks. The same concept is utilized in [1,22,23]. Although these strategies have presented satisfactory results, the need for prior knowledge of the network parameters becomes an obstacle for practical applications, given that these data are difficult to obtain, in addition to the possibility of such data possessing inaccurate values.
In [24], the Controlled Operational State Change (COSC) method is proposed, which is based on the equations of the Superposition Theorem [25] for application in voltage imbalance phenomena. In this way, by switching a single-phase low voltage capacitor at the PCC, along with the voltage and current readings, one determines the fraction of the contribution on the part of the supplier and consumer. This method demonstrated promising results in computational studies and laboratory experiments [24]. However, as this procedure demands the consecutive switching of a capacitive load, the possibility of undesirable transients occurring at the PCC exists, even though it is of low power. Furthermore, it is an invasive method when considering the normal operating conditions of power systems. Due to the need for successive maneuvers of the single-phase device and respective authorizations for carrying out such procedures by the agents involved, this can also represent difficulties in implementing the methodology.
Finally, mention must be made of the approaches based on the Blind Source Separation (BSS) method’s application to harmonic contributions’ studies [26,27,28,29,30,31]. These have shown that such a technique provides results with reasonable accuracy. Regarding the voltage imbalance phenomenon, its application is still recent. The study reported in [32] presented a methodology based on the Robust Independent Component Analysis (RICA) to determine the supplier and consumer impedances to calculate the imbalance contributions. In [33], the authors propose the application of RICA together with the Sparse Component Analysis, thus making the method more accurate in the presence of renewable sources in the electric power system. In addition to the results reached by such studies, it is still important to emphasize that those methods that use the BSS need only the voltage and current measurements from the PCC. No prior knowledge of the electric circuit parameters under analysis is required.
By considering such factors, while aiming at a noninvasive strategy that is feasible for application in the field, this paper proposes a methodology for sharing imbalance responsibilities using a combination of the Superposition Method with the Complex Independent Component Analysis (CICA) technique. To this end, the Adaptive Complex Maximization of non-Gaussianity (A-CMN) [34] algorithm is employed to determine the impedances of negative sequence from the supplier and consumer. Then, the equations proposed by the Superposition Method are applied to calculate the portion of the responsibility of each agent. Once the fundamentals of the proposal have been established, these are used in a typical electric system. The methodology’s effectiveness is evaluated through performance comparisons carried out over the process, in light of the response from the methods for sharing responsibilities currently widespread in the literature of this domain. The results arising from the methodology proposed are those derived from invasive procedures and considered solid bases for comparative purposes, namely the IEC and the Controlled Operational State Change (COSC) methods.
Table 1 summarizes the main methodological proposals that are most widespread in the literature. This article uses two of these to establish comparative terms with the proposed method. The two procedures used (IEC and COSC) proved to be more efficacious [24].
The main contents of the paper are summarized as follows. Section 2 presents the fundamentals of the superposition methods and complex independent component analysis. Section 3 is related to the CICA approach made in this article to determine the contribution of agents in the voltage imbalance. Section 4 gives the electrical system used for the investigations and four operating conditions used as case studies to analyze the proposal’s effectiveness. In Section 5, a comparative analysis between the results obtained with the proposed method and those presented by the IEC and COSC is carried out. In Section 6, the conclusions about the performance of the proposed method in this article are presented.

2. The Proposed Method for Determining Voltage Imbalances Contributions

Studies on the attribution of responsibilities for events between two or more agents involve analysis processes based on the principles of superposition of effects. In this sense, several studies show that the superposition method has been shown to be feasible [25]. However, despite recognizing the physical consistency of the process, the use of superposition principles may be impractical due to the lack of knowledge of essential parameters required by the established formulations. In this way, the proposal made by this article contemplates the use of the superposition principle, whose required parameters are provided by the application of the CICA method.

2.1. Superposition Method

The superposition method is widely accepted to support studies of responsibility sharing of disturbances that affect PQ from a theoretical point of view. Although this approach had been elaborated initially for applications concerning harmonic phenomena [25], it is understood that its application for imbalances is also feasible [35]. Considering a supplier and a consumer connected to a PCC, the equivalent Norton circuit related to the negative sequence components is shown in Figure 1.
Where V ˙ 2 C P C C and I ˙ 2 C P C C represent the voltage and current of negative sequence at the PCC; Z ˙ 2 S and Z ˙ 2 C are the supplier and the consumer equivalent impedances of negative sequence; I ˙ 2 S and I ˙ 2 C are the current sources of the negative sequence produced by the supplier and consumer, respectively.
From the equivalent circuit, it is possible to obtain Equation (1). This expression establishes the relationship between the electrical quantities on the PAC as a function of the agent’s impedances and current sources:
[ V ˙ 2 P C C I ˙ 2 P C C ] = [ Z ˙ 2 S Z ˙ 2 C Z ˙ 2 S + Z ˙ 2 C Z ˙ 2 S Z ˙ 2 C Z ˙ 2 S + Z ˙ 2 C Z ˙ 2 S Z ˙ 2 S + Z ˙ 2 C Z ˙ 2 C Z ˙ 2 S + Z ˙ 2 C ] [ I ˙ 2 S I ˙ 2 C ]  
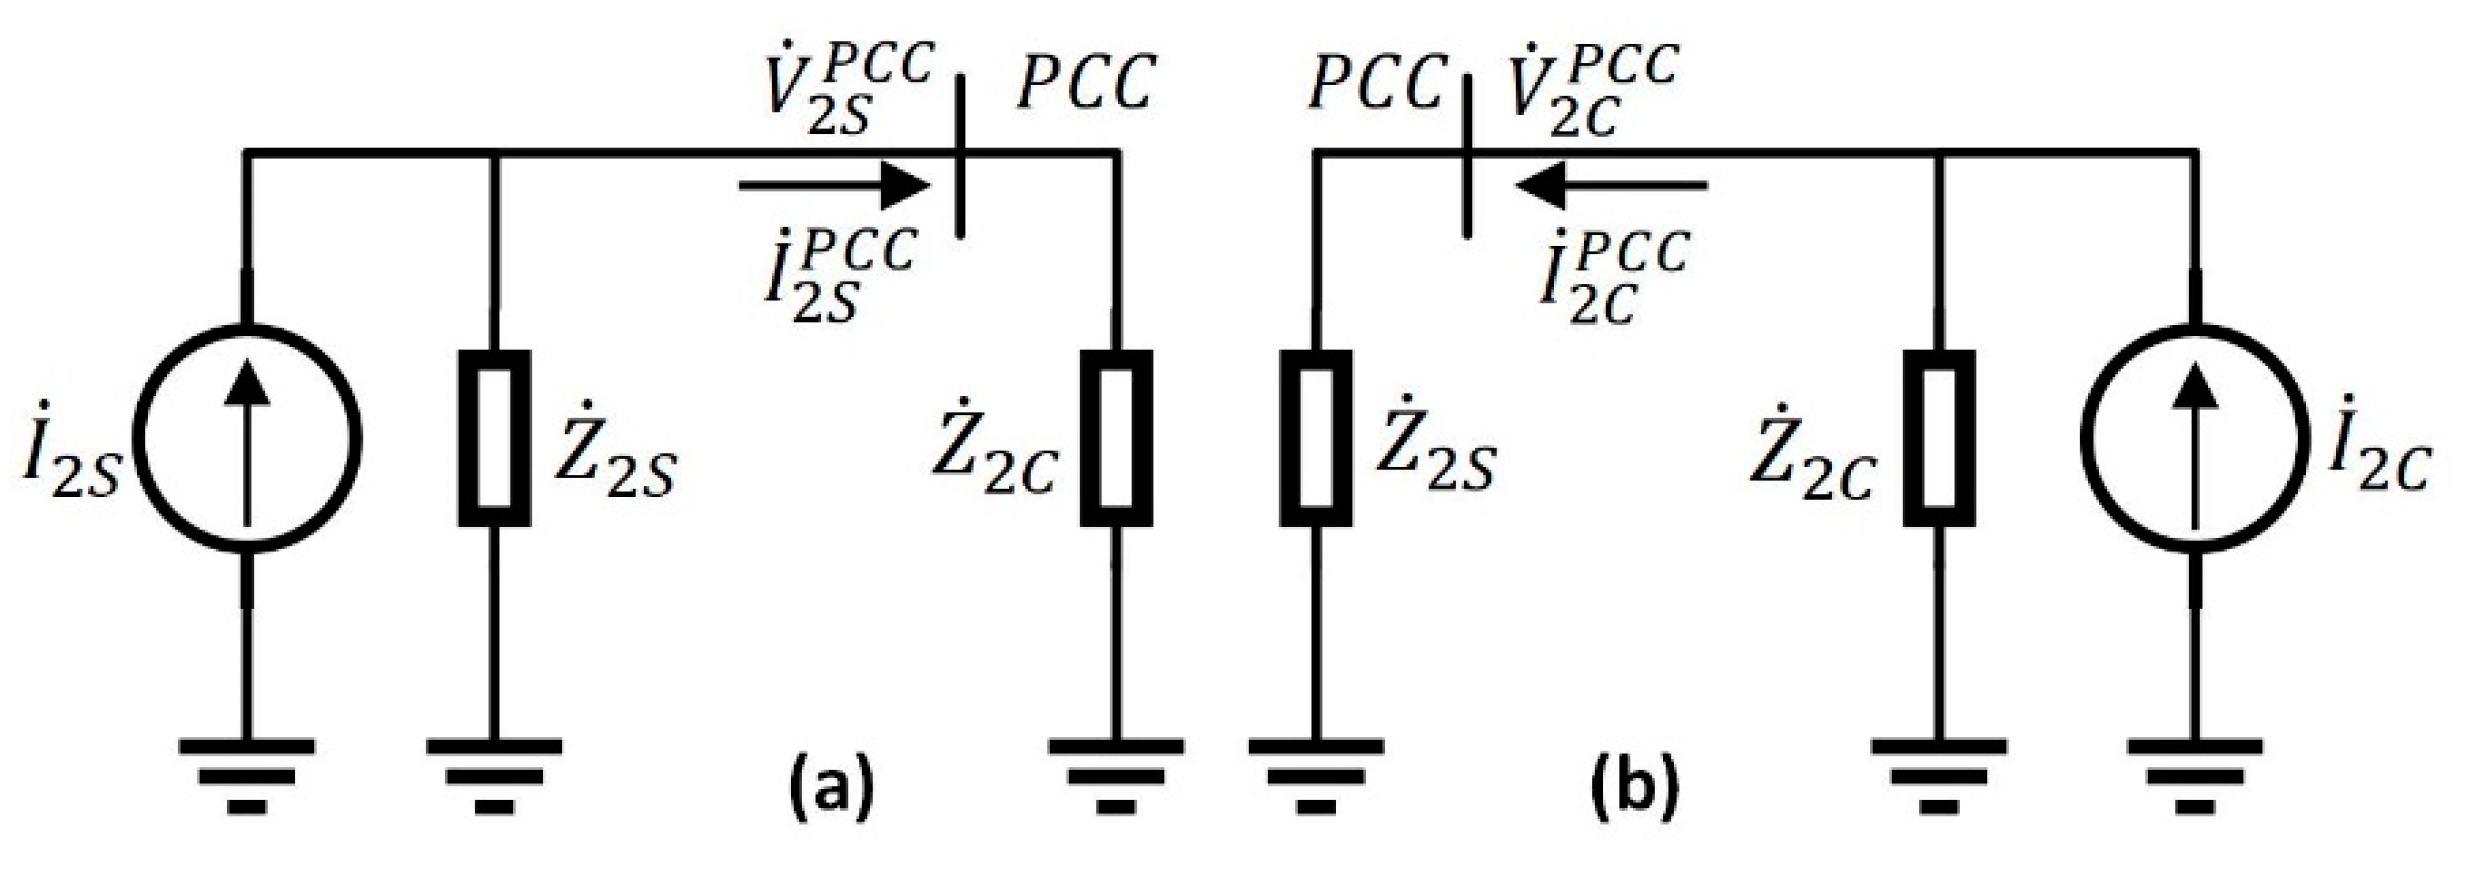
By applying the superposition theorem, as given in Figure 2, it is possible to obtain V ˙ 2 C P C C and V ˙ 2 S P C C representing the negative-sequence voltage at the PCC attributed to the consumer and supplier, respectively. The phasor composition of these components gives the total negative sequence voltage at the PCC, that is V ˙ 2 C P C C + V ˙ 2 S P C C = V ˙ 2 P C C .
The contribution from each agent to the total voltage at the PCC is calculated in Equations (2) and (3):
V ˙ 2 S P C C = Z ˙ 2 S Z ˙ 2 C Z ˙ 2 S + Z ˙ 2 C ( V ˙ 2 P C C Z 2 S + I ˙ 2 P C C )  
V ˙ 2 C P C C = Z ˙ 2 S Z ˙ 2 C Z ˙ 2 S + Z ˙ 2 C ( V ˙ 2 P C C Z 2 C I ˙ 2 P C C )  
The voltage imbalance contribution attributed to the consumer V I C C % and supplier V I C S % is determined in line with Equations (4) and (5), as shown in Figure 3.
V I C C % = | V ˙ 2 C P C C | cos α | V ˙ 2 P C C | 100 %  
V I C S % = | V ˙ 2 S P C C | cos β | V ˙ 2 P C C | 100 %  
There is a consensus in the literature that the Superposition Method has an excellent theoretical base, and several studies show its effectiveness [35,36]. However, as explained above, prior knowledge of the negative sequence impedances of the supplier and consumer is required. These quantities are hard to obtain through traditional procedures. For this reason, there is a need for means to circumvent such practical limitations. To this end, one of the available technical resources is based on using Complex Independent Component Analysis. This paper uses this technique to determine the impedances mentioned above to apply the Superposition method.

2.2. Complex Independent Component Analysis Technique

The Independent Component Analysis is one of the most utilized techniques for Blind Source Separation (BSS). It aims to recuperate original signals (sources) from mixed signals without prior knowledge of the sources or how they were mixed [37].
The mathematical model used to solve problems related to CICA is described in Equation (6):
X ( t ) = A S ( t )  
where t is the discrete time; t = 1 ,   2 ,   ,   t n . S ( t ) = [ S 1 ( t ) ,   S 2 ( t ) ,   ,   S n ( t ) ] T is the source signals matrix, also denominated as independent components; X ( t ) = [ X 1 ( t ) ,   X 2 ( t ) ,   ,   X m ( t ) ] T is the observed signals matrix; and A is a mixing matrix with m × n dimensions. It is noteworthy here that to suitably employ CICA, certain conditions must be met: the source signals must be statistically independent, at most one of the source signals has a Gaussian distribution and the matrix A must be of full column rank (m ≥ n) [37,38,39].
Therefore, the purpose of CICA is to estimate a separation matrix W H . This allows for the source signals’ recovery, as stated in Equation (7). To this end, the CICA technique searches for a solution by maximizing the non-Gaussianity of the observed signals and the source signals’ independence. Bearing in mind that, according to the central limit theorem, the sum of a set of independent random variables with similar distributions tends to be more Gaussian than each original variable:
S ^ = W H X
where S ^ is the estimated signal sources matrix; W H is the separation matrix; and the superscript H specifies that the matrix W is Hermitian.
There exist several algorithms that propose solutions for CICA. However, to present an efficient and robust computational performance, the Adaptive Complex Maximization of Non-Gaussianity (A-CMN) is used [34]. This algorithm maximizes the non-Gaussianity through differential entropy, which is equivalent to the maximization of negentropy [40]. To minimize the complexity of the problem, data preprocessing becomes necessary. This procedure is carried out in two steps. The first is known as centering. It consists of subtracting the matrix’s mean value that contains the observed signals, as indicated in Equation (8):
X ˜ i ( t ) = X i ( t ) 1 m t = 1 m X i ( t )  
The second step, called whitening, is aimed at un-correlating the observed variables and adjusting the variance value to one. Whitening can be represented through a linear transformation Equation (9):
Z ( t ) = Q X ˜ ( t )
Through the application of the whitening matrix Q , one can perform the whitening of the matrix X ˜ ( t ) , in a way that E [ X ˜ X ˜ T ] = I , where I is an identity matrix. The matrix Q is calculated using Equation (10), where Λ is the diagonal matrix of eigenvalues of the covariance matrix E [ X ˜ X ˜ T ] , and Γ is the orthogonal matrix of eigenvectors of the covariance matrix E [ X ˜ X ˜ T ] :
Q = Λ 1 2 Γ T
At the end of the preprocessing steps, the observed signals are said to be white. This procedure reduces approximately half the computational effort of applying the CICA [39].
Upon applying the matrix Z ( t ) to CICA, the algorithm produces the matrix W H , which is equivalent to the signal mixing matrix of the estimated sources, as in Equation (11):
S ^ = W H Q X
It is worth mentioning that the CICA application requires information about the slow and fast variations of the phenomenon under analysis. Without such records, the method is not feasible. For this reason, its use is restricted to field records that meet the premises of the procedure.

3. The CICA Technique for Determining Voltage Imbalance Contributions

To apply the CICA technique to find the contribution from the supplier and the consumer, the parameters representing the consumer ( I ˙ 2 C , Z ˙ 2 C ) and supplier ( I ˙ 2 S , Z ˙ 2 S ) are required. The problem is described in Equation (1) and represented in Equation (12), where k is the number of measurement samples over the defined time interval:
P 2 × k = Z 2 × 2 I 2 × k
where:
[ V ˙ 2 P C C ( 1 , 1 ) I ˙ 2 P C C ( 2 , 1 ) ] = [ Z ˙ 2 S Z ˙ 2 C Z ˙ 2 S + Z ˙ 2 C Z ˙ 2 S Z ˙ 2 C Z ˙ 2 S + Z ˙ 2 C Z ˙ 2 S Z ˙ 2 S + Z ˙ 2 C Z ˙ 2 C Z ˙ 2 S + Z ˙ 2 C ] [ I ˙ 2 S ( 1 , 1 ) I ˙ 2 C ( 2 , 1 ) ]
From the model presented in Equation (12), one can establish a relationship with Equation (6) in searching for a solution based on the CICA method. Although this compatibility exists for applying CICA, other requirements still need to obtain relevant results. Hence, it is necessary that I ˙ 2 S and I ˙ 2 C are statistically independent and present non-Gaussian probability distribution. The loads on an electric system are not entirely independent, as there is a dependence arising from external factors. As such, the load variations on the electric system are composed of two parts. One is a slowly varying component related to external factors such as temperature, climate, yearly seasons, etc. The other, a fast-varying component, is associated with instantaneous consumption, which is statistically independent due to its stochastic nature [38,41].
Therefore, to reach the statistical requirements necessary for applying CICA, the fast-varying component of matrix P will be used since it satisfies Equation (13):
P f a s t = Z I f a s t
To determine the matrix P f a s t , it is necessary to apply a moving average filter to matrix P , thus allowing for the use of the CICA algorithm. Therefore, upon correlating Equation (11) with Equation (13), one arrives at the following relationship:
S ^ = W H Q X I f a s t = Z 1 P f a s t
Considering P f a s t as the matrix of observed signals, the matrices related to the estimated coefficients W H and whitening Q are obtained. As such, in (15), the matrix U is an estimation of Z 1 , where I ^ follows as an estimation of I f a s t :
I ^ = U P f a s t
as such:
U = W H Q = [ u 11   u 12   u 21   u 22 ] = Z 1
Faced with the possibility of the scaling and ordering indeterminacies of the estimated source signals ( S ^ ), due to the lack of knowledge concerning the characteristics of the source signals and how they were mixed ( A ), two strategies may be adopted. The first aims at correcting the scaling indeterminacy; for this, the matrix of estimated current sources is related to the actual matrix, using the correction factors k S and k C , as in the following:
I ^ = [ I ^ 2 S I ^ 2 C ] = [ k S I ˙ 2 S k C I ˙ 2 C ]
by substituting (16) into (15), one has:
[ I ˙ 2 S I ˙ 2 C ] = [ u 11 k S u 12 k S u 21 k C u 22 k C ] [ V ˙ 2 P C C I ˙ 2 P C C ]
the inverse of Equation (1) provides:
[ I ˙ 2 S I ˙ 2 C ] = [ 1 Z ˙ 2 S 1 1 Z ˙ 2 C 1 ] [ V ˙ 2 P C C I ˙ 2 P C C ]
through a comparison of Equations (17) and (18), it is possible to achieve:
Z ˙ 2 S = u 12 u 11
Z ˙ 2 C = u 22 u 21
To sort out the indeterminacies arising from the order in which I ^ 2 S and I ^ 2 C are arranged in matrix I ^ in Equation (16), one uses the property that the real part of the impedance   Z ˙ 2 S is always positive [29]. Initially, the impedance Z ˙ 2 S is calculated through Equation (19) by considering that the ordering of the currents is in accordance with Equation (16). If the real part of Z ˙ 2 S is greater than zero, then the order attributed is correct. If this does not occur, the order is incorrect; thus, one must permute the rows of the matrix I ^ and the columns of the matrix U . With such an approach, the indetermination is sorted out, and the impedances can again be calculated by Equations (19) and (20).
By knowing the impedances, the contribution of the supplier and the consumer to the total negative-sequence voltage can be calculated using Equations (2) and (3). Finally, one calculates the portion of responsibility through Equations (4) and (5).
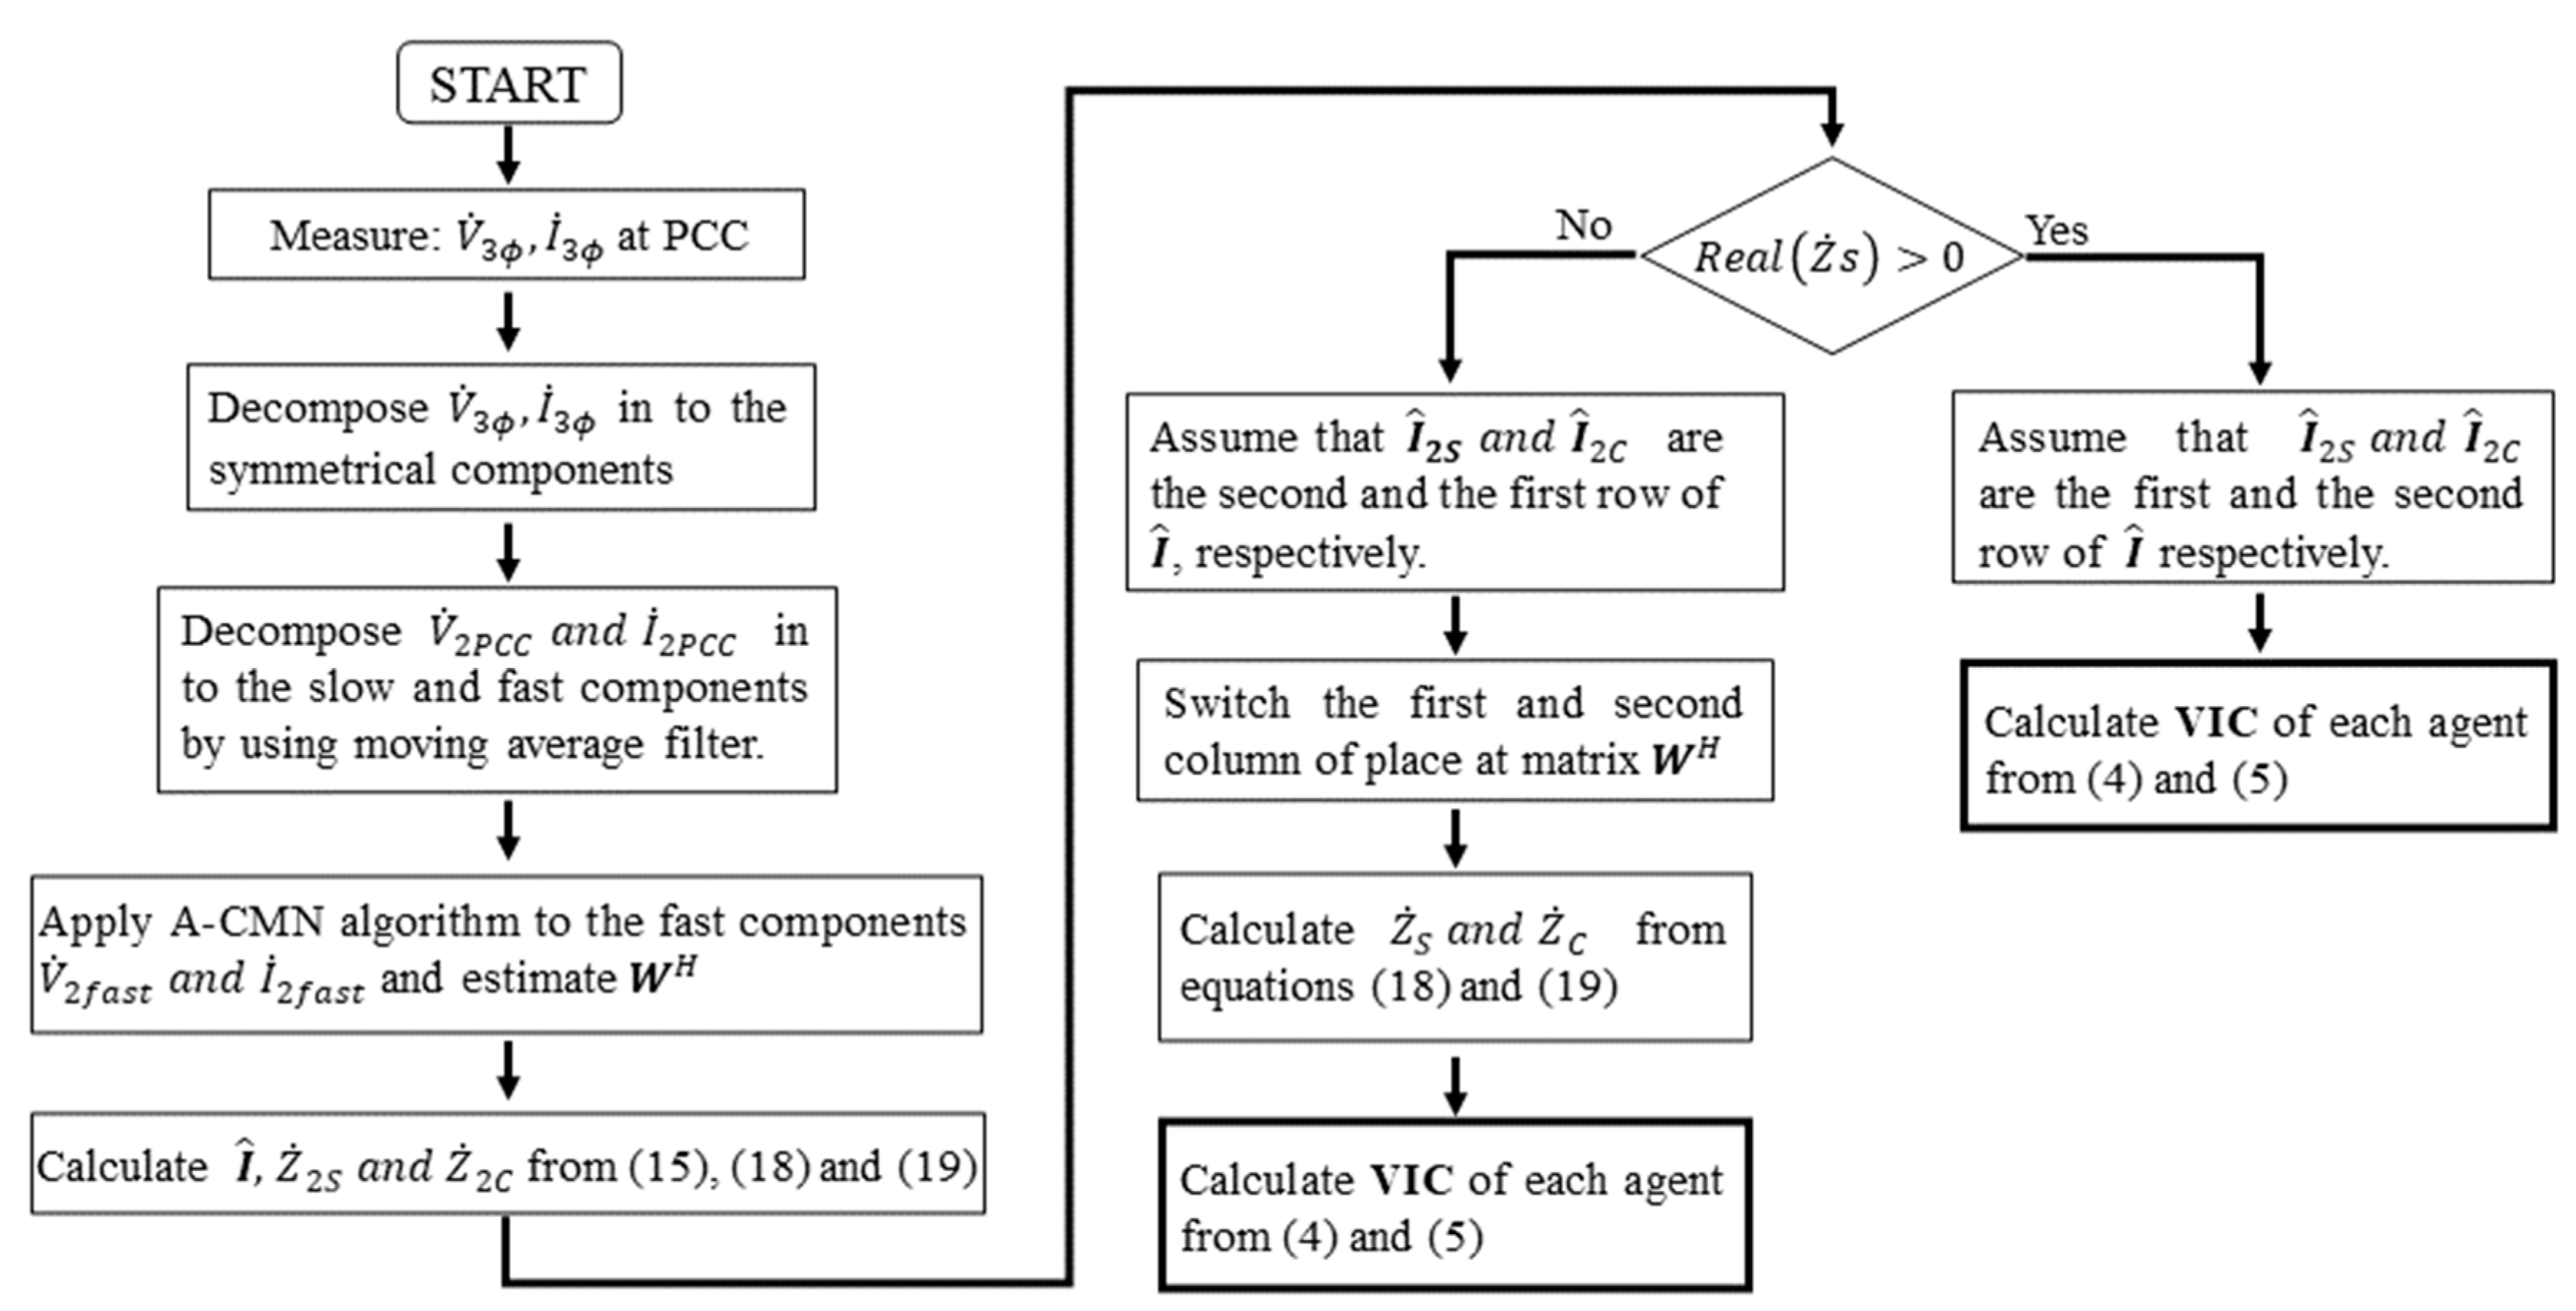
Figure 4 synthesizes the steps of the complete process, from the measurement results to the percentages of responsibility for the anomalous phenomenon being studied.

4. Case Studies

The analysis of the methodology effectiveness for sharing the PCC negative sequence voltage responsibility was carried out using a typical distribution feeder. The electric arrangement is shown in Figure 5, indicating a composition associated with a supplier agent and a consumer. The supplier is represented by a balanced three-phase voltage source, a step-down transformer, distribution lines, and an unbalanced load to produce the utility negative sequence voltage contribution. The consumer unit contains balanced and unbalanced loads connected at the coupling point.
The parameters that characterize the electrical system used for the studies are indicated in Table 2. The parameters are self-explanatory, except for the quantity k. This magnitude is intended to control the degree of imbalance produced by the utility and the consumer. When using k = 1, this implies the rated load insertion. To represent typical profiles of voltage unbalance factors obtained through measurement, variations for k are used to greater or lesser voltage imbalance severity.
The investigations were computationally carried out using the MATLAB/Simulink software. The electric system was simulated using a 24-h power consumption profile to produce the unbalanced voltage at the PCC [42]. In line with the requirements established by the proposed methodology, the unbalanced loads 01 and 03 were taken as variable consumption while the others were kept constant.
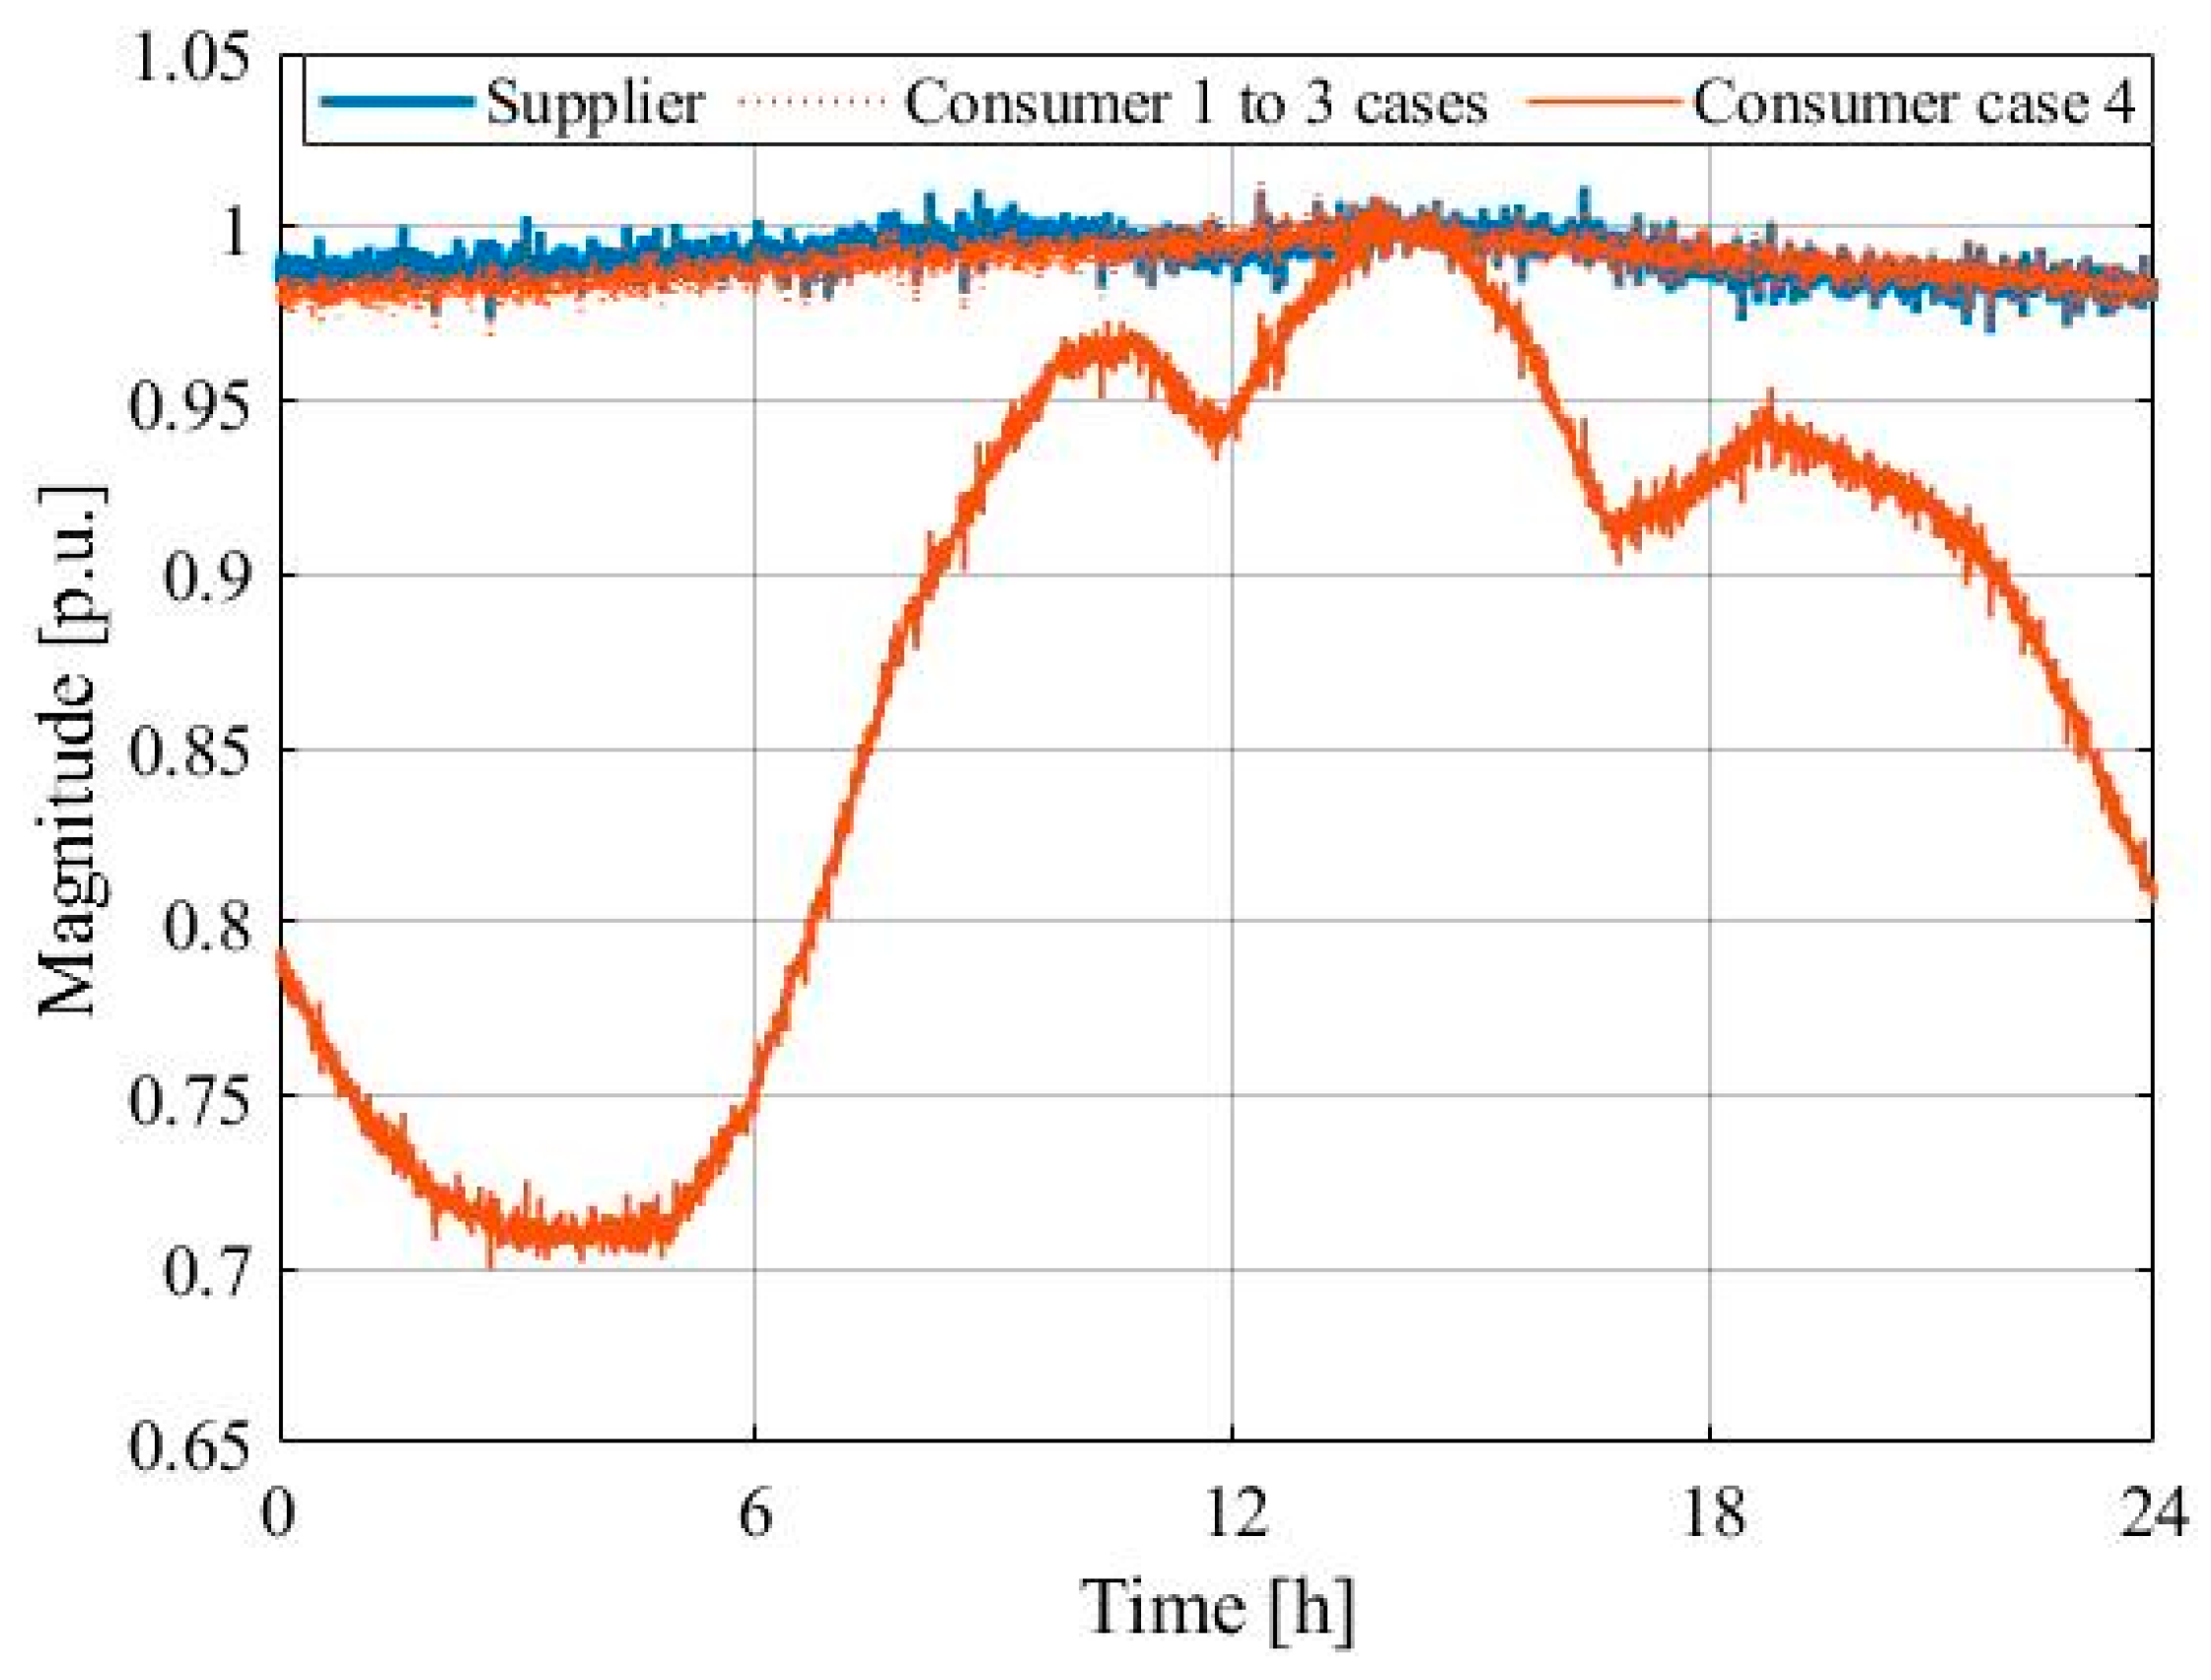
The load’s variations were assumed to produce the fast and slow changes required by the CICA approach. The fast variation was based on the Laplace distribution with zero mean value and variance of 0.01. The slow one shown in Figure 6 shows two typical days of industrial consumption. One is related to significant changes in the required power, while the second represents a smoother behavior. The values are given in pu referenced to the load-rated power shown in Figure 6.
Based on the power consumption profiles shown in Figure 6, similar situations were established for the behavior of the levels of imbalances imposed on the supplier and the consumer voltages produced at the PCC. In these terms, the corresponding profiles of negative sequence voltages were established for the situations associated with loads indicating smooth or accentuated variations.
The situations associated with profiles of negative sequence voltage components indicating smoother behavior could be understood as a connection between a transmission and a distribution system. On the other hand, the variations in the negative sequence components in greater intensity would indicate the behavior of industrial consumers, such as steel companies.
In line with the established operating conditions, the investigative work conducted in this paper was defined in terms of four cases. These are presented below:
  • Case 1: Both supplier and consumer with smoothly unbalanced voltage profiles;
  • Case 2: Balanced voltage supply condition and consumer with smoothly unbalanced voltage profile;
  • Case 3: Smoothly unbalanced voltage supply profile with balanced consumer loads;
  • Case 4: Smoothly unbalanced voltage supply condition with significant consumer unbalanced load profile changes.
Case 1 relates to the condition where both of the agents are presented as sources of voltage imbalances. This case imposes practically constant levels for the rated load imbalances given in Table 2 to establish a physical basis for analyzing the results. This operational condition is provided through random and slight changes for the k factor under the consumption profile shown in Figure 6. In this way, both the utility and consumer show a smooth voltage unbalance factor.
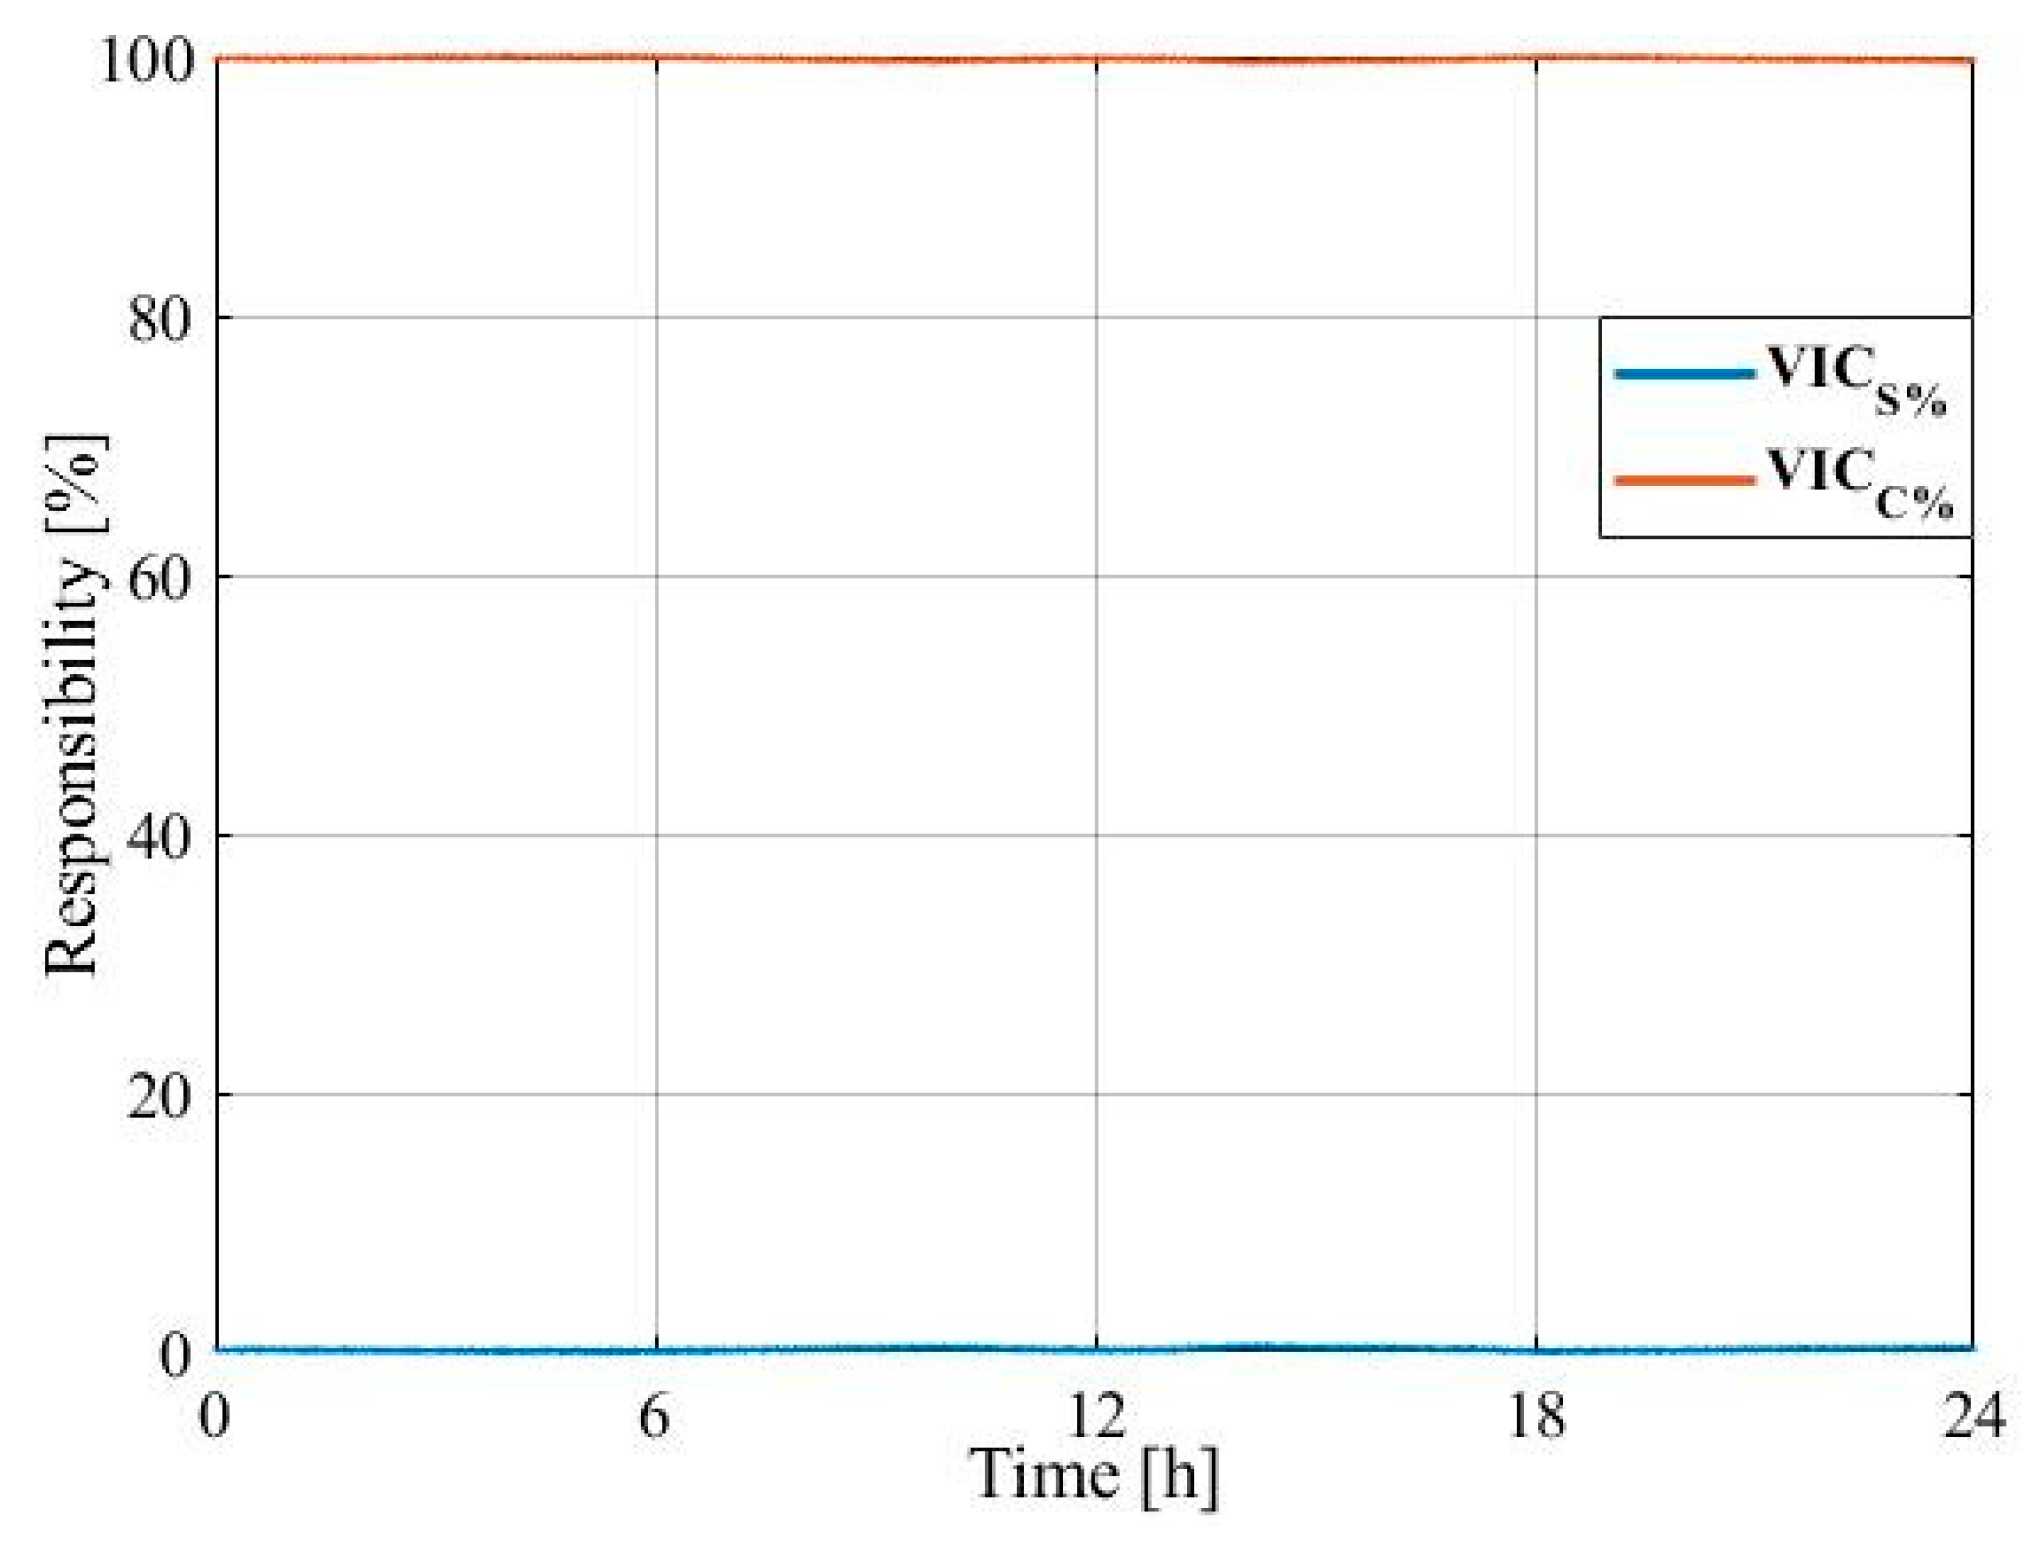
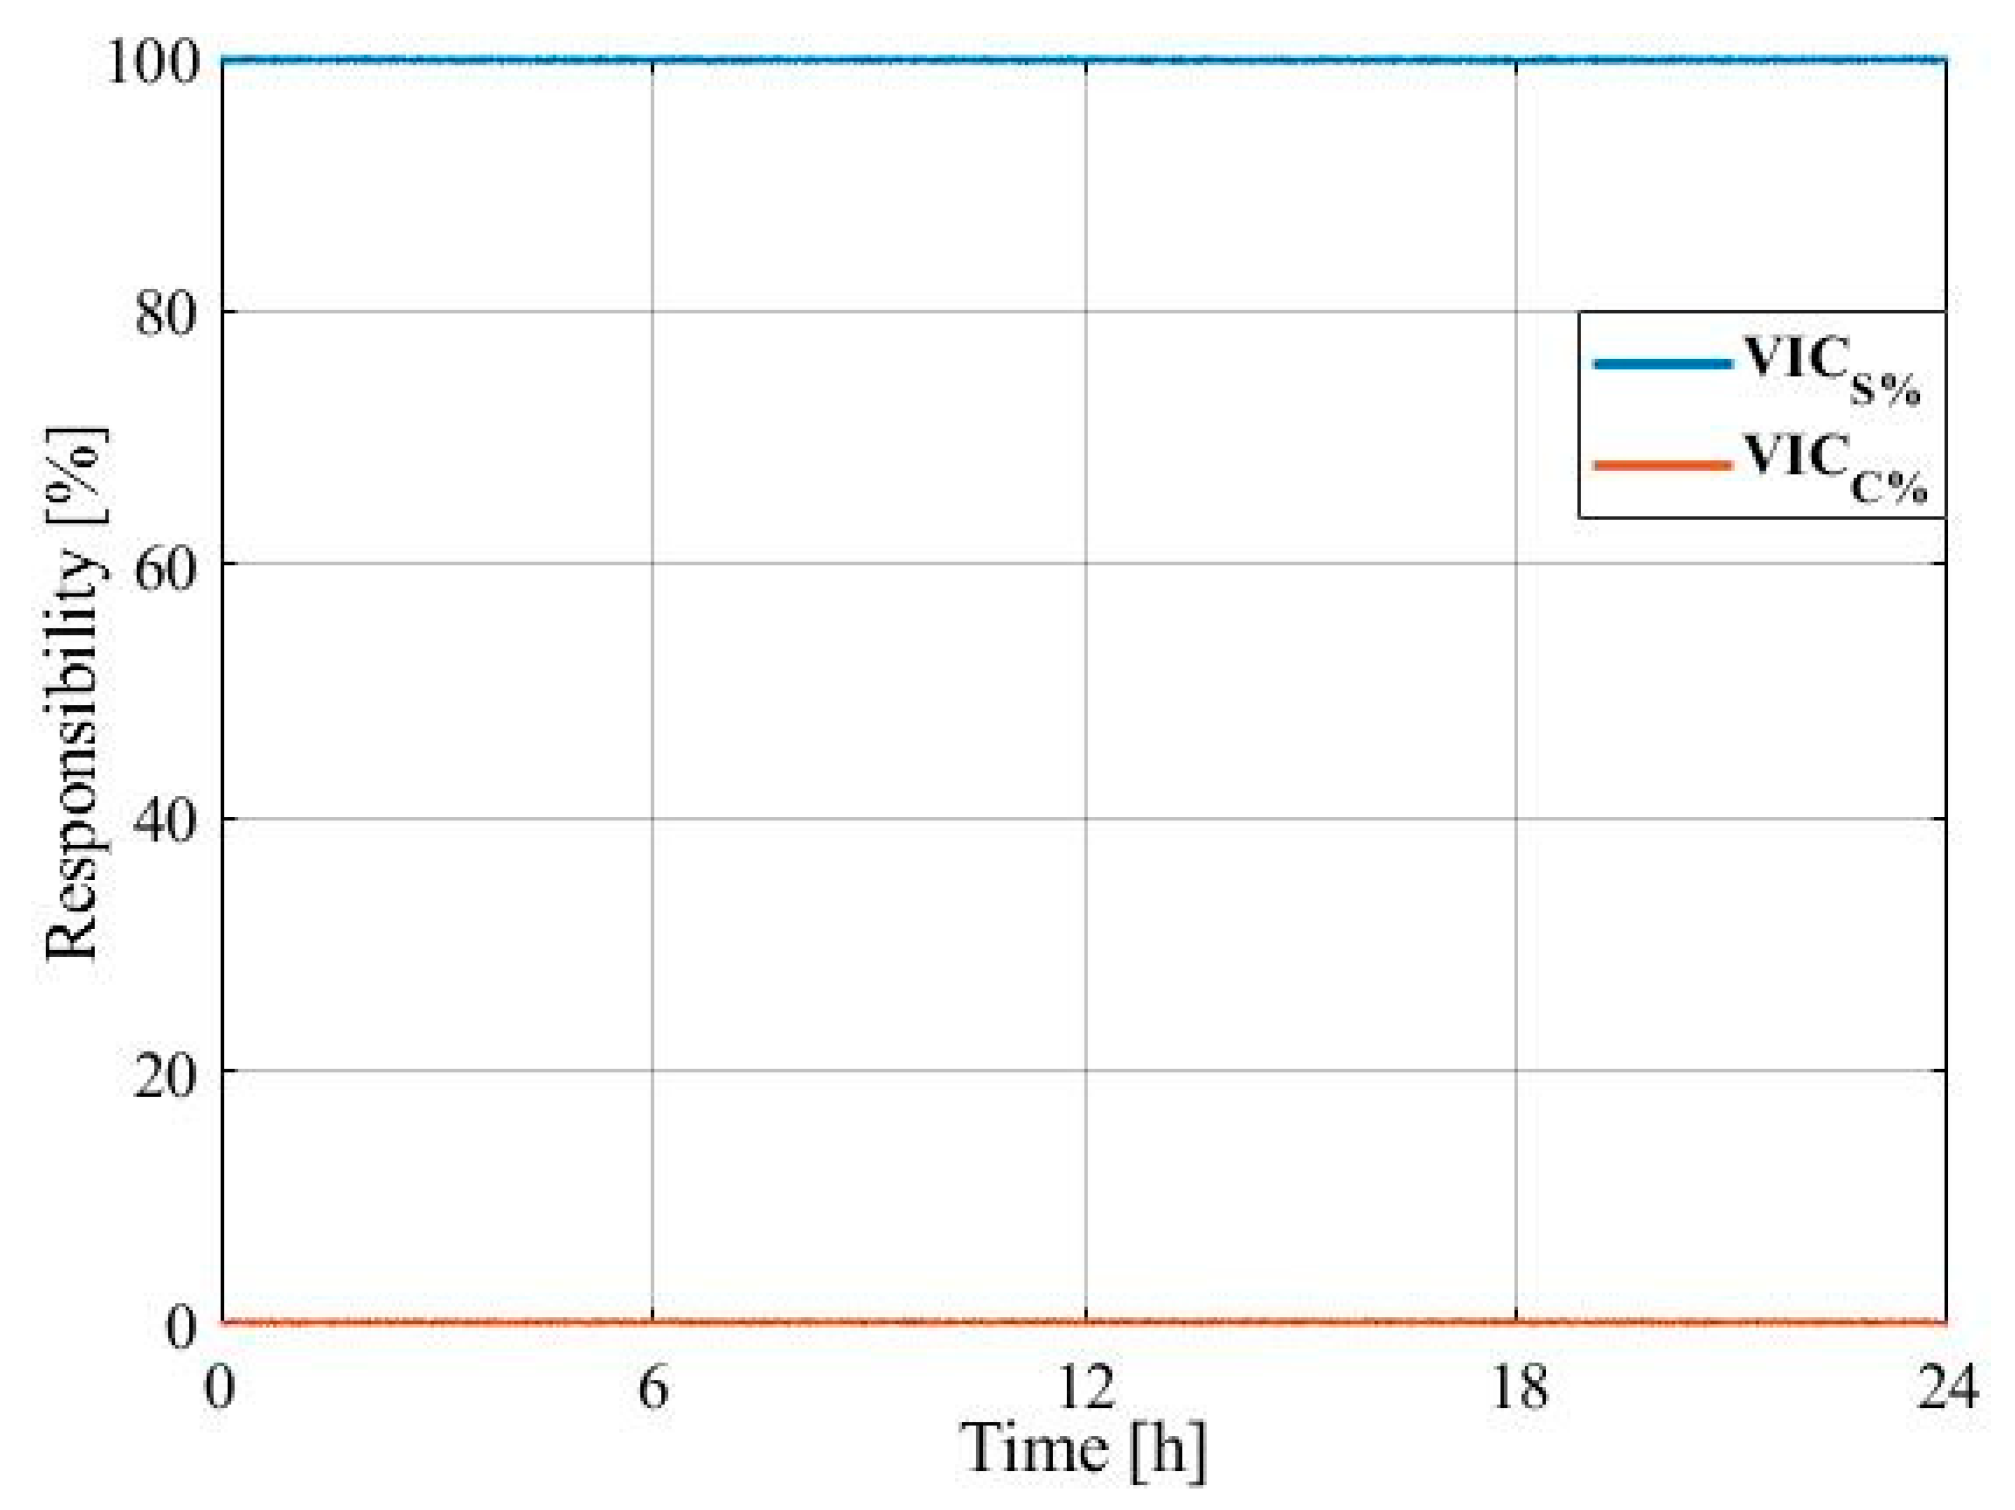
On the other hand, Cases 2 and 3 correspond to operational situations such that the supplier and the consumer are presented as the dominant sources for voltage unbalances in the PCC. This behavior is achieved by imposing balanced loads on either side. In these terms, the physical expectation is that the suppliers’ and consumers’ contributions are 100% from one agent. Once again, slight variations for the k factor, around 1.0 pu, are used to achieve a smoothly unbalanced profile. These extreme operating conditions are applied to evaluate the effectiveness of the CICA method.
Finally, Case 4 is based on a joint contribution of the supplier and the consumer, with pre-established participation by the level of their unbalanced loads with dynamic behavior randomly imposed in accentuated proportions.
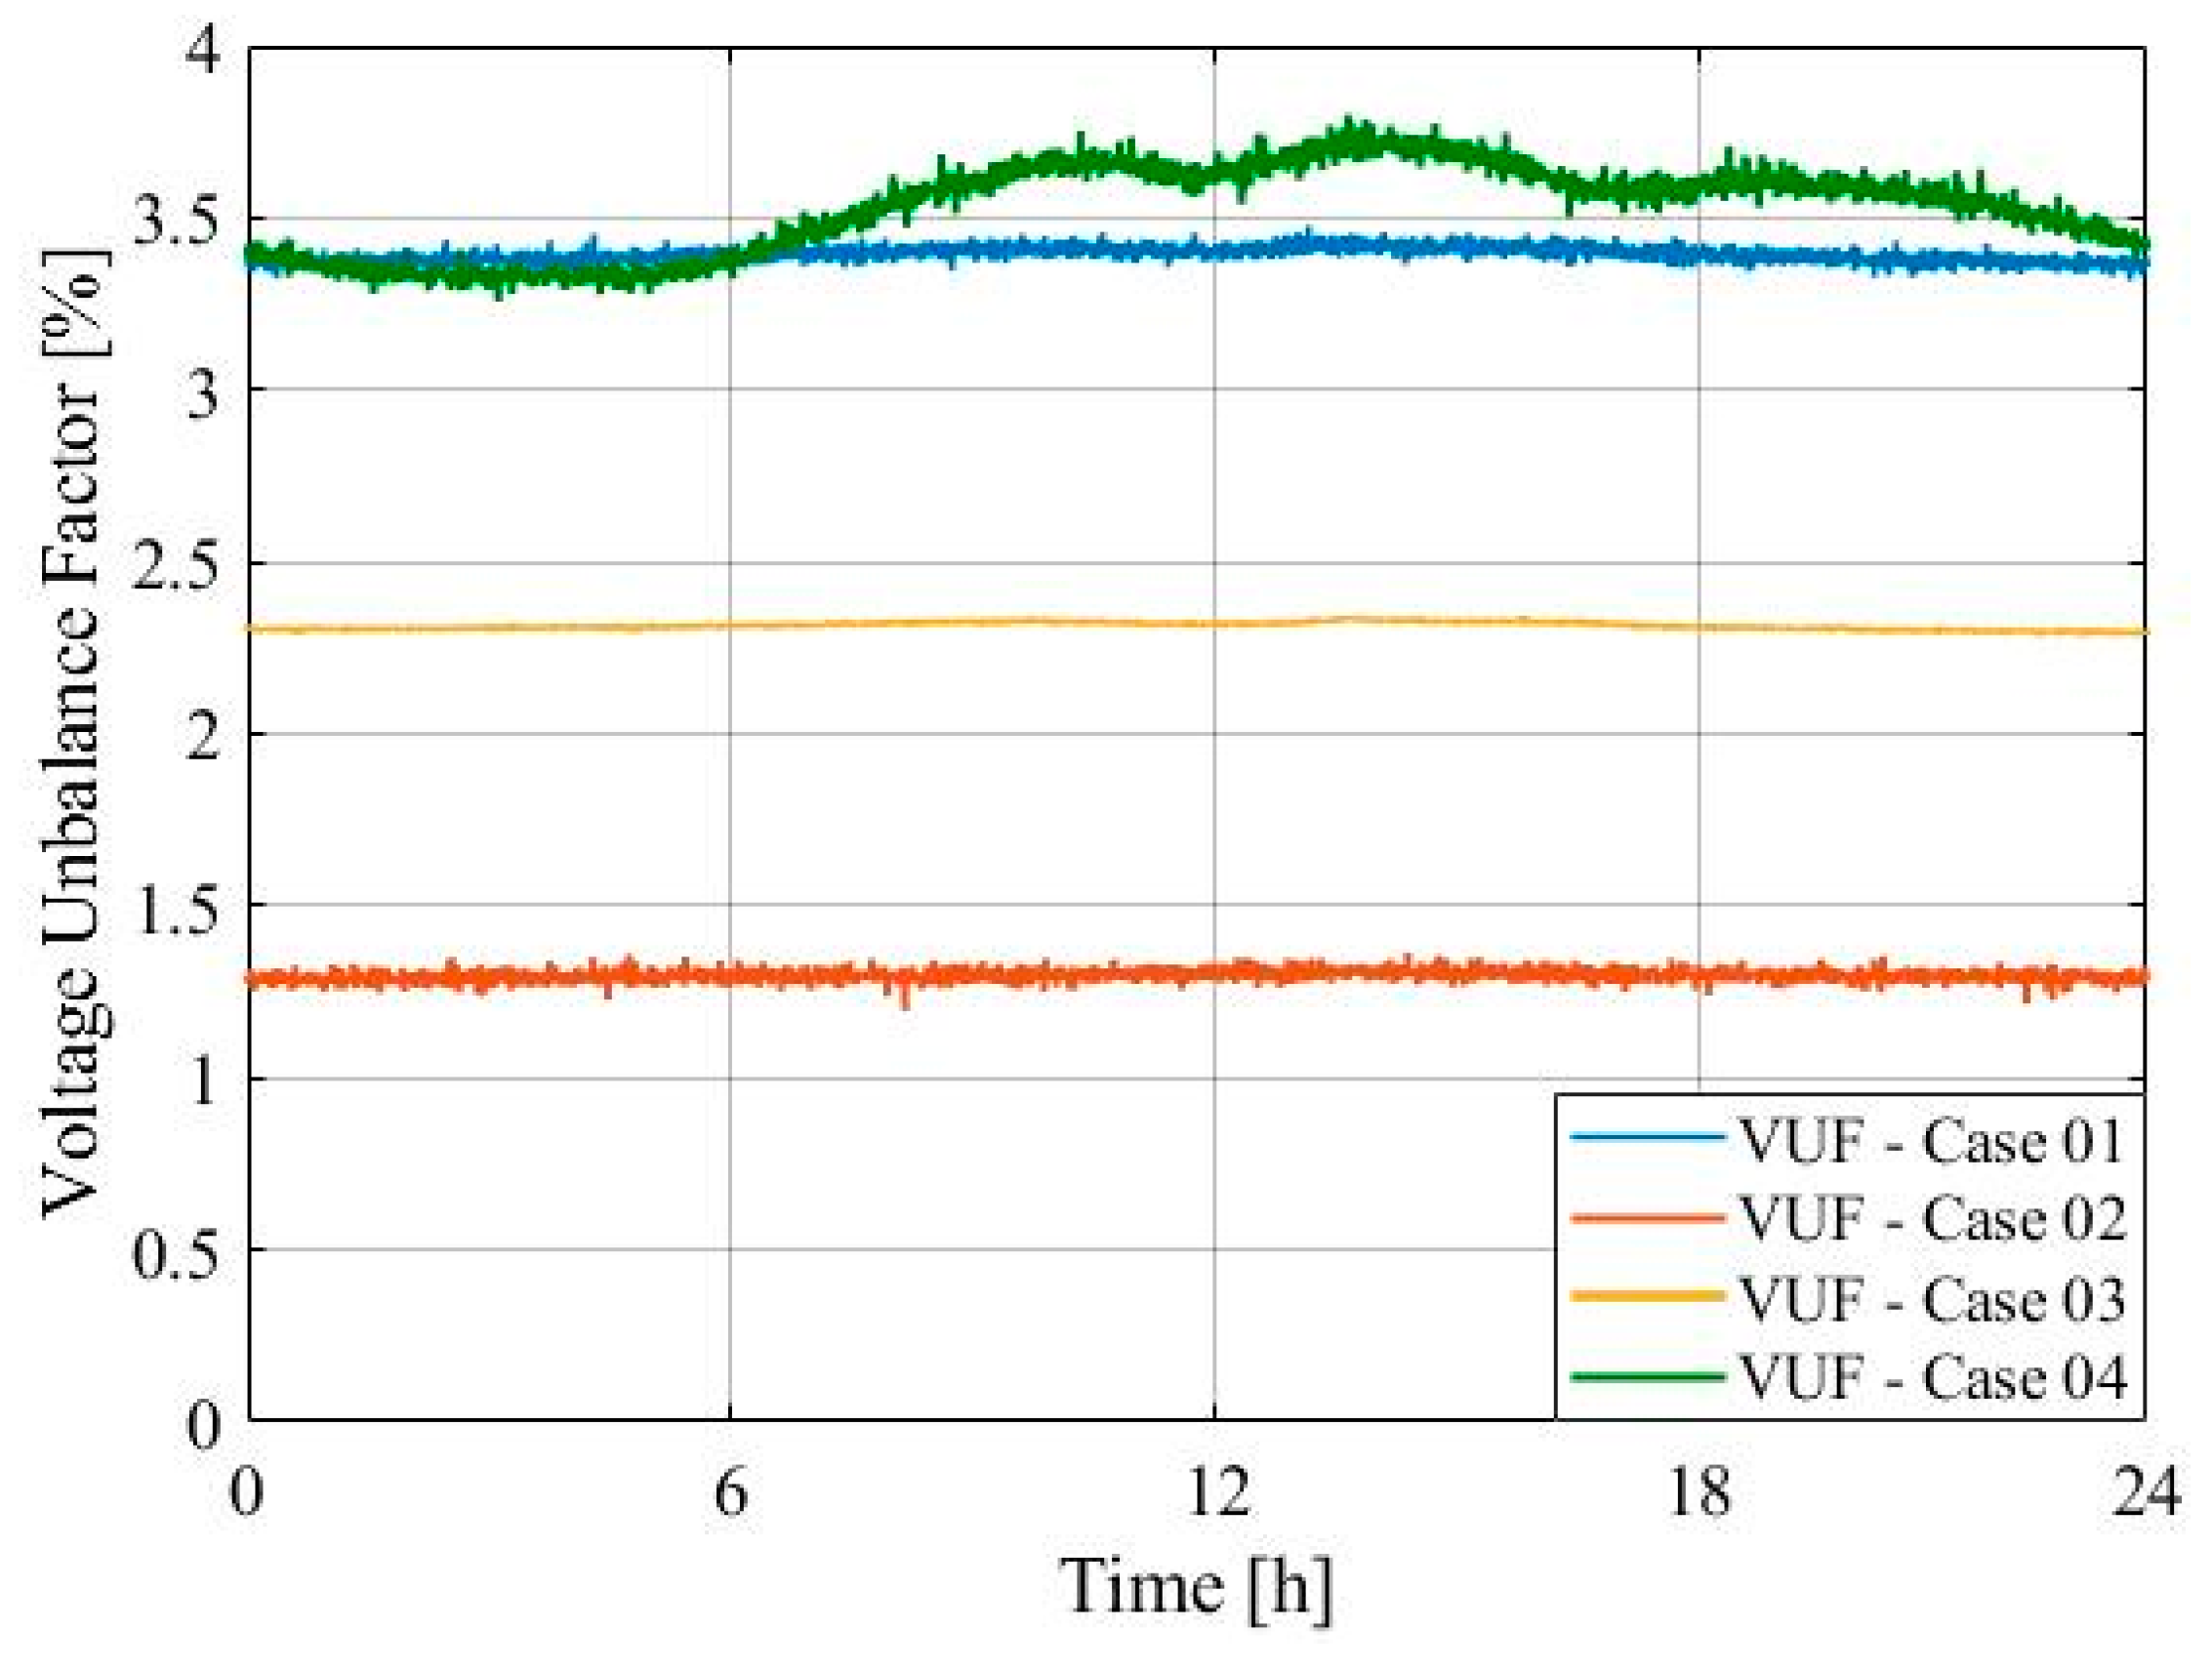
Figure 7 illustrates the PCC’s 24-h voltage unbalanced factor profile for the above four situations. It should be noted here that the values indicated reflect the combined effects of the two agents (supplier and consumer).
The VUF% index represents the quantity that quantifies the level of negative sequence voltage unbalances. According to most standards [18,43] that regulate power quality indexes, this value must have a limit of 2%. The results show that for Cases 1, 3, and 4, the VUF at the PCC exceeds the established limit.
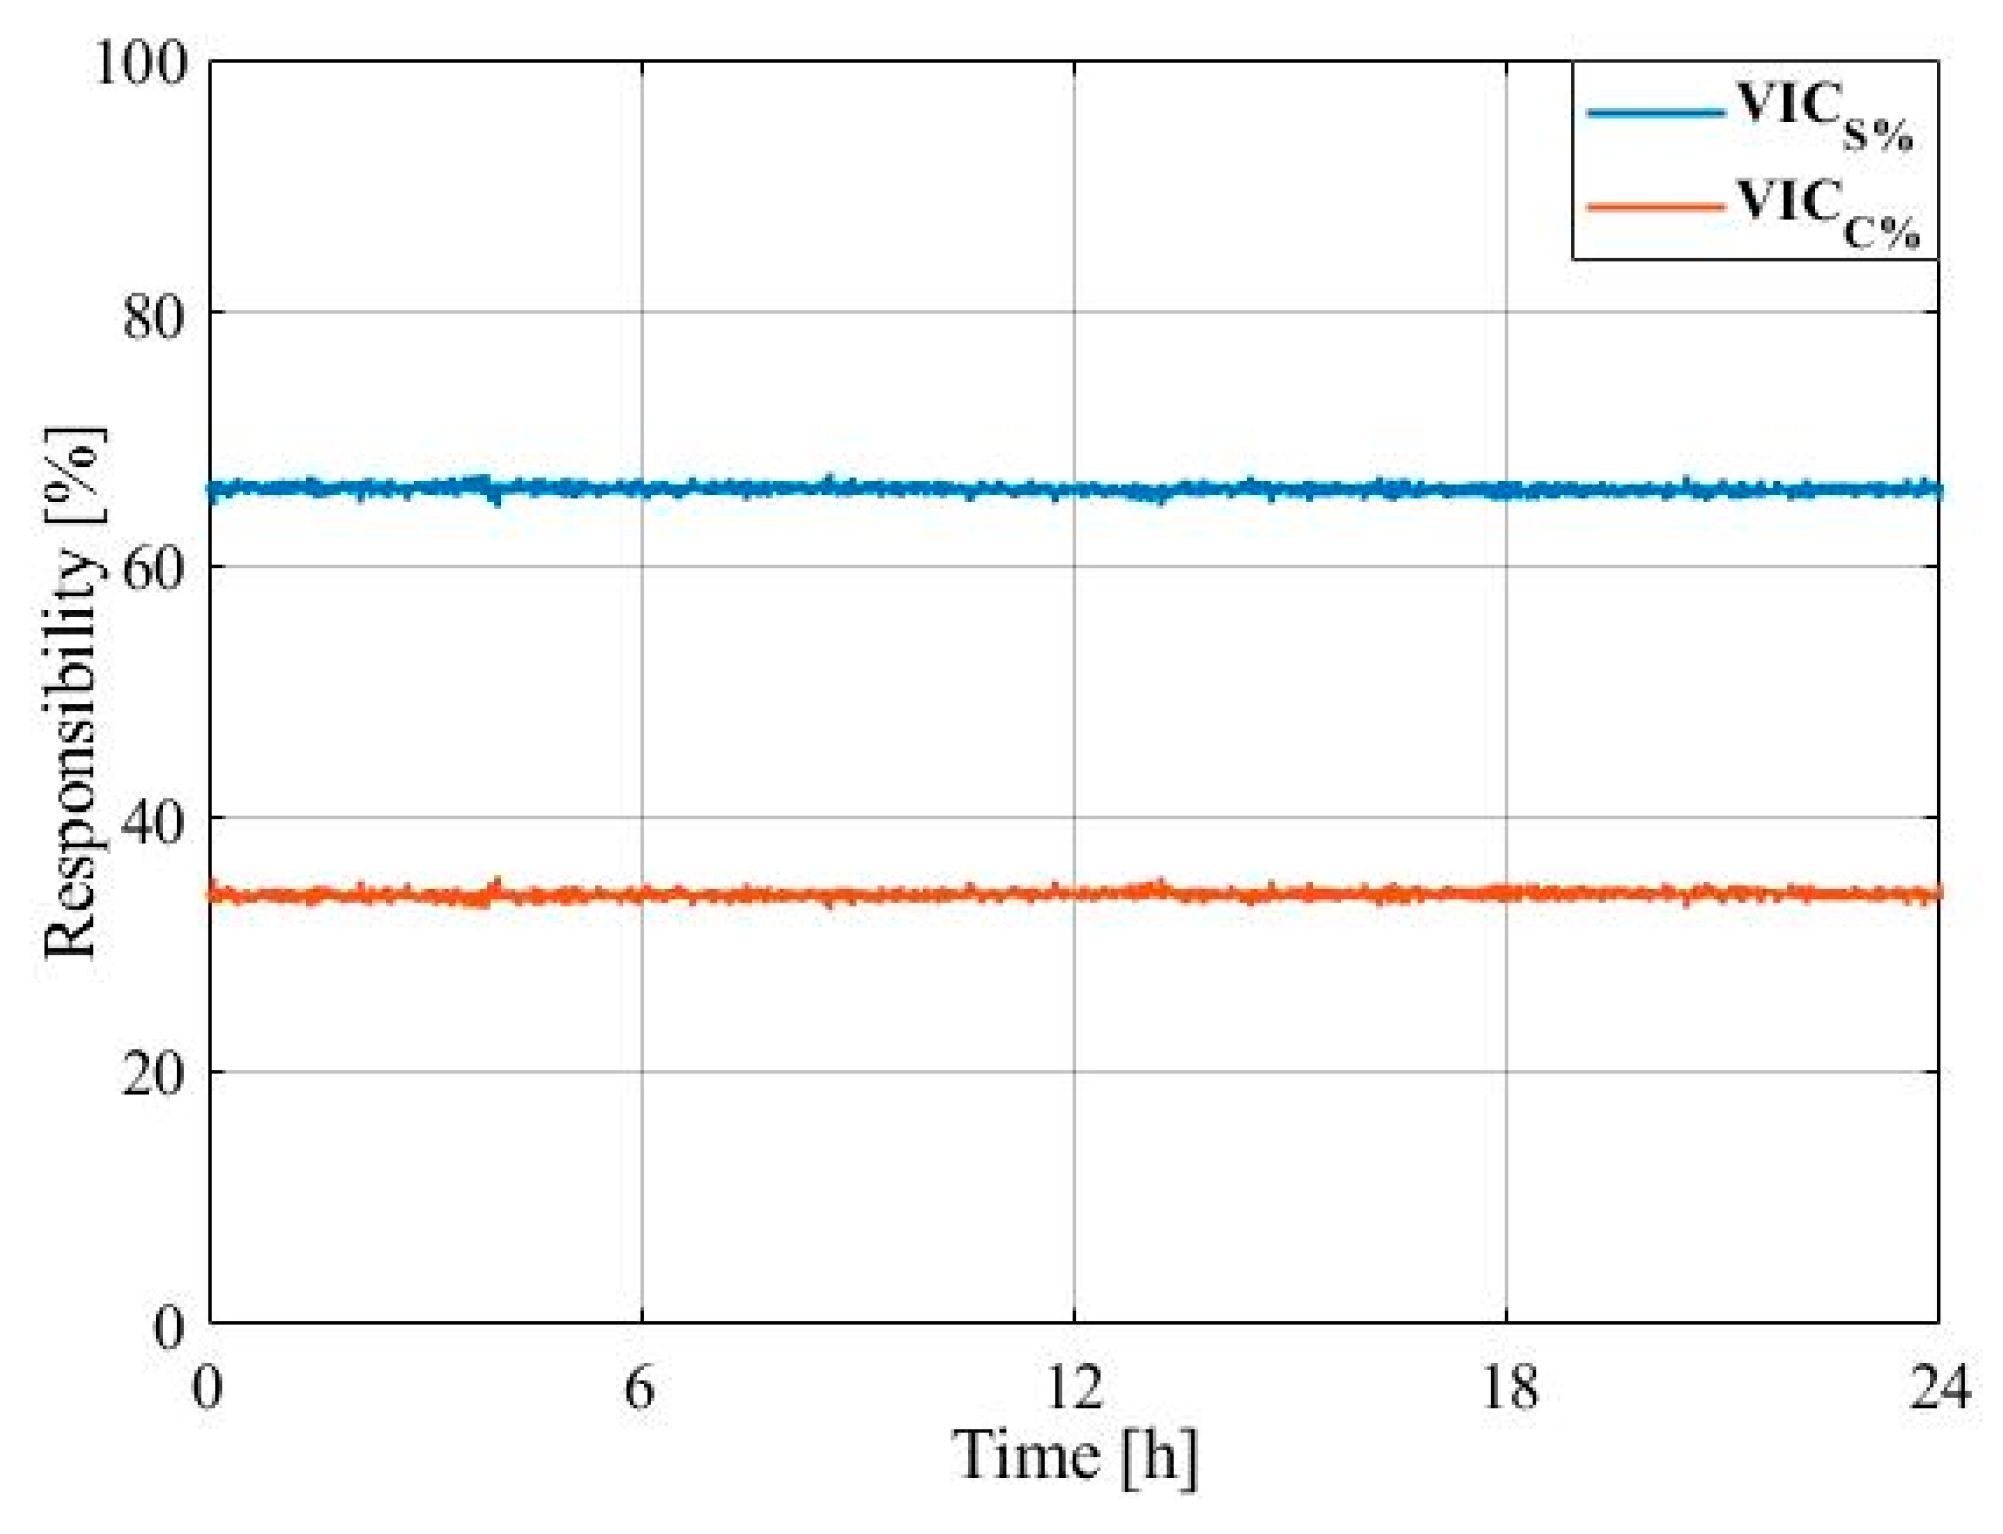
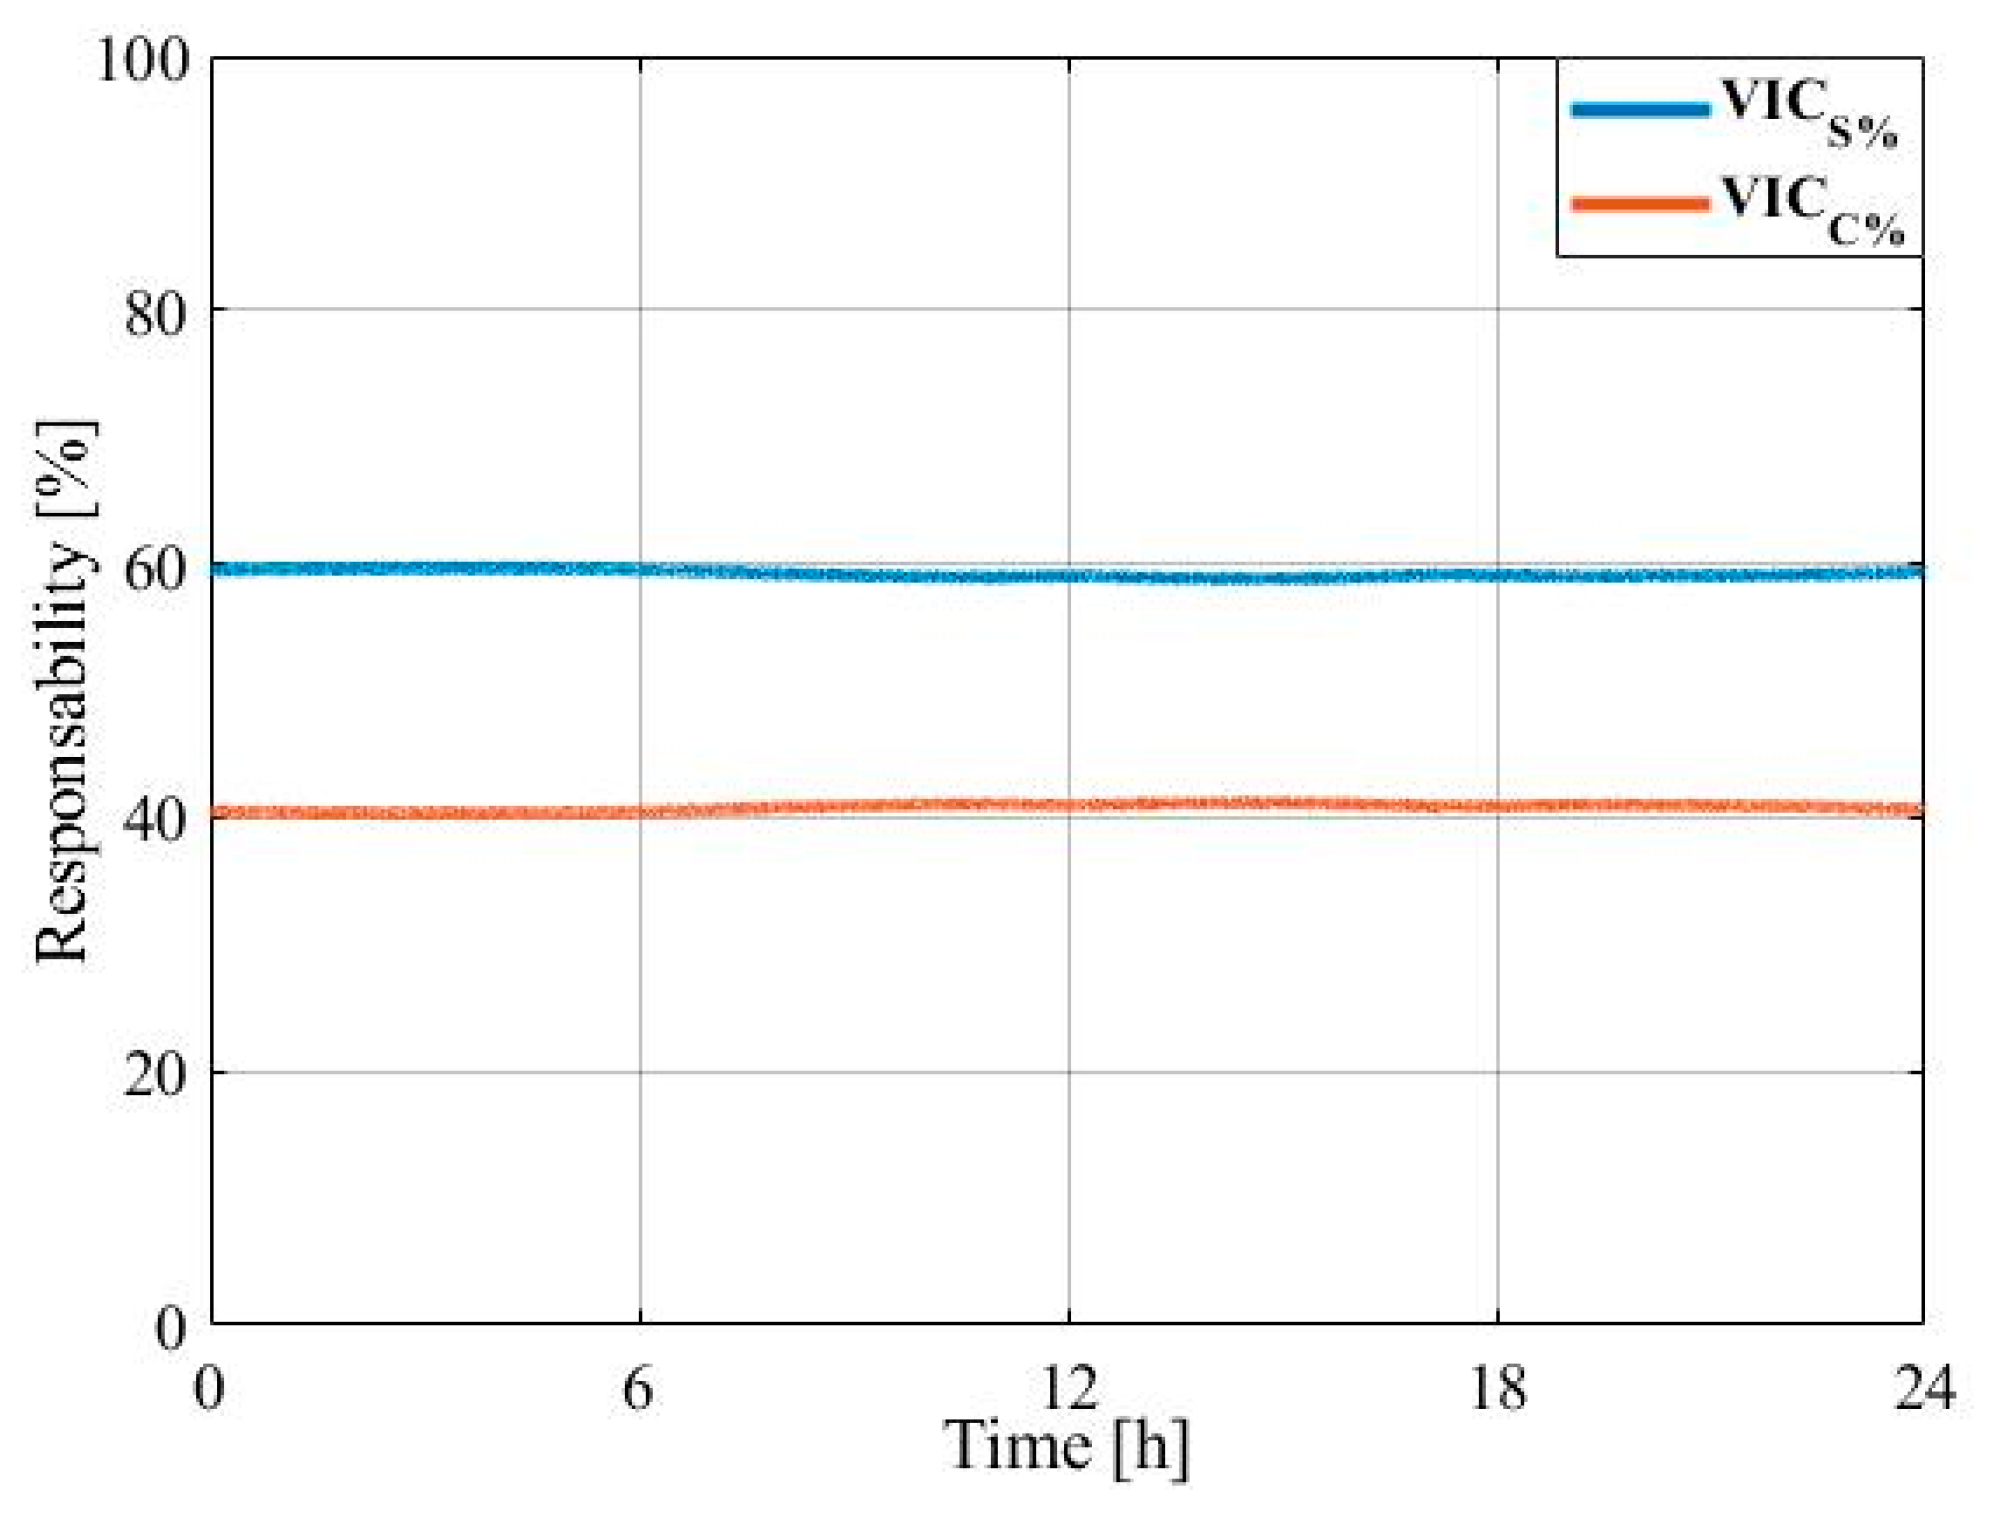
Applying the prosed methodology, Figure 8, Figure 9, Figure 10 and Figure 11 show the contributions of the supplier ( V I C S % ) and the consumer ( V I C C % ) to the PCC total voltage imbalance.
As Case 1 is related to the condition where both of the agents are presented as sources of voltage imbalances, the CICA technique indicates that the consumer is responsible for a V I C % between 35.5% and 32.9% over the sampling period. The average value corresponds to 34.0%. The supplier’s contribution is between 67.1% and 64.1%. The average value is 66.0%. Thus, the supplier is the dominant source of imbalance in this case. As indicated in Figure 7, under the condition that only the consumer is responsible for the imbalance at the PCC, the average VUF% is 1.3% (Case 2). When only the supplier is the source of the imbalance, the average VUF% is 2.3% (Case 3). Therefore, the results presented by the CICA method are consistent with what was expected.
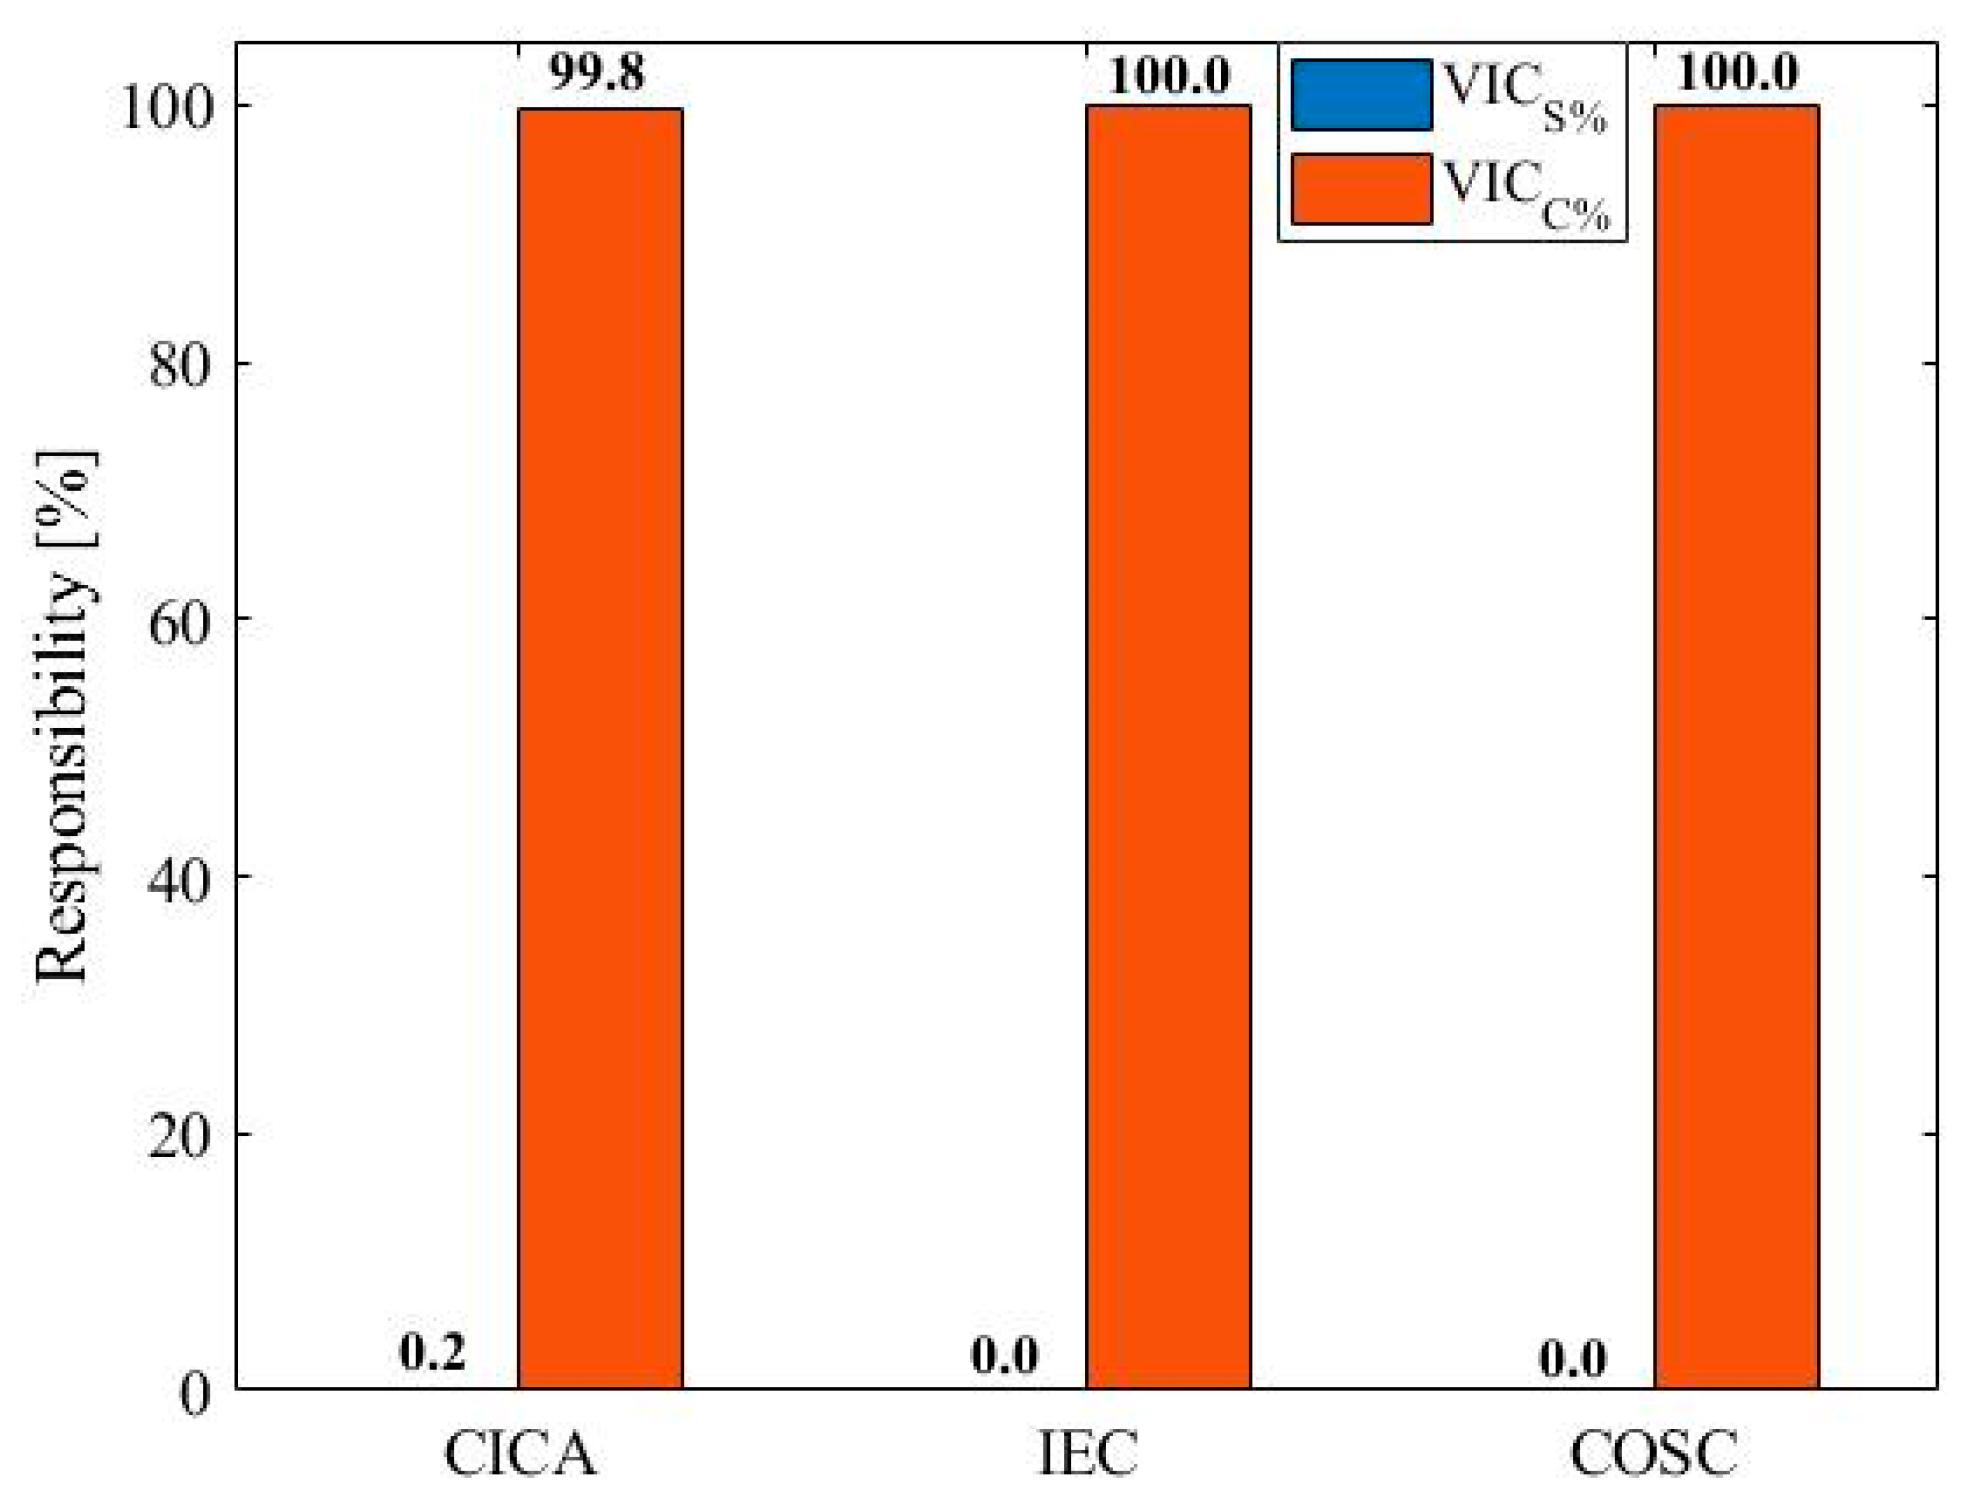
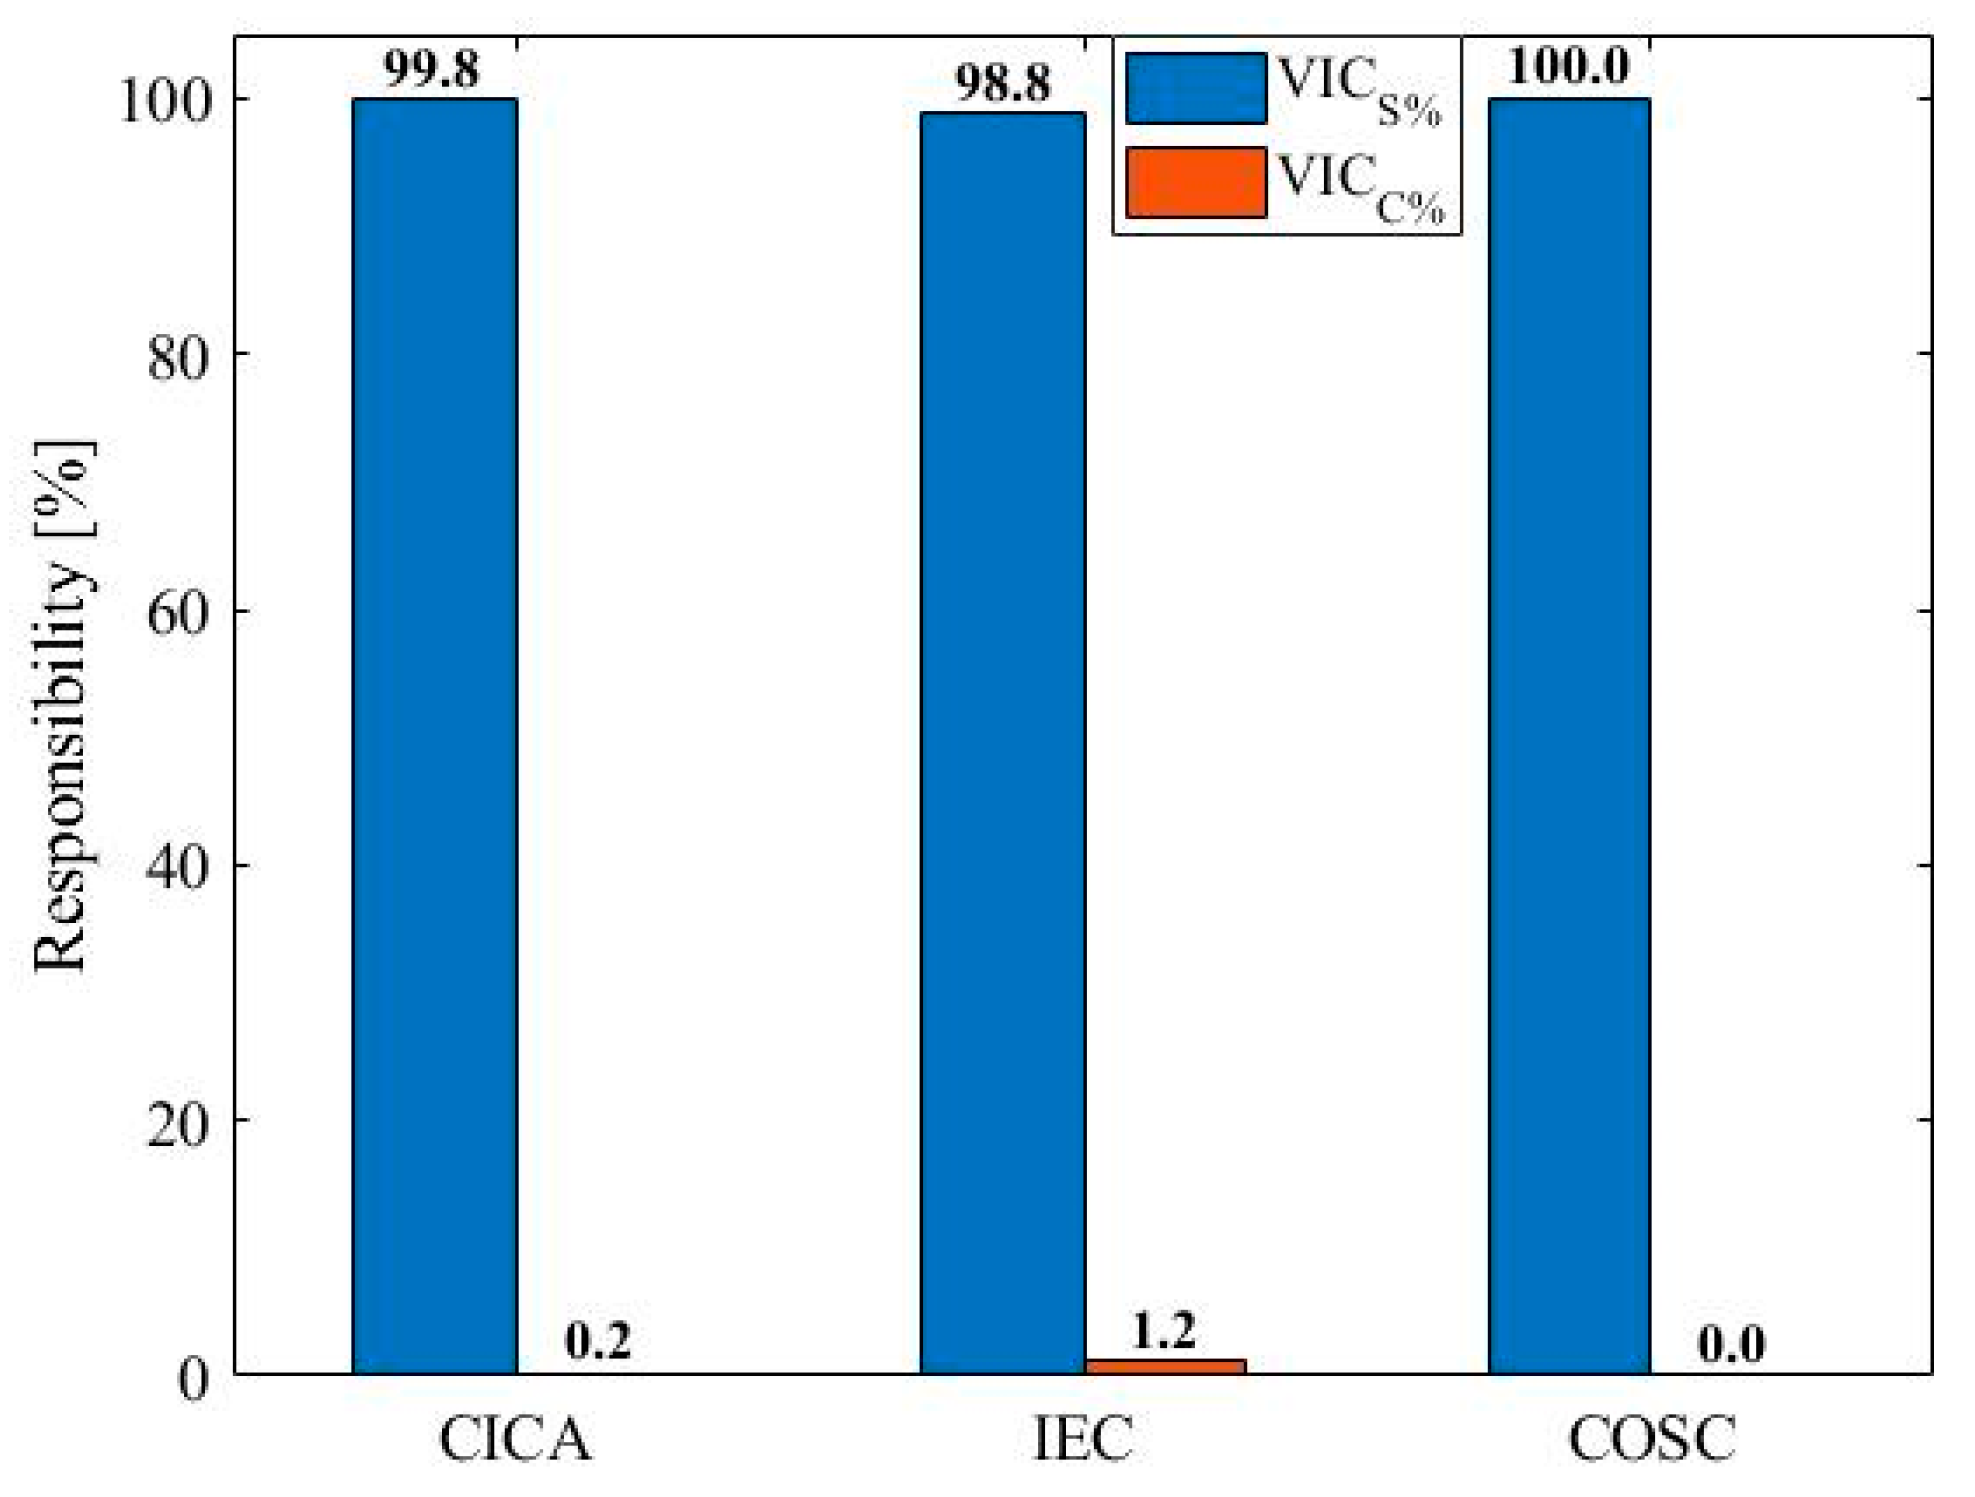
Upon analyzing the levels of imbalance for Cases 2 and 3, where only one of the agents is responsible for the imbalance at the PCC, one notes a complete consistency with the results expected.
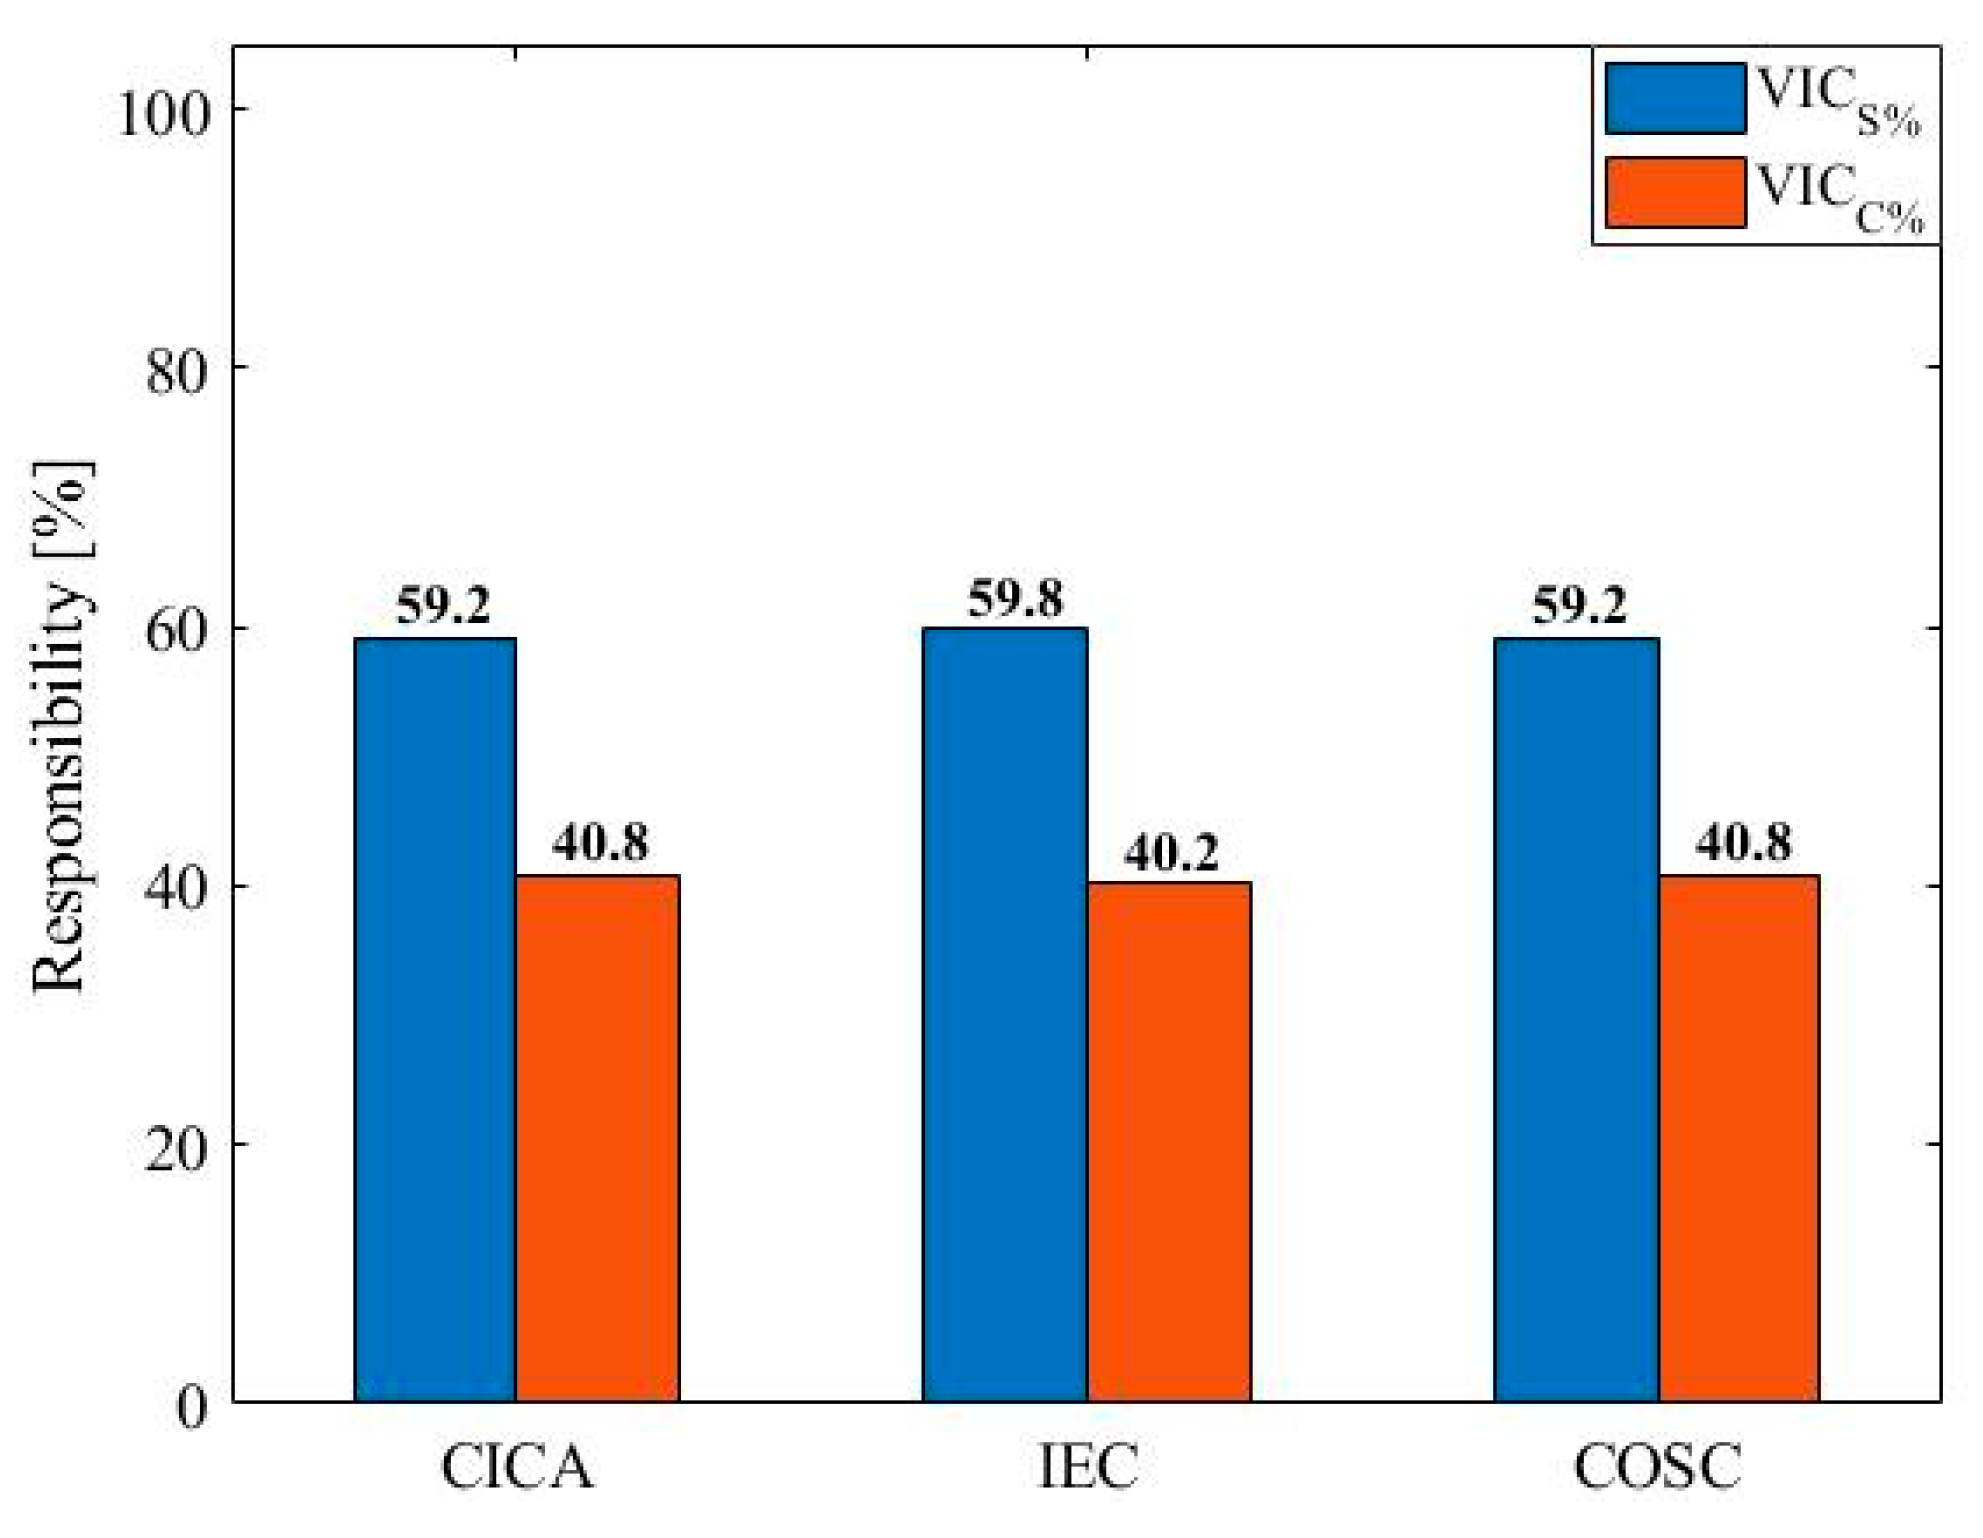
As for Case 4, the consumer contribution is between 41.1% and 40.4%, with an average value of 40.8%. The supplier responsibility is between 59.6% to 58.8%, with an average value of 59.2%. The VUF% profile for this case had a more oscillatory behavior due to the consumption curve imposed by the consumer, as shown in Figure 7. The VUF% at the PCC in Cases 1 and 4 remained close, with Case 4 slightly higher. As the supplier maintained the operational condition for Cases 1 and 4, the consumer’s contribution is expected to be somewhat higher for Case 4 compared to Case 1. Therefore, as expected, the average contribution result for Cases 1 and 4 are similar, with a difference of 6.8%, and the consumer contribution is higher for Case 4.
Notwithstanding the apparent adherence of the results to physical expectations, a comparative evaluation of the performances obtained is then carried out by comparing the results obtained with reference values provided by traditionally recognized and reliable methods (IEC and COSC) [24,44], as follows.

5. Comparative Evaluation of the CICA, IEC, and COSC Methods

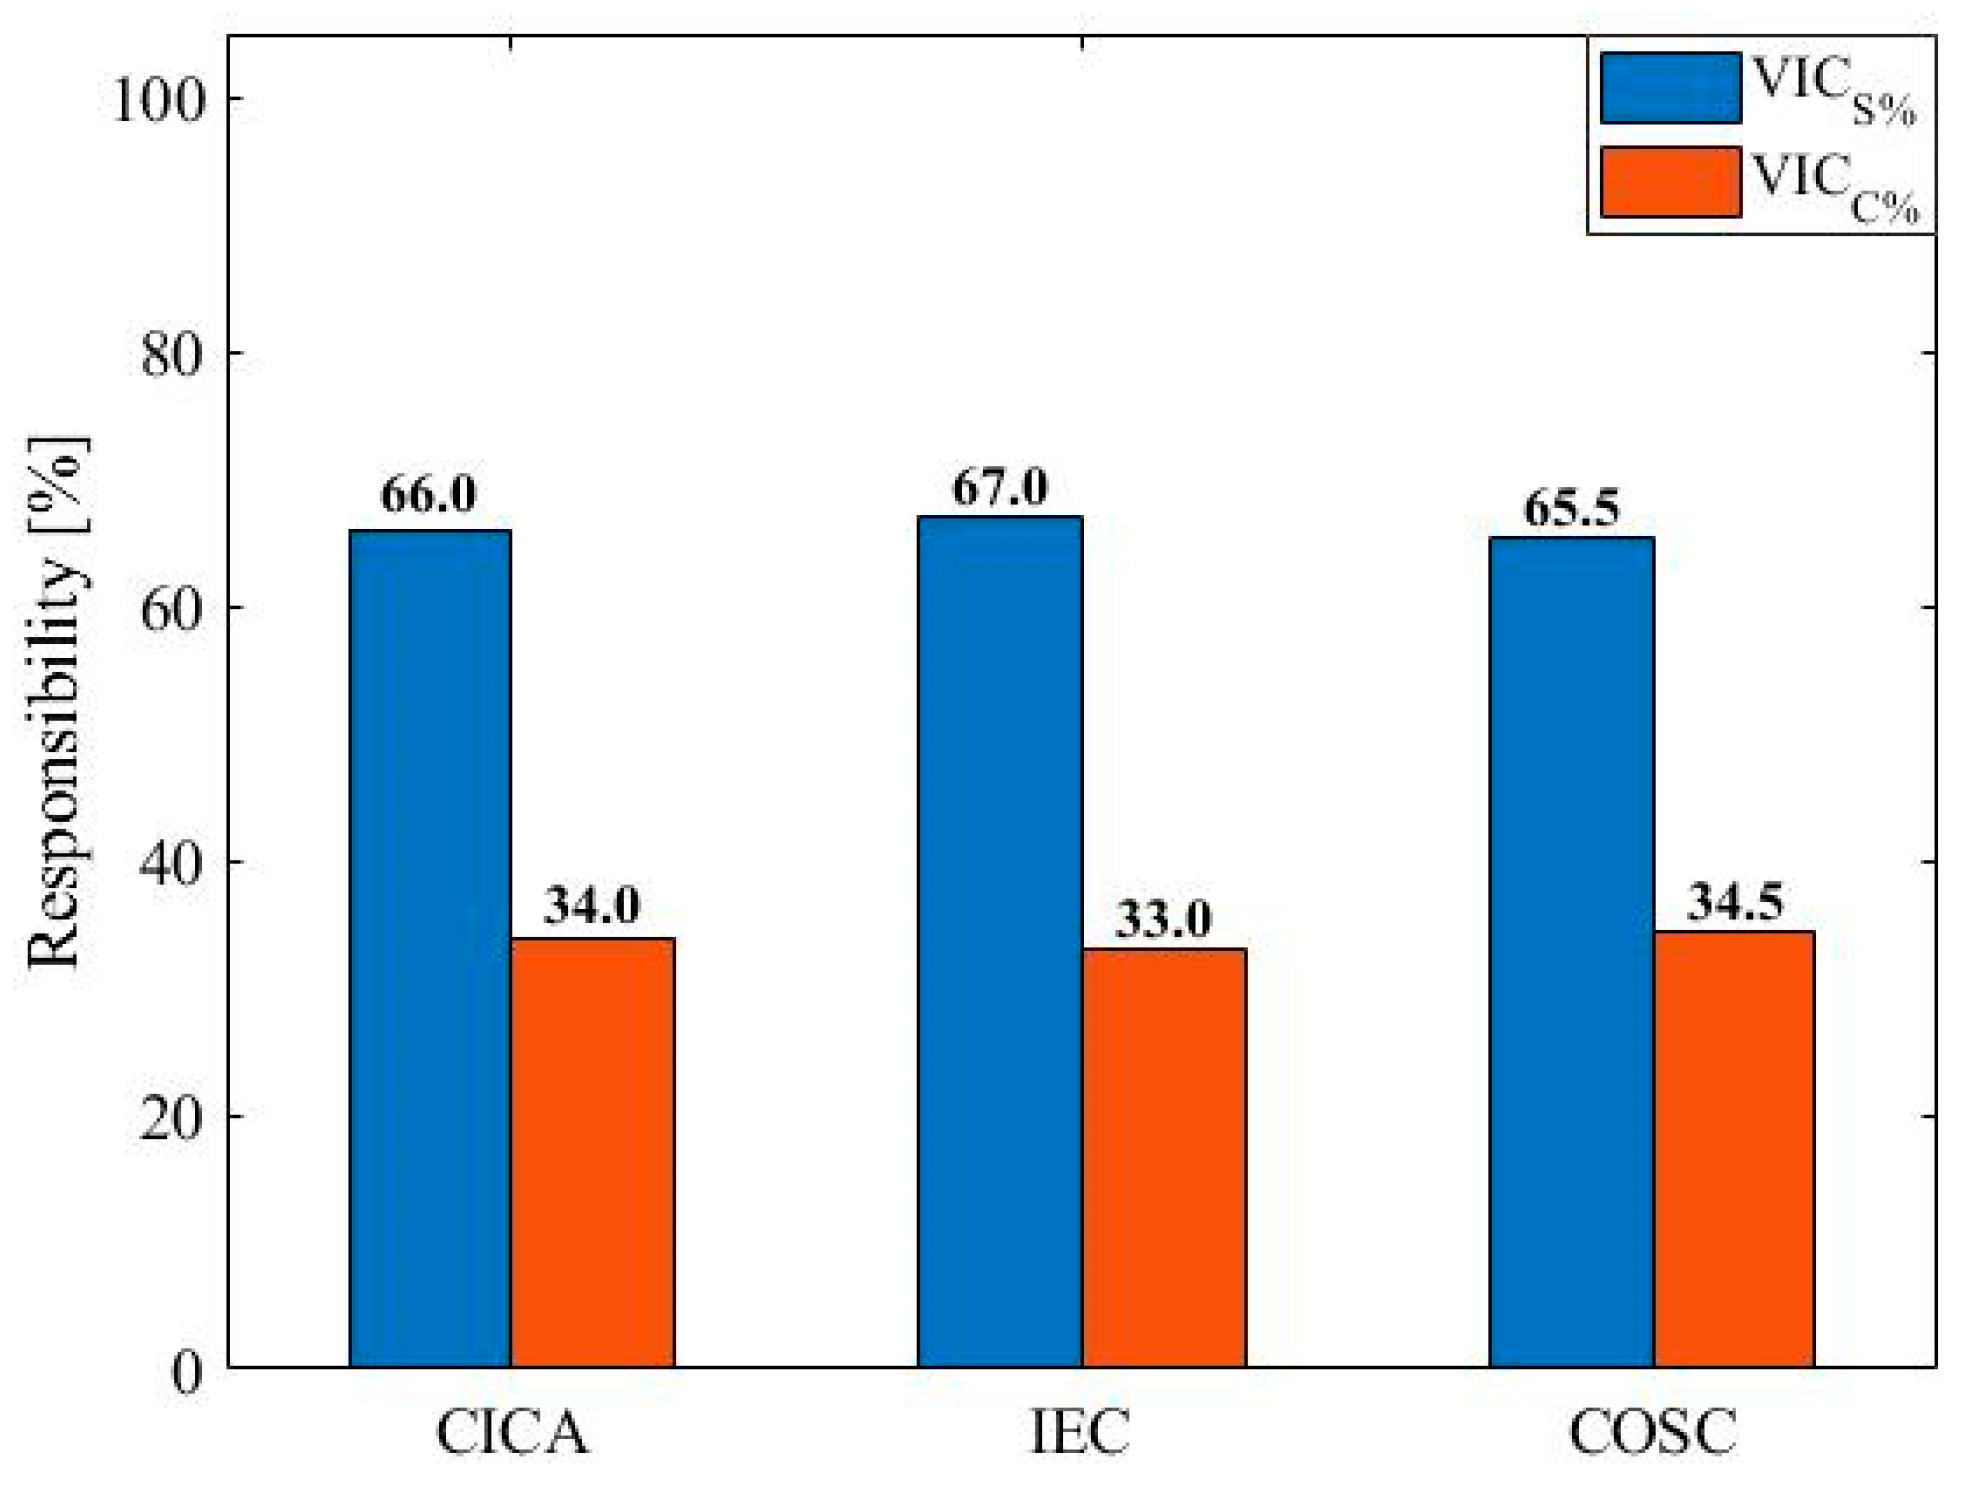
The equations for applying the IEC and COSC methods are elucidated in references [18,36], respectively. Thus proceeding, Figure 12, Figure 13, Figure 14 and Figure 15 indicate the results and allow a correlation between the values obtained by the procedures and the CICA method.
The numeric magnitudes represent the average values obtained over the sampling period and do not express instantaneous quantities. The voltage imbalance contributions’ profiles over the sampling analysis were not presented; however, their behaviors are similar.
In general, the results show slight differences between the three methodologies. The discrepancies were no greater than 0.2%. Faced with this, it becomes evident that the proposed analysis process shows a substantial adherence and accuracy to the results presented regarding the physical expectations and other methodological strategies. In addition, it should be emphasized that the CICA approach is a noninvasive technique for the operational conditions of electric systems.

6. Conclusions

This paper presented the theoretical basis for the methodology for sharing voltage imbalance responsibility between two agents, using the Complex Independent Component Analysis (CICA), to get around the difficulties inherent in using the classical Superposition theorem. This principle, accepted for various applications in electrical engineering, has a solid theoretical basis for this work. However, the lack of knowledge of negative sequence parameters implies limitations to its practical use. In this sense, the CICA technique presents itself as a solution for determining the information required for the process of sharing responsibilities.
The approach effectiveness was carried out using a hypothetical electrical arrangement with topological features and parameters representative of a connection between a utility and a consumer. By employing load profiles for both of the agents, the negative sequence voltages and currents were established at the PCC, thus permitting the performance evaluation of the method proposed herein.
The investigations were conducted using four operational conditions for the adopted electrical system. The results show that the values for contribution over the voltage imbalance profile align with the physical expectations of the four cases studied. A comparative performance evaluation was completed by correlating the proposed method’s results with other analysis processes that are considered as references (IEC and COSC methods) to substantiate these assessments. The results exhibited in this study prove that the contribution over the sampling period demonstrated a good adherence between the three methods analyzed in this paper.
Notwithstanding the effectiveness of the CICA technique, it is worth remembering that the principles that govern the proposed method do not imply any alteration in the topology or operational procedure of the agents, a reason by which this technique presents itself as a noninvasive solution. Furthermore, it is worth noting that the quantities required to apply the CICA method align with those made available by traditional measurement campaigns without any additional requirement on the existing resources. This aspect is desirable to the objectives established herein, as the consolidation of the proposed method of analysis naturally requires validation steps in the field, which are shown as future goals for the continuity of this research.

Author Contributions

Conceptualization, M.A.M. and J.C.d.O.; methodology, M.A.M. and V.H.F.B.; software, M.A.M.; validation, J.C.d.O.; formal analysis, M.A.M.; investigation, M.A.M. and J.C.d.O.; data curation, M.A.M.; writing—original draft preparation, M.A.M.; writing—review and editing, M.A.M., V.H.F.B., and J.C.d.O.; visualization, M.A.M.; supervision, J.C.d.O.; project administration, J.C.d.O.; funding acquisition, J.C.d.O. All authors have read and agreed to the published version of the manuscript.

Funding

This work was supported in part by the Coordenação de Aperfeiçoamento de Pessoal de Nível Superior–Brasil (CAPES)—Finance Code 001 and Fundação de Amparo à Pesquisa de Minas Gerais (FAPEMIG). The authors would like to thank the Graduate Program in Electrical Engineering of Faculty of Electrical Engineering, Federal University of Uberlândia (UFU) for their collaboration and support.

Data Availability Statement

Not applicable.

Conflicts of Interest

The authors declare no conflict of interest.

References

  1. Sun, Y.; Li, P.; Li, S.; Zhang, L. Contribution Determination for Multiple Unbalanced Sources at the Point of Common Coupling. Energies 2017, 10, 171. [Google Scholar] [CrossRef]
  2. Li, Y.; Crossley, P.A. Voltage Balancing in Low-Voltage Radial Feeders Using Scott Transformers. IET Gener. Transm. Distrib. 2014, 8, 1489–1498. [Google Scholar] [CrossRef]
  3. Ciontea, C.I.; Iov, F. A Study of Load Imbalance Influence on Power Quality Assessment for Distribution Networks. Electricity 2021, 2, 5. [Google Scholar] [CrossRef]
  4. Sayenko, Y.; Kalyuzhniy, D.; Bolgov, V.; Baranenko, T. Evaluating Responsibility for Voltage Unbalance Emission in Three-Phase Three-Wire Networks. In Proceedings of the International Conference on Electrical Power Quality and Utilisation (EPQU), Krakow, Poland, 14–15 September 2020. [Google Scholar] [CrossRef]
  5. Dadashzade, A.; Aminifar, F.; Davarpanah, M. Unbalanced Source Detection in Power Distribution Networks by Negative Sequence Apparent Powers. IEEE Trans. Power Deliv. 2021, 36, 481–483. [Google Scholar] [CrossRef]
  6. El-Kharashi, E.; Massoud, J.G.; Al-Ahmar, M.A. The Impact of the Unbalance in Both the Voltage and the Frequency on the Performance of Single and Cascaded Induction Motors. Energy 2019, 181, 561–575. [Google Scholar] [CrossRef]
  7. Liao, R.-N.; Yang, N.-C. Evaluation of Voltage Imbalance on Low-Voltage Distribution Networks Considering Delta-Connected Distribution Transformers with a Symmetrical NGS. IET Gener. Transm. Distrib. 2018, 12, 1644–1654. [Google Scholar] [CrossRef]
  8. Nascimento, C.F.; Watanabe, E.H.; Diene, O.; Dietrich, A.B.; Goedtel, A.; Gyselinck, J.J.C.; Dias, R.F.S. Analysis of Noncharacteristic Harmonics Generated by Voltage-Source Converters Operating under Unbalanced Voltage. IEEE Trans. Power Deliv. 2017, 32, 951–961. [Google Scholar] [CrossRef]
  9. de Paula Silva, S.F.; de Oliveira, J.C. The Sharing of Responsibility between the Supplier and the Consumer for Harmonic Voltage Distortion: A Case Study. Electr. Power Syst. Res. 2008, 78, 1959–1964. [Google Scholar] [CrossRef]
  10. Jia, Y.; Liu, Y.; Wang, B.; Lu, D.; Lin, Y. Power Network Fault Location with Exact Distributed Parameter Line Model and Sparse Estimation. Electr. Power Syst. Res. 2022, 108137. [Google Scholar] [CrossRef]
  11. Nagata, E.A.; Ferreira, D.D.; Duque, C.A.; Cequeira, A.S. Voltage Sag and Swell Detection and Segmentation Based on Independent Component Analysis. Electr. Power Syst. Res. 2018, 155, 274–280. [Google Scholar] [CrossRef]
  12. Stefanidou-Voziki, P.; Sapountzoglou, N.; Raison, B.; Dominguez-Garcia, J.L. A Review of Fault Location and Classification Methods in Distribution Grids. Electr. Power Syst. Res. 2022, 209, 108031. [Google Scholar] [CrossRef]
  13. Sun, Y.; Li, P.; Wang, Y.; Yin, Z. Determination of the Main Unbalance Sources on PCC in the Distribution System. In Proceedings of the 2015 IEEE Power & Energy Society General Meeting, Denver, CO, USA, 5 October 2015; pp. 1–4. [Google Scholar]
  14. Arão, L.F.L.; Filho, A.L.F.; Mendonça, M.V.B.; Ferreira Filho, A.L.; Mendonça, M.V.B. Comparative Evaluation of Methods for Attributing Responsibilities Due to Voltage Unbalance. IEEE Trans. Power Deliv. 2016, 31, 743–752. [Google Scholar] [CrossRef]
  15. Srinivasan, K.; Jutras, R. Conforming and Non-Conforming Current for Attributing Steady State Power Quality Problems. IEEE Trans. Power Deliv. 1998, 13, 212–217. [Google Scholar] [CrossRef]
  16. Seiphetlho, T.E.; Rens, A.P.J. On the Assessment of Voltage Unbalance. In Proceedings of the ICHQP 14th International Conference on Harmonics and Quality of Power, Bergamo, Italy, 26–29 September 2010; pp. 1–5. [Google Scholar] [CrossRef]
  17. Neto, A.F.T.; Cunha, G.P.L.; Mendonça, M.V.B.; Filho, A.L.F. A Comparative Evaluation of Methods for Analysis of Propagation of Unbalance in Electric Systems. In Proceedings of the 2012 6th IEEE/PES Transmission and Distribution: Latin America Conference and Exposition, T and D-LA 2012, Montevideo, Uruguay, 3–5 September 2012; pp. 1–8. [Google Scholar] [CrossRef]
  18. IEC TR 61000-3-13; Electromagnetic Compatibility (EMC)—Part 3.13: Limits—Assessment of Emission Limits for the Connection of Unbalanced Installations to MV, HV and EHV Power Systems. International Electrotechnical Commission: Geneva, Switzerland, 2008.
  19. Abasi, M.; Ghodratollah Seifossadat, S.; Razaz, M.; Sajad Moosapour, S. Determining the Contribution of Different Effective Factors to Individual Voltage Unbalance Emission in N-Bus Radial Power Systems. Int. J. Electr. Power Energy Syst. 2018, 94, 393–404. [Google Scholar] [CrossRef]
  20. Jayatunga, U.; Perera, S.; Ciufo, P. Voltage Unbalance Emission Assessment in Radial Power Systems. IEEE Trans. Power Deliv. 2012, 27, 1653–1661. [Google Scholar] [CrossRef]
  21. Jayatunga, U.; Perera, S.; Ciufo, P.; Agalgaonkar, A.P. Voltage Unbalance Emission Assessment in Interconnected Power Systems. IEEE Trans. Power Deliv. 2013, 28, 2383–2393. [Google Scholar] [CrossRef]
  22. Sun, Y.; Xie, X.; Li, P. Unbalanced Source Identification at the Point of Evaluation in the Distribution Power Systems. Int. Trans. Electr. Energy Syst. 2018, 28, e2460. [Google Scholar] [CrossRef]
  23. Jayatunga, U.; Perera, S.; Ciufo, P.; Agalgaonkar, A.P. Deterministic Methodologies for the Quantification of Voltage Unbalance Propagation in Radial and Interconnected Networks. IET Gener. Transm. Distrib. 2015, 9, 1069–1076. [Google Scholar] [CrossRef]
  24. Gregory, R.C.F. Proposals for Methodologies for Determining Voltage Imbalance Contributions in Three-Phase Electric Systems. Ph.D. Thesis, Federal University of Uberlandia UFU, Uberlândia, Brazil, 2020. [Google Scholar]
  25. Xu, W.; Liu, Y. A Method for Determining Customer and Utility Harmonic Contributions at the Point of Common Coupling. IEEE Trans. Power Deliv. 2000, 15, 804–811. [Google Scholar] [CrossRef]
  26. Pereira, F.A.; Silva, S.F.d.P.; Santos, I.N. Blind Source Separation Methods Applied to Evaluate Harmonic Contribution. Int. Trans. Electr. Energy Syst. 2021, 31, e13149. [Google Scholar] [CrossRef]
  27. Zhao, J.; Yang, H.; Pan, A.; Xu, F. An Improved Complex ICA Based Method for Wind Farm Harmonic Emission Levels Evaluation. Electr. Power Syst. Res. 2020, 179, 106105. [Google Scholar] [CrossRef]
  28. Xiao, X.; Zheng, X.; Wang, Y.; Xu, S.; Zheng, Z. A Method for Utility Harmonic Impedance Estimation Based on Constrained Complex Independent Component Analysis. Energies 2018, 11, 2247. [Google Scholar] [CrossRef]
  29. Karimzadeh, F.; Esmaeili, S.; Hosseinian, S.H. Method for Determining Utility and Consumer Harmonic Contributions Based on Complex Independent Component Analysis. IET Gener. Transm. Distrib. 2016, 10, 526–534. [Google Scholar] [CrossRef]
  30. Karimzadeh, F.; Esmaeili, S.; Hosseinian, S.H. A Novel Method for Noninvasive Estimation of Utility Harmonic Impedance Based on Complex Independent Component Analysis. IEEE Trans. Power Deliv. 2015, 30, 1843–1852. [Google Scholar] [CrossRef]
  31. Chen, F.; Mao, N.; Wang, Y.; Wang, Y.; Xiao, X. Improved Utility Harmonic Impedance Measurement Based on Robust Independent Component Analysis and Bootstrap Check. IET Gener. Transm. Distrib. 2019, 14, 910–919. [Google Scholar] [CrossRef]
  32. Yang, Y.; Wang, Y.; Ma, X. Determining the Responsibility of Three-Phase Unbalanced Sources Based on RICA. Energies 2019, 12, 2849. [Google Scholar] [CrossRef]
  33. Wang, Y.; Yang, Y.; Ma, X.; Yao, W.; Wang, H.; Tang, Z. Unbalanced Responsibility Division Considering Renewable Energy Integration. IET Gener. Transm. Distrib. 2020, 14, 5816–5822. [Google Scholar] [CrossRef]
  34. Novey, M.; Adali, T. Adaptable Nonlinearity for Complex Maximization of Nongaussianity and a Fixed-Point Algorithm. In Proceedings of the 2006 16th IEEE Signal Processing Society Workshop on Machine Learning for Signal Processing IEEE, Maynooth, Ireland, 6–8 September 2006; pp. 79–84. [Google Scholar]
  35. Gregory, R.C.F.; Scotti, T.M.; Oliveira, J.C. Performance Evaluation of Unbalance Sharing Responsibility Procedures. In Proceedings of the 7th Brazilian Electrical Systems Symposium (SBSE 2018), Rio de Janeiro, Brazil, 12–18 May 2018. [Google Scholar] [CrossRef]
  36. Gregory, R.C.F.; dos Santos, A.C.; Santos, I.N.; Ran, L.; de Oliveira, J.C. A Practical Approach for Determining Voltage Imbalance Contributions from Suppliers and Consumers. Int. Trans. Electr. Energy Syst. 2020, 30, e12627. [Google Scholar] [CrossRef]
  37. Kutz, J.N. Data-Driven Modeling and Scientific Computation, 1st ed.; Oxford University Press: New York, NY, USA, 2013. [Google Scholar]
  38. Niebur, D.; Gursoy, E.; Liao, H. Independent Component Analysis Techniques for Power System Load Estimation. In Applied Mathematics for Restructured Electric Power Systems; Chow, J.H., Wu, F.F., Momoh, J.A., Eds.; Springer: Boston, MA, USA, 2005; pp. 287–317. [Google Scholar]
  39. Hyvärinen, A.; Karhune, J.; Oja, E. Independent Component Analysis, 1st ed.; John Wiley and Sons Ltd.: New York, NY, USA, 2001. [Google Scholar]
  40. Hyvärinen, A.; Oja, E. A Fast Fixed-Point Algorithm for Independent Component Analysis. Neural Comput. 1997, 9, 1483–1492. [Google Scholar] [CrossRef]
  41. Hirst, E.; Kirby, B. Defining Intra and Interhour Load Swings. IEEE Trans. Power Syst. 1998, 13, 1379–1385. [Google Scholar] [CrossRef] [Green Version]
  42. ONS Hourly Consumption Profile. Available online: http://www.ons.org.br/paginas/resultados-da-operacao/historico-da-operacao/curva_carga_horaria.aspx (accessed on 21 November 2021).
  43. IEEE Std 1159TM; Recommended Practice for Monitoring Electric Power Quality. Institute of Electrical and Electronics Engineers: New York, NY, USA, 2009.
  44. Moraes, M.A.; Gregory, R.C.F.; Gianesini, B.M.; Santos, I.N.; de Oliveira, J.C. Comparative Analysis of Methods for Sharing the Responsibility of Voltage Imbalances in Electrical Systems. In Proceedings of the XIV Brazilian Conference on Power Quality, Foz do Iguaçu, Brazil, 29 August–1 September 2021. [Google Scholar]
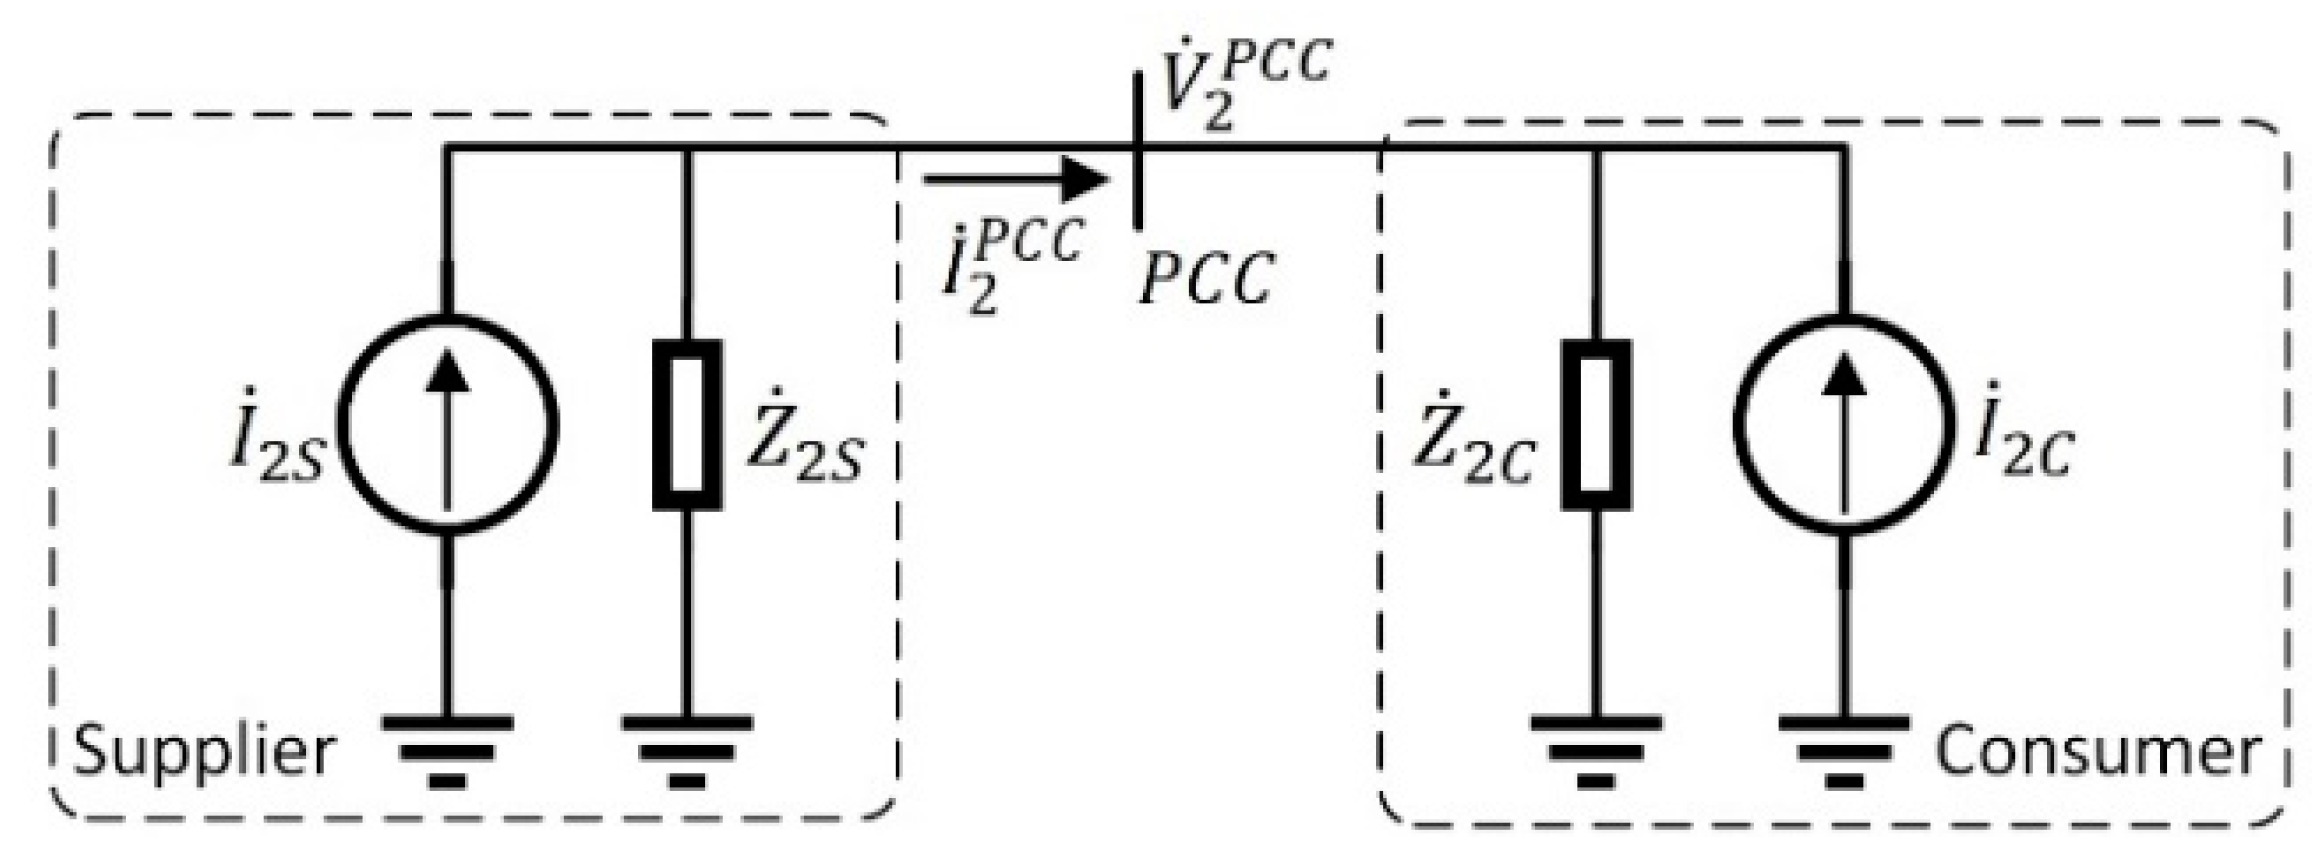
Figure 1. Norton equivalent circuit of negative sequence.
Energies 15 07014 g001
Figure 2. Norton equivalent circuit: (a) contribution originating from the supplier; (b) contribution from the consumer.
Energies 15 07014 g002
Figure 3. Voltage imbalance contributions from supplier and consumer at the PCC.
Energies 15 07014 g003
Figure 4. Flowchart of the CICA method for determining voltage imbalance contributions.
Energies 15 07014 g004
Figure 5. Electrical system used for the studies.
Energies 15 07014 g005
Figure 6. Consumption profile for the case studies—utility (in blue) and consumer (in orange).
Energies 15 07014 g006
Figure 7. Voltage unbalanced factor at the PCC for simulated cases.
Energies 15 07014 g007
Figure 8. Supplier and consumer voltage imbalance contribution—Case 1.
Energies 15 07014 g008
Figure 9. Supplier and consumer voltage imbalance contribution—Case 2.
Energies 15 07014 g009
Figure 10. Supplier and consumer voltage imbalance contribution—Case 3.
Energies 15 07014 g010
Figure 11. Supplier and consumer voltage imbalance contribution—Case 4.
Energies 15 07014 g011
Figure 12. Comparison of the consumer and supplier responsibility for the imbalance at the PCC—CICA, IEC, and COSC methods—Case 1.
Energies 15 07014 g012
Figure 13. Comparison of the consumer and supplier responsibility for the imbalance at the PCC—CICA, IEC, and COSC methods—Case 2.
Energies 15 07014 g013
Figure 14. Comparison of the consumer and supplier responsibility for the imbalance at the PCC—CICA, IEC, and COSC methods—Case 3.
Energies 15 07014 g014
Figure 15. Comparison of the consumer and supplier responsibility for the imbalance at the PCC—CICA, IEC, and COSC methods—Case 4.
Energies 15 07014 g015
Table 1. Synthesis of the classical methods for determining voltage imbalance contributions.
MethodPhysical FundamentsAnalysis
Conforming and Non-Conforming CurrentThe approach shares the negative sequence currents measured in the PCC in components assigned to agents using impedances estimated by the positive sequence.Since the method considers that the positive and negative sequence impedances are equal, this yields significant inconsistencies.
Three-Phase Power FlowThe procedure is based on positive and negative sequence three-phase power measurements.The method does not allow sharing responsibility for imbalances but only identifies the predominant source.
IEC (IEC/TR 61000-3-13)The proposal includes two measurement steps. A first one with the consumer agent disconnected and a second one with its insertion.In its physical essence, the method is consistent; however, its practical implementation is unfeasible for most installations in operation.
Controlled Operational State ChangeThe proposition is based on equations of electrical quantities under different and controlled conditions of operation of the electrical network by the successive connection and disconnection of an electrical component with pre-known unbalanced characteristics.Despite recognizing the satisfactory performance of the method, its application presents as invasive to the operational conditions of the electrical network. This factor presents itself as a restrictive possibility for many installations.
Table 2. System’s Parameters.
ComponentParameters
Supply system V 3 ϕ = 138   kV ;   f = 60   Hz ;   S SC = 800   MVA ;   X R = 20
Distribution lines L01 and L02 Z Cable = 0.045 + j 0.32   [ Ω km ] ; distance L01 = 0.3 km; distance L01 = 0.2 km
Transformer TR01S = 50 MVA; Vpri. = 138 kV/s = 13.8 kV; Z% = 6%
Transformer TR02 S = 10 MVA; Vpri. = 13.8 kV/s = 4.16 kV; Z% = 7%
Transformer TR03S = 500 kVA; Vpri. = 13.8 kV/s = 0.38 kV; Z% = 6%
Load 01 If   balanced :   SA = SB = SC = k ( 4.7 + j 1.7 ) MVA ;   S 3 ϕ =   k ( 15 20 ° ) MVA
If unbalanced: SA = k(7.7 + j1.9)MVA; SB = k(6.8 + j3.0)MVA;
SC = k ( 0.6 + j 0.2 ) MVA ;   S 3 ϕ =   k ( 15 20 ° ) MVA
Load 02 Balanced :   S 3 ϕ = k ( 0.5 + j 0.2 ) MVA   = k ( 0.53 22 ° ) MVA
Load 03 If   balanced :   SA = SB = SC = k ( 2.2 + j 0.8 ) MVA   S 3 ϕ =   k ( 7.0 19 ° ) MVA  
If unbalanced: SA = k(3.3 + j0.8)MVA; SB = k(3.7 + j0.6)MVA;
SC = k ( 0.3 + j 1.4 ) MVA ;   S 3 ϕ = k ( 7.8 21 ° ) MVA
Load 04 Balanced :   S 3 ϕ   = k ( 1.9 + j 0.7 ) MVA = k ( 2.0 20 ° ) MVA
Publisher’s Note: MDPI stays neutral with regard to jurisdictional claims in published maps and institutional affiliations.