Abstract
In this paper, the efficiency benefits of adopting Silicon–Carbide devices for electric vehicle applications are studied. A hybrid time and frequency domain-based simulation tool is developed for the Silicon–Carbide (SiC) traction inverter modeling. The tool provides steady-state results with comparable accuracy to standard time domain methods and achieves a factor of thousand reductions in time when simulating a large number of operating points. Especially, the impact of temperature-dependent device losses has been considered to ensure the simulation precision. Next, a vehicle-level modeling is developed to evaluate the impact of the inverter efficiency on the endurance mileage increase of vehicles. It is found that, by applying Silicon–Carbide devices, the energy consumption of the inverter can be greatly reduced by 3/4 under WLTC (World light light-duty vehicle test cycle) profile. It can be transformed into a mileage endurance increase of 3–5%. The impact of the drive cycle profile and the vehicle’s drag coefficient on the endurance mileage are evaluated as well. In addition, an economic/cost model is developed for selecting the “optimal” chip paralleling number for Silicon–Carbide power modules. Interestingly, the results indicate that this number should be slightly overdesigned to achieve the most cost saving from the system point of view.
1. Introduction
1.1. Background
SiC-based power modules for power conversion applications have been widely discussed in recent years. Due to the Wide-Bandgap material property, SiC devices have higher maximum operating junction temperature, lower losses, and lower thermal resistance compared to Si-based devices [1]. Hence, SiC-based inverters can withstand higher operating temperatures, obtain higher efficiency, and greatly increase power density [2]. All these features will benefit the system for various applications such as electric vehicle drives, solar inverter and so on [3,4].
Generally, a smaller number of parallel chips in a vehicle regulation level power module will lead to lower cost. However, fewer parallel chips also increase the loss and make the temperature conditions more severe. By that, it is attractive to reduce chip cost in SiC-based power modules because of the high temperature tolerance ability of SiC. However, for EV applications here, it is questionable if it is worth increasing the junction temperature while sacrificing the inverter efficiency, since the power losses of SiC increase significantly at higher temperature [3,5]. In the authors’ point of view, the efficiency increase can help reduce the system costs, which refers to not only the inverter and battery cost, but also and operating cost like charging [6]. Therefore, a precise and efficient modeling method is desired to quantify the benefits of efficiency. Moreover, design guidelines such as the optimal chip paralleling numbers, or determining the attractive application scenarios for SiCs, are to be explored.
1.2. State-of-the-Art Analysis
Numerous papers have discussed the SiC devices for inverter applications in the past [7,8]. However, only a few of them focused on the efficiency modeling of SiC inverters for EV applications, especially when the modeling is extended to the vehicle level like the endurance mileage and system cost [9,10,11,12,13,14,15,16].
Infineon evaluated in 2018 that, when replacing IGBTs with their 750 V and 1200 V SiC power modules in 400 V and 800 V DC bus applications, the endurance mileage in WLTP (World Light Vehicle Test Procedure) configuration can be increased by 6.3% and 7.6% respectively. However, the information about the inverter and vehicle-level modeling is limited, and the analysis conclusions do not have general guiding significance [9].
The performance of SiC Inverters for hybrid electric vehicles (HEV) has been presented in [10,11]. It applies the curve fitting for device losses extraction and a simplified analytical method for inverter loss calculation. For the vehicle-level evaluation, an existing model is used as black-box. Unfortunately, only very limited modeling details were introduced in this work either.
A relatively detailed inverter-level modeling method is presented in [12]. The I-V curves of individual switching devices are numerically calculated in the time domain with a fixed time step of 2 μs. A lookup table method is used for the loss extraction where instantaneous I-V value of devices are needed as input. This purely time-domain based modeling requires high computation time and is therefore not efficient for the endurance mileage calculation over a complete WLTC cycle.
Another work claims that SiC inverters might not bring efficiency benefits as expected [13]: under EPA (United States Environmental Protection Agency) profile, the endurance mileage increase is 1–2% only. This paper has referred the inverter modeling, vehicle modeling, as well as some design guidelines. However, only simple analytical methods are applied for the loss modeling without details.
FASTSim seems to be an effective vehicle-level simulation tool that is especially suitable for performance evaluation of powertrain systems [14,15]. However, the efficiencies of drivetrain components are set to be constant in their source code. This approximation is unacceptable when comparing the impact of IGBT and SiC inverter efficiency on the endurance mileage of the vehicle, since the efficiency difference varies significantly with operating conditions (e.g., at light vs. heavy loads) [16].
1.3. Challenges
From the state-of-the-art analysis above, it can be concluded that previous modeling approaches have the following constraints:
At the inverter-level modeling, there are problems of low modeling precision, ignoring the junction temperature sensitivity of SiC losses, and low computational efficiency. Firstly, the modeling precision of simplified methods such as curve fitting and analytical calculation are not satisfying, especially in complex operation conditions. Secondly, the efficiency of SiC inverters deteriorated dramatically with increasing operating temperature [17], which means the effect of SiC’s junction temperature needs to be reflected in the modeling. Thirdly, the time-domain based numeric method is not efficient for calculating the device peak temperature including the temperature ripple of devices, because it takes time for the device temperature to reach its steady state.
At the vehicle-level modeling, most previous works seem to lack technical details, especially like the parameter configurations for comparison [18]. This is possibly because power electronics engineers are not that familiar with vehicle systems, and therefore existing vehicle-level tools are just applied as a black box. It is then hard for the reader to further interpret like what is the total energy consumption composed of, why the endurance mileage increase is limited (or satisfying), etc. Therefore, both the modeling methodology and the simulation results have limited value for researchers.
Due to the lack of vehicle-level modeling details, very few previous works have summarized generalized guidelines for the design and optimization of SiC inverters from the efficiency and cost point of view.
In conclusion, a comprehensive modeling methodology is needed that can include a precise and fast loss and thermal modeling at the device/inverter level, a straightforward energy consumption and endurance mileage calculation method at the vehicle level, and generalized design guidelines for SiC adoption in EV applications should be summarized from results above.
1.4. Structure of the Paper
In this paper, a modeling methodology has been developed that is targeted for evaluating the efficiency and cost benefit for SiC inverters for EV applications with precision, speed, and intuition.
In Section 2, a circuit simulator called ScanTool is developed that is explicitly designed for performance screenings of high-power converters with a large number of operating conditions to be simulated. The electrical, loss, and thermal behaviors of the system are calculated jointly. The basic concept, the numerical background, the program structure and the features are presented in detail. In Section 3, a vehicle-level modeling is introduced, which adopts a similar approach to FASTSim but more precise. In Section 4, the performance of SiC inverters for different application scenarios is evaluated by using the modeling tools above. The impact of load profiles as well as the impact of vehicle’s aerodynamic drag coefficient on the endurance mileage increase is discussed. Moreover, by introducing a simplified cost model including the initial hardware investment and the charging cost during operation, the impact of driving mileage per month on the financial break-even is analyzed as well. In the last section, some generalized design guidelines are concluded for applying SiC technologies for traction inverters for EV applications.
2. Inverter Modeling
2.1. Introduction of ScanTool
To conduct a comprehensive analysis of the electric drive system including the inverter and the motor, it is necessary to screen a large number of steady-state operating cases. A power electronics system analysis tool called ScanTool is adopted here. ScanTool is a hybrid time-frequency domain based steady-state simulation tool [19]. It is mainly used for the conceptual design of power electronics systems at the early design stage. It can output the power, efficiency, voltage, and current distortion (e.g., THD), voltage ripples and current stress of dc-link capacitors, voltage/current/thermal stress of switching devices, etc.
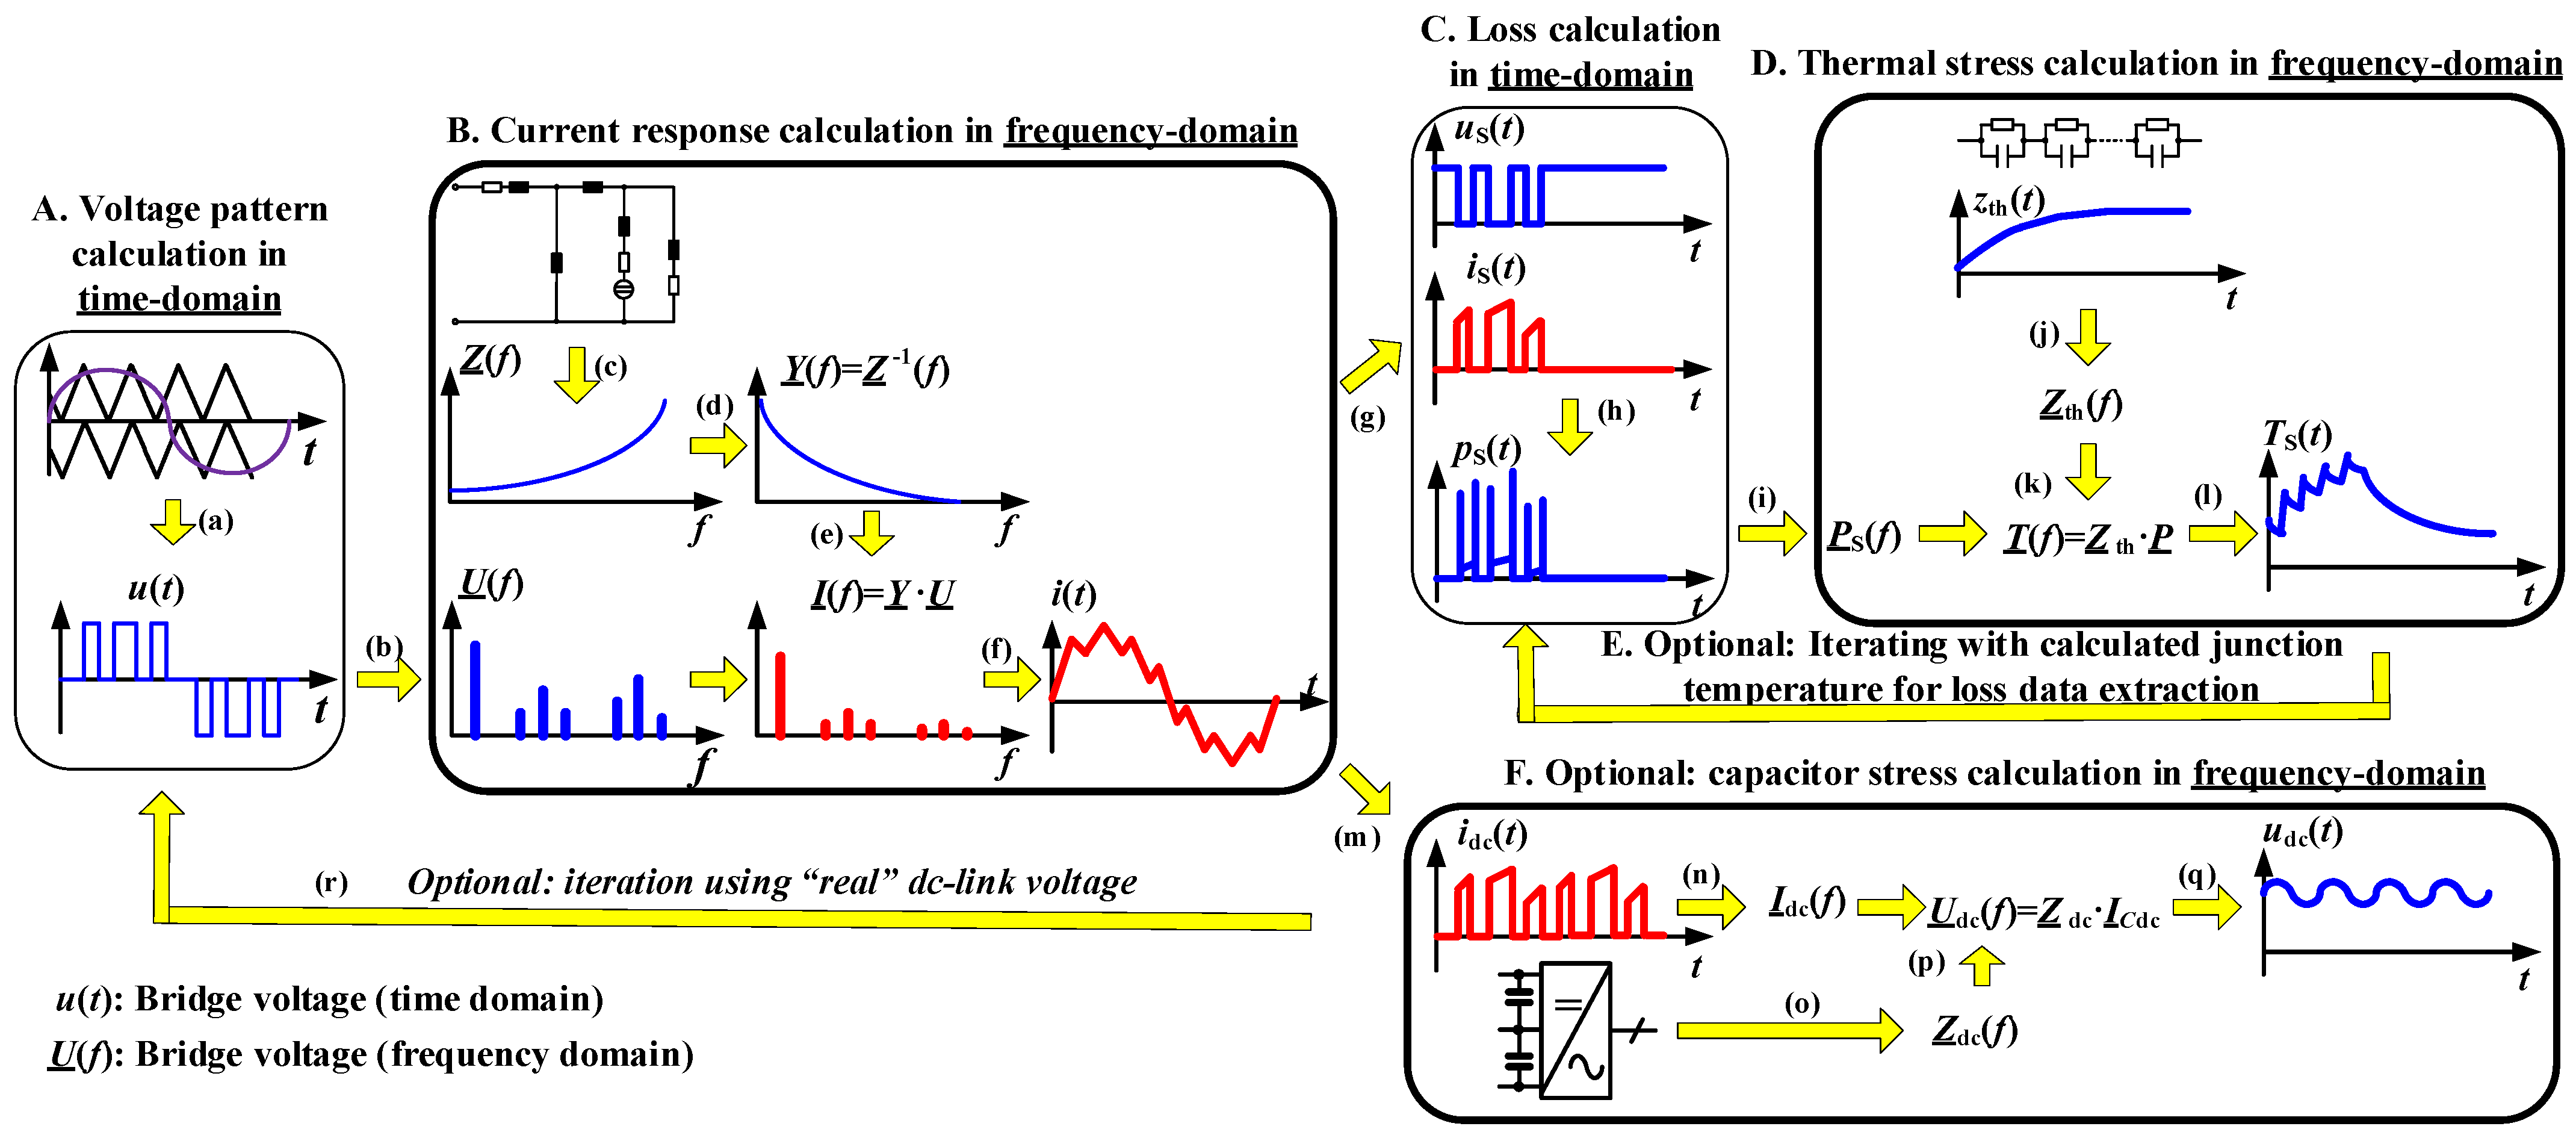
The operation mechanism of ScanTool is as follows. First, excitation waveforms like PWM voltage u(t) are numerically calculated in the time domain as normal. Next, as a highlight of the tool, the response waveforms are calculated in the frequency domain: the PWM voltages are transformed into the spectra U(f) in the frequency domain as excitation signals, while the plant (e.g., the electric motor here) are expressed as/transformed into admittance matrix Y(f) in the frequency domain. Then, by multiplying the excitation U(f) and the plant admittance Y(f), the frequency-domain response spectra I(f) (i.e., current spectra here) can be obtained. The response spectra are then reversely transformed into the time domain to obtain the response waveform i(t) (i.e., phase currents here). After that, the voltage waveform us(t) and current waveform is(t) of each switch can be separately divided in the time domain, and the total loss ps(t) in each switching state can be calculated. By transforming the total loss ps(t) of each switch into the spectra Ps(f) in the frequency domain, the thermal response can be calculated as T(f), and finally get the thermal response Ts(t) in the time domain. Using this method, output waveforms can achieve high steady-state precision, as it has already considered the response harmonics/ripples caused by the load impedance/admittance. Meanwhile, this approach can avoid considerable computation time of traditional time-based simulation tools before reaching steady states. The computing time can be reduced from dozens of minutes to 1–2 s per case. Hence, ScanTool is especially attractive for early-stage conceptual design of power electronics systems, while many cases with different software and hardware combinations need to be simulated. The mechanism of ScanTool is illustrated in Figure 1. For more details, please refer to [19].
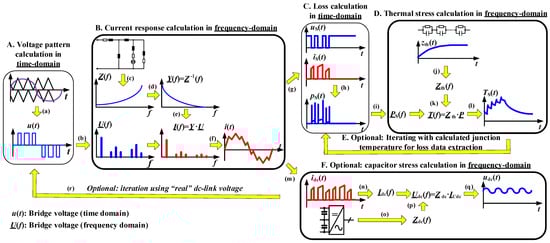
Figure 1.
System block diagram of ScanTool.
For the SiC-based inverter simulation here, the losses and the thermal calculation are the focus. Firstly, instantaneous voltage and current information of each device are sent to conduction and switching losses lookup tables (LUT) to obtain the losses of the device at this instant. The data source of LUT can either be from the device datasheet or from the measurement. Notice that the loss data are typically given at the room temperature 25 °C and the maximum operating temperature like 150 °C or 175 °C in the datasheet. Either data can be used for the 1st round loss calculation. Similar to the current response curve calculation, this device losses are calculated in the time domain and then transformed into the frequency domain and then multiplied by the thermal impedance of switching devices. The resultant thermal response spectra are then reversely transformed into the time domain to obtain the steady-state device junction temperature that has included the temperature ripple. Notice that the thermal ripple may become significant at low-speed-high-torque areas. Its resultant output power degradation should be considered during evaluation.
Since the power losses of unipolar SiC devices are highly dependent on the junction temperature, iterations are essential for the loss calculation: the device losses are recalculated from the LUT, where device temperature calculated in the first round is used as an additional input here. Notice that the power loss LUT is three-dimensional comprising the device current, voltage, and the junction temperature. This process will be iterated until the calculated temperature difference between the two adjacent simulations is less than e.g., 1 °C. By that, the impact of junction temperature on device and inverter losses are included in ScanTool, leading to the improved precision.
Similarly, the dc-link voltage calculation can also be iterated to obtain the voltage ripple caused by the pulsing current of the inverter. This has slight impact on the switching loss calculation of devices.
2.2. Model Validation
For vehicle-level modeling, the inverter modeling should output an efficiency map over the torque-speed area. The precision of this map is especially important while comparing a SiC inverter with an IGBT inverter. A three-phase half-bridge SiC power module has been developed by Leadrive, where each functional switch is composed of six Rohm’s Gen-4 SiC chips connected in parallel, i.e., 36 chips installed in each power module. The module is then applied to a 150 kW SiC inverter.
2.2.1. SiC Power Module Characterization
The conduction losses as well as the switching losses are measured and then imported to ScanTool as a database for the inverter efficiency map calculation. Notice that the measured conduction losses are almost doubled, when the junction temperature is increased from 25 °C to 150 °C. For charactering the dynamic behavior, i.e., the switching losses of devices, a double-pulse testing (DPT) method is applied. Normally, to conduct a comprehensive test for evaluation, numbers of combinations of device voltage, current, junction temperature, and gate resistance are needed [20]. Thus, it is important to use the automated test equipment to reduce experimental costs.
2.2.2. Comparison of Inverter Efficiency Map
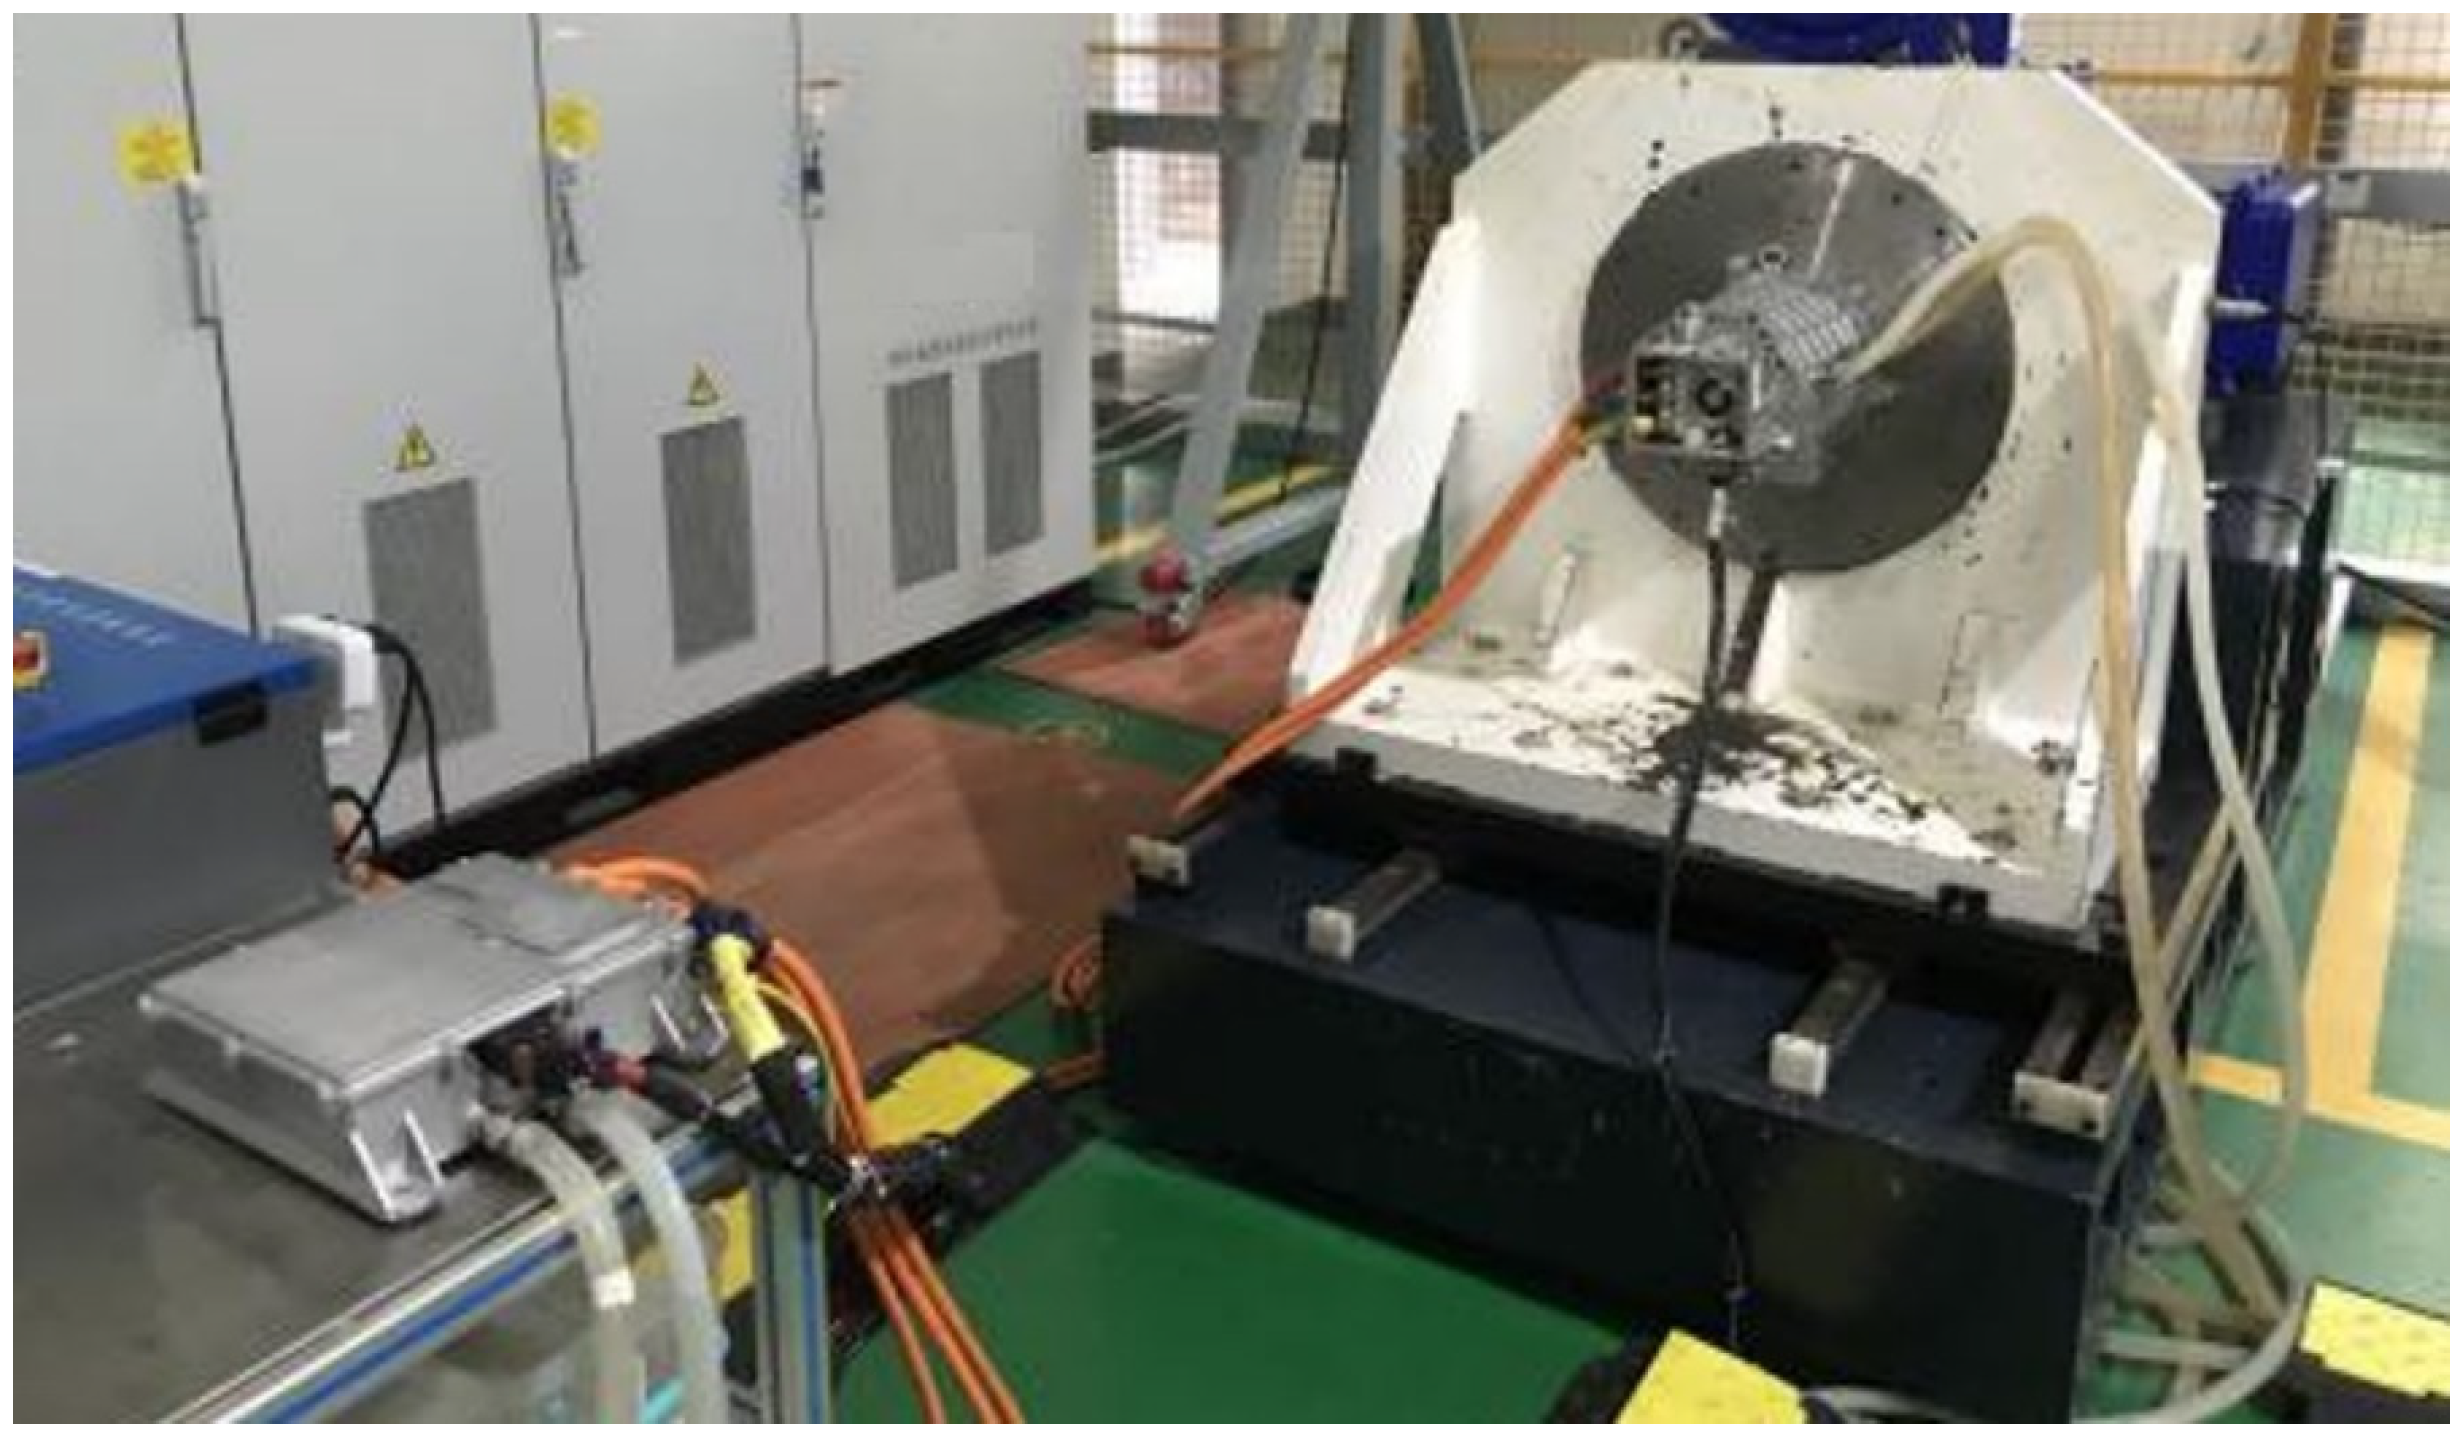
The efficiency map of inverters and the according motor are measured on the motor test bench, as shown in Figure 2. Two inverters with an IGBT module and a SiC module inside, respectively, are measured for comparison, while the motor remains unchanged. The control software including the carrier frequency of the two inverters remain unchanged as well. More test conditions are listed in Table 1. The same conditions are applied for the efficiency calculation in ScanTool.

Figure 2.
Drivetrain test bench for motor and inverter.

Table 1.
Configuration for the Drivetrain Efficiency Testing and Simulation.
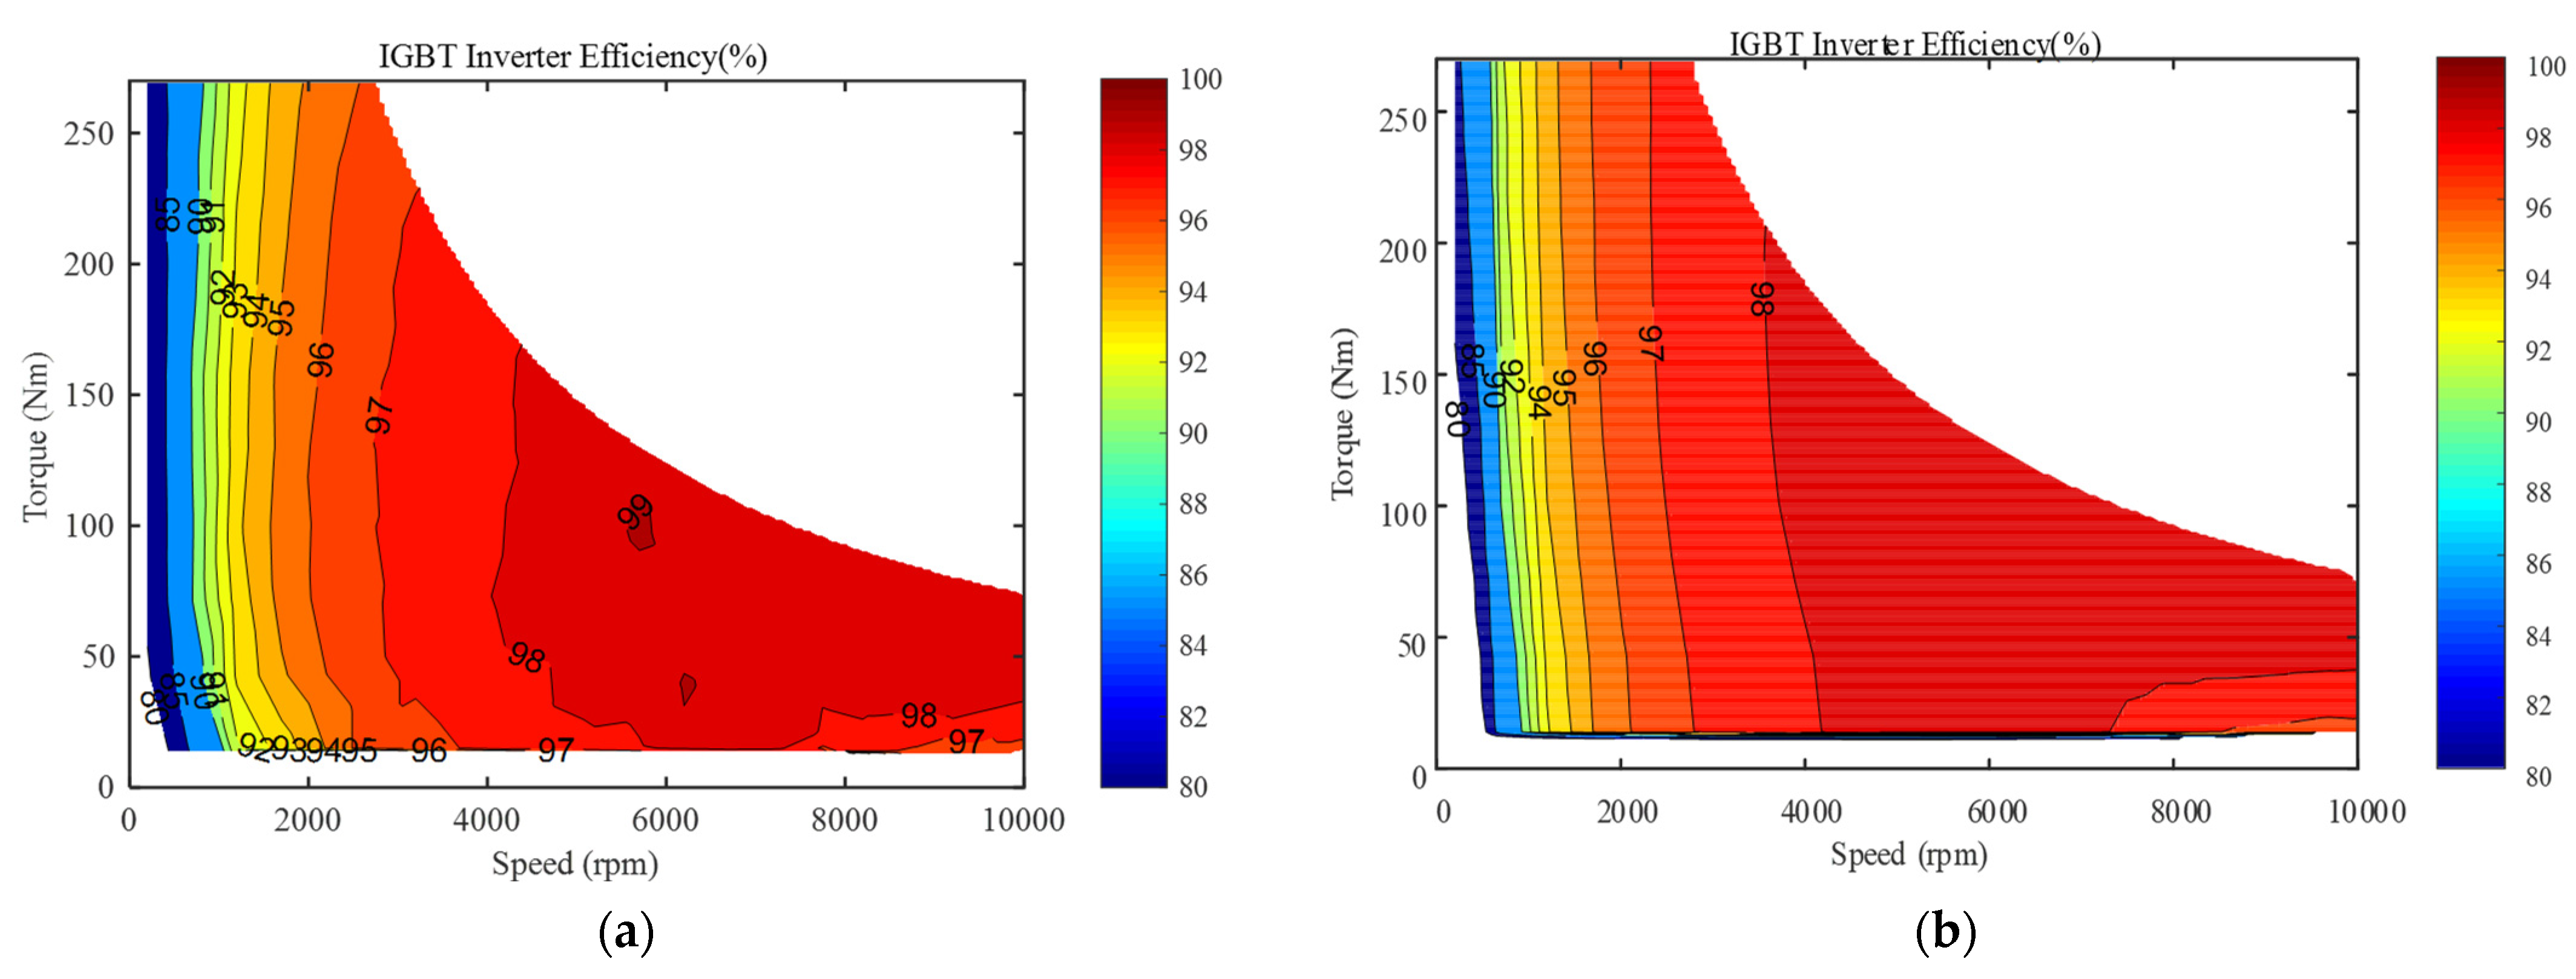
The measured and simulated efficiency maps of the IGBT and SiC inverter are shown in Figure 3 and Figure 4, respectively. Moreover, the maximum and minimum efficiency, and the percentage high-efficiency area (>85%, >95%) are summarized in Table 2 and Table 3, respectively.

Figure 3.
Efficiency map of the IGBT inverter with (a) measured and (b) calculated results.

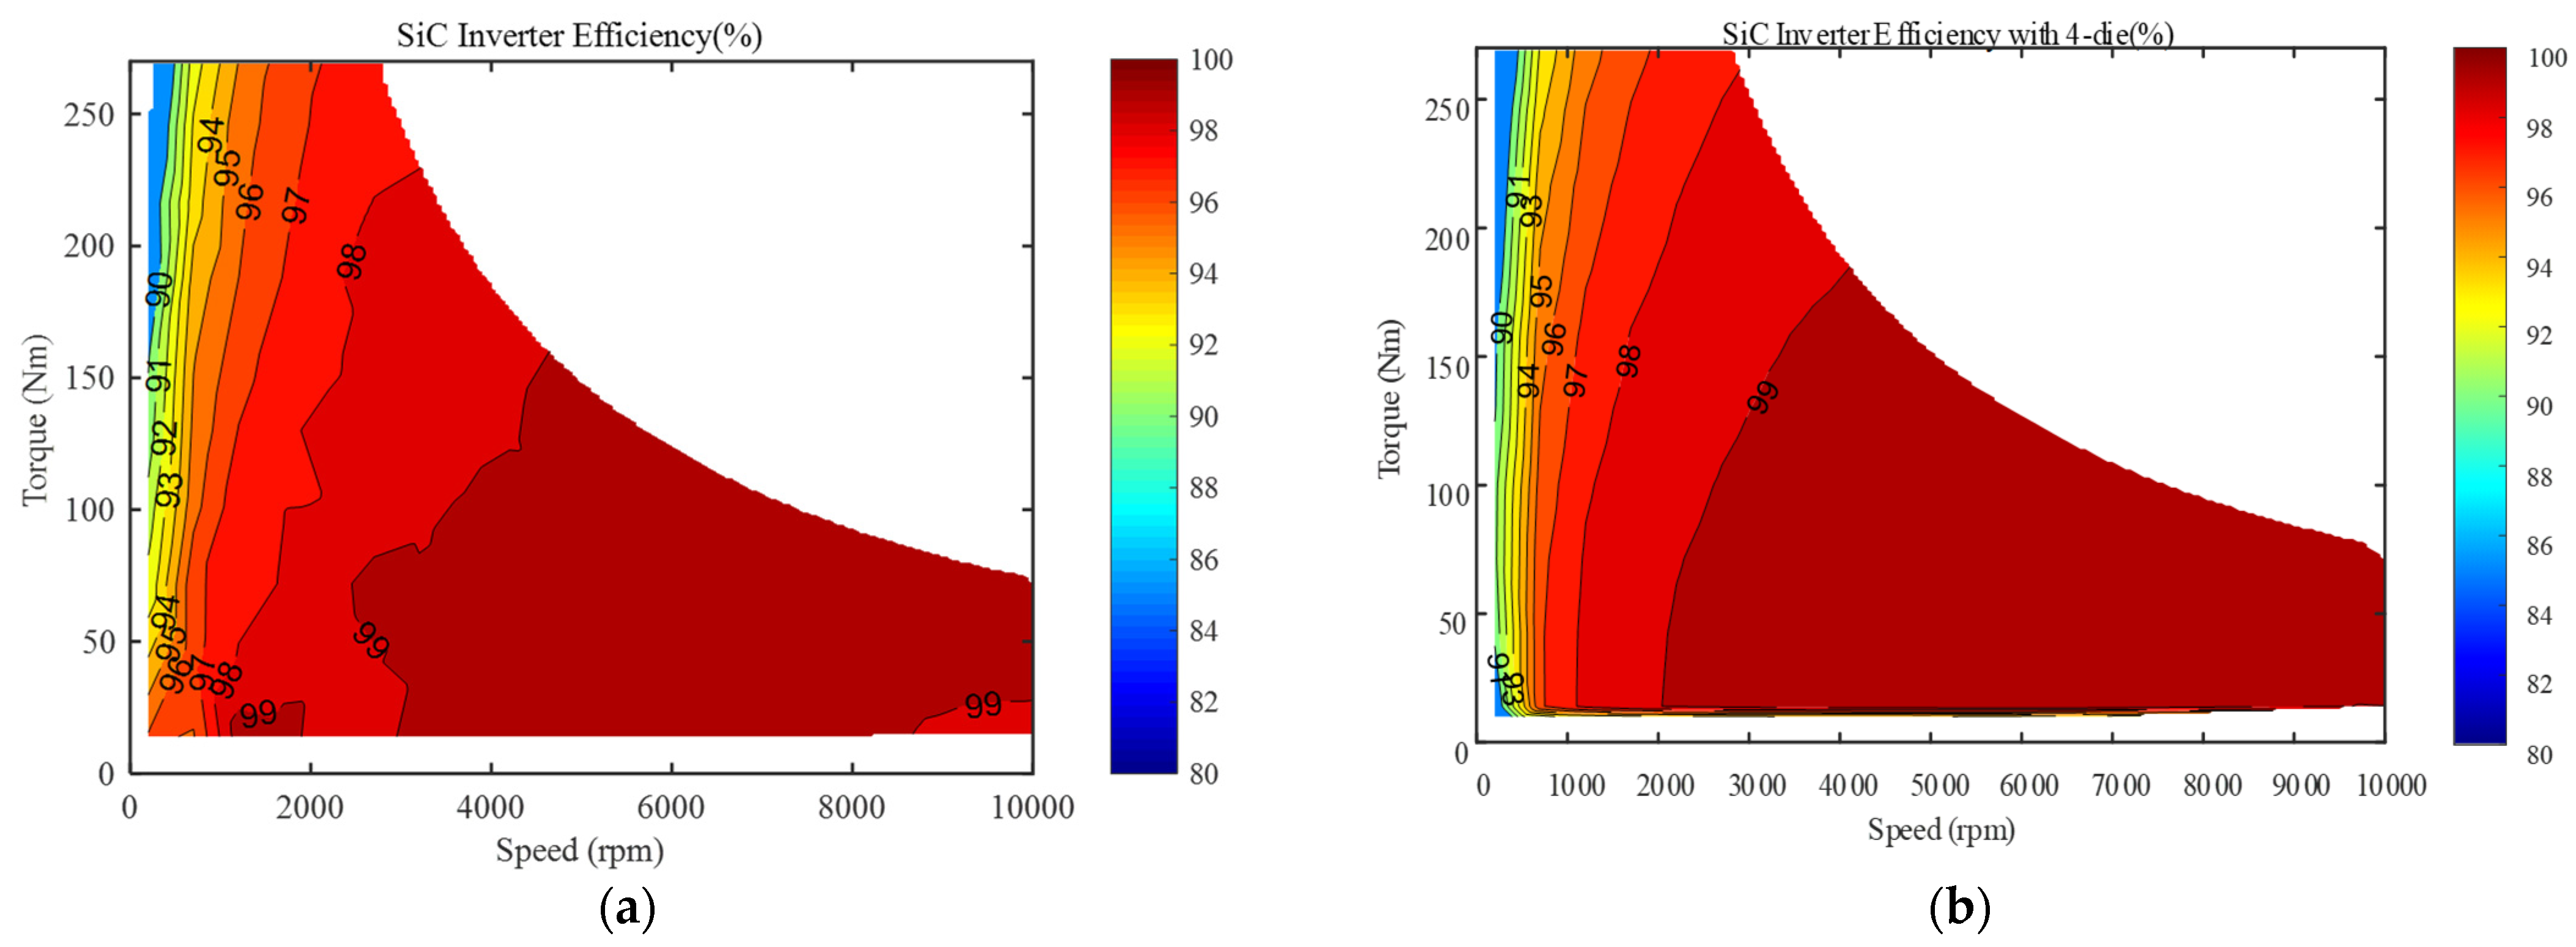
Figure 4.
Efficiency map of the SiC inverter with (a) measured and (b) calculated results.
Table 2.
Measured and Simulated Efficiency Characteristics of the IGBT Inverter.
Table 3.
Comparison of Measured and Simulated Efficiency Characteristics of the SiC Inverter.
From the comparisons above, it is found that the simulated results are highly consistent with measured ones. Mostly the errors between simulations and measurements are less than 1%, both for the IGBT and SiC inverters. The precision of the proposed inverter modeling method is thereby proven.
Notice that the errors of minimum efficiency are higher than other errors. This is because parasitic losses in the busbar and dc-link capacitor are calculated in a conservative way. However, this residual error can be tolerated since it only occurs at low-load areas that have negligible impact on the endurance mileage of the vehicle.
Comparing Figure 3 and Figure 4, it can be further explored that a SiC inverter has approx. 1% higher peak efficiency, 15% larger map area for η > 95%, and 9% larger area for η > 90%. From an inverter point of view, this is a significant improvement by using SiC power modules. On the other hand, its quantitative advantages in terms of the endurance mileage of a vehicle should be further explored in the next sections.
3. Vehicle-Level Modeling
Evaluation of Comprehensive Energy Consumption
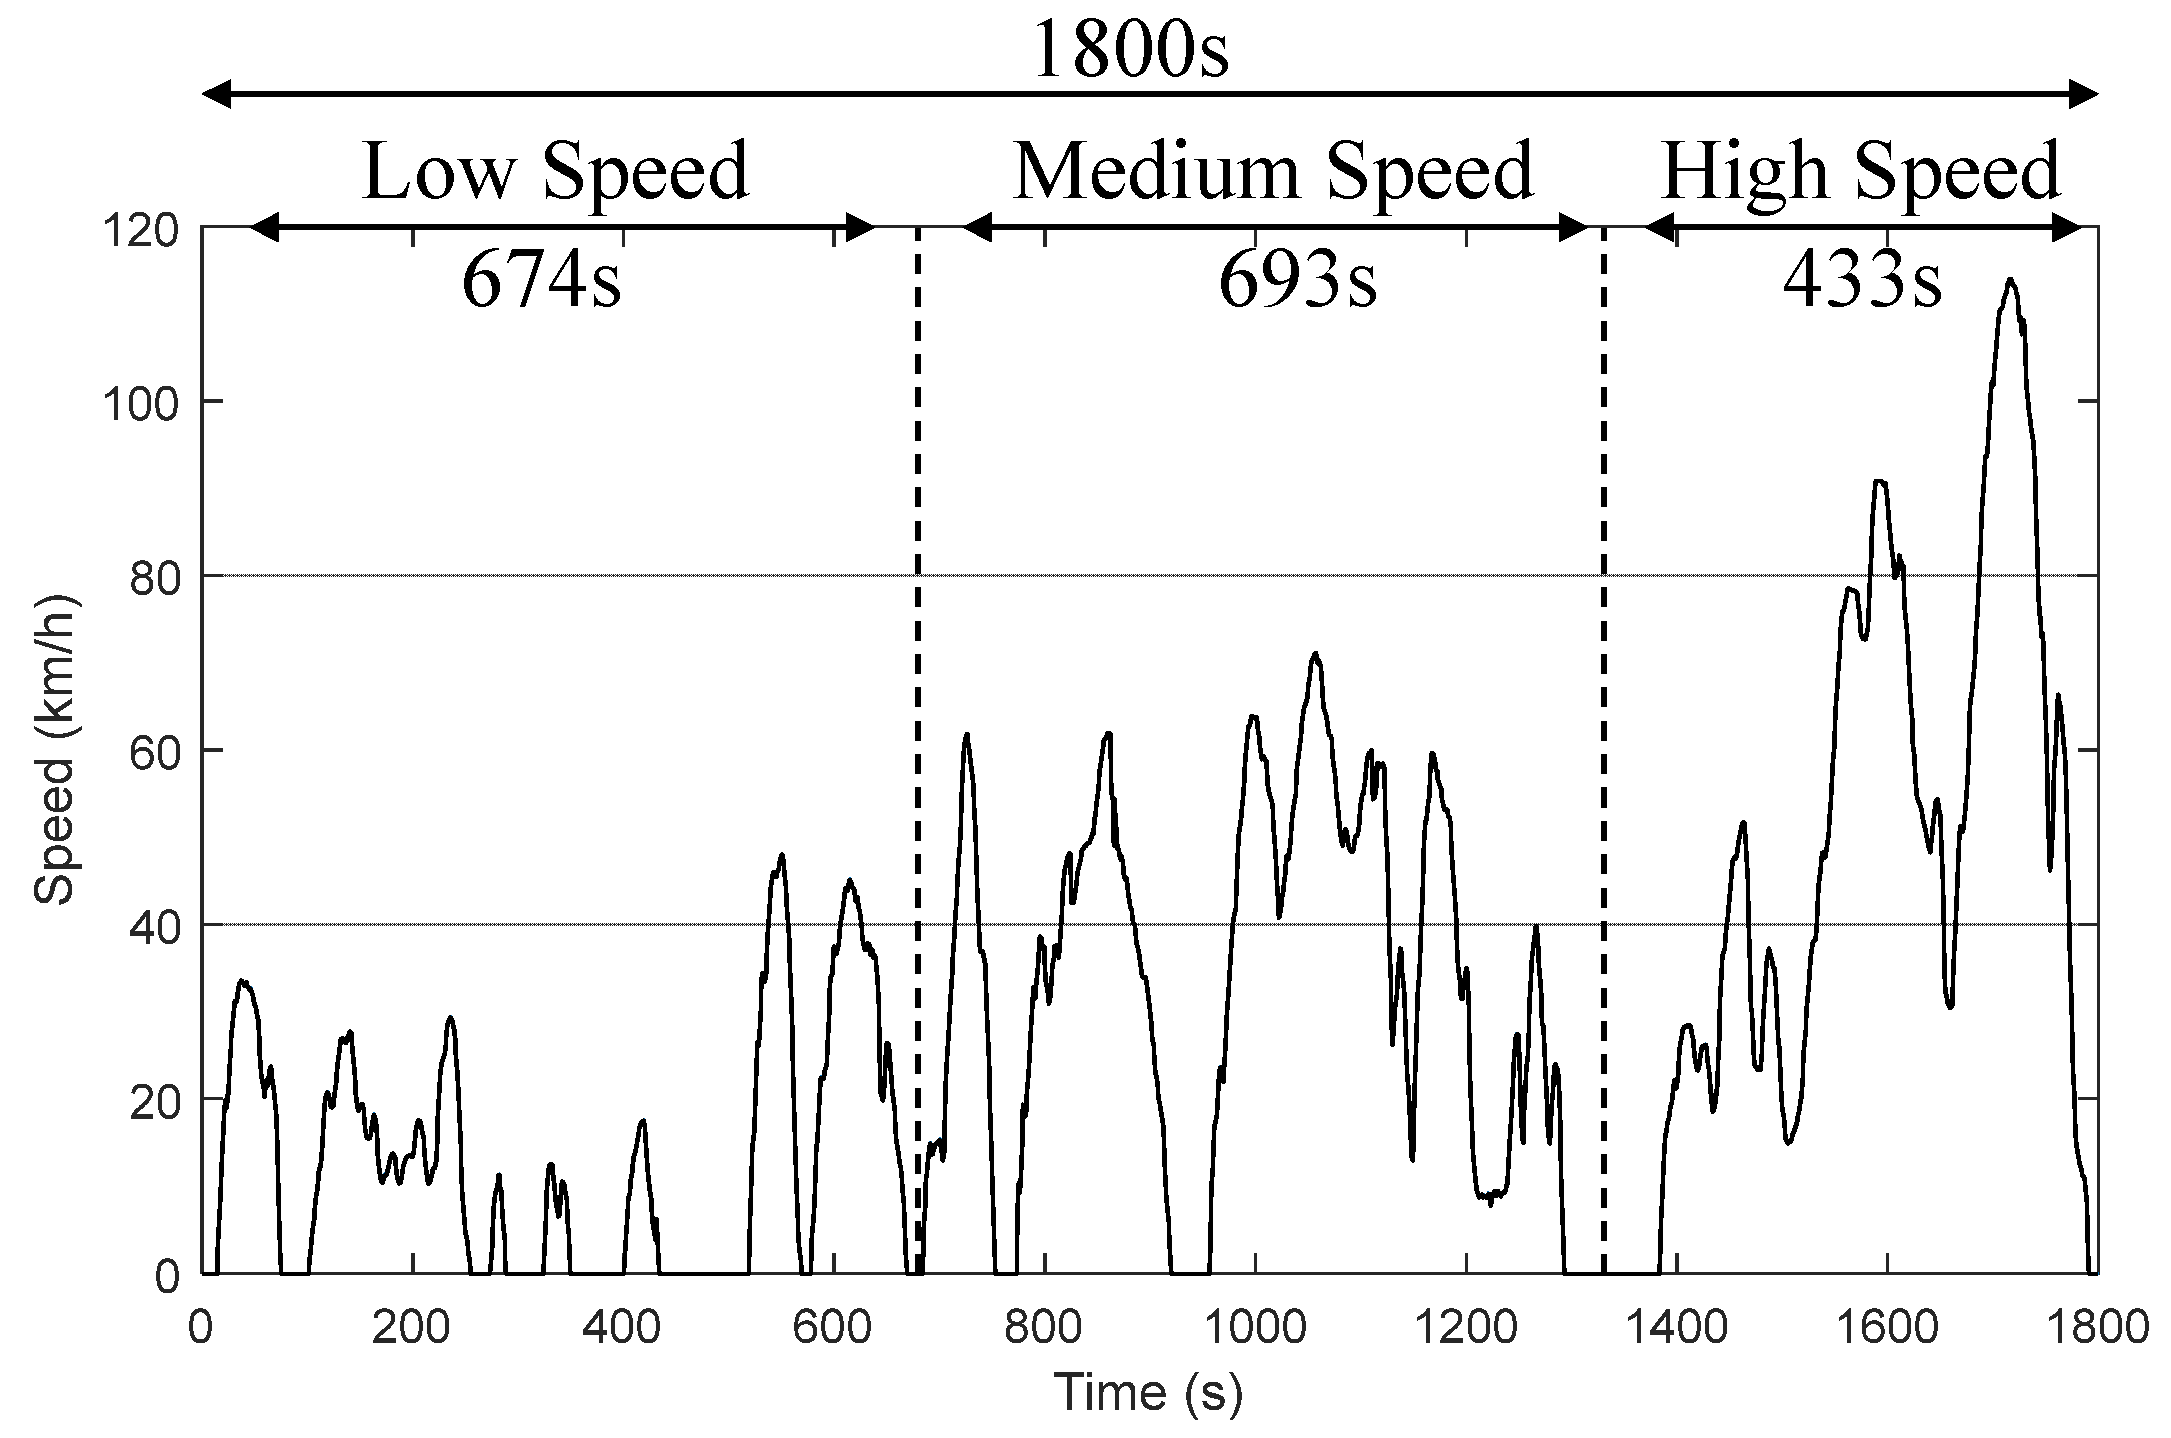
The vehicle-level modeling in this paper mainly refers to the vehicle’s energy consumption with a given load profile (i.e., a drive cycle) and its resultant endurance mileage. For this reason, a vehicle-level simulation tool has been developed as an add-on tool of ScanTool. It is similar to FASTSim (Future Automotive Systems Technology Simulator) developed by the U.S. Department of Energy [14,15]. The calculation flow is illustrated in Figure 5: a drive cycle is the input for the calculation flow. CLTC (China light-duty vehicle test cycle), WLTC (World Light Vehicle Test Cycle), and NEDC (New European Driving Cycle) are typical drive cycle profiles for endurance simulation/test in the world at present [21,22]. The driving cycle outputs the speed νveh(t) of the vehicle running at each moment in the endurance test. Next, a vehicle model that outputs the torque Twheel(t) and angular velocity ωwheel(t) of wheels is established. With the given vehicle information (weight, drag coefficient, wheel diameters) and the given load profile, the torque and the speed of the drivetrain at the wheels are obtained as (1) and (2), respectively.
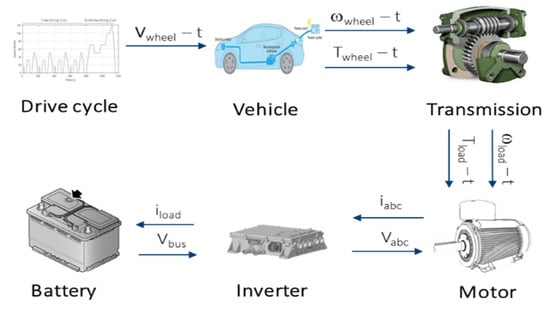
Figure 5.
Calculation flow of the vehicle-level modeling.
Here, Facc is the traction force that provides acceleration, which is related to the acceleration and the mass of the vehicle. Faero is the traction force used to overcome the aerodynamic resistance, which is related to the drag coefficient, ambient air density, front vehicle area and the linear velocity of the vehicle. Froll is the traction force used to overcome tire friction resistance, which is related to the running road condition and the mass of the vehicle. Fclimb is the traction force that a vehicle must overcome when climbing, which is related the road gradient and the mass of the vehicle. Facc_tire is the traction force increased due to the change of tire inertia, which is related to tire inertia, number of tires and tire angular velocity. Rwheel is the radius of wheels.
By knowing the gear ratio Ngear and the efficiency η of the transmission, the motor output frequency ωload(t) and torque Tload(t) can be calculated as (3) and (4), respectively.
This operating point, i.e., the torque and speed of the motor, together with the motor model in ScanTool, are used to calculate the motor efficiency. Meanwhile, depending on the motor model, the ac-terminal voltages and currents are calculated and will be used as input for the inverter loss or thermal calculation. With the given dc-link voltage, the dc current and moreover the battery energy consumption at this operating point can be obtained. Finally, the total energy consumption of the drivetrain over a complete drive cycle is obtained by accumulating the consumption at each operating point. To reduce the computation time, the calculations above are executed with 1 s interval, i.e., it has been approximated that the vehicle and inverter are operating at a steady state in this second.
4. Performance Evaluation
4.1. Endurance Mileage Improvement and Energy Consumption Distribution
Firstly, a car model with low drag coefficient is selected. The car model parameters like the weight, drag coefficient, wheel, the transmission (gearbox), etc., are imported to ScanTool, while the motor and the inverter model are the same as the ones that have been modeled and tested (see Figure 4 and Table 1). The efficiency of the SiC over the IGBT inverter is evaluated under CLTC-P (China light-duty vehicle test cycle—passenger car) load profile, see Figure 6. The efficiency map of the motor and the two inverters have been obtained in Figure 3a and Figure 4a. Taking one vehicle of the Tesla Model S series as an example, the influence of different powertrain on the endurance mileage is calculated. The key parameters of the whole vehicle are shown in Table 4.

Figure 6.
Profile of CLTC-P drive cycle.
Table 4.
Key Parameters of the vehicle.
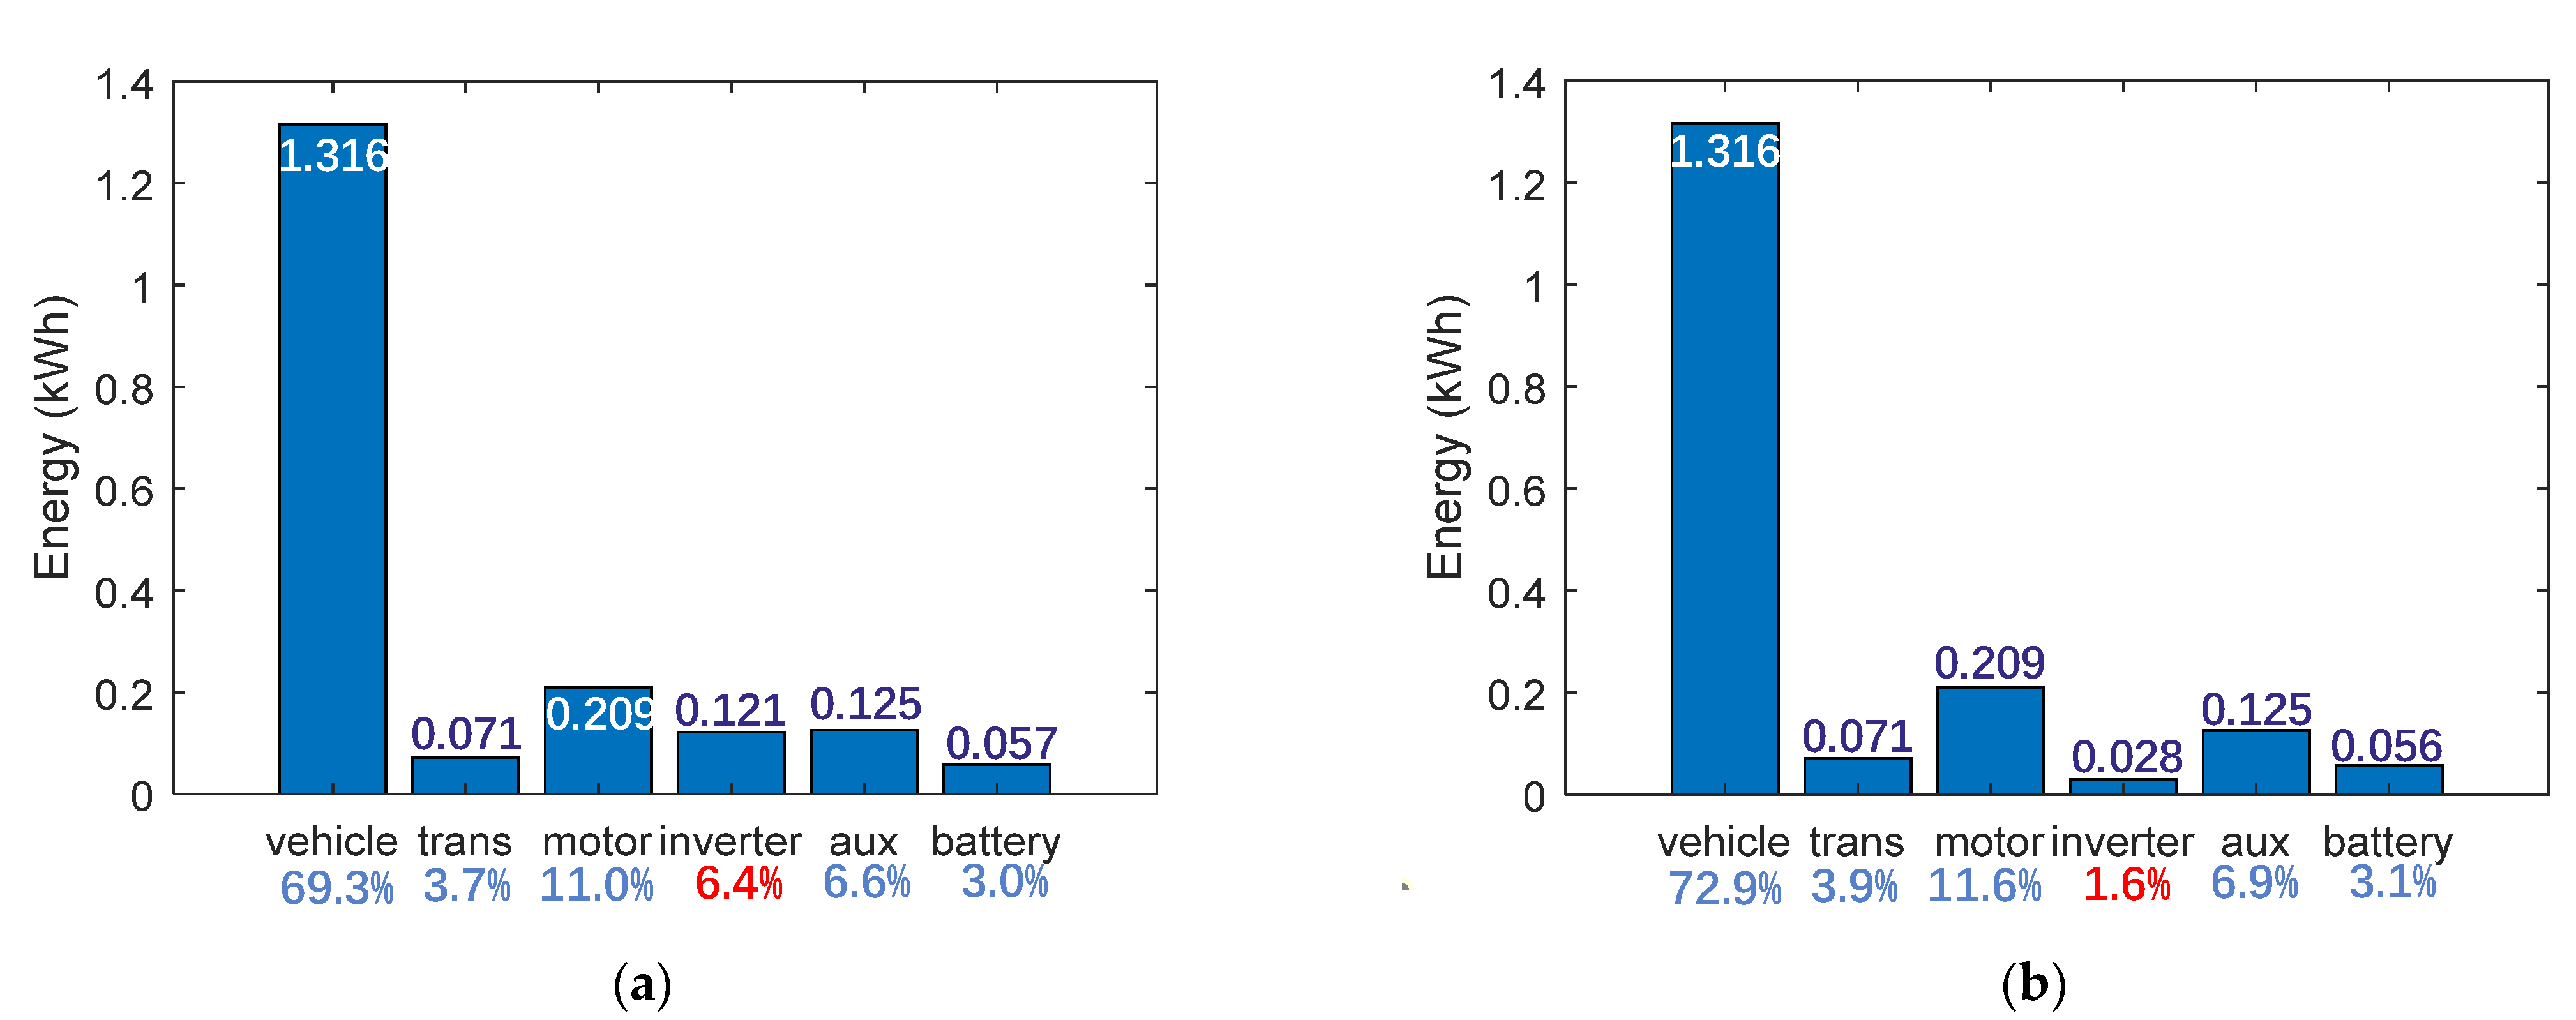
The energy consumption of the vehicle is calculated and shown in Figure 7. It can be seen that in both cases the most energy is consumed to overcome the resistance during driving, i.e., approx. 60% of the total consumption. In contrast, the consumption of the inverter is not that dominant, i.e., 6.4% and 1.6% for the IGBT and SiC inverter respectively. By applying the SiC power module, the driving energy per 100 km can be reduced from 13.12 kWh to 12.47 kWh, i.e., the endurance mileage can be increased by 4.95%.

Figure 7.
Vehicle energy consumption using (a) IGBT inverter; (b) SiC inverter under one CLTC-P cycle.
Notice that the motor energy consumption remains unchanged here, because the switching frequency of the SiC inverter is set to be the same as for the IGBT inverter. By applying higher switching frequency, the motor efficiency, especially the steel losses, are expected to be slightly reduced.
4.2. Impact of Load Profile on Endurance Mileage
The endurance mileage is recalculated under the WLTC (World Light Vehicle Test Cycle) and CLTC (China light-duty vehicle test cycle) profile, while the car model “T” and the drivetrain configuration remain unchanged. The results are summarized in Table 5. It shows that the efficiency advantage of applying the SiC inverter is more significant under CLTC-P profile and is degraded under WLTC profile. Comparing the two profiles, it is found that WLTC operating points are more distributed in high-speed regions and contain more aggressive accelerations/braking. It means that the inverter is more frequently operating at higher continuous power and peak power. Consequently, the efficiency advantage of the SiC inverter under WLTC profile is deteriorated compared to under CLTC-P profile, because the power losses of such unipolar devices increase dramatically at heavy loads. (i.e., proportional to the square of load current).
Table 5.
Endurance Mileage Increase using SiC Inverters under Different Load Profiles.
4.3. Impact of Drag Coefficient on Endurance Mileage
From Figure 7, the total energy is mainly consumed to overcome the drag coefficient of the vehicle (see the first raw), while the inverter energy consumption change (IGBT vs. SiC devices) is only a small fraction. Here, the impact of drag coefficient on the mileage increase is studied: for comparison, a second “T” car is used but with fictively increased drag coefficient of 10%. The results in Table 6 show that the benefit mileage endurance increase is reduced from 23.8 km to 22.4 km, i.e., reduced by 6%. Hence, it can be concluded that the lower the drag coefficient of the vehicle, the higher the percentage impact of inverter efficiency on the total energy consumption. In other words, SiC inverters are more attractive for car models with lower drag coefficient.
Table 6.
Endurance Mileage Increase using SiC Inverters under Different Drag Coefficient.
4.4. Impact of Chip Paralleling Number on System Cost
For IGBT power module design, the criteria for selecting IGBT chip paralleling number are quite intuitive: the chip temperature should not exceed the maximum allowed operating (e.g., 150 °C) at the peak load. The improvement of the inverter efficiency is limited when more IGBT chips are connected in parallel in the power module. This is because IGBT is a bipolar device that has significant conductivity modulation effect, leading to certain minimum voltage drop or losses of each chip, independent of the paralleling number [23]. Typically, the loss model of IGBTs can be simplified as a constant voltage source connected with a resistor in series.
In contrast, the loss model of a SiC chip can be simplified as a resistor, because SiC is a unipolar device. Hence, the more chips are connected in parallel, the lower are the conduction losses and the total losses of the power module (while the switching losses remain almost independent of the chip paralleling number) [24,25]. The increased inverter efficiency can then help reduce the battery cost without reducing the endurance mileage and help save the operation/charging cost. However, since SiC devices are relatively expensive, an optimal paralleling number of SiC chips in terms of the economic benefit should be screened.
For this study, a simplified economic model is applied. The assumptions of the model are shown in Table 7. Taking the power module cost and the corresponding battery cost with the same endurance mileage as the initial investment, and taking the charging cost as operation cost, the economic benefits brought by using different power module schemes can be then evaluated.
Table 7.
Key Assumptions of Economic Model.
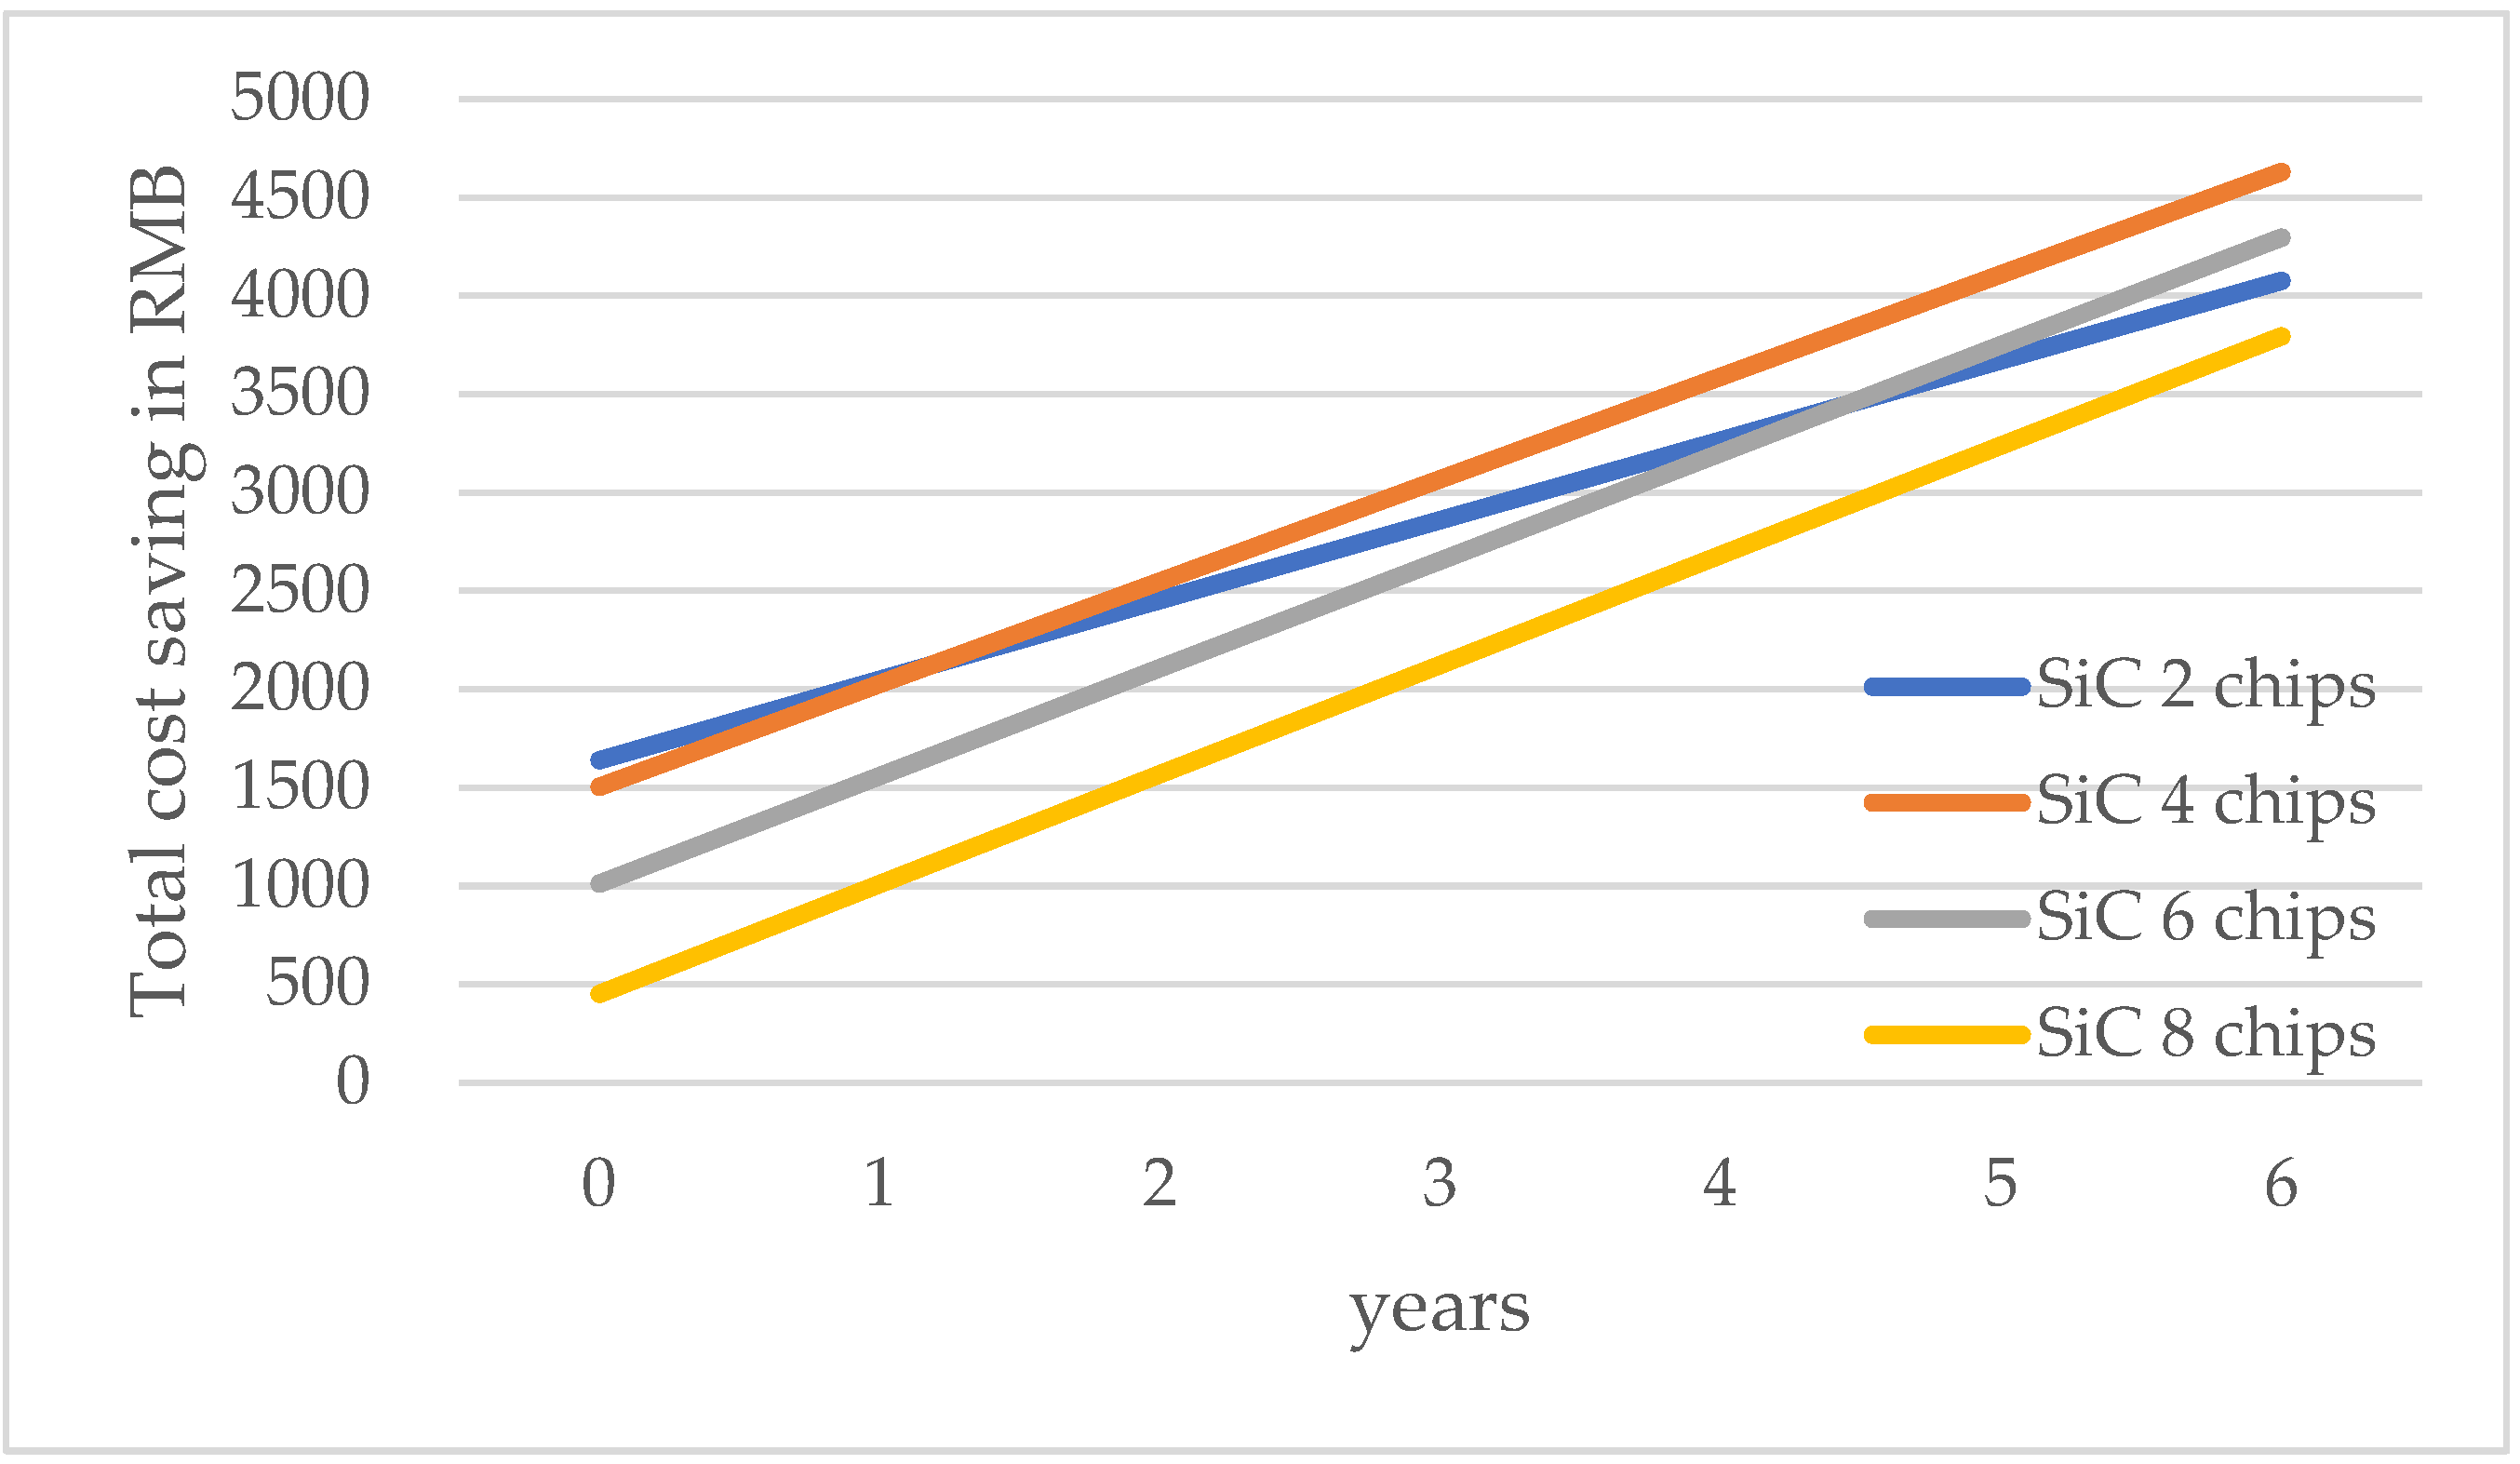
The simulations here apply CLTC profile for the car model “T”. The simulation results of different chip paralleling numbers are shown in Figure 8. The x-axis is the operation year, while the y-axis is the total cost saving that is composed of the chip (power module) and the battery cost saving at the beginning, and the charging cost saving during operation.

Figure 8.
Impact of SiC chip paralleling number on the total cost saving (compared to IGBT module).
In Figure 8, the system cost saving over the year is over the year is studied under four scenarios, i.e., the 2-chips, 4-chips, 6-chips, and 8-chips version for each electrical switch of the SiC power module. The results show that the 4-chips version has the most cost saving starting from year 2.3. When less chips are installed (i.e., the 2-chips version), the initial cost saving is the most at the beginning but the cost saving during operation is then limited. Over the years, its overall economic benefits are then limited. When six or eight chips are paralleled, the energy consumption of the SiC inverter can be further reduced, but its percentage impact on the endurance mileage is then deteriorated. Hence, due to the higher initial chip cost, the 4-chips and 6-chips version curves are almost parallel, but with an offset caused by higher chip number.
In all cases above the initial cost, saving has a positive sign. This is because the vehicle has a big battery size of 80 kWh. In case less battery is installed, the initial cost saving will possibly have a negative sign, while the operation cost saving will not be as significant as the cases in Figure 8. In addition, the frequency of the car use, the drag coefficient, the car weight, and all the cost assumptions may also have considerable impact on the simulation results. However, this section has presented an intuitive method to quantify the economic benefits of SiC inverters and to further optimize the chip number to gain the most system cost saving.
Notice that the evaluation results above only consider the system cost saving. For many applications where the acceleration performance of the drivetrain is required, more chips probably have to be installed to gain higher peak power.
5. Conclusions
In this paper, a modeling method for evaluating the efficiency benefits of SiC devices of EV traction applications has been presented. At the inverter level, a hybrid time and frequency domain-based tool is developed that is precise and fast. The obtained inverter efficiency information is then transformed into the vehicle mileage endurance through a vehicle-level model, where the energy consumption of individual components is calculated as well for sensitivity analysis. Lastly, a simplified cost model is presented that indicates the relationship between the economic benefit and the paralleled chip number.
The simulations in this paper show that the energy consumption of a SiC inverter can be greatly reduced by 77% compared to an IGBT inverter; see Figure 7. On the other hand, this is still only a small fraction of the total consumption. Its impact on the endurance mileage improvement is highly dependent on other parameters like the drag coefficient, the load profile, etc. When CLTC-P profile is applied to a car model with low drag coefficient, the mileage improvement can reach 4.95%. However, this benefit will be deteriorated, when a load profile contains more aggressive acceleration/breaking or constant high-speed range, or when a car model has higher drag coefficient. To overcome this, more SiC chips should be installed and paralleled inside the power module.
When selecting the optimal chip paralleling number, the cost of both the chip, battery and the charging should be considered. Different from typical IGBT module design, a slight overdesign of the SiC chip number is strongly recommended for SiC power modules to gain the most cost saving. This can help effectively reduce the battery installation and save the charging cost during operation.
In general, SiC-based EV traction inverters are more attractive for applications with long endurance mileage (i.e., with big battery size), low aerodynamic drag coefficient, and more frequent use of the vehicle (leading to higher charging cost).
Author Contributions
Conceptualization, H.S. and L.Z.; methodology, D.M.; software, Y.L.; validation, Y.L., N.H. and Y.X.; formal analysis, H.S.; investigation, D.M.; resources, H.S.; data curation, Y.L.; writing—original draft preparation, H.S.; writing—review and editing, L.Z. and D.M.; visualization, N.H.; supervision, Y.X.; project administration, H.S. All authors have read and agreed to the published version of the manuscript.
Funding
This research received no external funding.
Institutional Review Board Statement
Not applicable.
Informed Consent Statement
Not applicable.
Data Availability Statement
The study did not report any data.
Conflicts of Interest
The authors declare no conflict of interest.
References
- Millan, J.; Godignon, P.; Perpina, X.; Perez-Tomas, A.; Rebollo, J. A survey of wide bandgap power semiconductor devices. IEEE Trans. Power Electron. 2013, 29, 2155–2163. [Google Scholar] [CrossRef]
- Zeng, Z.; Zhang, X.; Blaabjerg, F.; Chen, H.; Sun, T. Stepwise design methodology and heterogeneous integration routine of air-cooled SiC inverter for electric vehicle. IEEE Trans. Power Electron. 2019, 35, 3973–3988. [Google Scholar] [CrossRef]
- Jahdi, S.; Alatise, O.; Fisher, C.; Ran, L.; Mawby, P. An evaluation of silicon carbide unipolar technologies for electric vehicle drive-trains. IEEE J. Emerg. Sel. Top. Power Electron. 2014, 2, 517–528. [Google Scholar] [CrossRef]
- Ahmed, M.H.; Wang, M.; Hassan, M.A.S.; Ullah, I. Power loss model and efficiency analysis of three-phase inverter based on SiC mosfets for PV applications. IEEE Access 2019, 7, 75768–75781. [Google Scholar] [CrossRef]
- Li, Z.; Wang, J.; Ji, B.; Shen, Z.J. Power loss model and device sizing optimization of Si/SiC hybrid switches. IEEE Trans. Power Electron. 2020, 35, 8512–8523. [Google Scholar] [CrossRef]
- Sun, Y.; Yue, H.; Zhang, J.; Booth, C. Minimization of residential energy cost considering energy storage system and ev with driving usage probabilities. IEEE Trans. Sustain. Energy 2018, 10, 1752–1763. [Google Scholar] [CrossRef]
- Yamaguchi, K. Design and evaluation of SiC-based high power density inverter, 70 kW/liter, 50 kW/kg. In Proceedings of the 2016 IEEE Applied Power Electronics Conference and Exposition (APEC), Long Beach, CA, USA, 20–24 March 2016; pp. 3075–3079. [Google Scholar]
- Hirao, T.; Onishi, M.; Yasuda, Y.; Namba, A.; Nakatsu, K. EV traction inverter employing double-sided direct-cooling technology with SiC power device. In Proceedings of the 2018 International Power Electronics Conference (IPEC-Niigata 2018-ECCE Asia), Niigata, Japan, 20–24 May 2018; pp. 2082–2085. [Google Scholar] [CrossRef]
- Nisch, A.; Kloeffer, C.; Weigold, J.; Wondrak, W.; Schweikert, C.; Beaurenaut, L. Effects of a SiC tmosfet tractions inverters on the electric vehicle drivetrain. In Proceedings of the PCIM Europem, Nuremberg, Germany, 5–7 June 2018; pp. 1–8. [Google Scholar]
- Zhang, H.; Tolbert, L.M.; Ozpineci, B. Impact of SiC devices on hybrid electric and plug-in hybrid electric vehicles. IEEE Trans. Ind. Appl. 2011, 47, 912–921. [Google Scholar] [CrossRef]
- Su, M.; Chen, C.; Sharma, S.; Kikuchi, J. Performance and cost considerations for SiC-based HEV traction inverter systems. In Proceedings of the 2015 IEEE 3rd Workshop on WiPDA, Blacksburg, VA, USA, 2–4 November 2015; pp. 347–350. [Google Scholar]
- Wu, R.; Gonzalez, J.O.; Davletzhanova, Z.; Mawby, P.A.; Alatise, O. The potential of SiC cascode JFETs in electric vehicle traction inverters. IEEE Trans. Transp. Electrif. 2019, 5, 1349–1359. [Google Scholar] [CrossRef]
- Zhu, J.; Kim, H.; Chen, H.; Erickson, R.; Maksimovic, D. High efficiency SiC traction inverter for electric vehicle applications. In Proceedings of the 2018 IEEE Applied Power Electronics Conference and Exposition (APEC), San Antonio, TX, USA, 4–8 March 2018; pp. 1428–1433. [Google Scholar] [CrossRef]
- Brooker, A.; Gonder, J.; Wang, L.; Wood, E.; Lopp, S.; Ramroth, L. FASTSim: A model to estimate vehicle efficiency, cost and performance. SAE Tech. Pap. 2015, 1, 0973. [Google Scholar] [CrossRef]
- Wipke, K.; Cuddy, M.; Burch, S. ADVISOR 2.1: A user-friendly advanced powertrain simulation using a combined backward/forward approach. IEEE Trans. Veh. Technol. 1999, 48, 1751–1761. [Google Scholar] [CrossRef]
- Pou, J.; Osorno, D.; Zaragoza, J.; Jaen, C.; Ceballos, S. Power losses calculation methodology to evaluate inverter efficiency in electrical vehicles. In Proceedings of the 2011 7th International Conference-Workshop Compatibility and Power Electronics (CPE 2011), Tallinn, Estonia, 1–3 June 2011; pp. 404–409. [Google Scholar] [CrossRef]
- Qi, J.; Yang, X.; Li, X.; Tian, K.; Mao, Z.; Yang, S.; Song, W. Temperature dependence of dynamic performance characterization of 1.2-kV SiC power mosfets compared with Si IGBTs for wide temperature applications. IEEE Trans. Power Electron. 2019, 34, 9105–9117. [Google Scholar] [CrossRef]
- Sreedhar, V. Plug-in hybrid electric vehicles with full performance. In Proceedings of the 2006 IEEE Conference on Electric and Hybrid Vehicles, Pune, India, 18–20 December 2006; pp. 1–2. [Google Scholar] [CrossRef]
- Shen, J. Modeling Methodologies for Analysis and Synthesis of Controls and Modulation Schemes for High-Power Converters with Low Pulse Ratios; RWTH Aachen University: Aachen, Germany, 2013; Chapter 2; ISBN 978-3-942789-16-5. [Google Scholar]
- Liu, T.; Ning, R.; Wong, T.T.Y.; Shen, Z.J. Modeling and analysis of SiC MOSFET switching oscillations. IEEE J. Emerg. Sel. Top. Power Electron. 2016, 4, 747–756. [Google Scholar] [CrossRef]
- Wang, W.; Dai, Z.; Bao, M.; Chen, J.; Huang, W.; Liu, Y. A research on the RDE and WLTC cycle emission characteristics of hybrid electric vehicle. In Proceedings of the 2021 IEEE 4th International Conference on Electronics Technology (ICET), Chengdu, China, 7–10 May 2021; pp. 574–579. [Google Scholar] [CrossRef]
- Waheed, A.; Buss, K. Modeling and validation of a three-dimensional thermoelectric model of a 50 Ah lithium-iron-phosphate battery cell at three different ambient temperatures in the new European driving cycle (NEDC). In Proceedings of the AmE 2016—Automotive Meets Electronics; 7th GMM-Symposium, Dortmund, Germany, 1–2 March 2016; pp. 1–6. [Google Scholar]
- Lutz, J.; Schlangenotto, H.; Scheuermann, U.; De Doncker, R. Semiconductor Power Devices—PhySiCs, Characteristics, Reliability; Springer: Berlin/Heidelberg, Germany, 2017; Volume 9, pp. 342–390. ISBN 978-3-642-11125-9. [Google Scholar]
- Yamaguchi, K.; Katsura, K.; Yamada, T.; Sato, Y. Criteria for using antiparallel SiC SBDs with SiC mosfets for SiC-based inverters. IEEE Trans. Power Electron. 2019, 35, 619–629. [Google Scholar] [CrossRef]
- Krishna Moorthy, R.S.; Aberg, B.; Olimmah, M.; Yang, L.; Rahman, D.; Lemmon, A.N.; Yu, W.; Husain, I. Estimation, Minimization, and Validation of Commutation Loop Inductance for a 135-kW SiC EV Traction Inverter. IEEE J. Emerg. Sel. Top. Power Electron. 2020, 8, 286–297. [Google Scholar] [CrossRef]

Publisher’s Note: MDPI stays neutral with regard to jurisdictional claims in published maps and institutional affiliations. |
© 2022 by the authors. Licensee MDPI, Basel, Switzerland. This article is an open access article distributed under the terms and conditions of the Creative Commons Attribution (CC BY) license (https://creativecommons.org/licenses/by/4.0/).