Article

Comparison between the PD Characteristics of g3 and Dry Air for Gas-Insulated Switchgears

1
Department of Electrical and Electronics Engineering, Korea Maritime and Ocean University, Busan 49112, Korea
2
Department of Electrical & Electronic Engineering, Silla University, Busan 46958, Korea
*
Author to whom correspondence should be addressed.
Energies 2022, 15(19), 7043; https://doi.org/10.3390/en15197043
Submission received: 1 September 2022 / Revised: 18 September 2022 / Accepted: 22 September 2022 / Published: 25 September 2022
(This article belongs to the Section F: Electrical Engineering)

Abstract

:
This paper presents a comparison between the partial discharge (PD) characteristics of g3 and dry air for gas-insulated switchgears. PD signals were measured with a conventional method according to IEC 60270 and an ultra-high frequency (UHF) method. The partial discharge inception voltages (PDIVs) of g3 and dry air are about 74% to 84% and 58% to 72%, respectively, in the protrusion on conductor (POC) system, and 90% to 96% and 80% to 93%, respectively, in the free moving particle (FMP) system, depending on the gas pressure of 0.1 MPa to 0.5 MPa. The single PD pulse in time and frequency domains are not distinguished according to gas type. The PRPD patterns have different phase angles depending on the gas type in the POC, while the phase angle is 0–360° in the FMP, regardless of the gas type. Lastly, the correlation was analyzed, showing that the output voltage in mV of the UHF sensor increases linearly in accordance with the apparent discharge in pC, regardless of the gas type. The experimental results in this paper are important as a fundamental database for the application of UHF monitoring systems in an eco-friendly GIS.

1. Introduction

To provide stable power and protect electrical power systems, gas-insulated switchgears (GISs) have been widely installed in substations since 1960. A GIS is composed of a busing, a current and voltage transformer, disconnecting switch, a gas circuit breaker, and other components. Sulfur hexafluoride (SF6), used in GISs as an insulating medium, has excellent arc extinguishing capabilities and great dielectric strength, about three times greater than that of air. In addition, SF6 has many advantages, such as low toxicity, non-flammability, low condensation temperature, high heat dissipation, and chemical stability [1,2,3,4,5,6,7]. However, SF6 is one of the six greenhouse gases specified by the Intergovernmental Panel on Climate Change (IPCC) [8] due to its global warming potential (GWP), which is 23,500 times higher than that of carbon dioxide (CO2), and it has a lifetime of 3200 years in the atmosphere [9]. For this reason, the use of SF6 is restricted by the Kyoto protocol and must be gradually reduced by 2020 [10]. In addition, 196 parties negotiated the Paris Agreement to keep the increase in global average temperature to well below 2 °C and limit the increase to 1.5 °C in 2015 [11]. Therefore, it is necessary to apply environment-friendly insulation gases to replace SF6 to reduce the global warming situation. Currently, in Korea, eco-friendly GISs are being applied to new substations from 2021, and existing GISs with SF6 should be replaced with eco-friendly GISs from 2023.
Many studies were performed to investigate natural gases such as CO2, nitrogen (N2), or air for use in gas-insulated power facilities [12,13,14]. These gases have stable chemical properties and low GWP. However, they have a low insulation strength, which is only 40% of that of SF6 [15,16]. In addition, gas mixtures of SF6 including CO2, N2, or air were introduced due to their excellent insulation performance, but these mixtures are limited strictly to use in cold areas owing to high liquefaction temperature of SF6 and the fact that its GWP is still high [17,18,19,20]. Other interesting gases have been investigated, such as trifluoroiodomethane (CF3I), hydrofluoroolenfins (HFOs), and perfluorinated ketones [5,21,22]. These gases have high insulation performances and low GWP, but still are not suitable as a high-voltage insulation gas due to their high liquefaction temperature, boiling point, and toxicity. Until now, the eco-friendly gases employed for high-voltage GISs are green gas for grid (g3, trademark of General Electric) and dry air (Clean Air, trademark of Siemens); these are seen as the most popular alternatives for SF6. The g3 consists of NOVECTM 4710, CO2, and O2. The NOVECTM 4710 enables a significant GWP reduction compared to SF6 and is non-flammable. In addition, it is suitable for use in high-voltage insulation applications, owing to its dielectric breakdown voltage, which is approximately two times that of SF6.
Many studies for insulation breakdown characteristics of g3 and dry air were performed. Nechmi and colleagues [23] analyzed the breakdown characteristics of g3 under AC and lightning impulse voltages with different electrodes and field utilization factors compared to SF6. They discovered that g3 mixed with 3.7% NOVECTM 4710 is a good compromise and is an appropriate alternative for SF6 in terms of insulation in high-voltage power equipment, and its GWP can be reduced by 98.4% lower than that of SF6. Kieffel and colleagues [24] investigated the dielectric performance of g3 compared to SF6 under lightning impulse, and the result shows that its dielectric performance at 0.67 to 0.82 MPa is equivalent to between 87% and 96% of that of SF6 at 0.55 MPa. In case of the dry air, which is composed of N2 and O2, Jiang and colleagues [25] concluded that the dielectric strength of dry air is higher than that of N2 and O2 at 0.5 MPa. In addition, Li and colleagues [26] studied the impulse insulation characteristics of dry air according to gas pressure, and the results show that a 50% breakdown voltage of dry air is approximately three times lower than that of SF6 at the same pressure. In contrast, studies for partial discharge characteristics of g3 and dry air are relatively insufficient.
The studies for PD characteristics of g3 were recently performed due to its good insulation performance and low GWP. Li and colleagues [27] measured PDIVs depending on mixing ratios compared to SF6, and the results show that the PDIV increases linearly with the NOVECTM 4710 content in the range of 2 to 8%. Zhang and colleagues [28] analyzed the PDIVs and PRPD patterns depending on mixing ratios and gas pressures, and the result shows that g3 with 15% NOVECTM 4710 has almost the same PDIVs as SF6 at 100 kPa, and PDs of g3 with 20% NOVECTM 4710 are less than that of SF6, whereas its magnitude is slightly higher than that of SF6. In the case of dry air, more studies have been conducted on its PD characteristics for the past 20 years. However, most studies are for gas mixtures with other insulation gases and, even in the case of pure dry air, it is not for high-voltage power apparatus, but for medium-voltage power apparatus. Some studies were recently started for a high-voltage GIS. Kim and colleagues [29] analyzed a PD signal measured by an ultra-high frequency (UHF) sensor to confirm if there is any differences in the sensitivity of dry air and SF6 at the same condition, and the results show an existing UHF sensor can be used to detect PD signals in dry air.
Although many studies were carried out for the breakdown characteristics of g3 and dry air, few studies were performed on their partial discharge (PD) characteristics. In addition, most studies of PD characteristics focus on the PDIVs depending on mixing ratios and gas pressures. However, it is more important for on-site engineers to confirm whether a PD occurs or not, and how much the discharge magnitude in pC is in a GIS. Once a PD occurs, it causes the progressive deterioration of insulation materials, and finally results in GIS failure [3,4,30,31]. For this reason, PD characteristics such as PDIV, single PD pulse in time and frequency domains, and phase-resolved partial discharge (PRPD) in g3 and dry air were investigated in this paper, to understand how useful they are for determining whether a PD occurs or not. Furthermore, an UHF sensor used to measure a PD signal cannot be calibrated in pC owing to the complex PD pulse propagation characteristics [32,33]. Therefore, the correlation between the output value in mV measured using the UHF sensor and the apparent charge in pC measured using the conventional method according to IEC 60270 [34] was analyzed.

2. PD Electrode System

PD activity is an indication of incipient insulation breakdown, because it is produced by various insulation defects in GIS during commissioning or in service before insulation breakdown occurs. For this reason, it is very important to detect PD signals before a GIS fails. Figure 1 shows the typical types of PD defects that occur in GISs. Metallic particles may exist inside GIS compartments despite all the precautions taken during the processes of manufacturing, installing, and operating the GIS. When a high electric field is concentrated around the particle, it can move under the influence of the electric field. PD signals generated by the FMP are relatively easy to detect. The PDIV depends on its shape and size. Protrusions may occur on the conductor or enclosure in GIS during the manufacturing process or switching operation. The rounded protrusion makes it very difficult to detect PD signals due to the small differences between the PDIV and breakdown voltage. Sharp protrusions are relatively easily detectable due to the sufficient differences between the PDIV and breakdown voltage. The PDIV depends on the length. Voids may be made by air bubbles formed during the process of curing the epoxy at a high temperature. Voids in a spacer are usually filled with a low-pressure gas mixture. When an electric field is concentrated on the void over the discharge inception voltage, the first free electron becomes available. Once the electric field is sufficient, PD occurs through electron avalanches. The PDIV depends on the size. When the diameter of the void is less than 1 mm, it is not easy to detect PD signals due to the very low apparent charge of less than 10 pC. Floating faults are caused by incorrectly fixed or unscrewed elements, and may loosen their contact with the conductor. When the withstand voltage between the high-voltage electrode and the floating elements exceeds the insulation strength, a PD occurs.
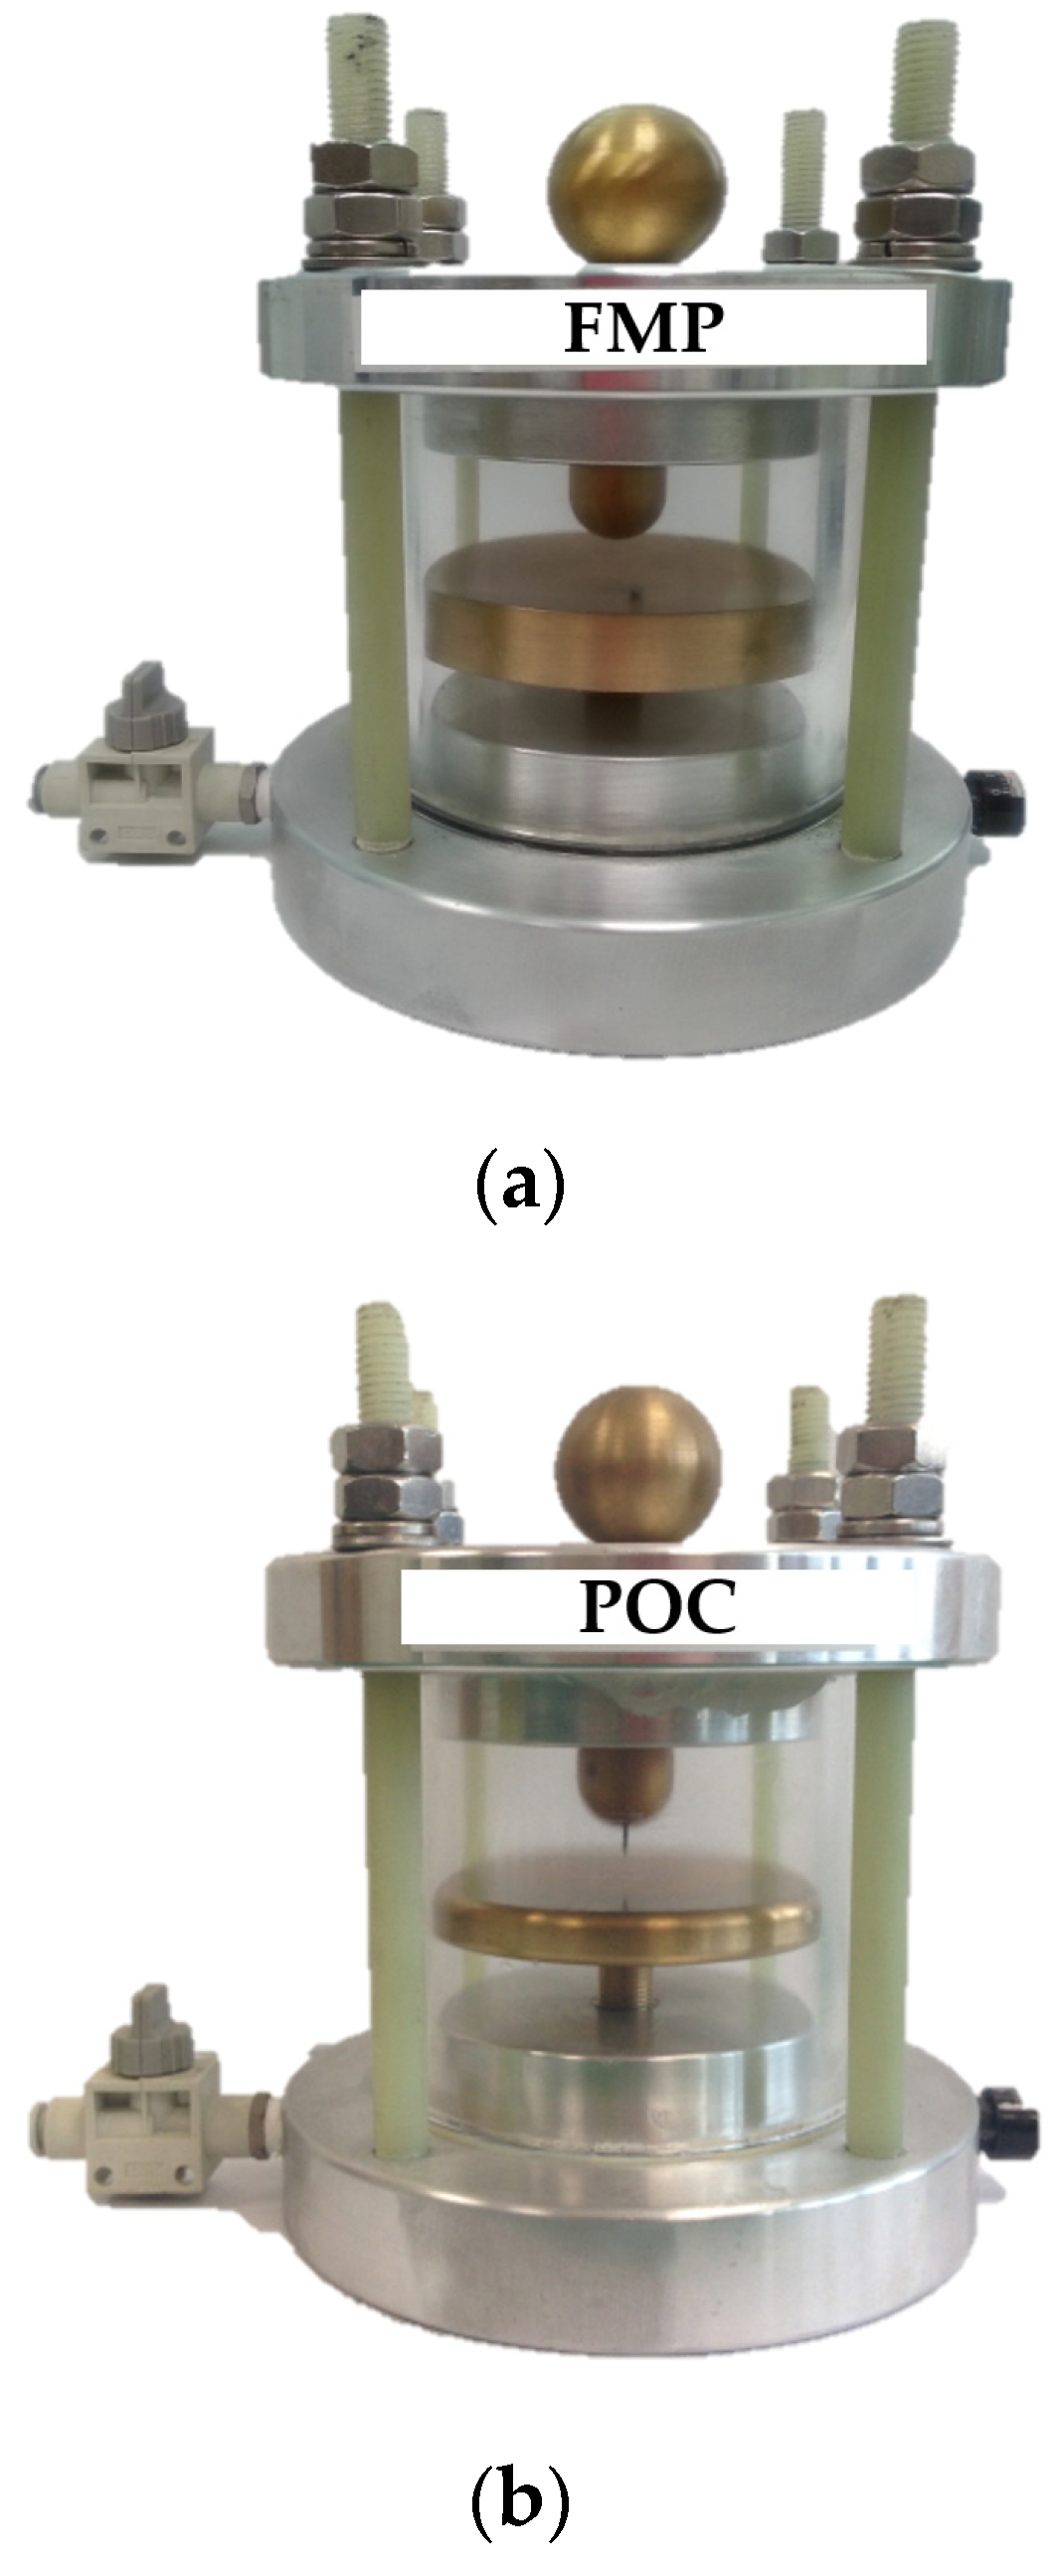
Figure 2 shows the PD electrode systems of the POC and FMP. The FMP is composed of a sphere electrode with a curvature radius of 10 mm as a high-voltage conductor and a concave plane electrode as an enclosure of a gas-insulated acrylic chamber. The distance between the sphere electrode and concave plane electrode is 20 mm. A sphere-type particle with a diameter of 2 mm was used to simulate the defect of a moving particle in the enclosure of the GIS. The POC consists of a needle electrode with a curvature radius of 10 μm and a plane electrode made of a tungsten–copper alloy with a diameter of 80 mm and a thickness of 20 mm. To prevent the concentration of the electric field, the edges of the plane electrodes were rounded, and a spherical conductor with a diameter of 25 mm was installed to avoid electric field concentration adjacent to the high-voltage connection. Each insulation gas was filled in the PD electrode systems from 0.1 to 0.5 MPa.

3. Experiment and Method

Figure 3 presents the experimental setup used in this paper. The high voltage was applied by an oil-immersed transformer up to 20 kV and 30 mA. The transformer was controlled by the AC regulator. The SF6, g3 (5% NOVECTM 4710/CO2/O2) or dry air was filled from 0.1 to 0.5 MPa in the PD electrode systems. Each gas was injected and emitted repeatedly to prevent any pollution of gas. The PD signal was measured with the conventional method using a coupling capacitor and PD measuring device (MPD 600, Omicron corporation, Klaus, OR, Austria) with a frequency range of less than 1 MHz and a UHF sensor (GM-500, Hyosung Corporation, Changwon, Gyeongsangnam-do, Korea) with a frequency range of 100 MHz to 2000 MHz. The output of the UHF sensor was recorded using OSC (MSO 5204B, Tektronix, Beaverton, OR, USA) with a sampling rate of 10 GS/s. To simulate the actual GIS conditions, a mock-up GIS chamber was fabricated. Each PD electrode system was placed inside the GIS chamber and a UHF sensor was installed on the GIS window. The background noise level was found to be less than 2 pC (measured by the conventional method) and 1 mV (measured by the UHF sensor), respectively, in the experiment.
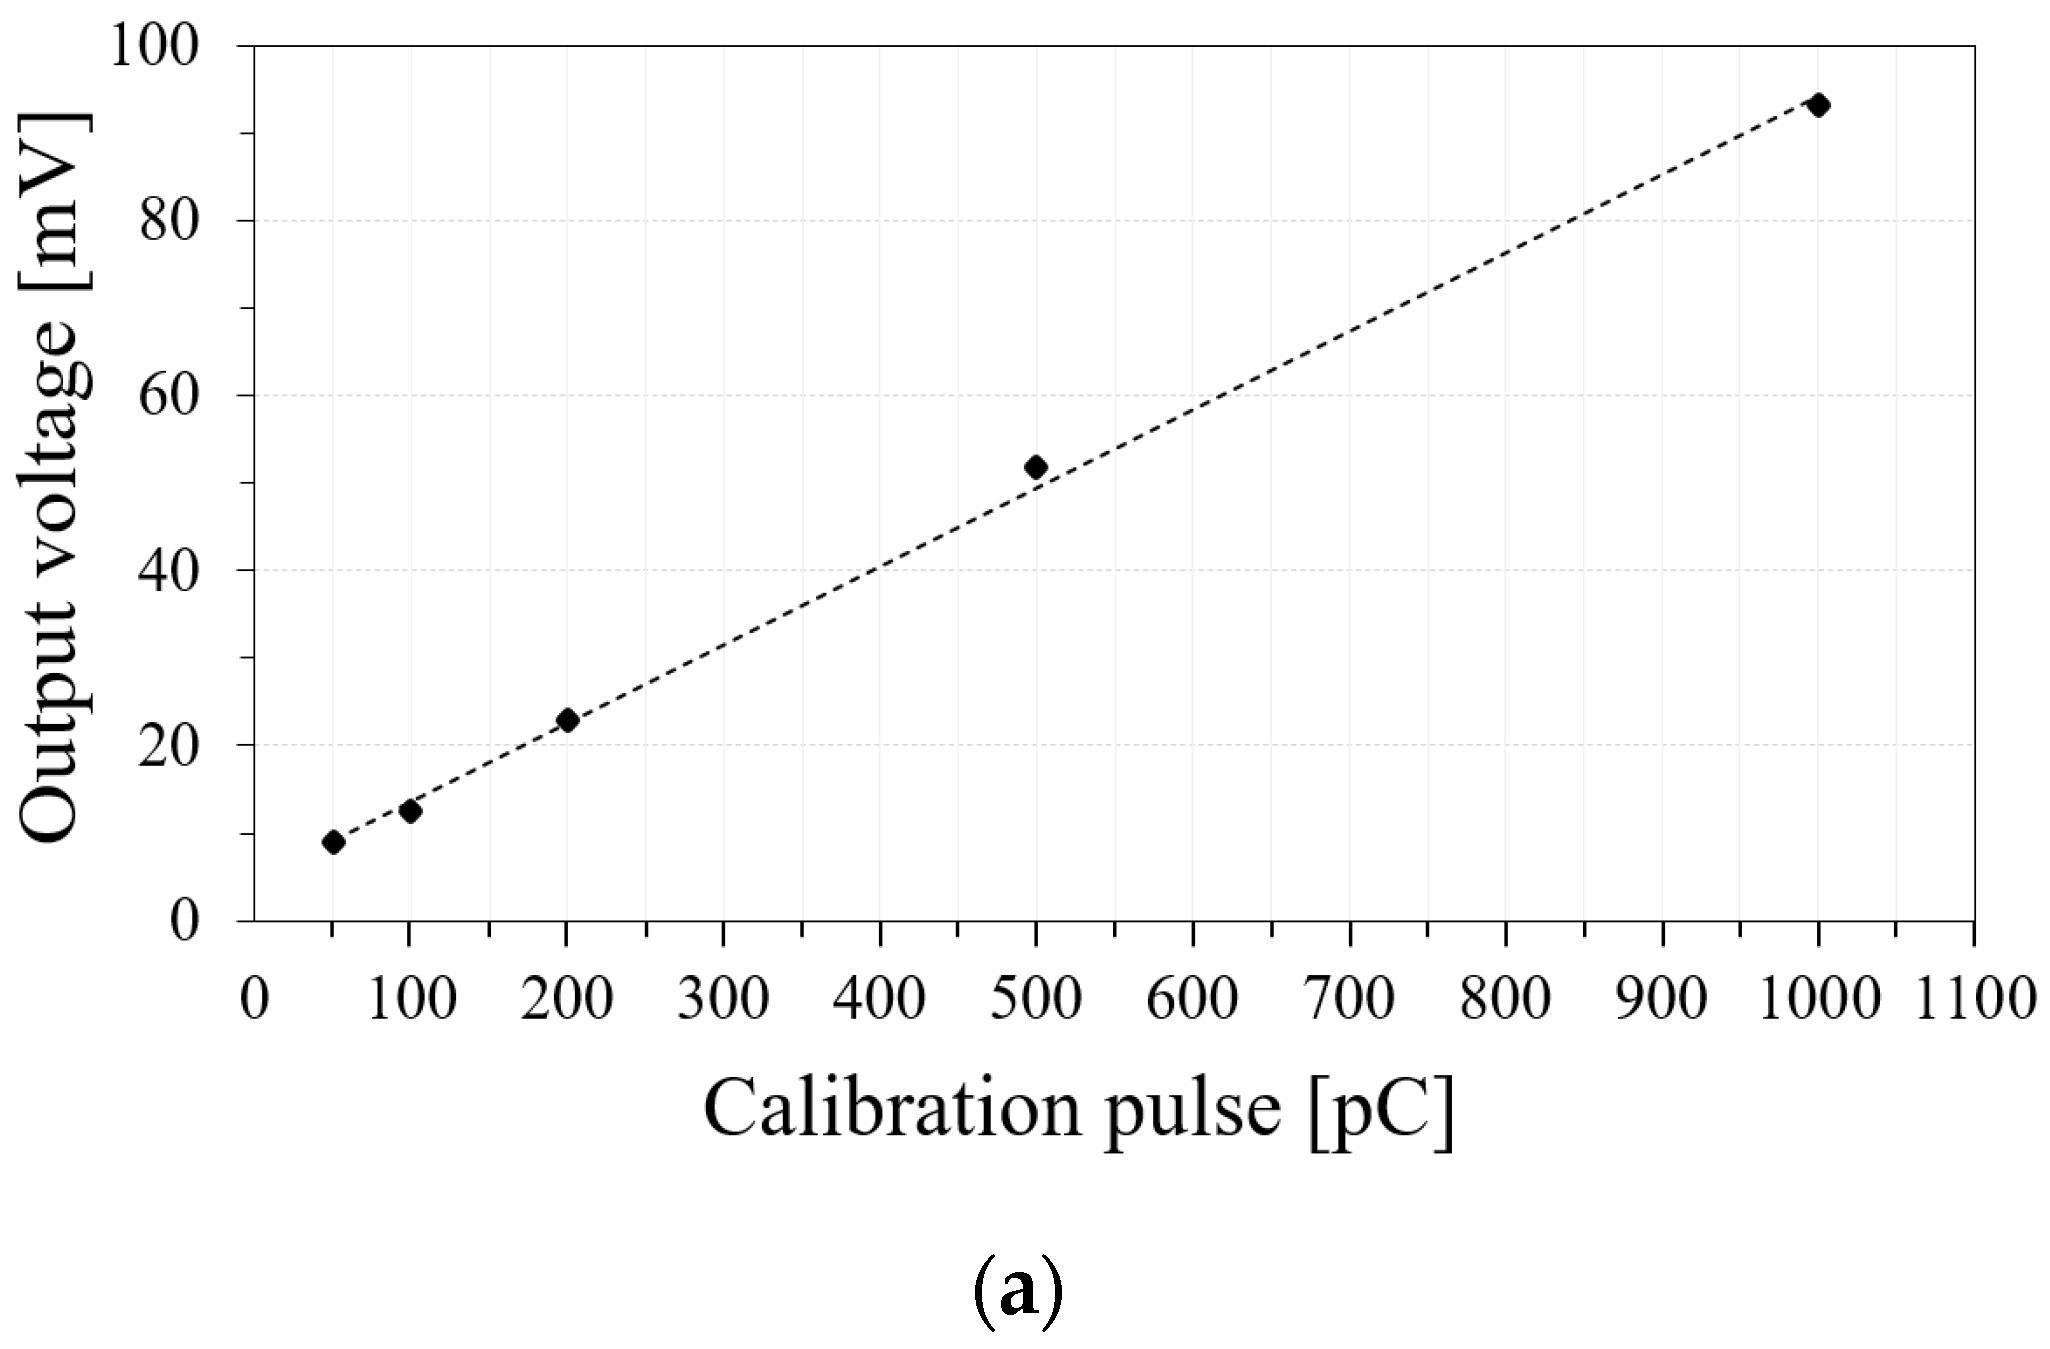
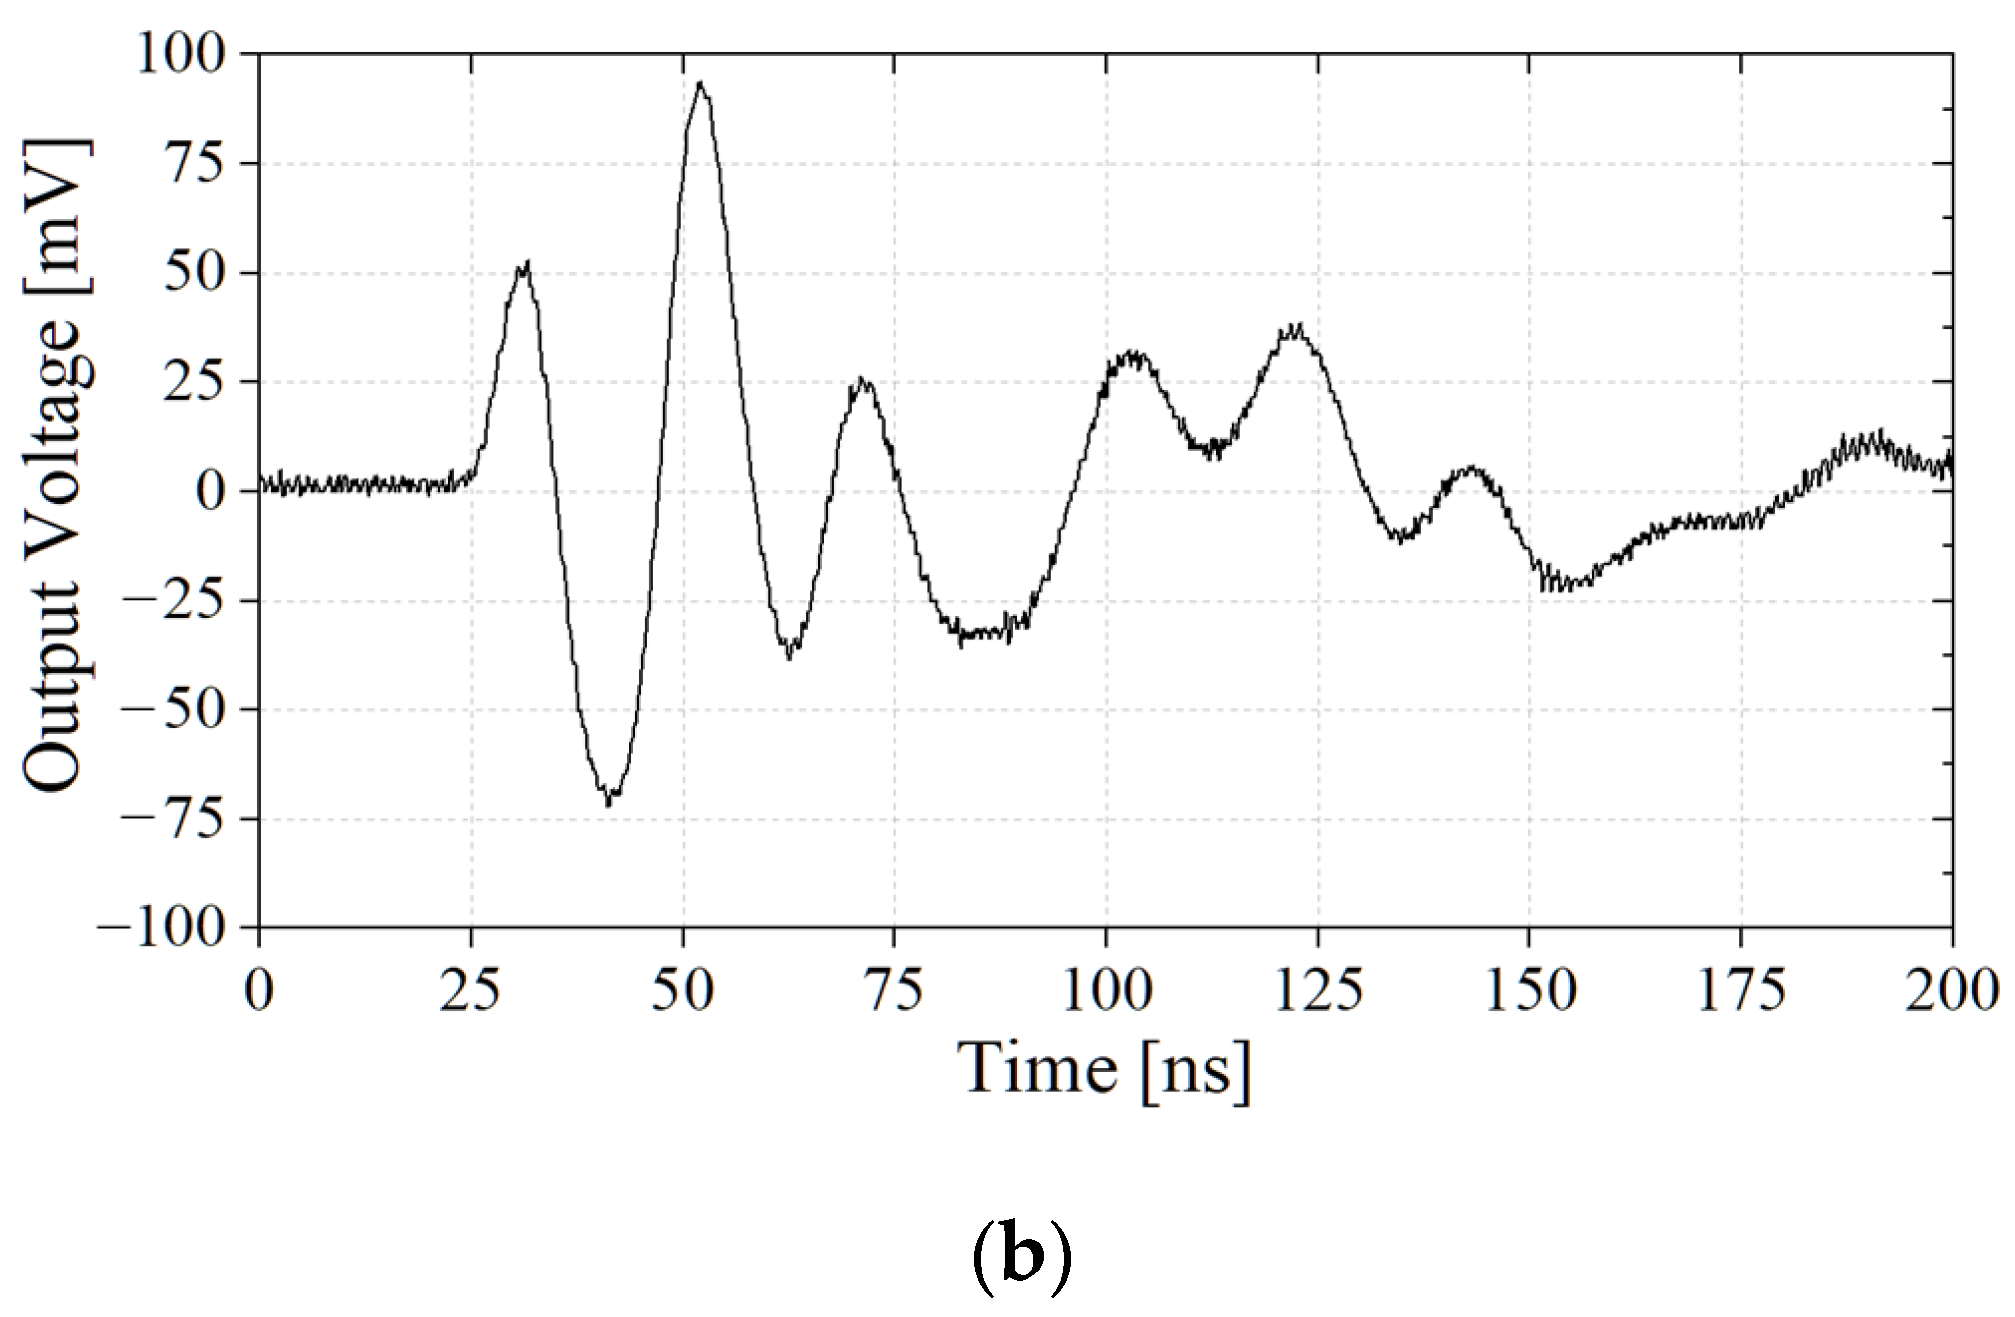
An artificial calibration pulse with a rise time of tens of ns was injected into the experimental system to evaluate the linearity of the UHF sensor using a calibrator (CAL 542, Omicron corporation, Klaus, OR, Austria). The electromagnetic wave was produced by a calibration pulse with an apparent charge, and the signal propagated through the experimental system was measured by the UHF sensor. Figure 4a shows the maximum output voltage of the UHF sensor in accordance with the calibration pulse signals with an apparent charge of 10 pC to 1000 pC. From the result of the calibration test, the output voltage of the UHF sensor increases linearly. Figure 4b presents an example of the output waveform of 1000 pC.
The PDIV is the lowest voltage at which a partial discharge occurs with a magnitude over 10 pC o when the applied voltage is gradually increased. The PDIVs were recorded 5 times to calculate its average value. The PD pulse and PRPD pattern were analyzed under the same applied voltage. PRPD patterns were analyzed with the magnitude, count, and phase of PD pulses. In addition, the correlation between the apparent charge in pC measured by the conventional method and the output voltage in mV measured by the UHF method was investigated for the POC and FMP.

4. Result and Discussion

4.1. Partial Discharge Inception Voltage (PDIV)

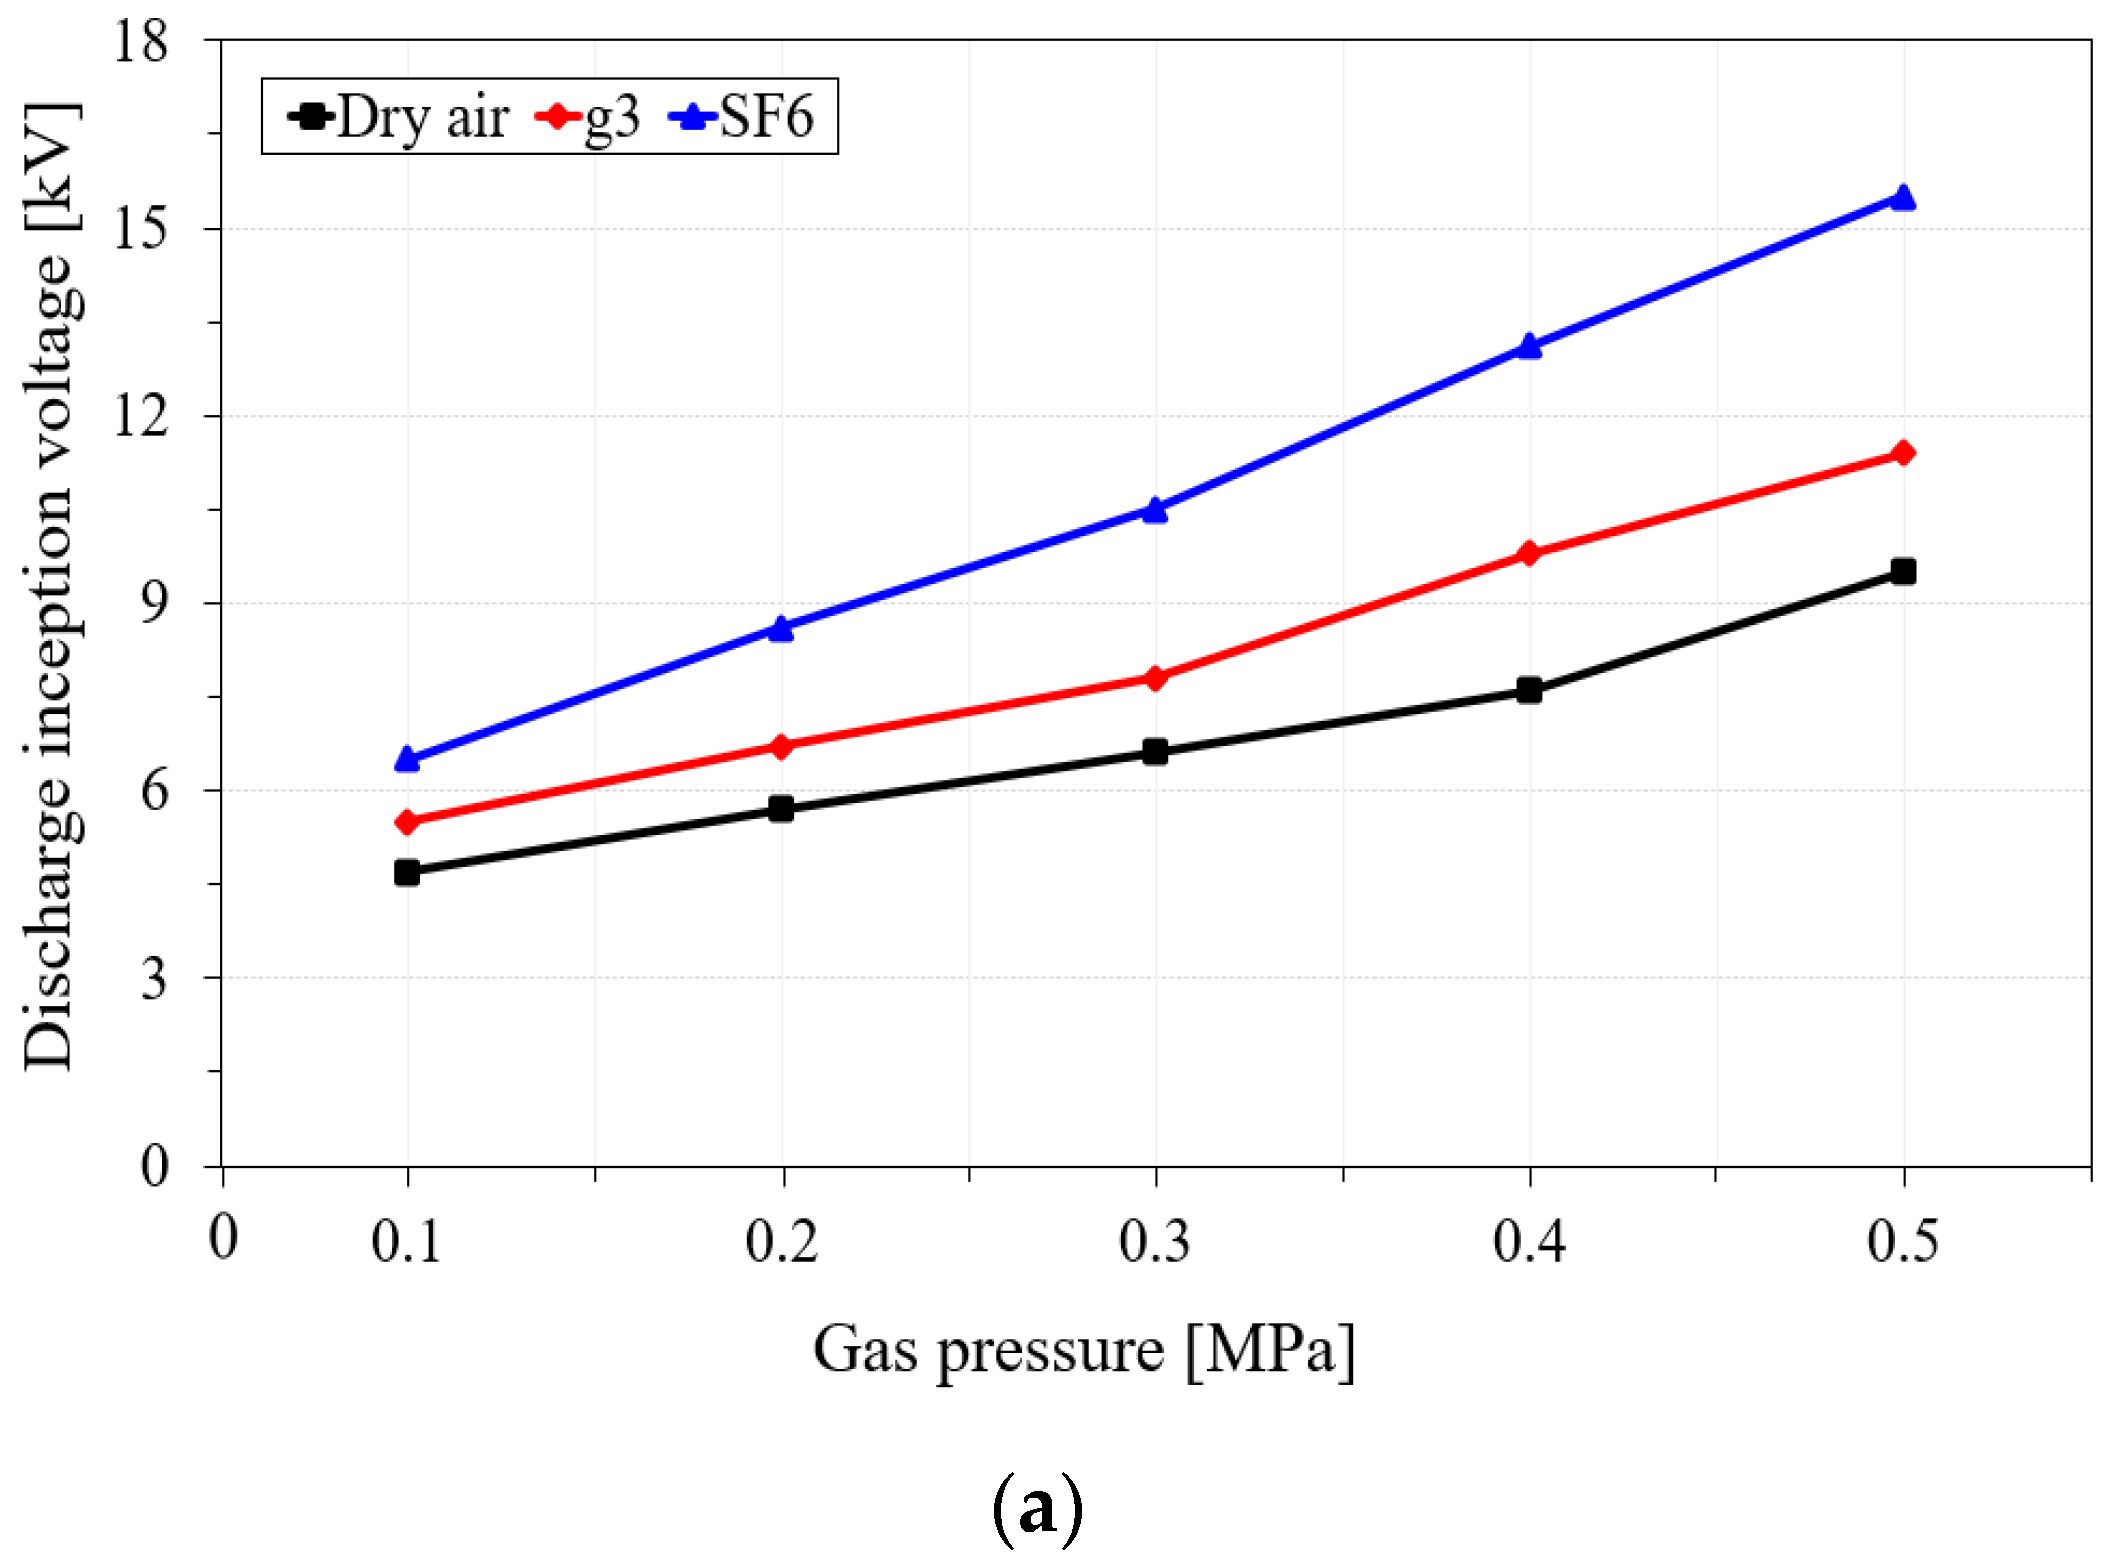
Figure 5 shows the PDIVs of g3 and dry air compared to SF6 in the two types of PD defects from 0.1 to 0.5 MPa. It is seen that PDIVs increase almost linearly with the gas pressure in two types of PD defects. PDIVs of g3 and dry air are about 74–84% and 58–72%, respectively, that of SF6 and about 90–96% and 80–93% that of SF6 in terms of the same gas pressure in the POC and FMP, respectively. In addition, the PDIVs in g3 at 0.4 MPa and dry air at 0.5 MPa are equivalent to SF6 at 0.2 MPa in POC, and the PDIVs in g3 at 0.4 MPa and dry air at 0.5 MPa are equivalent to SF6 at 0.3 MPa in FMP. From the results in terms of PDIV, an increase in gas pressure is required when the g3 or dry air is used to replace SF6.

4.2. Pulse in Time and Frequency Domains

Figure 6 shows typical single PD pulses measured by the UHF sensor at the same applied voltage and its fast Fourier transform (FFT) in the POC and FMP, respectively. The PD pulse was analyzed in g3 and dry air based on parameters such as rising time, falling time, and pulse width compared to SF6. The parameters were defined as: the rising time is the time period from 10% to 90% of maximum value, the falling time is the time period from 90% to 10% of maximum value, and pulse width is the time interval between 50% of maximum value. Table 1 shows the parameters of each signal pulse according to the types of PD defects, and 10 single pulses were measured to calculate average values. It can be observed from the results that the rising time, falling time, and pulse width of pulses in g3 and dry air are relatively longer than those in SF6. However, it is seen that there are no clear differences among them. While the frequency ranges of pulses in all types of gases are similar, the relative amplitude of FFT in dry air is greater than that in g3, and the relative amplitude of FFT in SF6 is much less than that in dry air and g3. The reason why this result is found is due to the remarkable discharge stabilization effect, because discharge is suppressed by the electronegativity of SF6 and develops easily by the great effective ionization coefficient of dry air and g3 compared to that of SF6 [4,28,35,36].

4.3. Phase-Resolved Partial Discharge (PRPD)

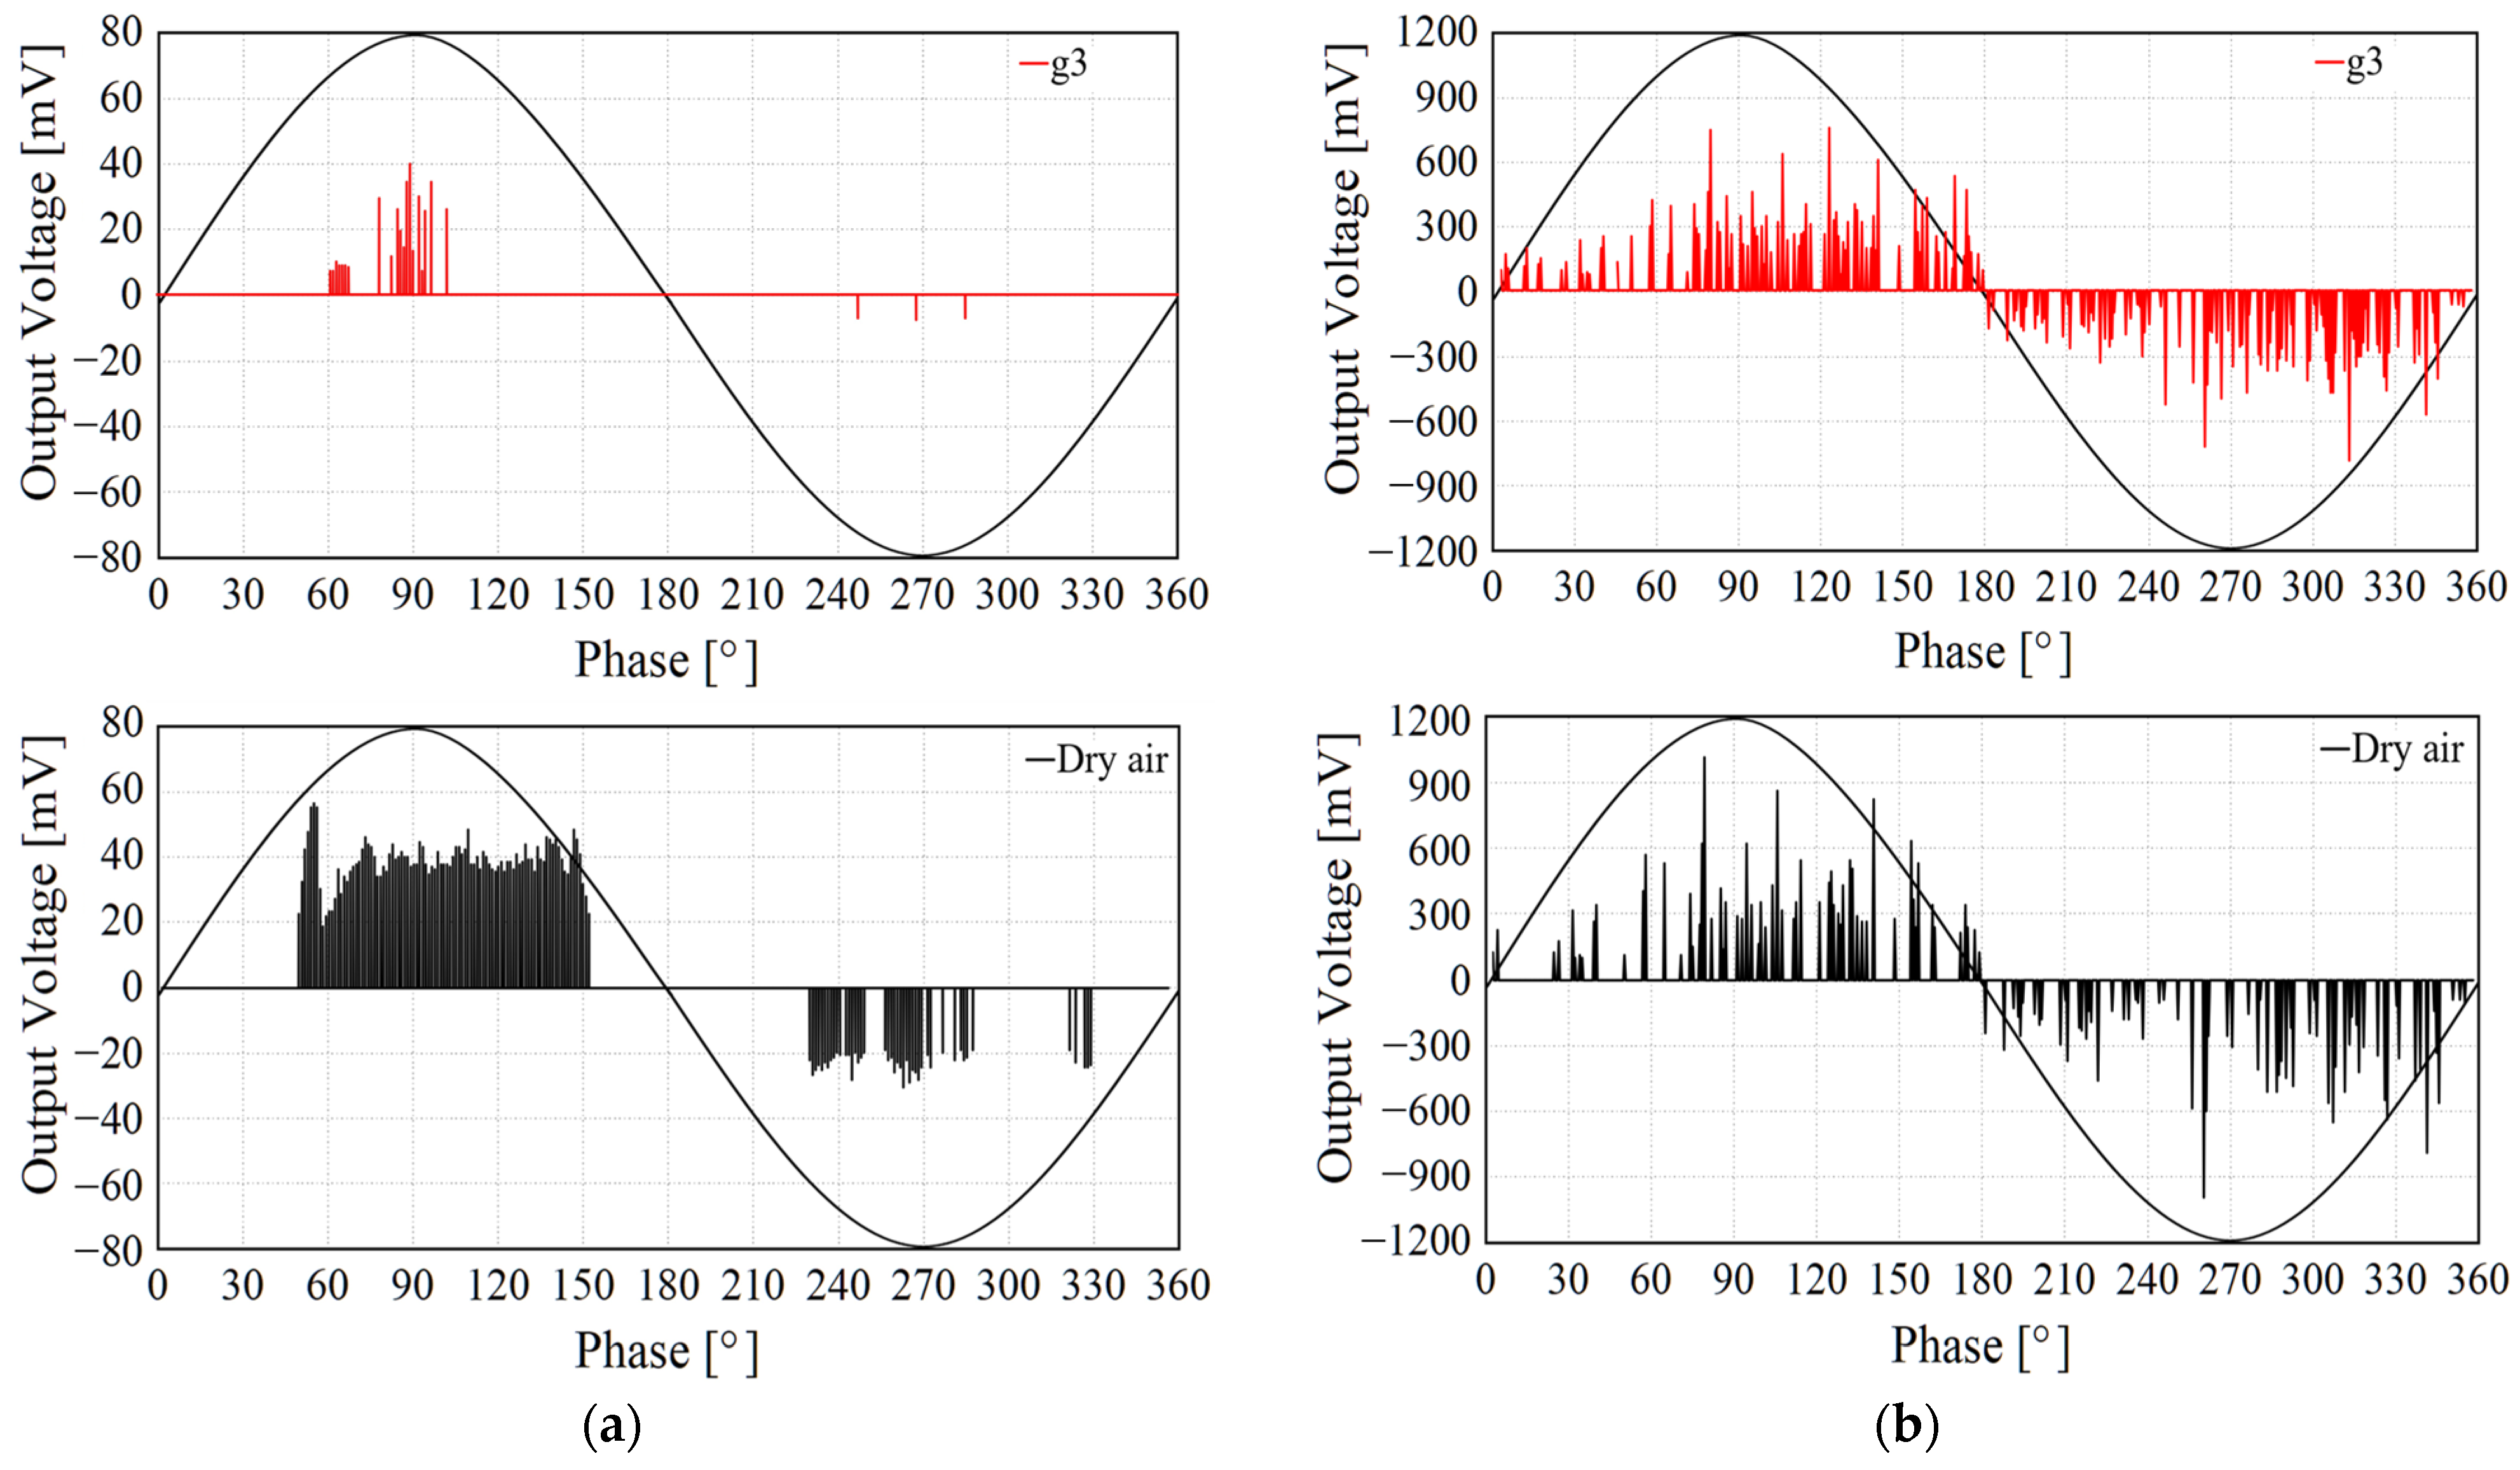
PRPD patterns are analyzed in accordance with types of PD defects in SF6, g3, and dry air at the same applied voltage in Figure 7. In the POC, the ranges of phase angles at which the discharge pulse occur are 70° to 88° and 258° to 276° in SF6, 61° to 107° and 247° to 285° in g3, and 49° to 153° and 234° to 332° in dry air. In the FMP, the discharge pulse occurs at the phase angle of 0° to 360°, regardless of the gas type. The average output voltage and the pulse count are shown in Table 2. The average output voltage of g3 and dry air are approximately 1.2 times and 1.5 times higher than that of SF6, respectively, in the POC, whereas there is little difference between them in the FMP. The pulse count of g3 and dry air are approximately 1.8 times and 71.5 times higher than that of SF6 in the POC and 1.4 times and 1.5 times higher than that of SF6 in the FMP, respectively.

4.4. Correlation between the Output Voltage and Apparent Charge

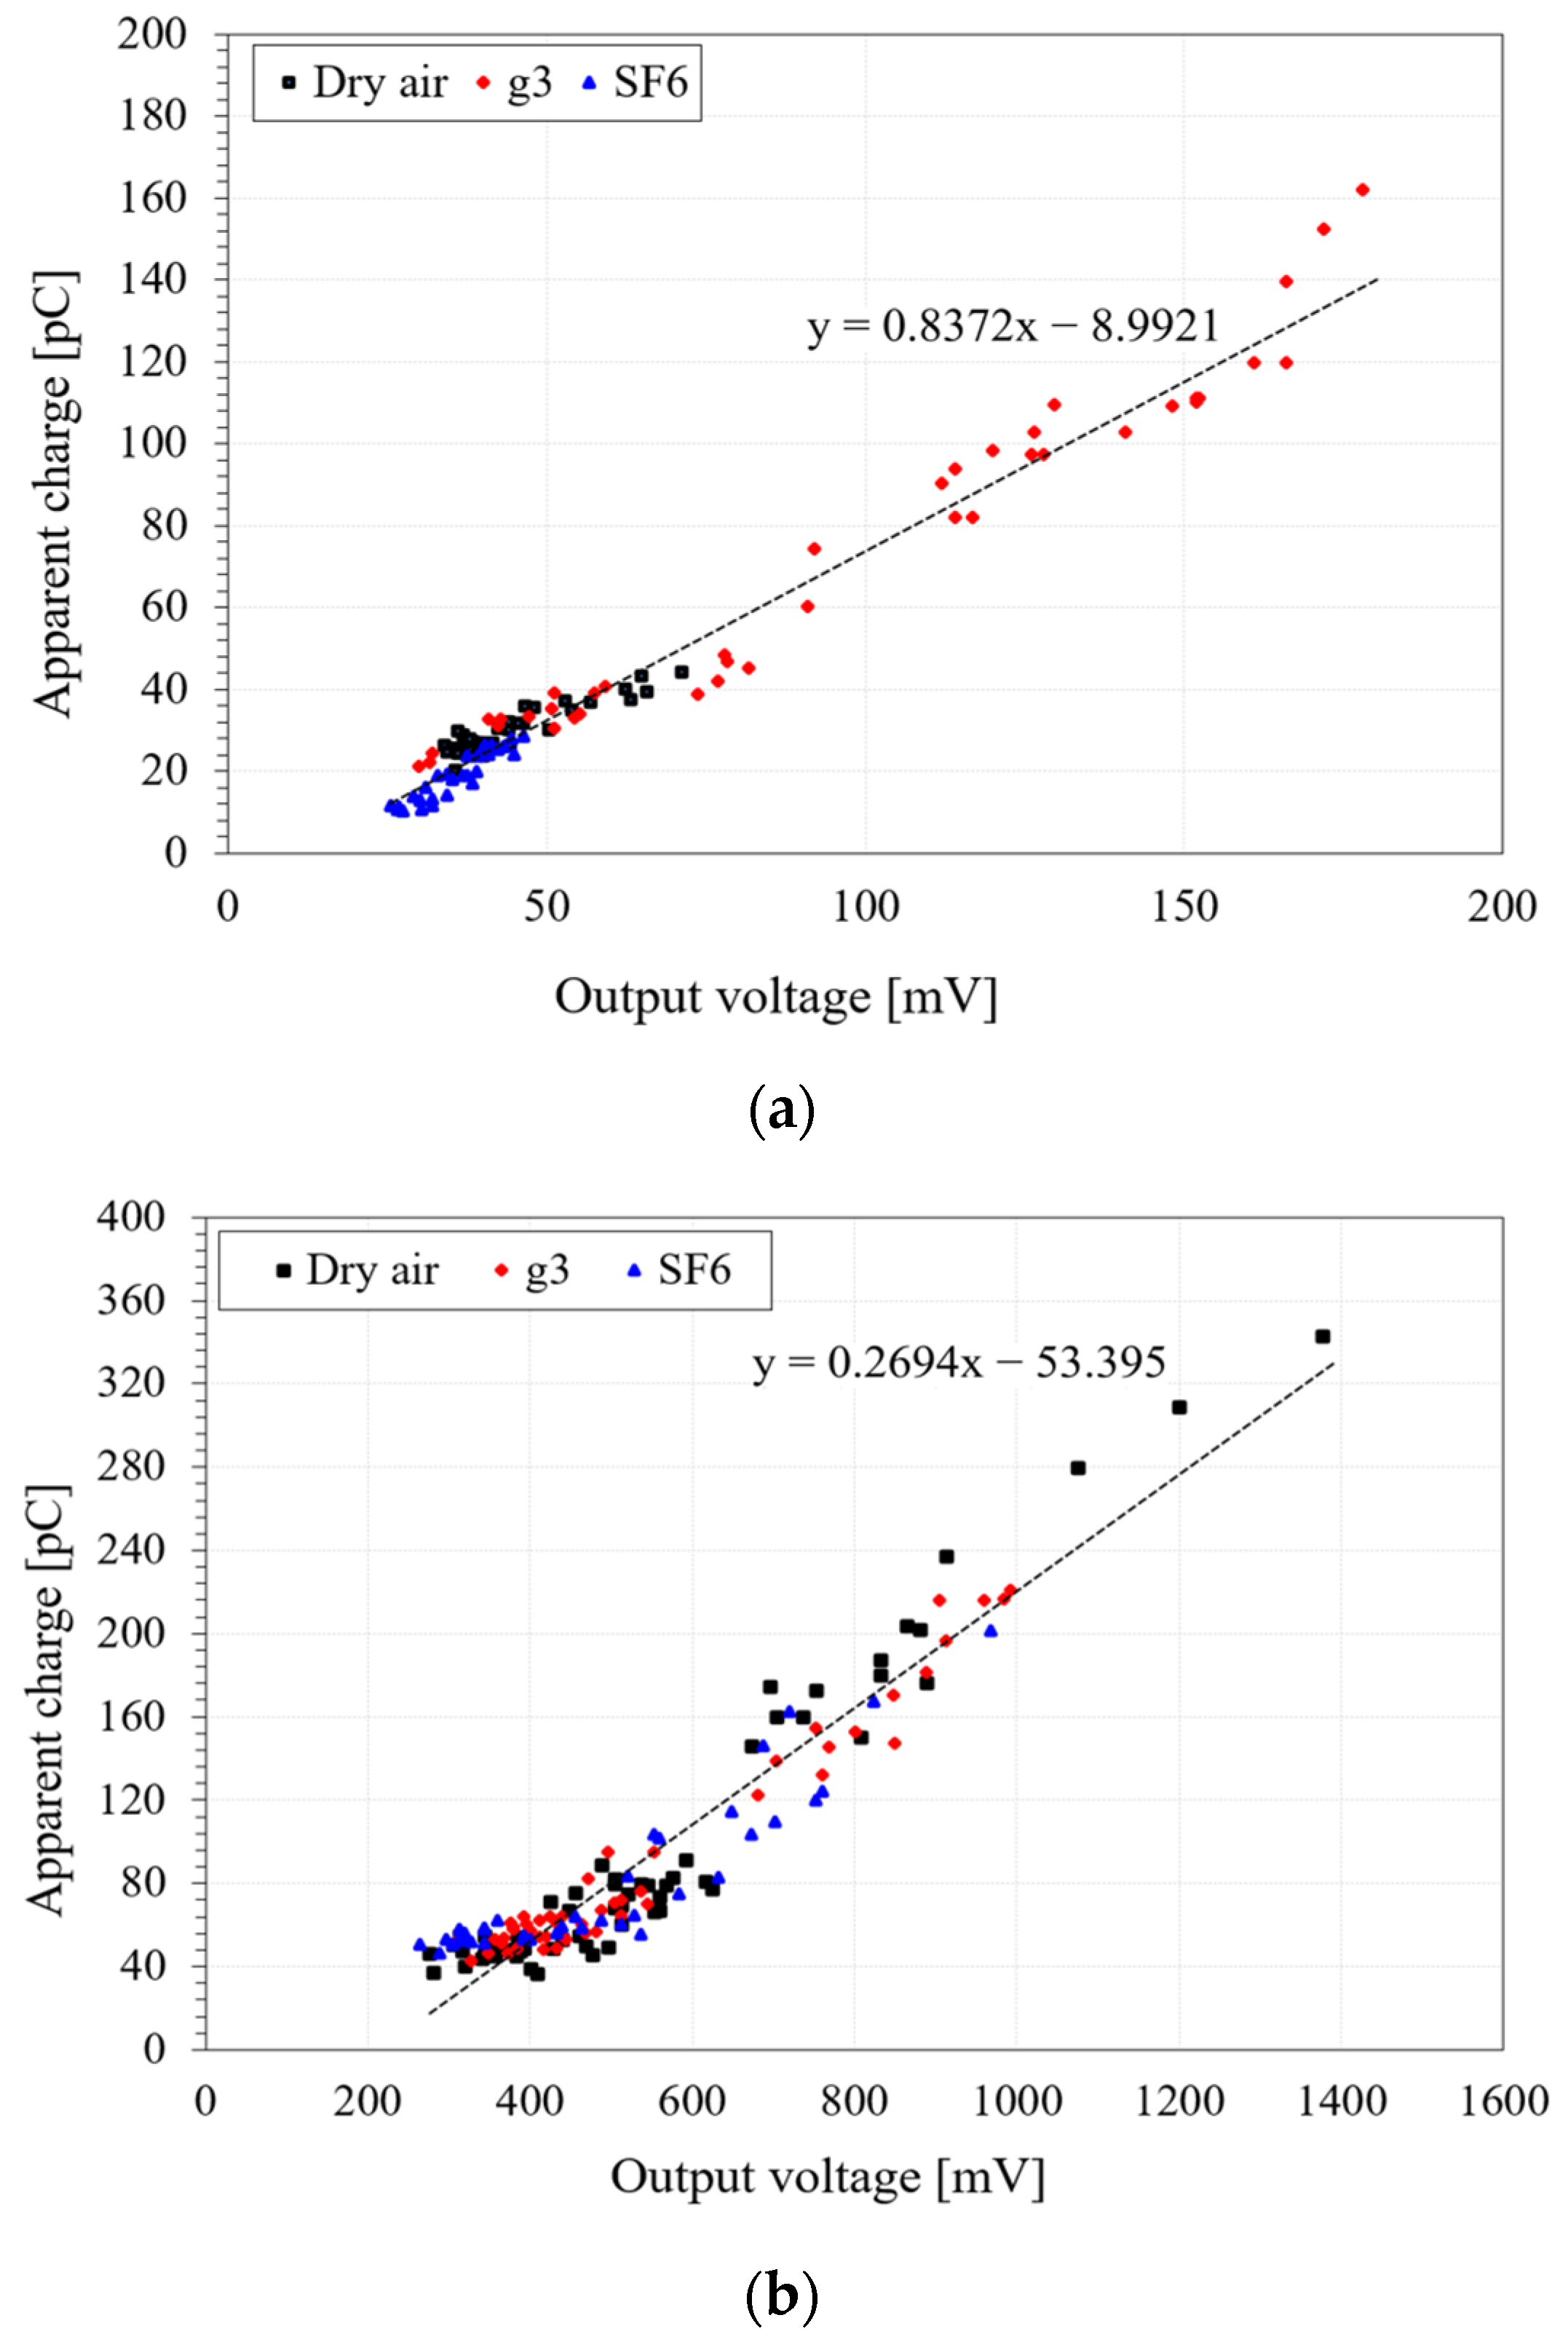
In the PD measurement for GIS, a PD value is required to indicate the apparent charge in pC by the conventional method specified in IEC 60270. However, it is very difficult to apply to a high-voltage GIS in service. For this reason, UHF sensors are installed to detect PD defects for continuous condition monitoring of GISs. Therefore, it is necessary to analyze the correlation between the output voltage in mV and the apparent charge in pC because the UHF method cannot be calibrated in pC. Figure 8 shows the correlation between the output voltage in mV and the apparent charge in pC according to the types of PD defects in each gas when the applied voltage increases. It can be seen that the output voltage of the UHF sensor increases linearly in accordance with the discharge magnitude, regardless of the gas type. From the results, the correlation equation according to POC and FMP was used to convert the output voltage into the apparent charge shown in Figure 8.

5. Conclusions

g3 and dry air are employed in GISs as the most popular substitutes for SF6 owing to their high dielectric strength and low GWP (that of dry air is zero), and replacing SF6 can reduce the greenhouse effect significantly. Therefore, many studies have been performed on their insulation breakdown characteristics depending on gas pressure or mixing ratios. In contrast, few studies for their PD characteristics have been conducted, even though it is an indicator at the early stage before insulation breakdown occurs. In addition, studies of PD characteristics focus on PDIVs depending on the gas pressure. However, in terms of condition monitoring for on-site engineers, determining the PD occurrence and its magnitude in pC are the most important tasks for predictive maintenance and inspection. Therefore, the PD characteristics of the use of g3 and dry air in GISs were investigated in this paper, to understand their usefulness in determining the PD occurrence and its magnitude in pC. The summary of the experimental results is as follows:
  • PDIV
    The PDIVs of g3 and dry air are approximately 74–84% and 58–72%, respectively, those of SF6 and about 90–96% and 80–93% those of SF6 in terms of the same gas pressure in the POC and FMP, respectively. In addition, the PDIVs in g3 at 0.4 MPa and dry air at 0.5 MPa are equivalent to those of SF6 at 0.2 MPa in POC, while the PDIVs in g3 at 0.4 MPa and dry air at 0.5 MPa are equivalent to those of SF6 at 0.3 MPa in FMP.
  • Pulse in time and frequency domains
    The rising time, falling time, and pulse width of pulses in g3 and dry air are relatively longer than those in SF6. However, it is seen that there are no significant differences according to the gas type. Although the frequency ranges of pulses in all types of gases are similar, the relative amplitude of FFT in dry air is greater than that in g3, and the least in SF6.
  • PRPD
    In the POC, the discharge pulse occurs at the phase angles of 70° to 88° and 258° to 276° in SF6, 61° to 107° and 247° to 285° in g3, and 49° to 153° and 234° to 332° in dry air. In the FMP, the discharge pulse occurs at the phase angle of 0° to 360°, regardless of the gas type. The average output voltage and the pulse count in dry air are greater than those in g3, and the least in SF6. Especially in POC, it is observed that the pulse count in dry air is much higher than that of g3 and SF6.
  • Correlation between output voltage in mV and apparent charge in pC
    The correlation between the output voltage in mV and the apparent charge in pC was analyzed according to types of PD defects in each gas when the applied voltage increased. From the results, the output voltage of the UHF sensor increases linearly in accordance with the discharge magnitude, regardless of the gas type in the POC and FMP.
The results found in this paper are expected to be used as useful reference material for the diagnosis of defects in eco-friendly gas-insulated power equipment. However, there is still plenty of work required to precisely analyze PD characteristics of g3 and dry air, since the results in this paper are limited for specific types of PD defects and there are a lot of other parameters affecting the PD occurrence in GIS. Based on these considerations, additional PD characteristics depending on various parameters for types of PD defects, such as voids, floating, particles on spacers, and cracks, should be investigated, and further studies on identifying types of PD defects and locating PD sources in g3 and dry air should be conducted in future work.

Author Contributions

G.-C.S. and S.-W.K. designed and conducted the experiments; G.-C.S. generated the raw data and S.-W.K. analyzed the data; G.-C.S. wrote the paper and S.-W.K. and G.-S.K. revised the paper; G.-S.K. provided the general guidance of this work and managed safety considerations of high-voltage experiment. All authors have read and agreed to the published version of the manuscript.

Funding

The following are results of a study on the “Leaders in Industry-university Cooperation 3.0” project, supported by the Ministry of Education and National Research Foundation of Korea. Its grant number is 1345356149.

Conflicts of Interest

The authors declare no conflict of interest.

References

  1. Widger, P.; Haddad, A. Evaluation of SF6 leakage from gas insulated equipment on electricity networks in 200 Great Britain. Energies 2018, 11, 2037. [Google Scholar] [CrossRef]
  2. Wang, G.M.; Kil, G.S. Measurement and analysis of partial discharge using an ultra-high frequency sensor 202 for gas insulated structures. Metrol. Meas. Syst. 2017, 24, 515–524. [Google Scholar] [CrossRef]
  3. Kim, S.W.; Jung, J.R.; Kim, Y.M.; Kil, G.S.; Wang, G. New diagnosis method of unknown phase-shifted PD signals for gas insulated switchgears. IEEE Trans. Dielectr. Electr. Insul. 2018, 25, 102–109. [Google Scholar] [CrossRef]
  4. Beroual, A.; Haddad, A. Recent advances in the quest for a new insulation gas with a low impact on the environment to replace sulfur hexafluoride (SF6) gas in high-voltage power network applications. Energies 2017, 10, 1216. [Google Scholar] [CrossRef]
  5. Wang, G.M.; Kim, W.H.; Kil, G.S.; Kim, S.W.; Jung, J.R. Green Gas for Grid as an Eco-Friendly Alternative Insulation Gas to SF6: From the Perspective of Partial Discharge under AC. Appl. Sci. 2019, 9, 651. [Google Scholar] [CrossRef]
  6. Kim, S.W.; Kim, N.H.; Kim, D.E.; Kim, T.H.; Jeong, D.H.; Chung, Y.H.; Kil, G.S. Experimental Validation for Moving Particle Detection Using Acoustic Emission Method. Energies 2021, 14, 8516. [Google Scholar] [CrossRef]
  7. Akram, S.; Castellon, J.; Agnel, S. Progress in Gas/Solid Interface Charging Phenomena. Coatings 2020, 10, 1184. [Google Scholar] [CrossRef]
  8. Intergovernmental Panel on Climate Change. Climate Change 2013; Cambridge University Press: New York, NY, USA, 2013; pp. 159–254. [Google Scholar]
  9. Kieffel, Y.; Biquez, F.; Ponchon, P. Alternative Gas to SF6 for use in High Voltage Switchgears: g3. In Proceedings of the 23rd International Conference on Electricity Distribution, Lyon, France, 15–18 June 2015; pp. 1–5. [Google Scholar]
  10. United Nations. Kyoto Protocol to the United Nations Framework Convention on Climate Change; United Nations: New York, NY, USA, 1998. [Google Scholar]
  11. United Nations. Paris Agreement to the United Nations Framework Convention on Climate Change; United Nations: New York, NY, USA, 2015. [Google Scholar]
  12. Uchii, T. Fundamental Research on SF6-Free Gas Insulated Switchgear Adopting CO2 Gas and Its Mixtures. In Proceedings of the International Symposium on Eco Topia Science ISETSO7, Nagoya, Japan, 23–25 November 2007. [Google Scholar]
  13. Stoller, P. CO2 as an Arc Interruption Medium in Gas Circuit Breakers. IEEE Trans Plasma Sci. 2013, 41, 2359. [Google Scholar] [CrossRef]
  14. Rokunohe, T.; Yagihashi, Y.; Endo, F.; Oomori, T. Fundamental Insulation Characteristics of Air, N2, CO2, N2/O2 and SF6/N2 Mixed Gases. IEEE Trans. Power Energy 2005, 125, 619–625. [Google Scholar] [CrossRef]
  15. Okubo, H.; Beroual, A. Recent trend and future perspectives in electrical insulation techniques in relation to sulfur hexafluoride (SF6) substitutes for high voltage electric power equipment. IEEE Electr. Insul. Mag. 2011, 27, 34–42. [Google Scholar] [CrossRef]
  16. Western Power Distribution. SF6 Alternatives—A Literature Review on SF6 Gas Alternatives for Use on the Distribution Network; Western Power Distribution: Wales, UK, 2018; pp. 6–39. [Google Scholar]
  17. Hama, H.; Okabe, S. CIGRE WG C4.302; Insulation Co-ordination Related to Internal Insulation of Gas Insulated Systems with SF6 and N2/SF6 Gas Mixtures under AC Conditions. Institute of High Voltage Engineering and System Performance: Paris, France, 2008.
  18. Hernández, J.L.; Basurto, E.; De Urquijo, J. Electron transport and swarm parameters in CO2 and its mixtures with SF6. J. Phys. D Appl. Phys. 2002, 35, 2264. [Google Scholar] [CrossRef]
  19. Lee, A.; Frost, L.S. Interruption Capability of Gases and Gas Mixtures in a Puffer-Type Interrupter. Plasma Sci. IEEE Trans. 1980, 8, 362–367. [Google Scholar] [CrossRef]
  20. Zhao, H.; Li, X.; Tang, N.; Jiang, X.; Guo, Z.; Lin, H. Dielectric properties of fluoronitriles/CO2 and SF6/N2 mixtures as a possible SF6-substitute gas. IEEE Trans. Dielectr. Electr. Insul. 2018, 25, 1332–1339. [Google Scholar] [CrossRef]
  21. Chen, L.; Widger, P.; Kamarudin, M.S.; Griffiths, H.; Haddad, A. CF3I gas mixtures: Breakdown characteristics and potential for electrical insulation. IEEE Trans. Power Deliv. 2017, 32, 1089–1097. [Google Scholar] [CrossRef]
  22. Chachereau, A.; Rabie, M.; Franck, C.M. Electron swarm parameters of the hydrofluoroolefine HFO1234ze. Plasma Sources Sci. Technol. 2016, 25, 045005. [Google Scholar] [CrossRef]
  23. Nechmi, H.E.; Beroual, A.; Girodet, A.; Vinson, P. Fluoronitriles/CO2 gas mixture as promising substitute to SF6 for insulation in high voltage applications. IEEE Trans. Dielectr. Electr. Insul. 2016, 23, 2587–2593. [Google Scholar] [CrossRef]
  24. Kieffel, Y.; Irwin, T.; Ponchon, P.; Owens, J. Green gas to replace SF6 in electrical grids. IEEE Power Energy Mag. 2014, 14, 32–39. [Google Scholar] [CrossRef]
  25. Jiang, T.; Meng, X.; Wei, Q.; Jin, L.; Sun, Y. The Development of SF6 Green Substitute Gas. Sustainability 2021, 13, 9063. [Google Scholar] [CrossRef]
  26. Li, F.; Yoo, Y.W.; Kim, D.K.; Lee, B.H. Impulse Breakdown Behaviors of Dry Air as an Alternative Insulation Gas for SF6. J. Korean Inst. Illum. Electr. Install. Eng. 2011, 25, 24–32. [Google Scholar] [CrossRef]
  27. Li, Y.; Zhang, X.; Zhang, J.; Fu, M.; Zhuo, R.; Luo, Y.; Chen, D.; Xiao, S. Experimental study on the partial discharge and AC breakdown properties of C4F7N/CO2 mixture. IET J. Eng. Technol. 2019, 4, 12–17. [Google Scholar] [CrossRef]
  28. Zhang, B.; Uzelac, N.; Cao, Y. Fluoronitrile/CO2 mixture as an eco-friendly alternative to SF6 for medium voltage switchgears. IEEE Trans. Dielectr. Electr. Insul. 2018, 4, 1340–1350. [Google Scholar] [CrossRef]
  29. Kim, S.Y.; Hong, W.K.; Kim, M.H.; Jin, S.Y.; Kim, K.H. A Comparative Study on the Partial Discharge Characteristics of Dry-air and SF6, ICEPE-ST. In Proceedings of the 2022 6th International Conference on Electric Power Equipment-Switching Technology (ICEPE-ST), Seoul, Korea, 15–18 March 2022; pp. 267–270. [Google Scholar] [CrossRef]
  30. CIGRE Working Group D1.33. Guide for Partial Discharge Measurements in Compliance to IEC 60270; Technical Brochure No. 366; CIGRE: Paris, France, 2008. [Google Scholar]
  31. Ilkhechi, H.D.; Samimi, M.H. Application of the Acoustic Method in Partial Discharge Measurement: A Review. IEEE Trans. Dielectr. Electr. Insul. 2021, 28, 42–51. [Google Scholar] [CrossRef]
  32. CIGRE Working Group B3.24. Benefits Of PD Diagnosis on GIS Condition Assessment; Technical Brochure No. 674; CIGRE: Paris, France, 2017. [Google Scholar]
  33. CIGRE Working Group D1.03. Risk Assessment on Defects in GIS Based on PD Diagnostics; Technical Brochure No. 525; CIGRE: Paris, France, 2013. [Google Scholar]
  34. International Electrotechnical Commission. IEC 60270: High-Voltage Test Techniques-Partial Discharge Measurements; International Electrotechnical Commission: Geneva, Switzerland, 2015. [Google Scholar]
  35. Nechmi, H.E.; Beroual, A.; Girodet, A.; Vinson, P. Effective ionization coefficients and limiting field strength of fluoronitriles-CO2 mixtures. IEEE Trans. Dielectr. Electr. Insul. 2017, 24, 886–892. [Google Scholar] [CrossRef]
  36. Wang, P.; Akram, S.; Meng, P.; Li, Z.; Montanari, G.C. Design of an Effective Antenna for Partial Discharge Detection in Insulation Systems of Inverter-fed Motors. IEEE Trans. Industr. Electr. 2022, 69, 13727–13735. [Google Scholar] [CrossRef]
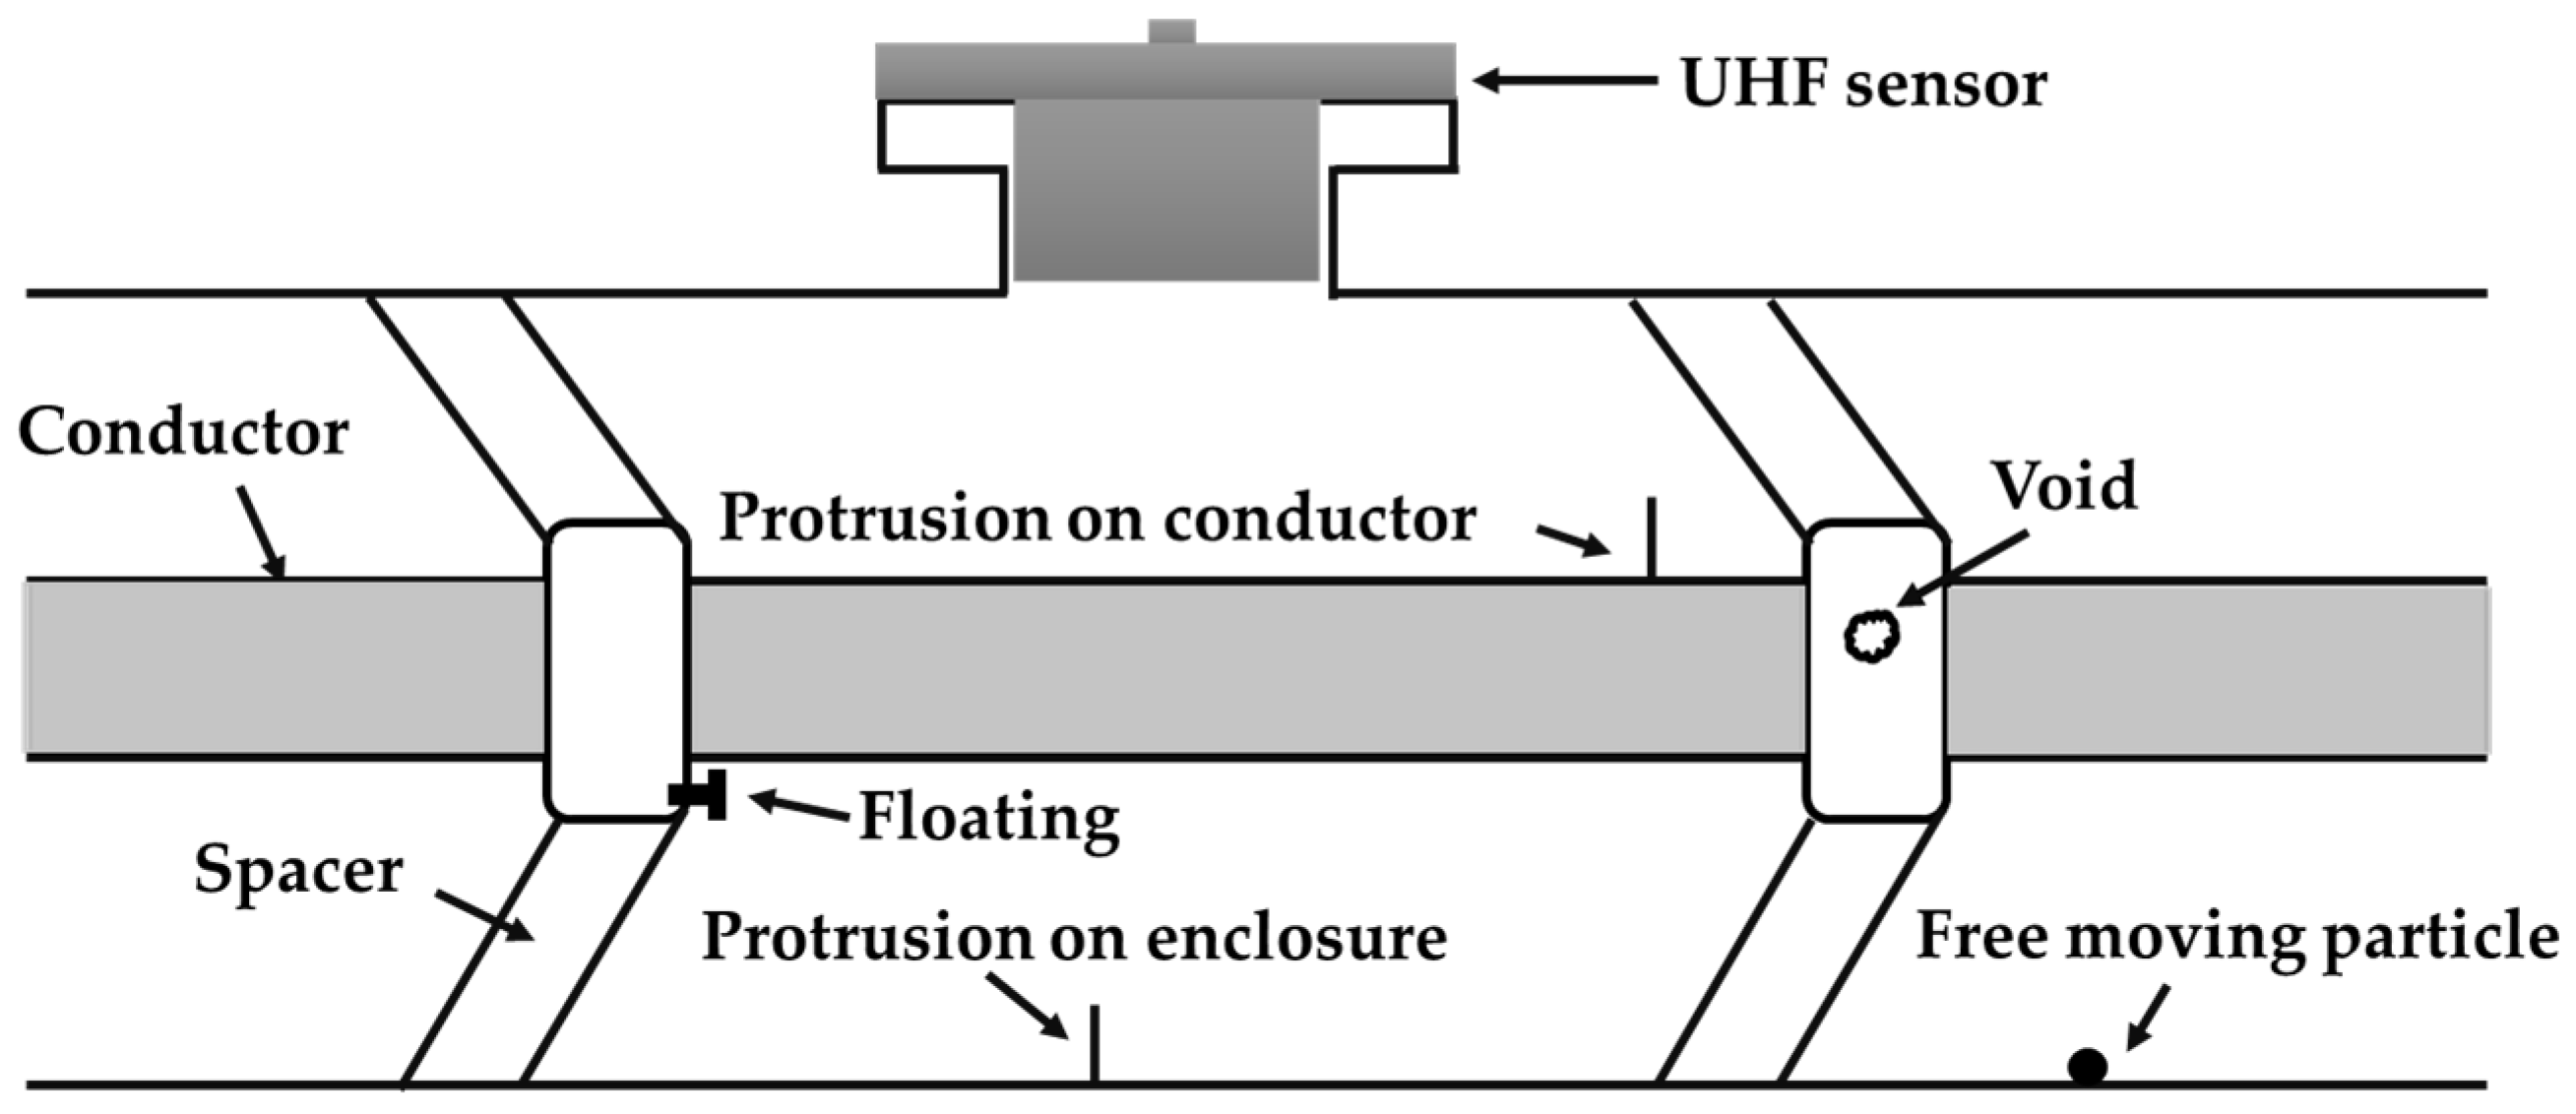
Figure 1. Typical types of PD defects that occur in GIS.
Energies 15 07043 g001
Figure 2. PD electrode systems: (a) FMP and (b) POC.
Energies 15 07043 g002
Figure 3. Experimental configuration: (a) a circuit and (b) a photograph.
Energies 15 07043 g003
Figure 4. The output of UHF sensor: (a) calibration result and (b) output waveform.
Energies 15 07043 g004aEnergies 15 07043 g004b
Figure 5. Partial discharge inception voltages (PDIVs) of g3 and dry air compared to SF6: (a) in POC and (b) FMP.
Energies 15 07043 g005aEnergies 15 07043 g005b
Figure 6. Typical single pulse and its fast Fourier transform (FFT) (a) in POC and (b) in FMP.
Energies 15 07043 g006aEnergies 15 07043 g006b
Figure 7. Phase-resolved partial discharge (PRPD) patterns: (a) in POC and (b) in FMP.
Energies 15 07043 g007aEnergies 15 07043 g007b
Figure 8. Correlation between output voltage in mV and apparent charge in pC: (a) in POC and (b) FMP.
Energies 15 07043 g008
Table 1. Parameters of each signal pulse according to the types of PD defect.
Electrode SystemsGasesRising Time (μs)Falling Time (μs)Pulse Width (μs)
POCSF6124132272
g3152143298
Dry air171146304
FMPSF611667144
g312584186
Dry air12492192
Table 2. Average output voltage and pulse count.
Electrode SystemGasAverage Output Voltage (mV)Pulse Count (N/s)
POCSF627.124
g331.642
Dry Air40.31716
FMPSF643490
g3459123
Dry Air484135
Publisher’s Note: MDPI stays neutral with regard to jurisdictional claims in published maps and institutional affiliations.