
Microscopic Mechanism for the Displacement of Shale Oil by CO2 in Organic Nanopores


Abstract
:1. Introduction
2. Simulation System
2.1. Model Construction
- (1)
- Single crystal cell structure of graphene was imported from the database of Materials Studio and thus the Graphene monolayer lamellae can be constructed. Then the pores-vacuum layers and supercell graphene pore model was built by the Super Cell in the database of Materials Studio respectively.
- (2)
- In pores of graphene, n-dodecane molecular are injected and the force field of n-dodecane was distributed by the Dreiding force field [19,20]. Subsequently, Atom Based was used to obtain the sum method of Van der Waals’ force and the electrostatic force in isochoric-isothermal ensemble (NVT). And then, the simulations are run by periodic boundary. The schematic for the pore structure of n-dodecane adsorbed is shown in Figure 1.
- (3)
- The pre-adsorption simulation of n-dodecane molecules in graphene pores was further conducted to obtain the stable adsorption configuration of n-dodecane. After that, CO2 molecules with different injection pressures were added into the pore model to simulate and study the dynamic displacing process of n-dodecane molecules by CO2 [21,22].
2.2. Optimization of Computational Model
- (4)
- The SMART option in Task Geometry Optimization under the Forcite module of Molecular Dynamics was selected to optimize the geometry of the constructed model, and then the stable graphene slit structure was obtained;
- (5)
- The COMPASS force filed was selected to stimulate the force field and the sum method of Atom based was used to obtain the Van der Waals’ force;
- (6)
- The optimization of CO2 molecular model and n-dodecane molecular model are similar to that of the structural model of graphene.
2.3. Calculation Method
2.4. Modeling Scheme
- (1)
- n-dodecane molecules must be adsorbed in pores of graphene in advance, and the adsorption capacity of n-dodecane molecules depends on the differential pressure of n-dodecane;
- (2)
- CO2 molecules with differential pressures are injected into organic nanopores that reached stable adsorption state. And when the adsorption of CO2 reached equilibrium state in pores, the injection of CO2 should be stopped immediately;
- (3)
- The displacement capacity of n-dodecane and the adsorption capacity of CO2 in pores are calculated when the adsorption equilibrium state is obtained;
- (4)
- Through the above simulation steps, single factor control variate method can be adopted to analyze the effects of injection pressure of CO2, pore size and temperature on the displacement of n-dodecane and the adsorption of CO2.
3. Results and Discussion
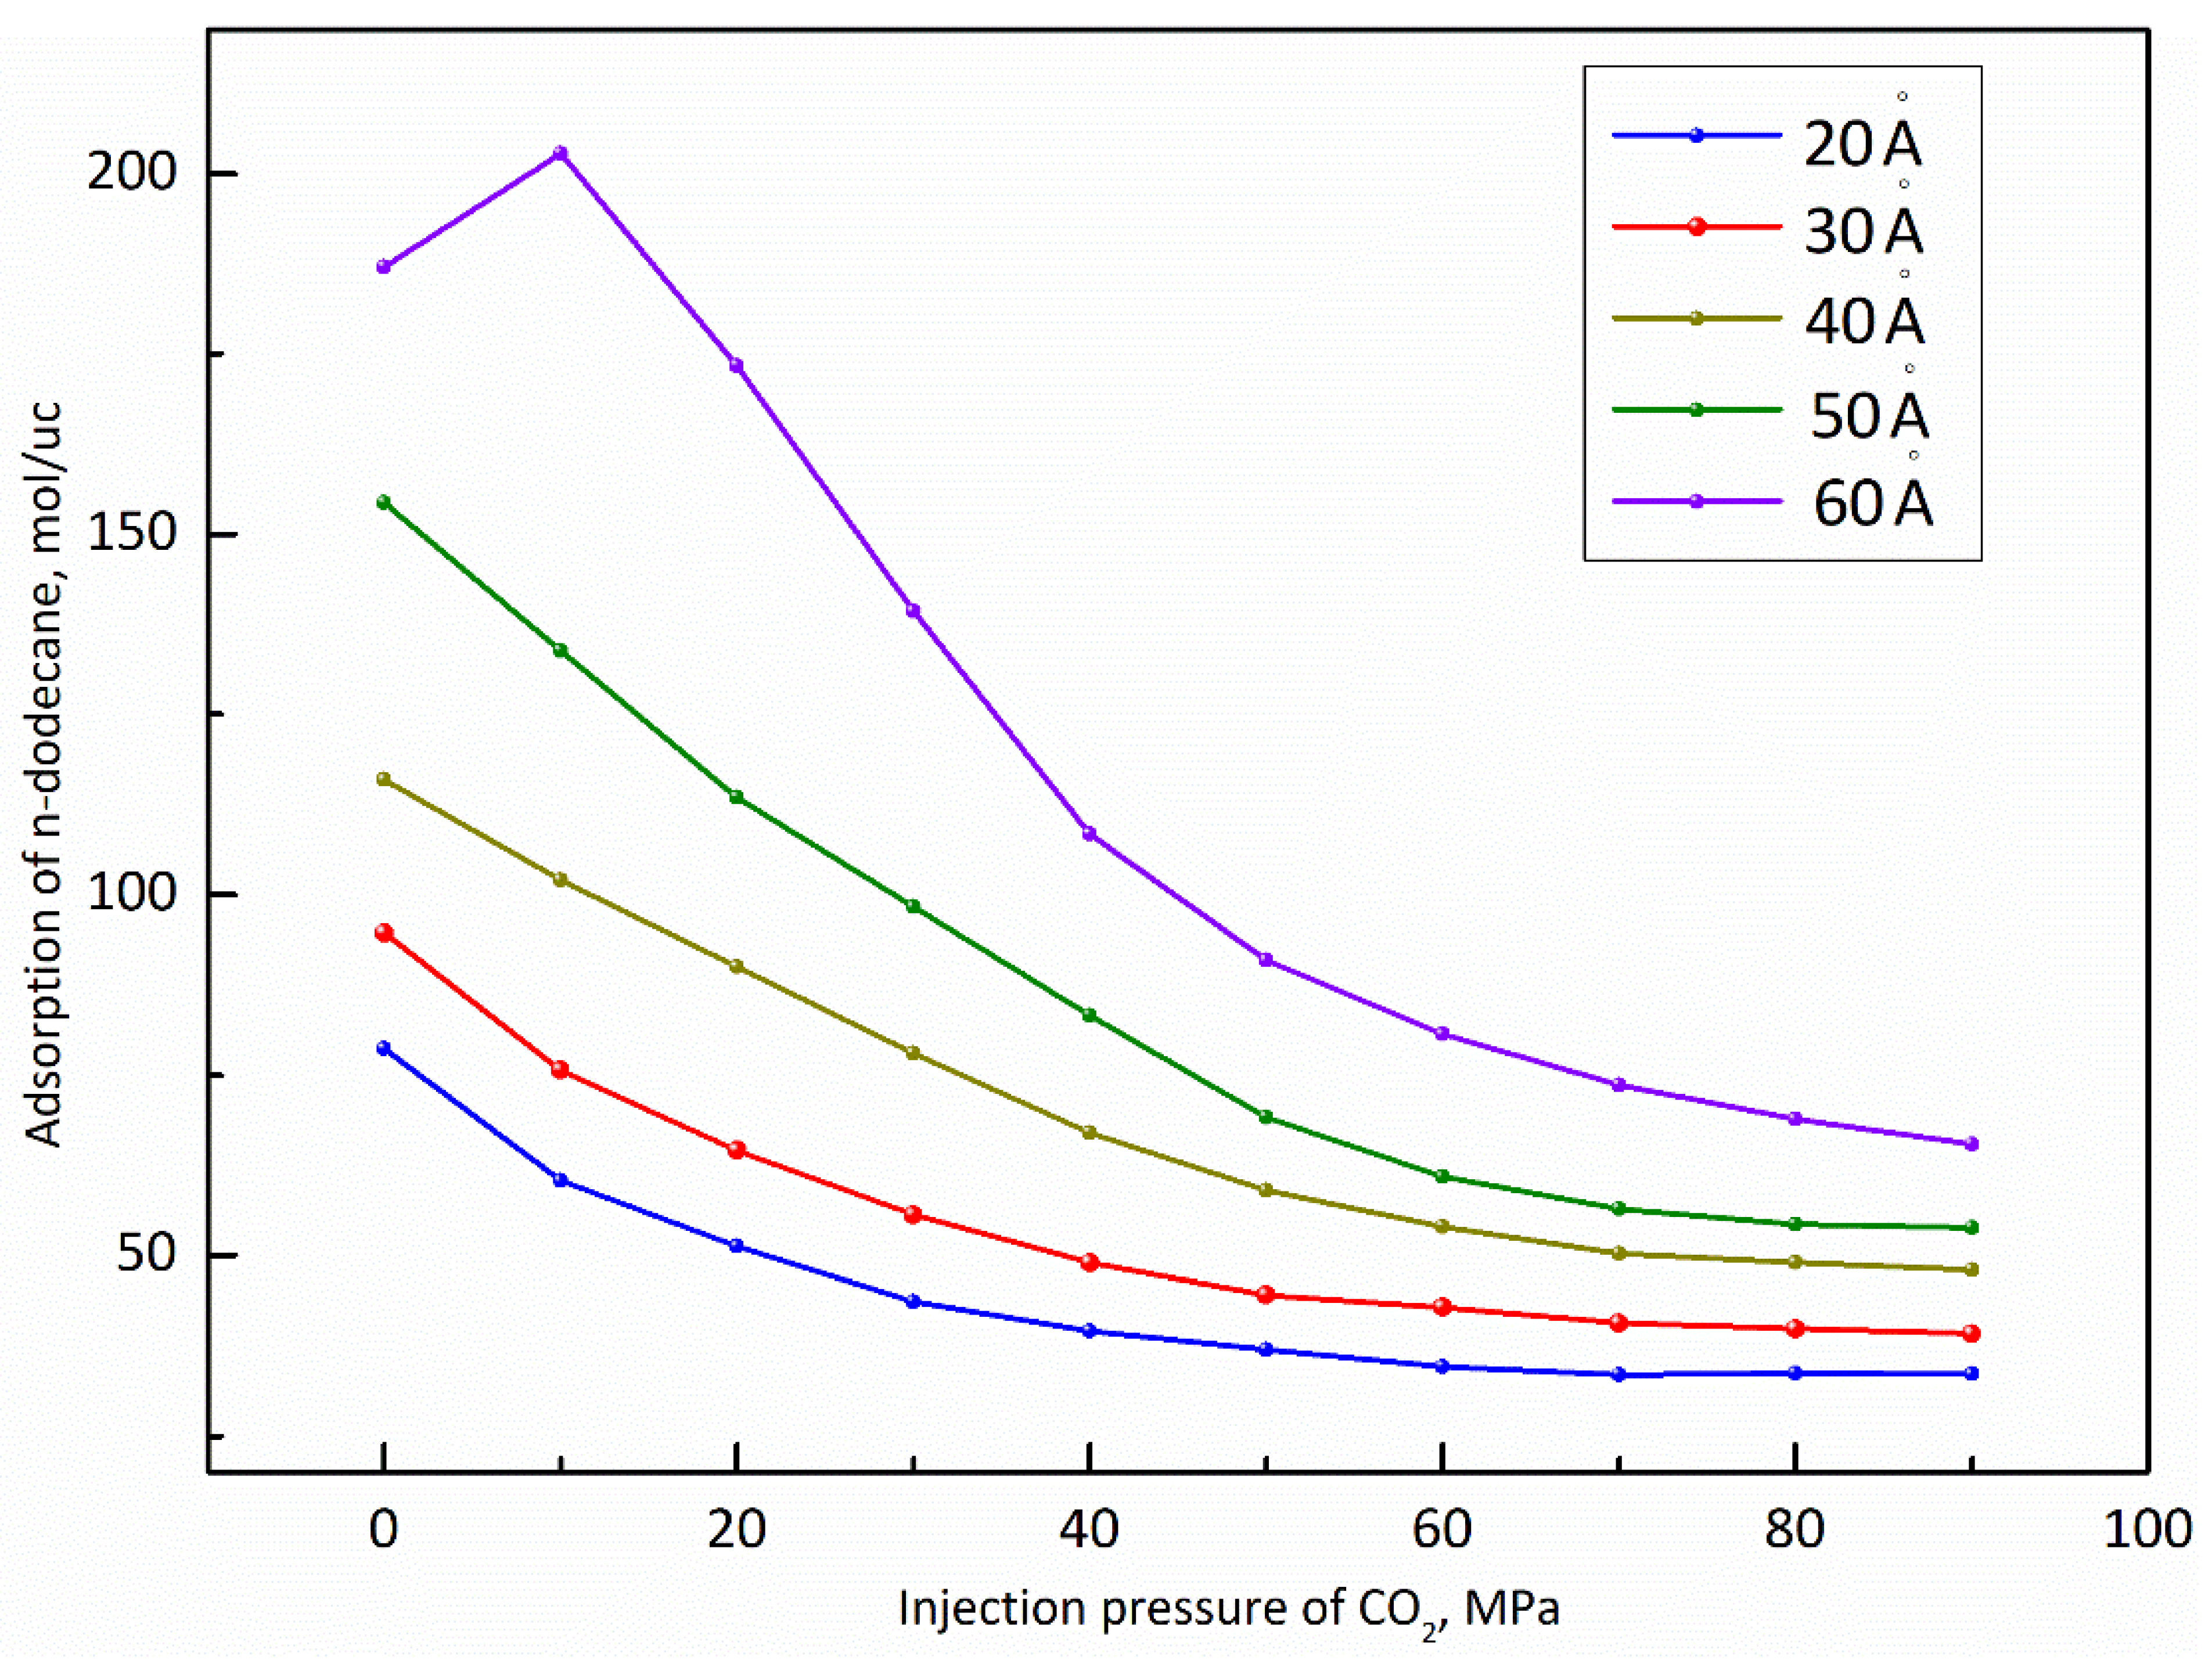
3.1. Injection Pressure of CO2
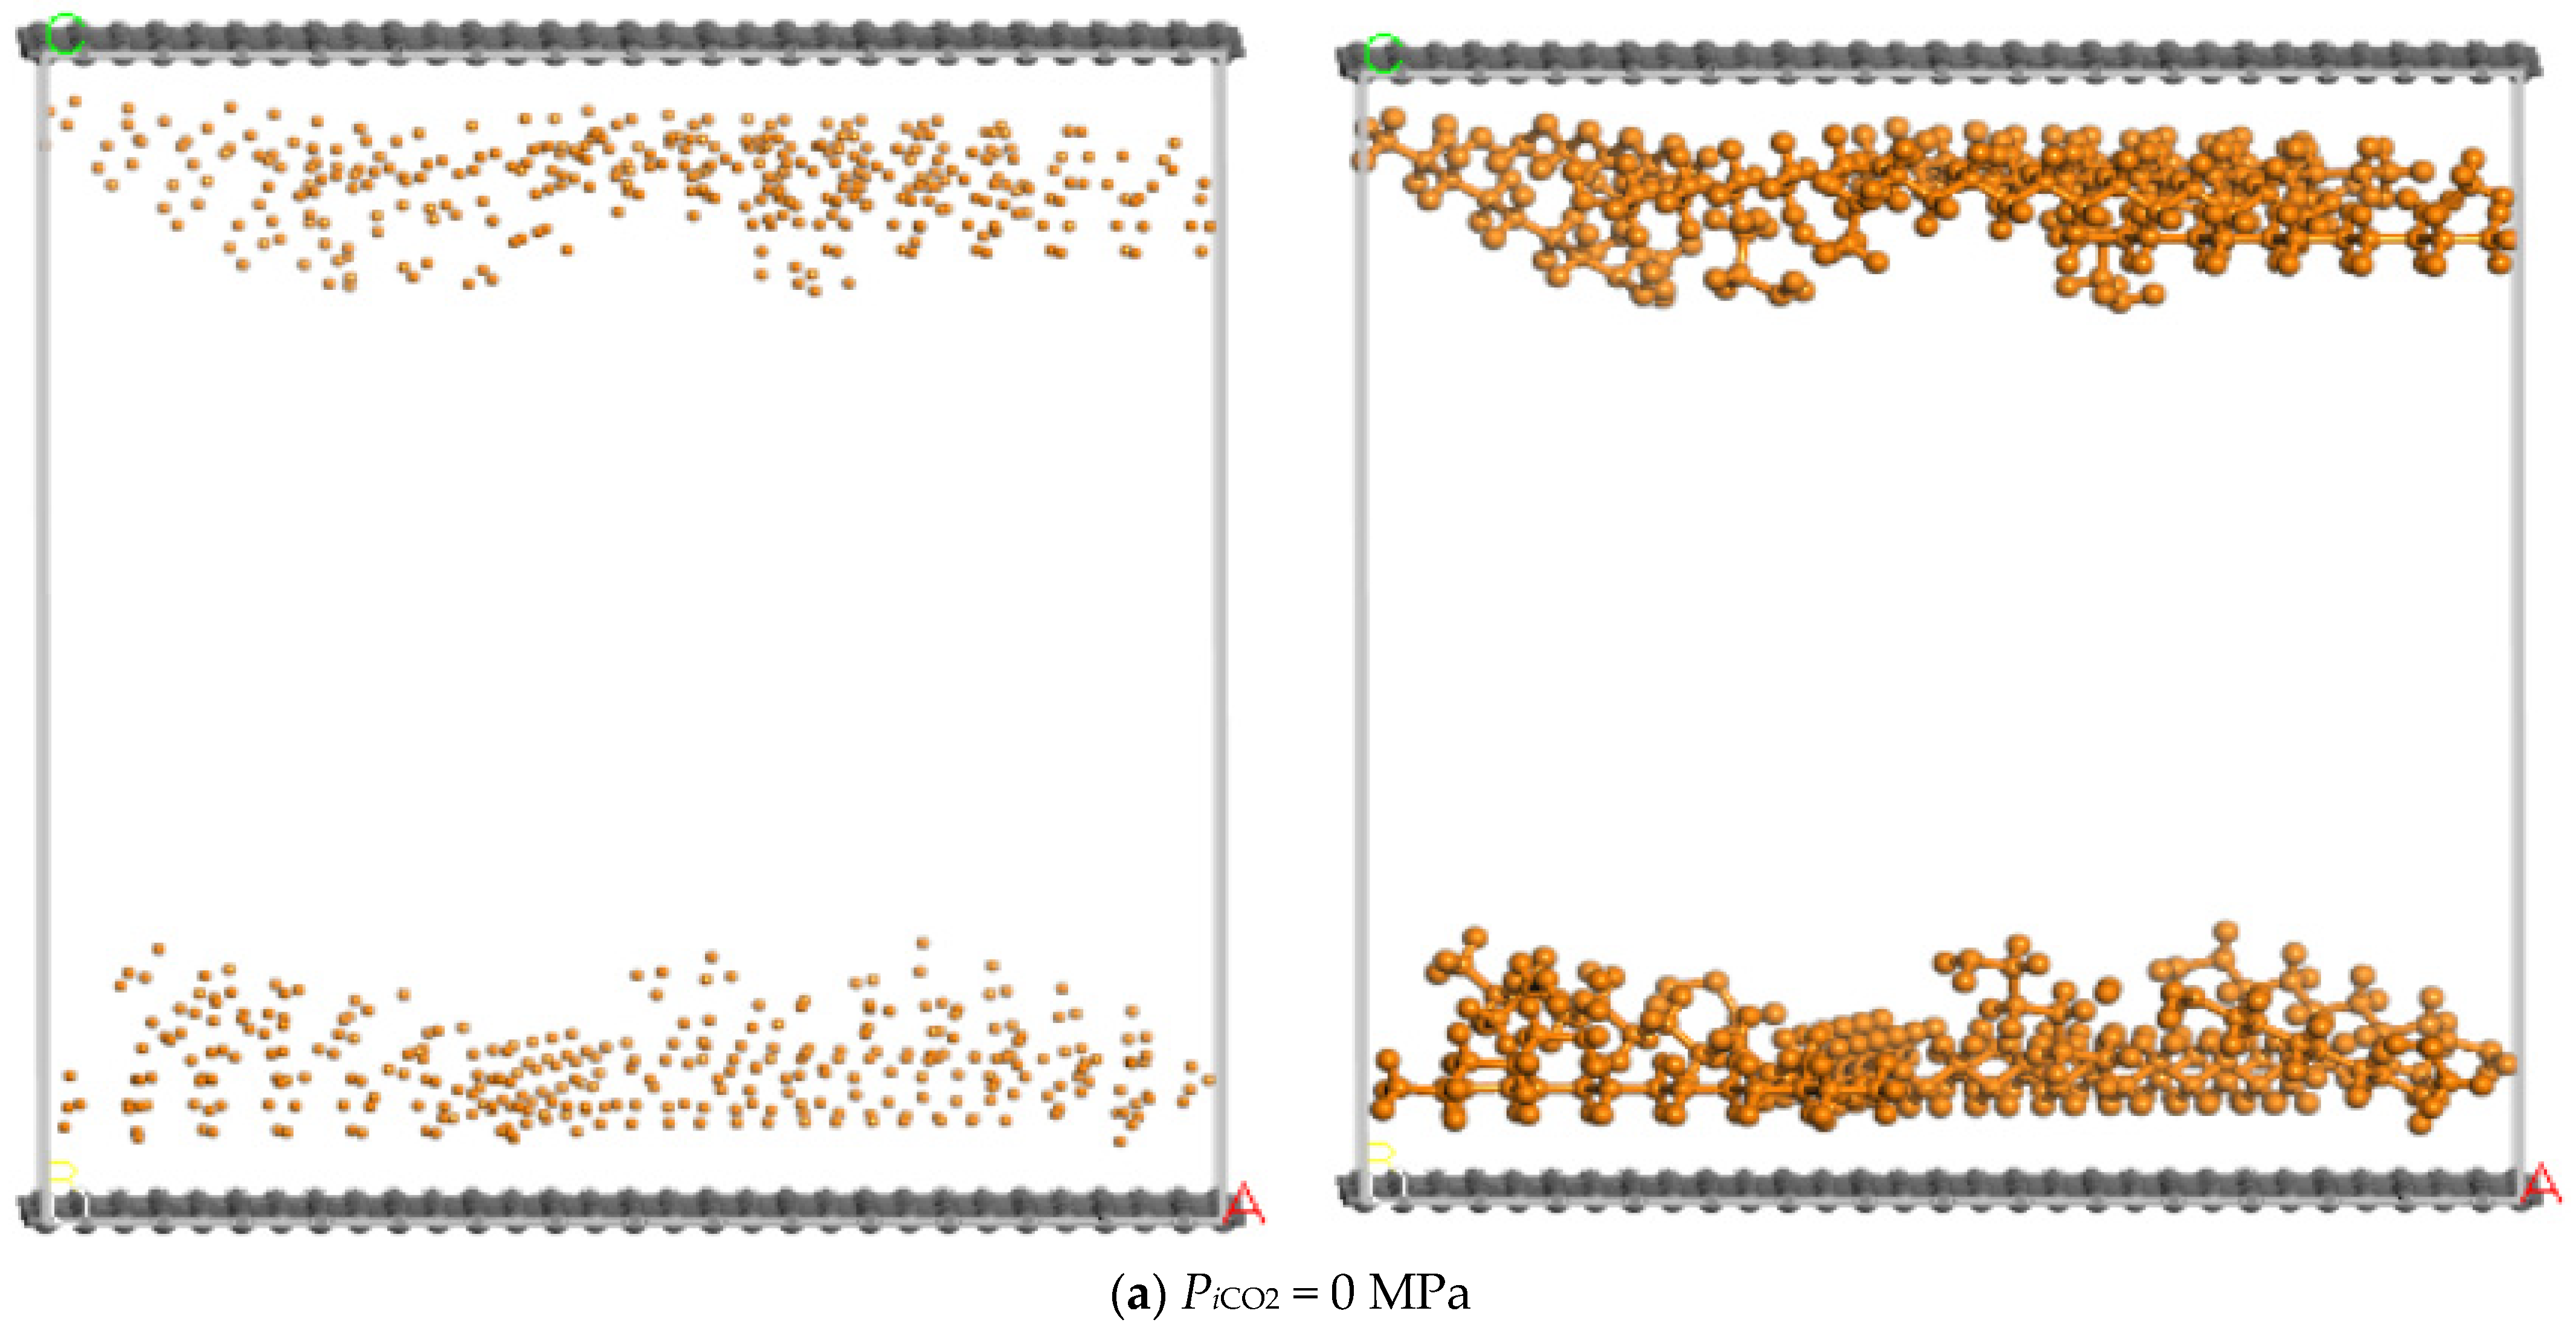
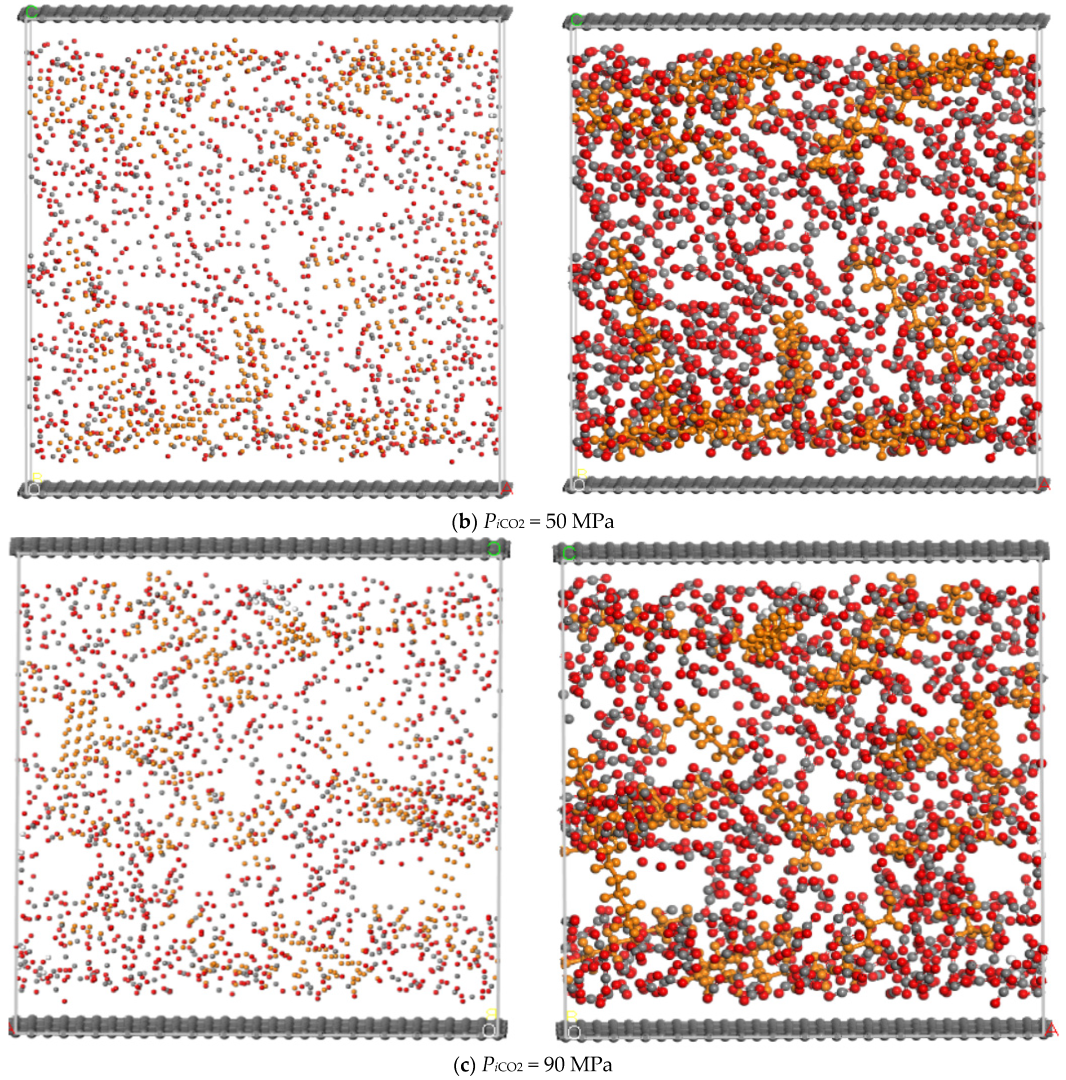
- (1)
- The pore size of the pore model is fixed at 40 Å and the simulated temperature is set at 373 K and the differential pressure of n-dodecane is set at 30 MPa;
- (2)
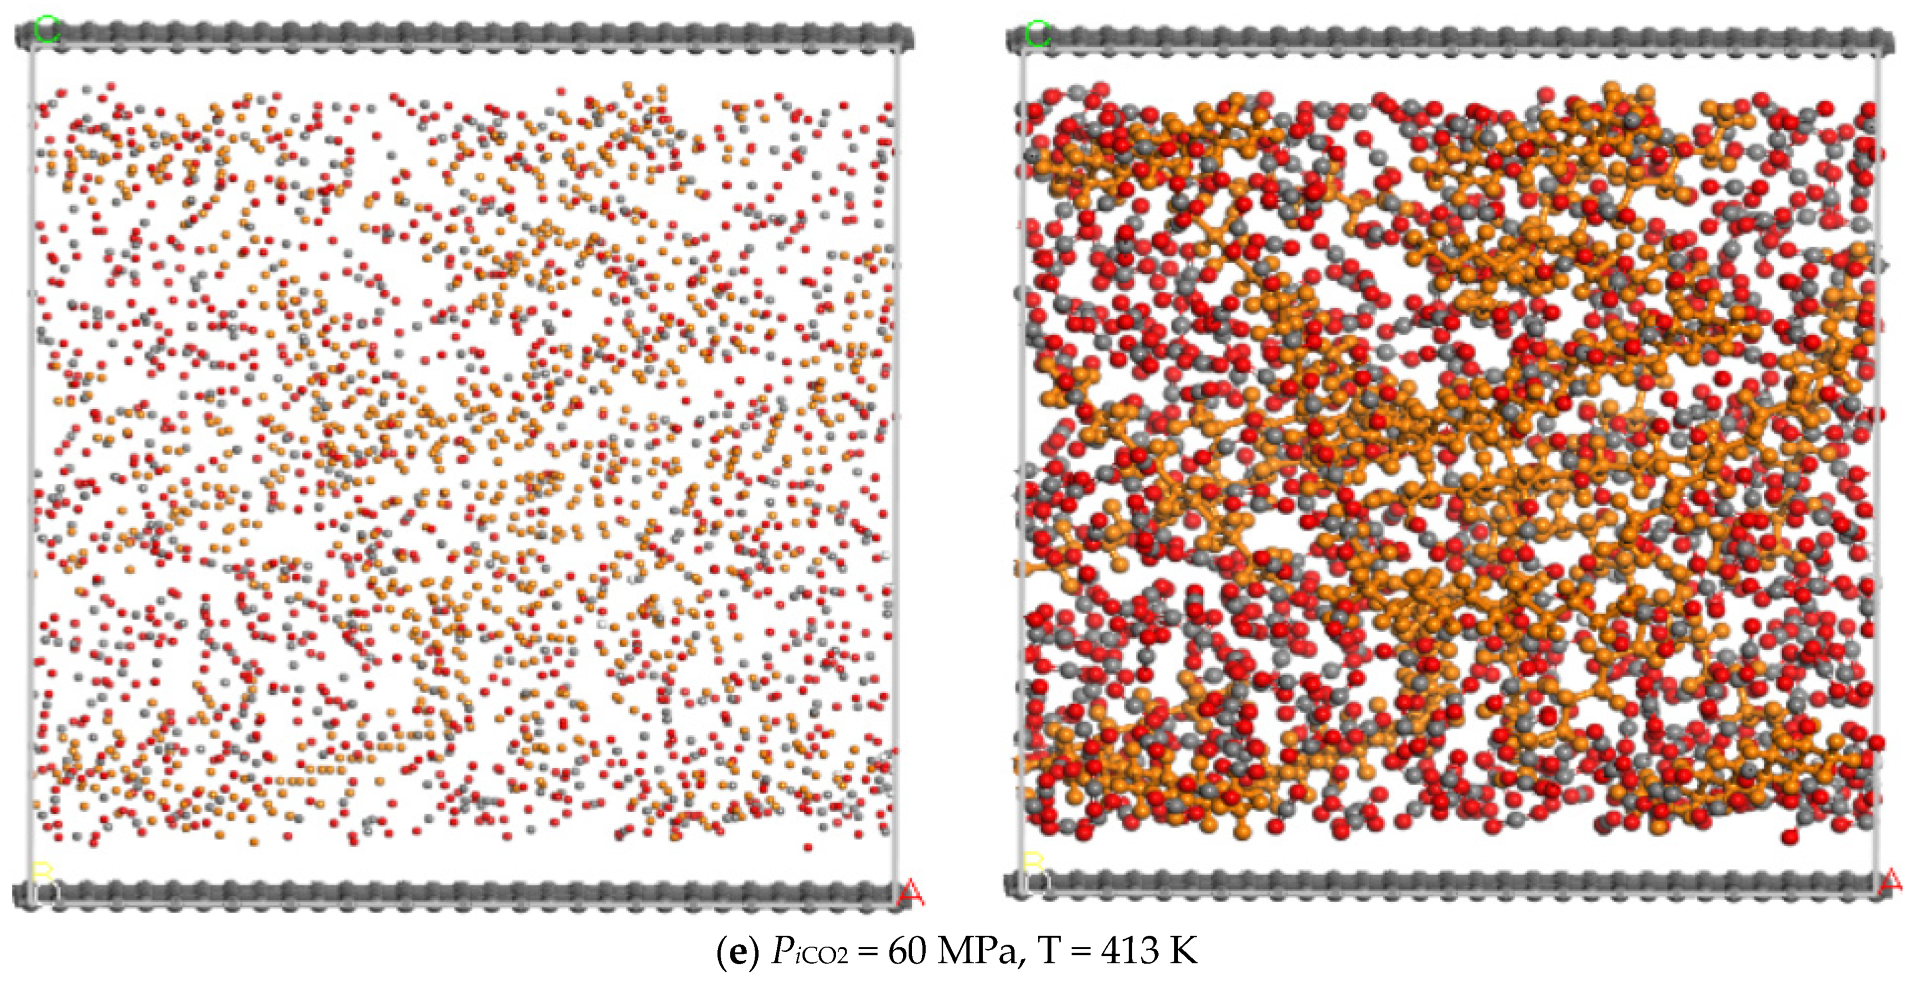
- Before the molecular simulation, n-dodecane should be adsorbed on the pore wall in advance. After that, CO2 is injected into the pore and the injection pressure of CO2 gradually increases from 0 MPa to 90 MPa;
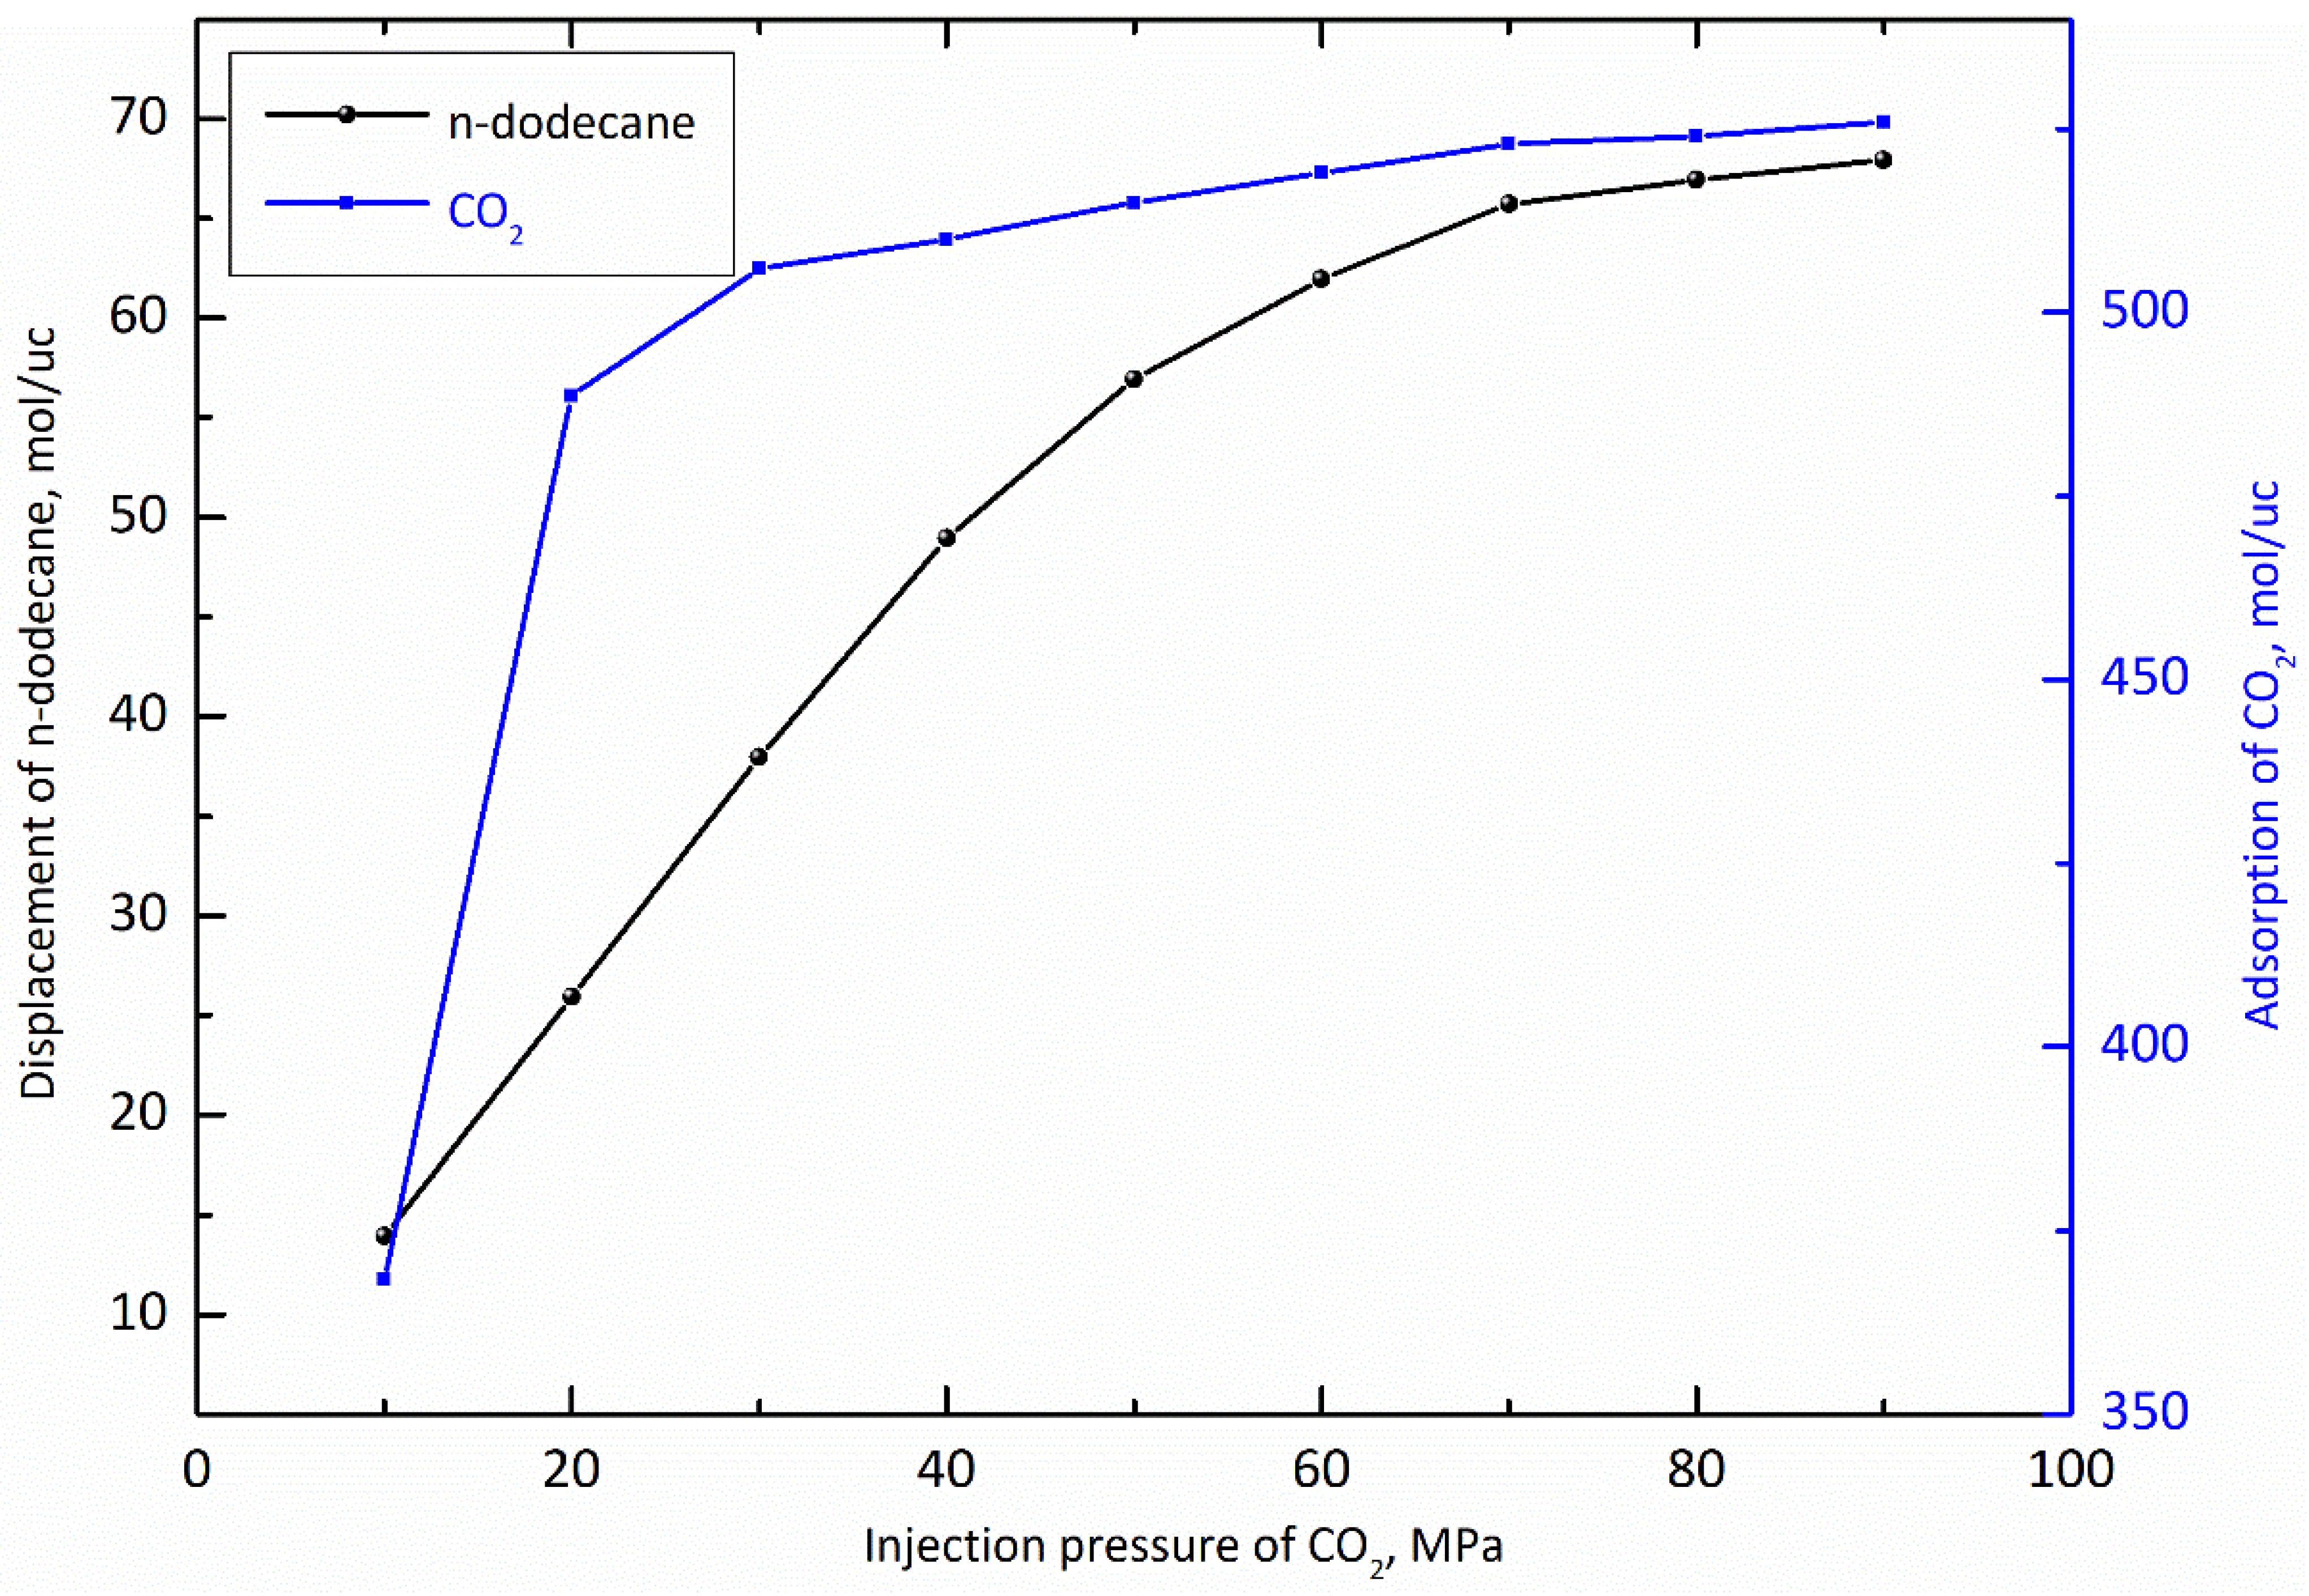
- (3)
- When the dynamic displacing process reached equilibrium, the displacement of n-dodecane and the adsorption of CO2 were further analyzed with the increase of the injection pressure of CO2.
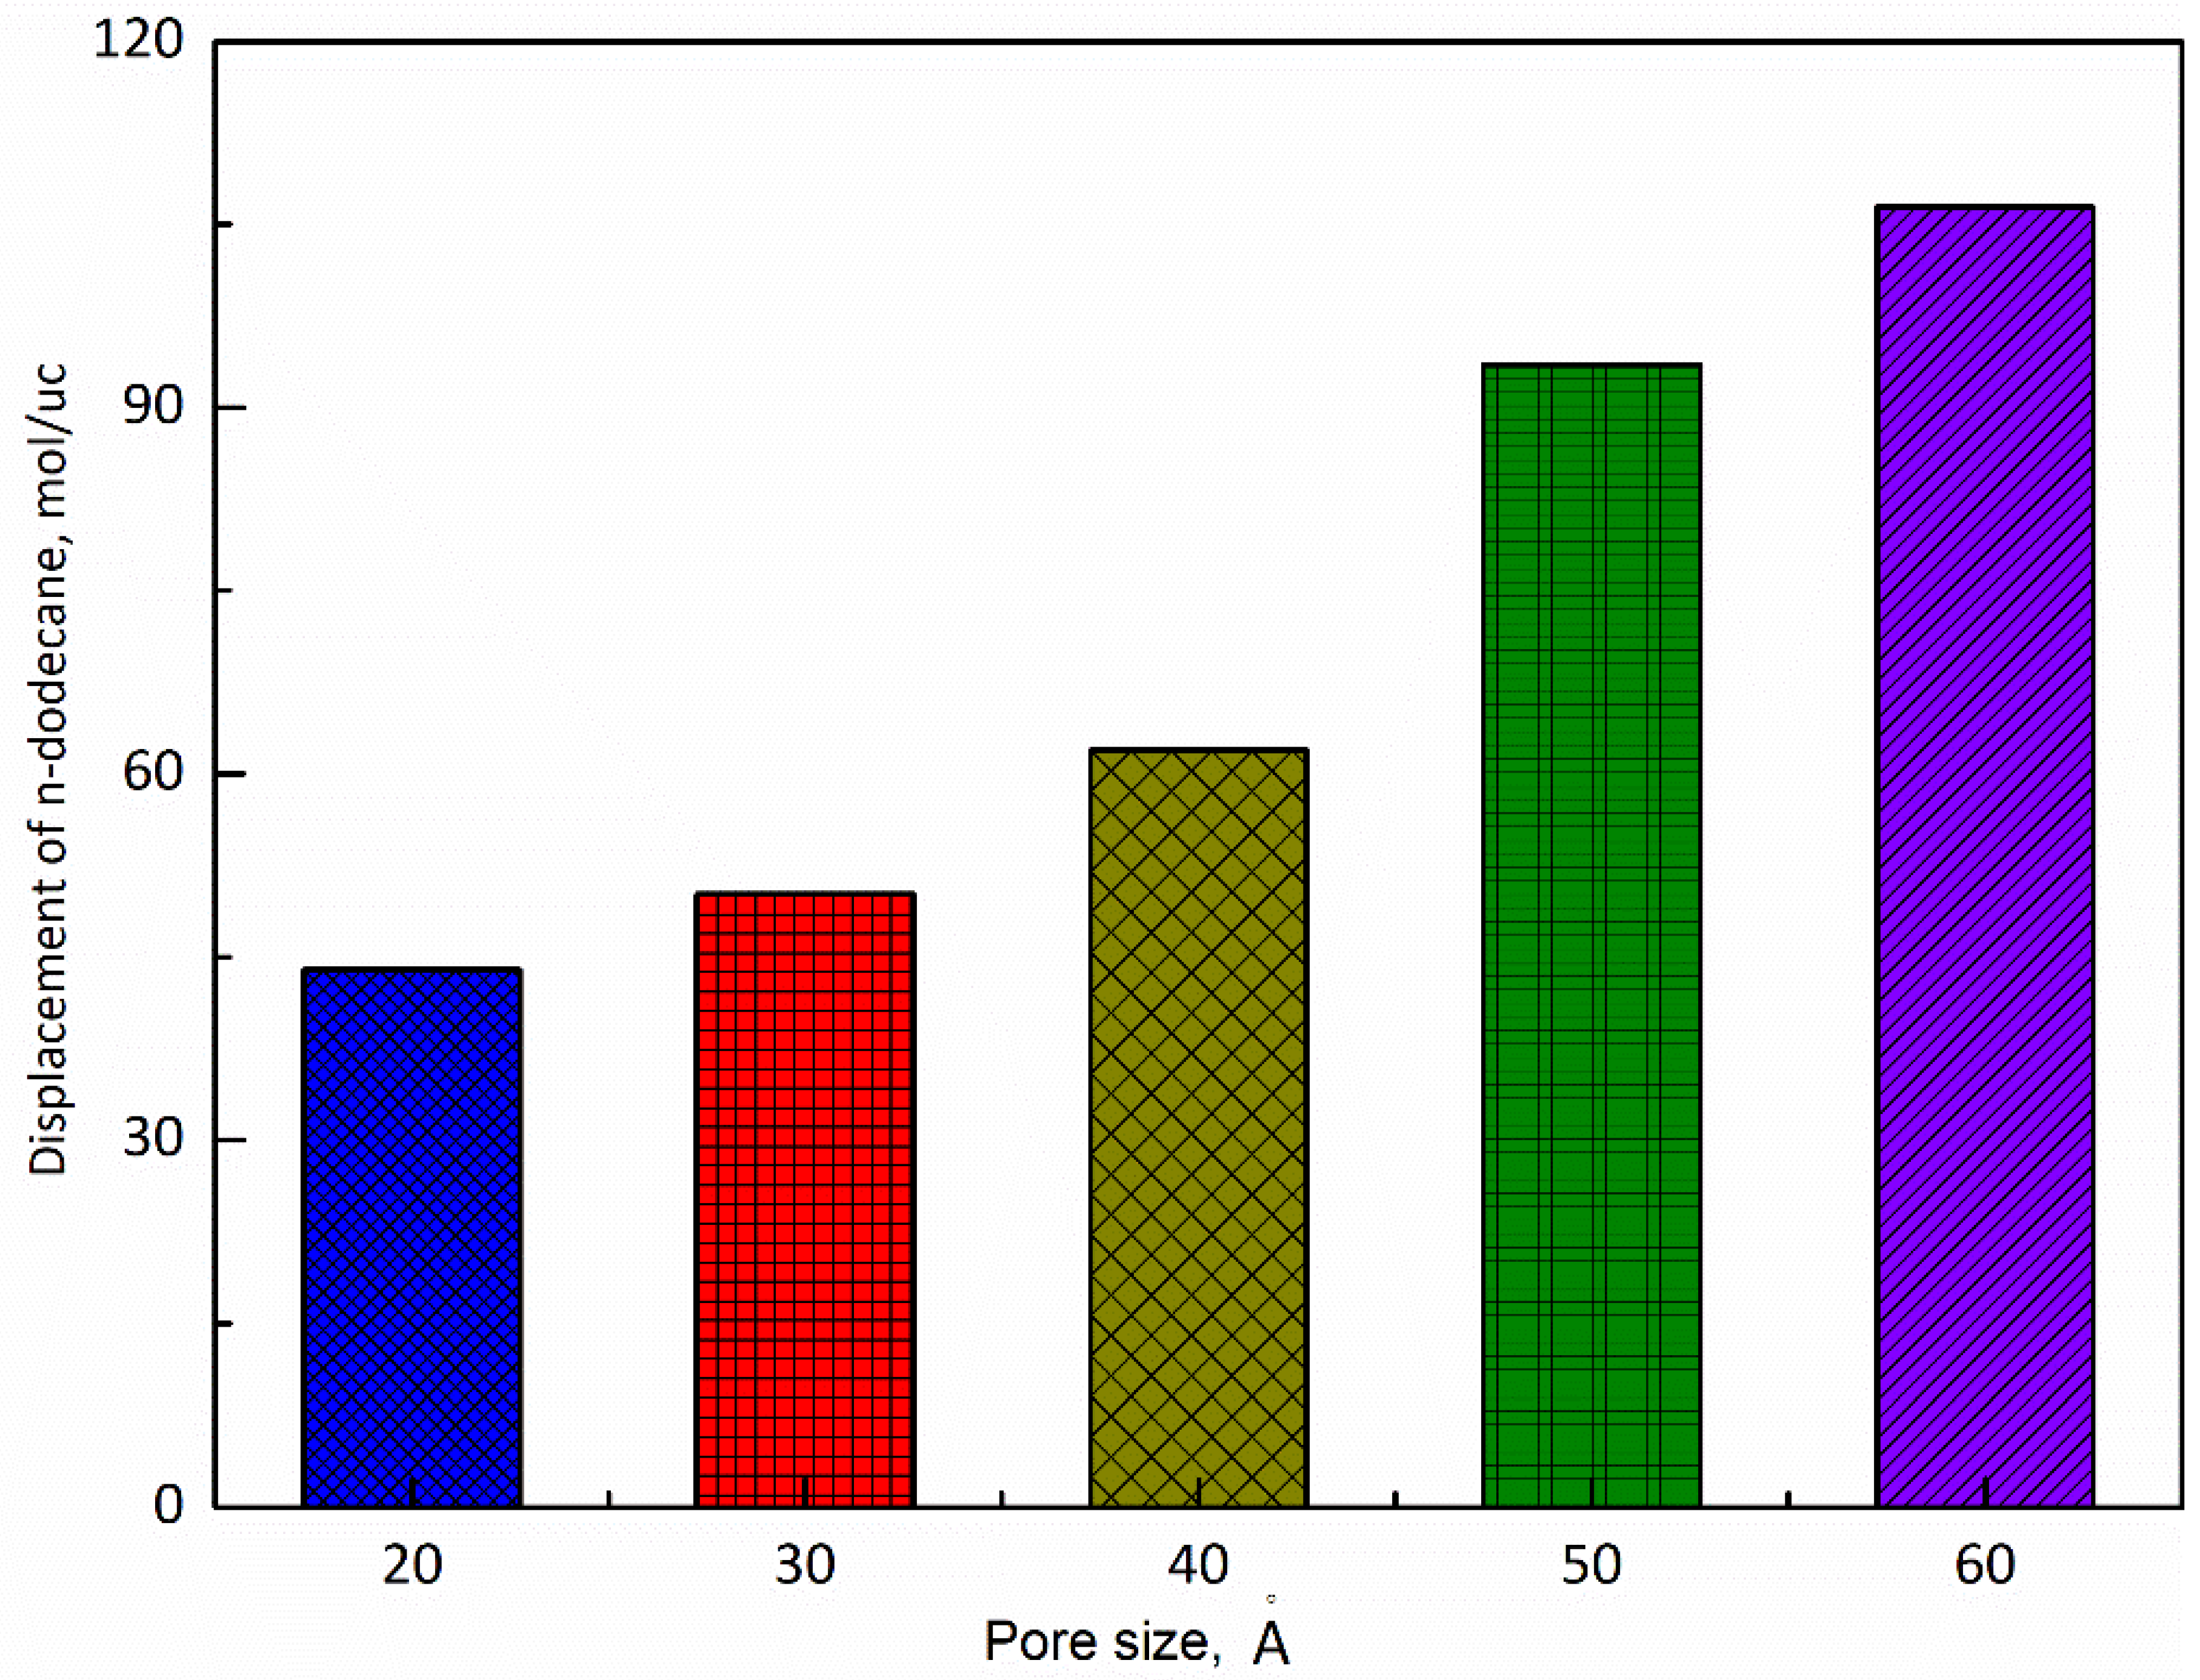
3.2. Pore Size
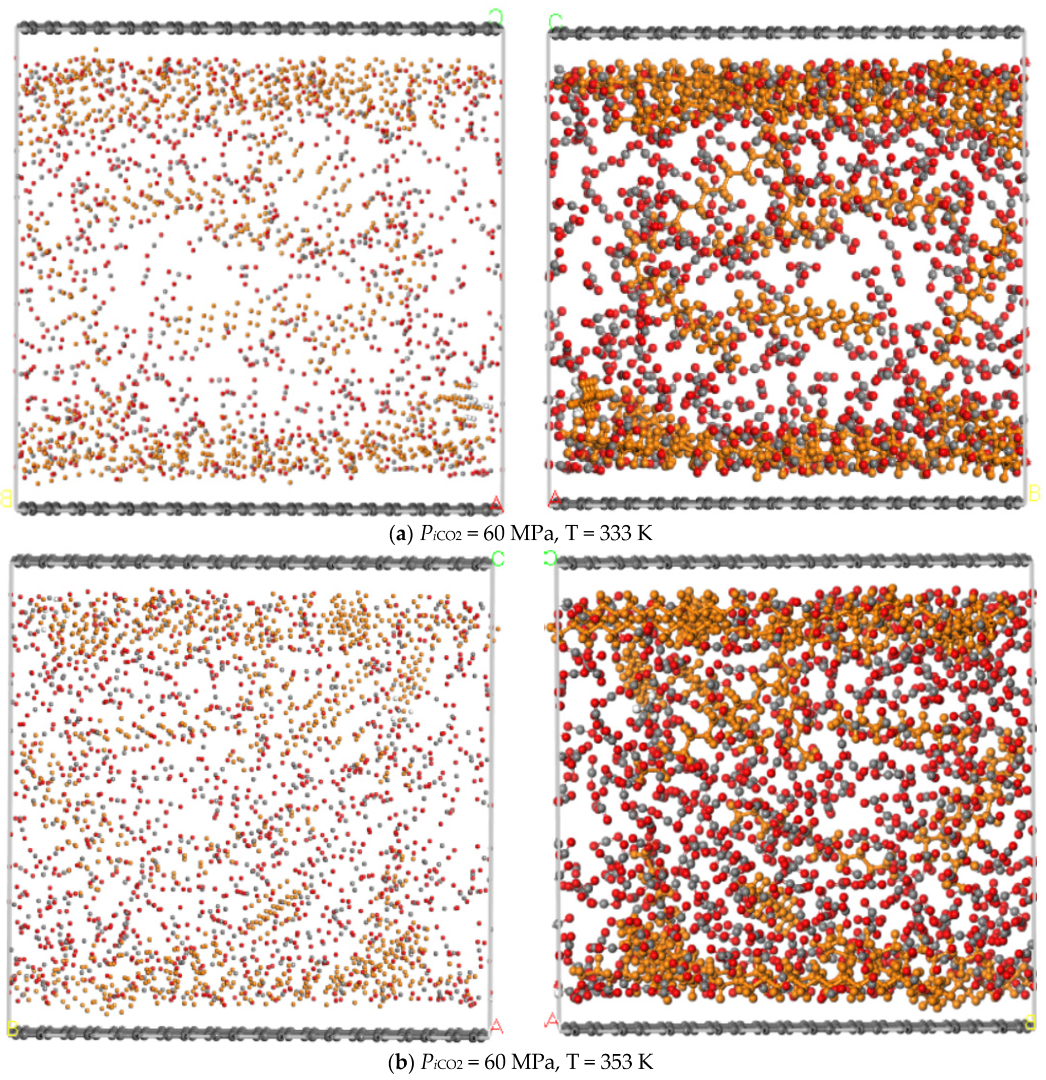
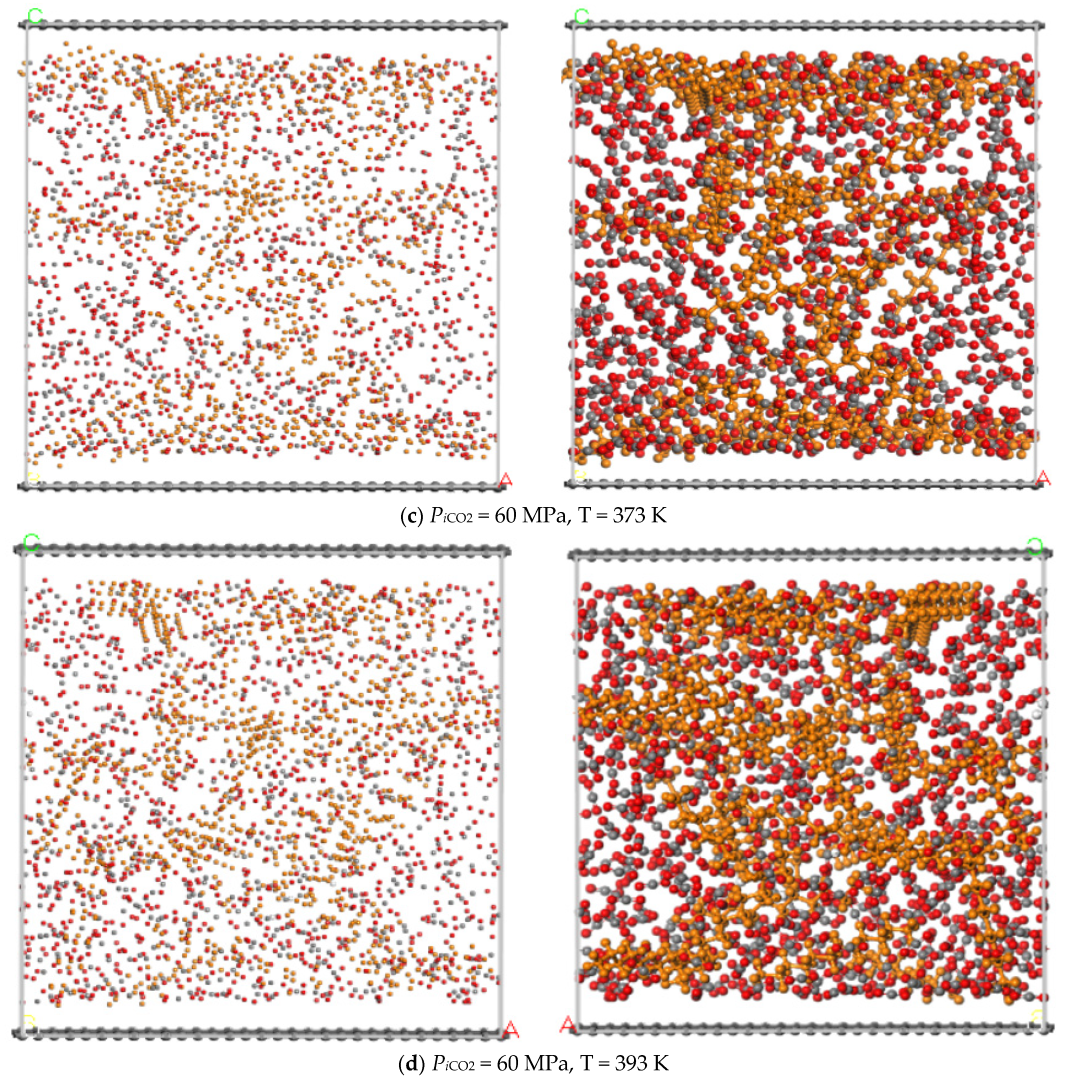
3.3. Temperature
4. Conclusions
- (1)
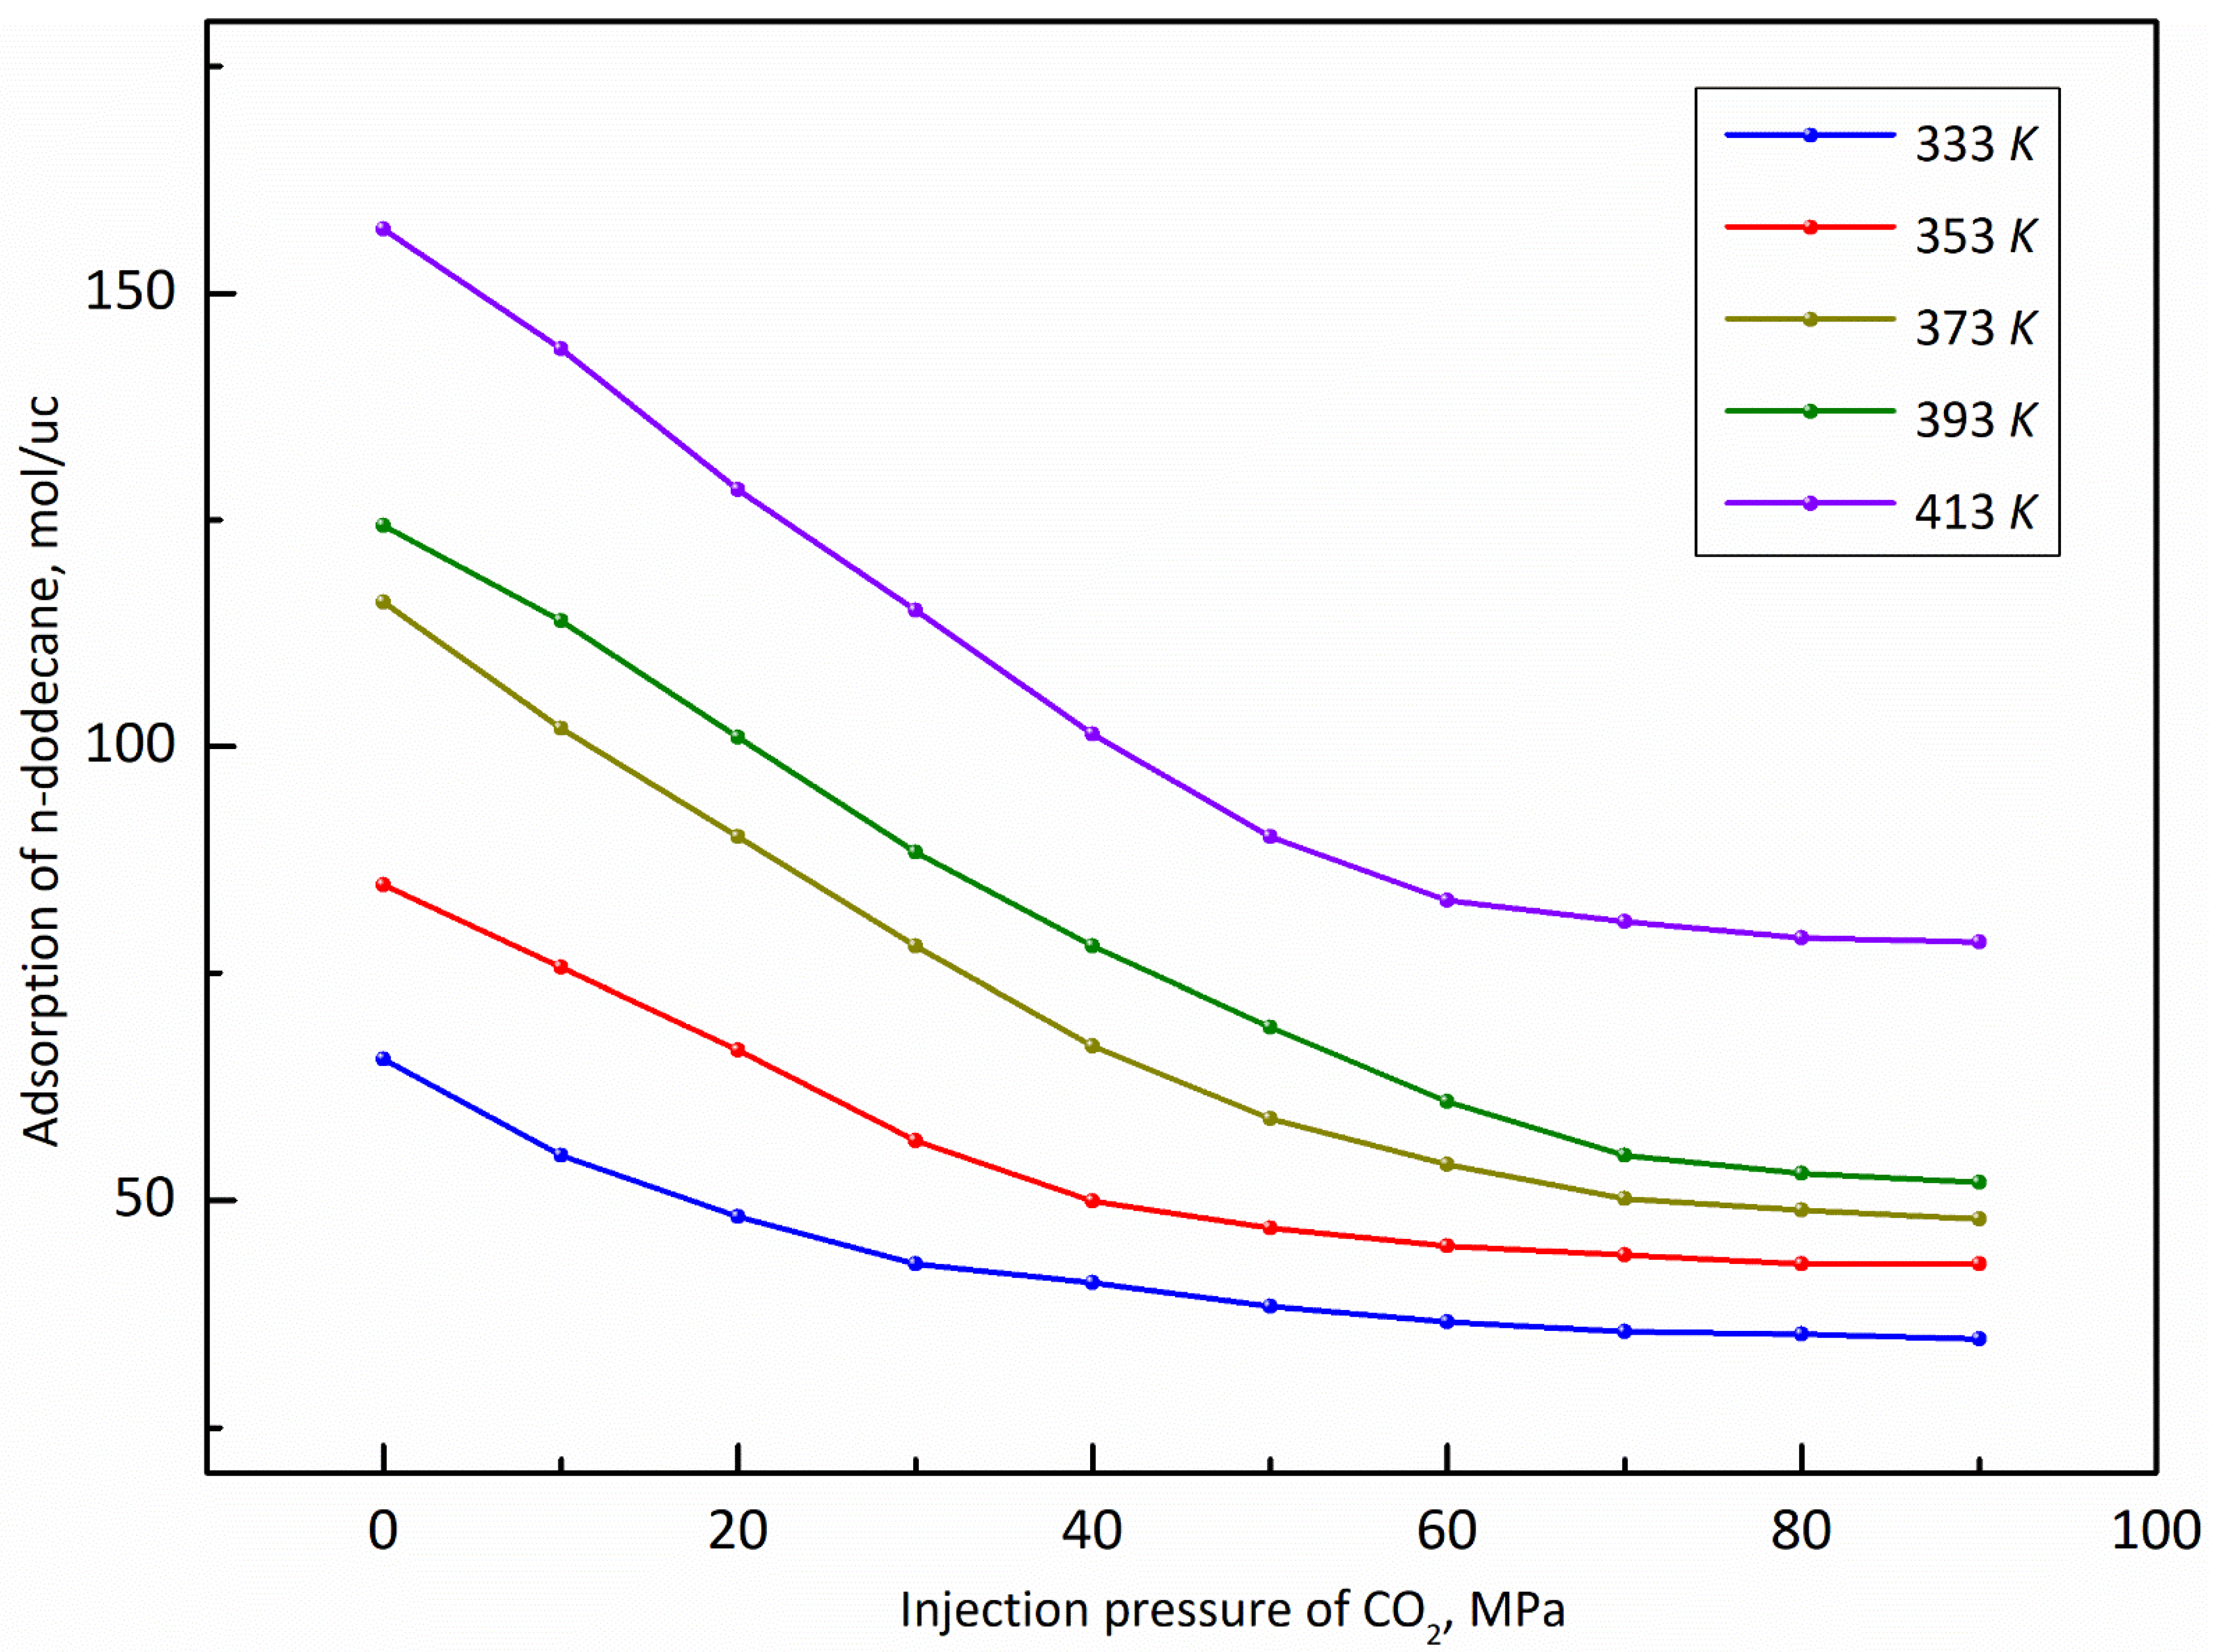
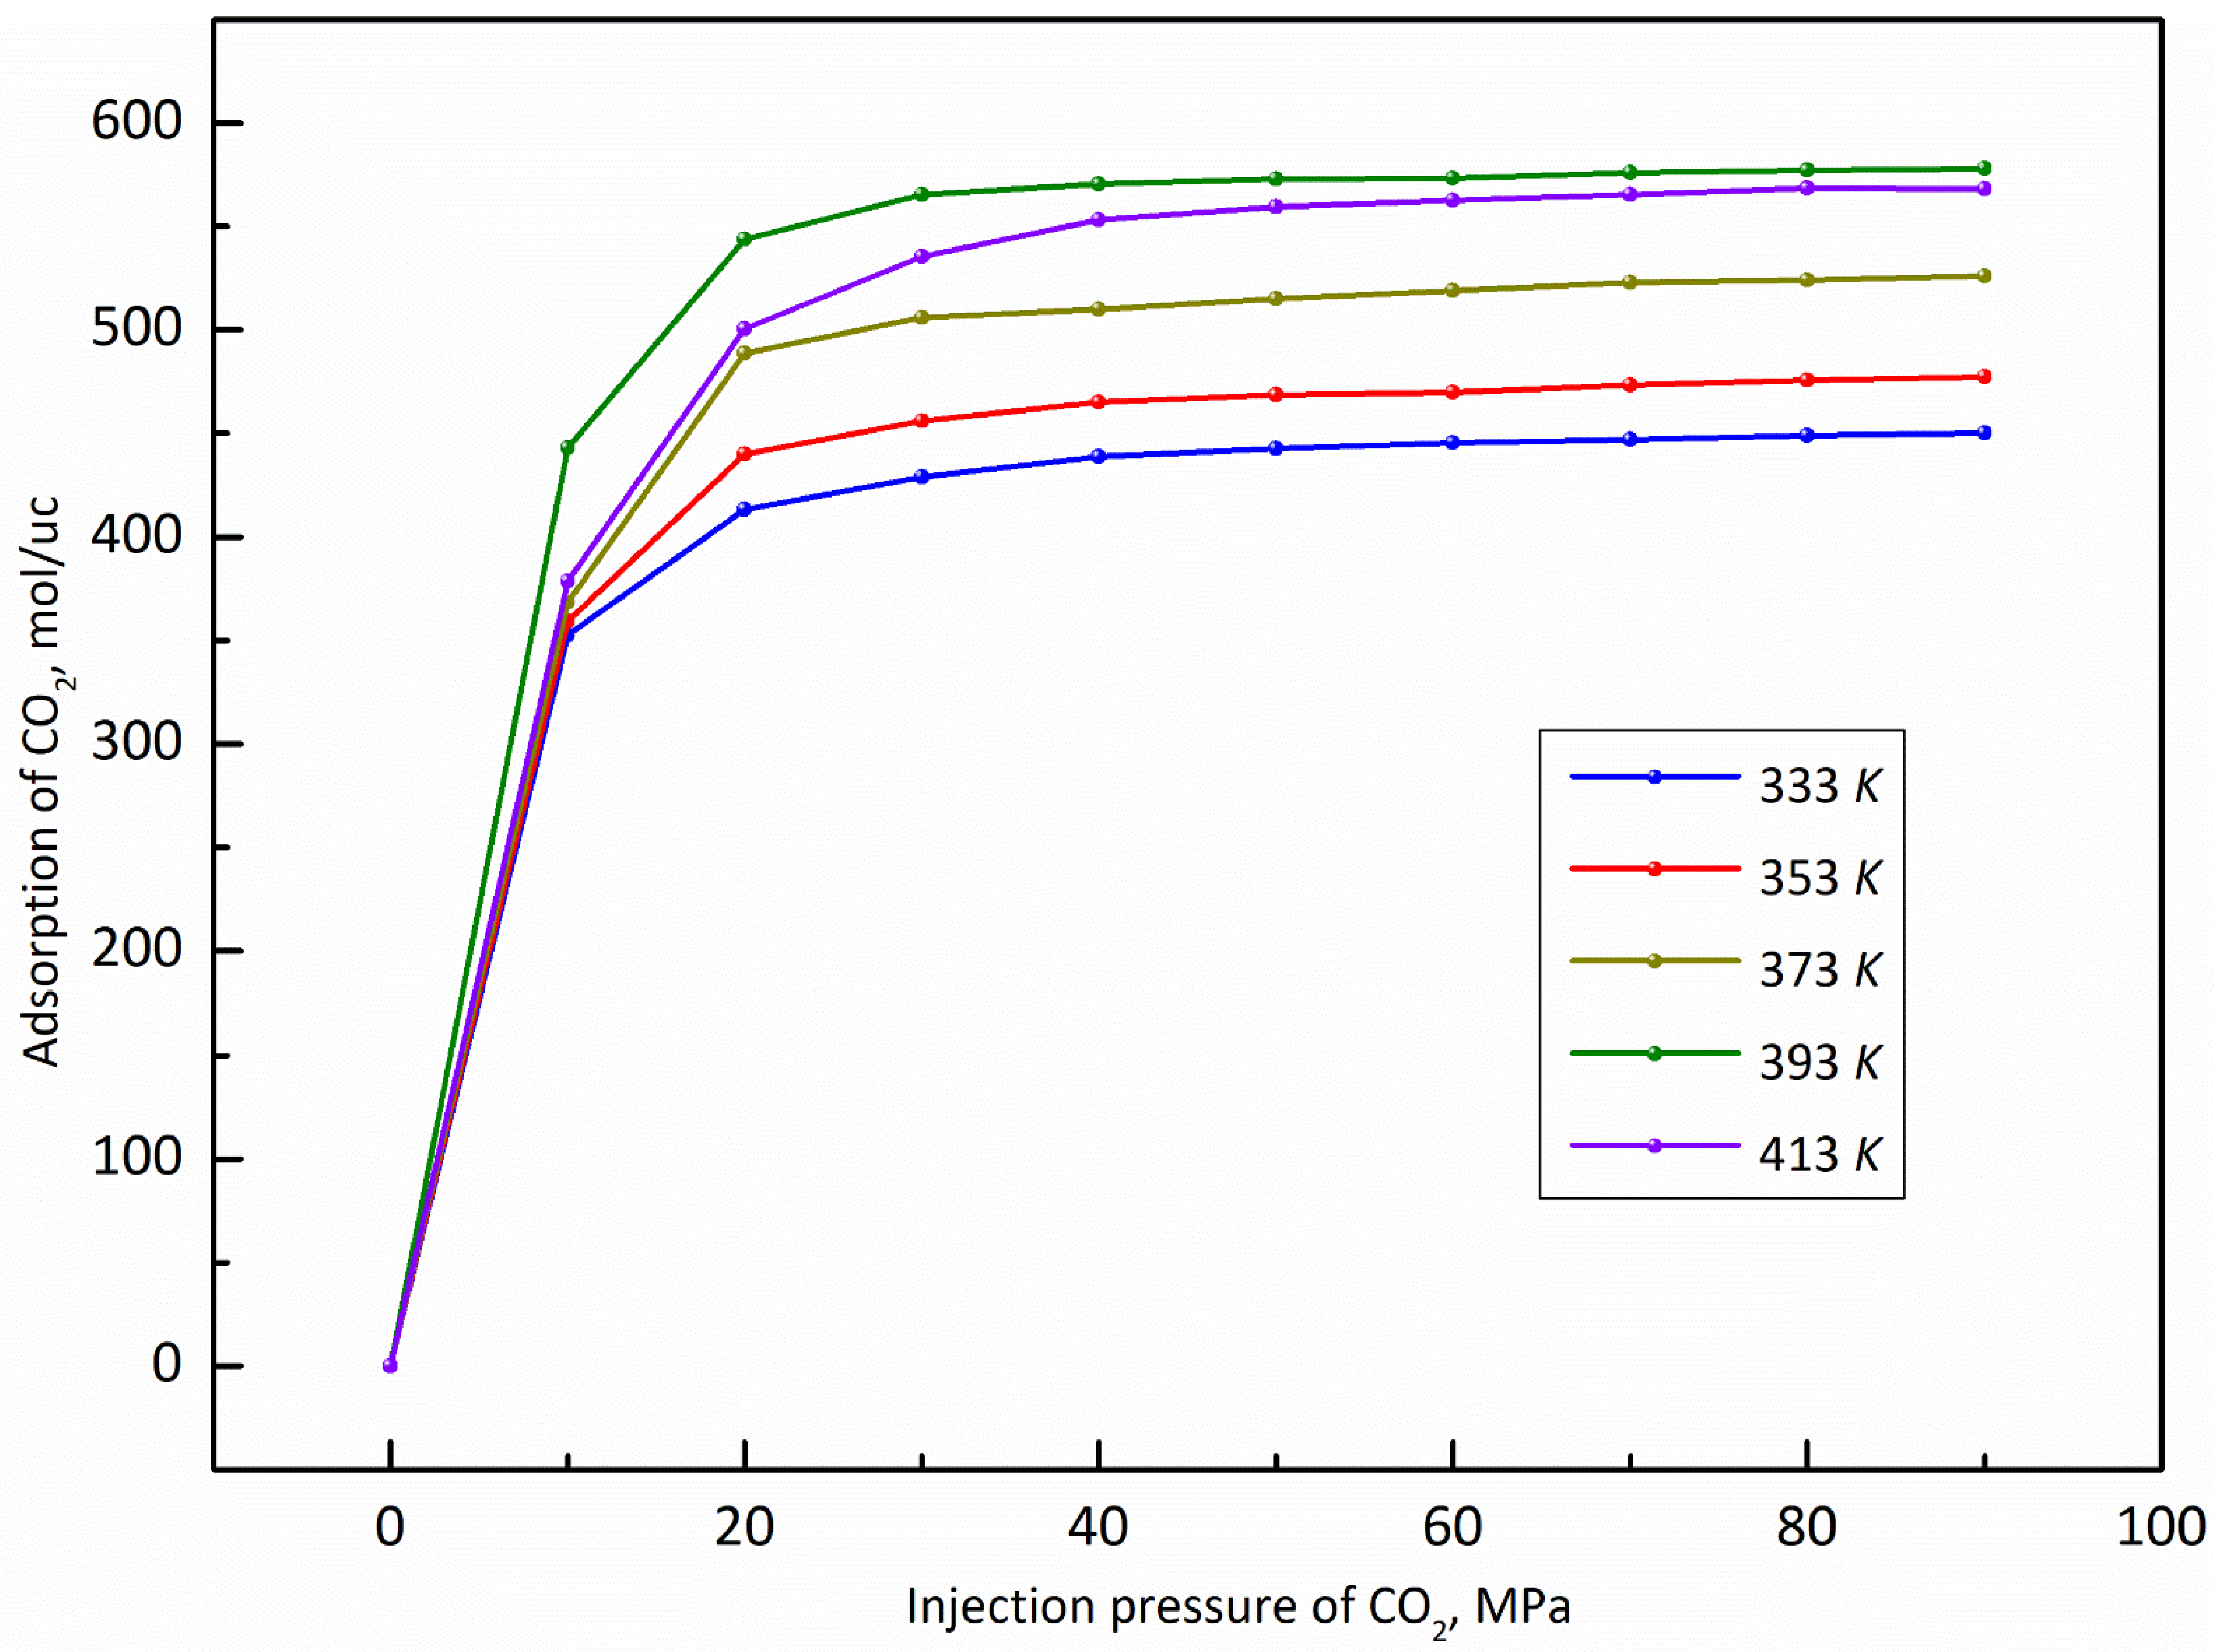
- The adsorption capacity of CO2 is much stronger than that of shale oil under reservoir conditions, which indicates that shale oil can be effectively displaced by CO2. And, the displacement capacity of shale oil by CO2 and the adsorption capacity of CO2 show a positive correlation with the injection pressure of CO2.
- (2)
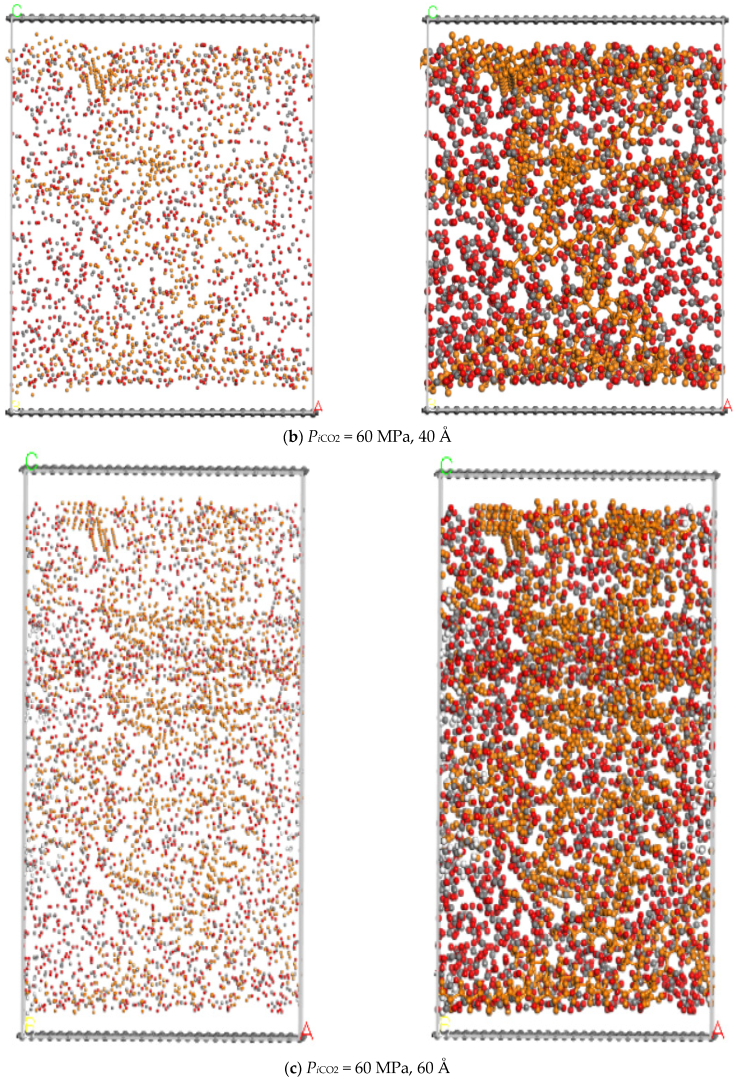
- The larger the pore size, the stronger the capacity to store shale oil and the easier it is for CO2 to displace the shale oil. Moreover, when the pore size ranges from 20 Å to 50 Å, the adsorption capacity of n-dodecane decreases with the the injection pressure of CO2. When the pore size reaches 60 Å, the adsorption capacity of n-dodecane fist increases under pressure less than 10 MPa and then decreases as the pressure increases larger than 10 MPa.
- (3)
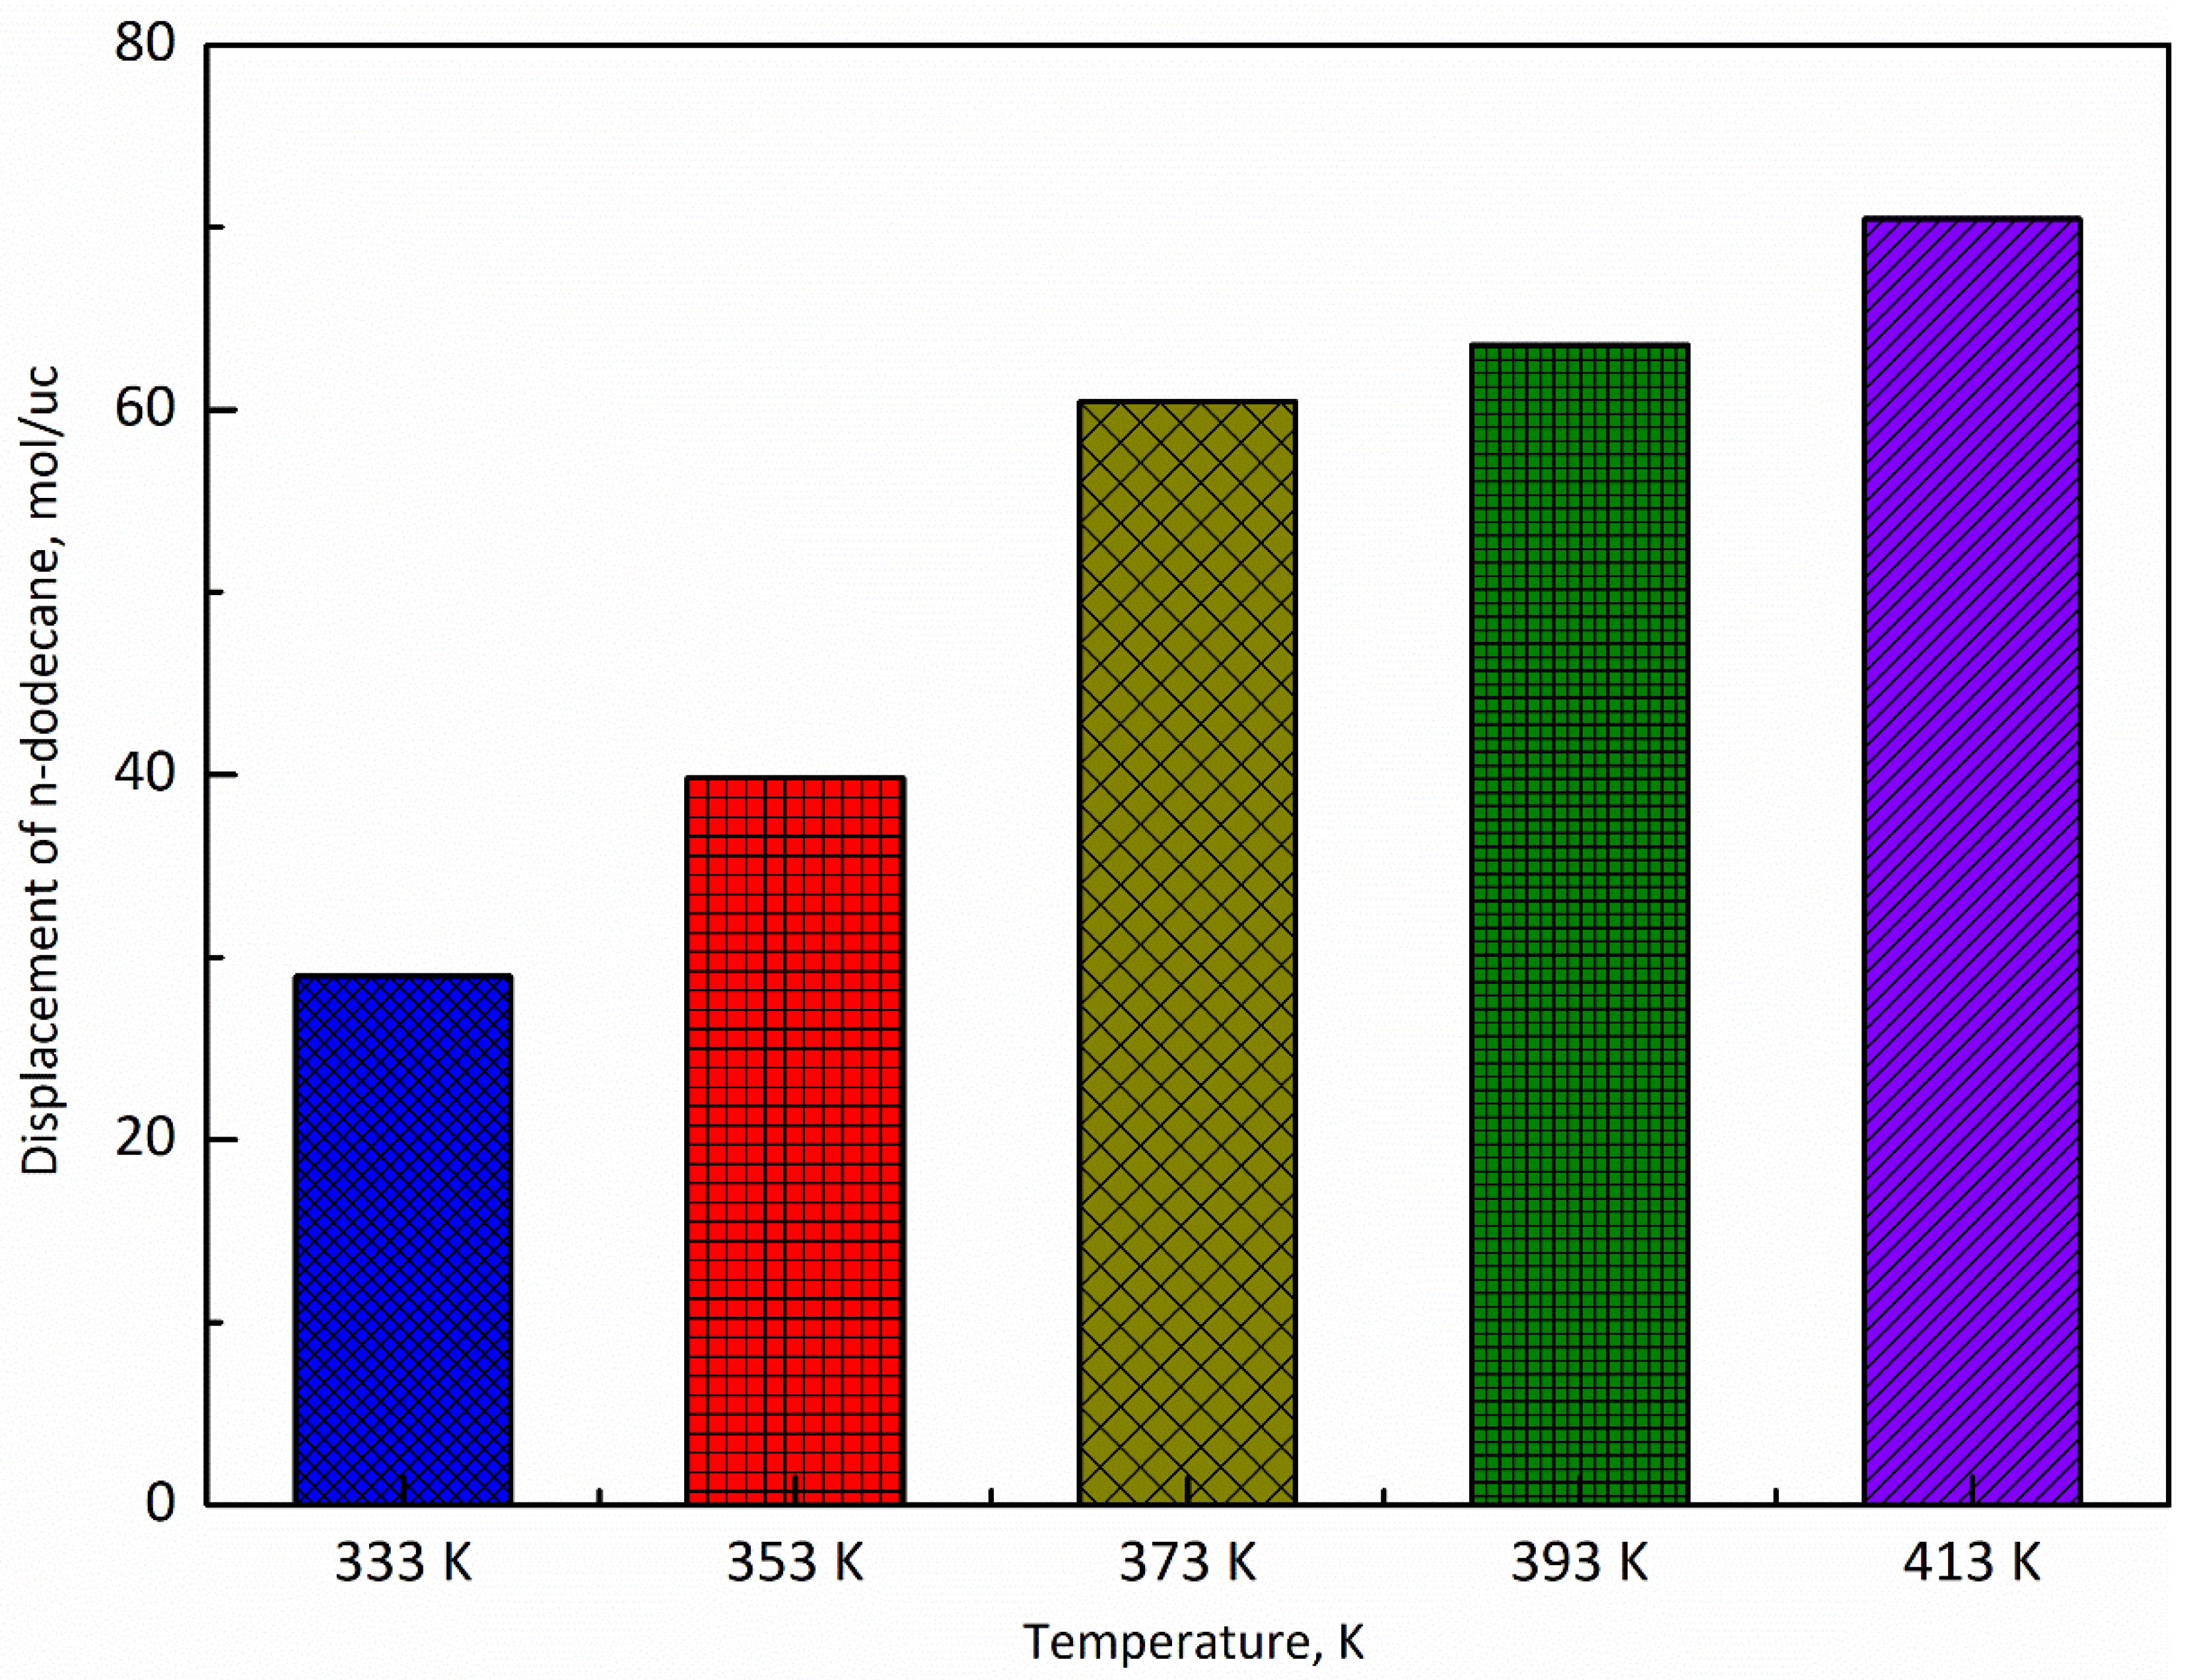
- The adsorption capacity of CO2 is highly sensitive to temperature. The adsorption capacity of CO2 increases first and then decreases with the increase of the temperature and the highest adsorption capacity appeared at the temperature of 393 K, while the displacement capacity of n-dodecane increases with the increase of temperature. Overall, higher temperature is more favorable for the displacement of shale oil by CO2.
Author Contributions
Funding
Data Availability Statement
Conflicts of Interest
Abbreviations
| MD | molecular dynamics |
| NVT | isochoric-isothermal ensemble |
| CNT | carbon nanotube |
| GCMC | Grand Canonical Monte Carlo |
References
- Zhang, L.; Bao, Y.; Li, J.; Li, Z.; Zhu, R.; Zhang, J. Movability of lacustrine shale oil: A case study of Dongying Sag, Jiyang Depression, Bohai Bay Basin. Pet. Explor. Dev. 2014, 41, 703–711. [Google Scholar] [CrossRef]
- Al-Mudhafar, W.J. Polynomial and nonparametric regressions for efficient predictive proxy metamodeling: Application through the CO2-EOR in shale oil reservoirs. J. Nat. Gas Sci. Eng. 2019, 72, 103038. [Google Scholar] [CrossRef]
- Yang, Z.; Bryant, S.; Dong, M. A method of determining adsorptive-gas permeability in shale cores with considering effect of dynamic adsorption on flow. Fuel 2020, 268, 117340. [Google Scholar] [CrossRef]
- Wei, M.; Zhang, L.; Xiong, Y.; Li, J. Nanopore structure characterization for organic-rich shale using the non-local-density functional theory by a combination of N2 and CO2 adsorption. Microporous Mesoporous Mater. 2016, 227, 88–94. [Google Scholar] [CrossRef]
- Pang, Y.; Soliman, M.Y.; Deng, H.; Xie, X. Experimental and analytical investigation of adsorption effects on shale gas transport in organic nanopores. Fuel 2017, 199, 272–288. [Google Scholar] [CrossRef]
- Wang, S.; Feng, Q.H.; Javadpou, F.; Xia, T.; Li, Z. Oil adsorption in shale nanopores and its effect on recoverable oil-in-place. Int. J. Coal Geol. 2015, 147–148, 9–24. [Google Scholar] [CrossRef]
- Wang, X.; Zhai, Z.; Jin, X.; Wu, S.; Li, J.; Sun, L.; Liu, X. Molecular simulation of CO2/CH4 competitive adsorption in organic matter pores in shale under certain geological conditions. Pet. Explor. Dev. 2016, 43, 841–848. [Google Scholar] [CrossRef]
- Hazra, B.; Wood, D.A.; Vishal, V.; Varma, A.K.; Sakha, D.; Singh, A.K. Porosity controls and fractal disposition of organic-rich Permian shales using low-pressure adsorption techniques. Fuel 2018, 220, 837–848. [Google Scholar] [CrossRef]
- Memon, S.; Feng, R.; Ali, M.; Bhatti, M.A.; Giwelli, A.; Keshavarz, A.; Xie, Q.; Sarmadivaleh, M. Supercritical CO2-Shale interaction induced natural fracture closure: Implications for scCO2 hydraulic fracturing in shales. Fuel 2022, 313, 122682. [Google Scholar] [CrossRef]
- Al-Abri, A.; Hiwa, S.; Robert, A. Experimental investigation of the velocity-dependent relative permeability and sweep efficiency of supercritical CO2 injection into gas condensate reservoirs. J. Nat. Gas Sci. Eng. 2009, 1, 158–164. [Google Scholar] [CrossRef]
- Cao, Z.; Jiang, H.; Zeng, J.; Saibi, H.; Lu, T.; Xie, X.; Zhang, Y.; Zhou, G.; Wu, K.; Guo, J. Nanoscale liquid hydrocarbon adsorption on clay minerals: A molecular dynamics simulation of shale oils. Chem. Eng. J. 2021, 420, 127578. [Google Scholar] [CrossRef]
- Dang, W.; Jiang, S.; Zhang, J.; Li, P.; Nie, H.; Liu, Y.; Li, F.; Sun, J.; Tao, J.; Shan, C.; et al. A systematic experimental and modeling study of water adsorption/desorption behavior in organic-rich shale with different particle sizes. Chem. Eng. J. 2021, 426, 130596. [Google Scholar] [CrossRef]
- Severson, B.L.; Snurr, R.Q. Monte Carlo simulation of n-alkane adsorption isotherms in carbon slit pores. J. Chem. Phys. 2007, 126, 134708. [Google Scholar] [CrossRef] [PubMed]
- Pathak, M.; Pawar, G.; Huang, H.; Deo, M.D. Carbon Dioxide Sequestration and Hydrocarbons Recovery in the Gas Rich Shales: An Insight from the Molecular Dynamics Simulations. In Proceedings of the Carbon Management Technology Conference, Sugar Land, TX, USA, 17–19 November 2015. CMTC-439481-MS. [Google Scholar] [CrossRef]
- Wang, S.; Feng, Q.; Zha, M.; Lu, S.; Qin, Y.; Xia, T.; Zhang, C. Molecular dynamics simulation of liquid alkane occurrence state in pores and slits of shale organic matter. Pet. Explor. Dev. 2015, 42, 844–851. [Google Scholar] [CrossRef]
- Haghshenas, B.; Qanbari, F.; Clarkson, C.R. Simulation of Enhanced Recovery using CO2 in a Liquid-Rich Western Canadian Unconventional Reservoir: Accounting for Reservoir Fluid Adsorption and Compositional Heterogeneity. In Proceedings of the SPE Unconventional Resources Conference, Calgary, AB, Canada, 15–16 February 2017. SPE-185069-MS. [Google Scholar] [CrossRef]
- Liu, Y.; Ma, X.; Li, H.A.; Hou, J. Competitive adsorption behavior of hydrocarbon(s)/CO2 mixtures in a double-nanopore system using molecular simulations. Fuel 2019, 252, 612–621. [Google Scholar] [CrossRef]
- Zhu, C.; Qin, X.; Li, Y.; Gong, H.; Li, Z.; Xu, L.; Dong, M. Adsorption and dissolution behaviors of CO2 and n-alkane mixtures in shale: Effects of the alkane type, shale properties and temperature. Fuel 2019, 253, 1361–1370. [Google Scholar] [CrossRef]
- Tovar, F.D.; Eide, O.; Graue, A.; Schechter, D.S. Experimental Investigation of Enhanced Recovery in Unconventional Liquid Reservoirs using CO2: A Look Ahead to the Future of Unconventional EOR. In Proceedings of the SPE Unconventional Resources Conference, Society of Petroleum Engineers, The Woodlands, TX, USA, 1–3 April 2014. SPE-169022-MS. [Google Scholar] [CrossRef]
- Alharthy, N.; Teklu, T.; Kazemi, H.; Graves, R.; Hawthorne, S.; Braunberger, J.; Kurtoglu, B. Enhanced oil recovery in liquid–rich shale reservoirs: Laboratory to field. SPE Res. Eval. Eng. 2015, 21, 137–159. [Google Scholar] [CrossRef]
- Le, T.; Striolo, A.; Cole, D.R. CO2–C4H10 Mixtures Simulated in Silica Slit Pores: Relation between Structure and Dynamics. J. Phys. Chem. C 2015, 119, 15274–15284. [Google Scholar] [CrossRef]
- Xiong, F.; Rother, G.; Tomasko, D.; Pang, W.; Moortgat, J. On the pressure and temperature dependence of adsorption densities and other thermodynamic properties in gas shales. Chem. Eng. J. 2020, 395, 124989. [Google Scholar] [CrossRef]
- Yang, Y.; Liu, J.; Yao, J.; Kou, J.; Li, Z.; Wu, T.; Zhang, K.; Zhang, L.; Sun, H. Adsorption behaviors of shale oil in kerogen slit by molecular simulation. Chem. Eng. J. 2020, 387, 124054. [Google Scholar] [CrossRef]


| Site | σ/nm | (ε/KB)/K |
|---|---|---|
| CO2 | 0.363 | 242.0 |
| C (CNT) | 0.350 | 35.26 |
| C12H26 | 0.785 | 715 |
Publisher’s Note: MDPI stays neutral with regard to jurisdictional claims in published maps and institutional affiliations. |
© 2022 by the authors. Licensee MDPI, Basel, Switzerland. This article is an open access article distributed under the terms and conditions of the Creative Commons Attribution (CC BY) license (https://creativecommons.org/licenses/by/4.0/).
Share and Cite
Dou, X.; Zhu, P.; Qi, G.; He, Y.; Shao, D.; Qian, K. Microscopic Mechanism for the Displacement of Shale Oil by CO2 in Organic Nanopores. Energies 2022, 15, 7064. https://doi.org/10.3390/en15197064
Dou X, Zhu P, Qi G, He Y, Shao D, Qian K. Microscopic Mechanism for the Displacement of Shale Oil by CO2 in Organic Nanopores. Energies. 2022; 15(19):7064. https://doi.org/10.3390/en15197064
Chicago/Turabian StyleDou, Xiangji, Pengfei Zhu, Guodong Qi, Yanfeng He, Dongdong Shao, and Kun Qian. 2022. "Microscopic Mechanism for the Displacement of Shale Oil by CO2 in Organic Nanopores" Energies 15, no. 19: 7064. https://doi.org/10.3390/en15197064